Article

Exports- and Imports-Led Growth: Evidence from a Time Series Analysis, Case of Jordan

1
Department of Economics, Faculty of Economics and Administrative Sciences, The Hashemite University, Zarqa 13133, Jordan
2
Independent Researcher, Zarqa 13111, Jordan
3
Department of Business Economics, School of Business, University of Jordan, Amman 11942, Jordan
*
Author to whom correspondence should be addressed.
Economies 2023, 11(5), 135; https://doi.org/10.3390/economies11050135
Submission received: 4 March 2023 / Revised: 20 April 2023 / Accepted: 24 April 2023 / Published: 2 May 2023
(This article belongs to the Section Economic Development)

Abstract

:
The purpose of this study is to examine equilibrium relationships and dynamic causality between economic growth (measured as GDP), exports, and imports in Jordan using time-series data between 1976 and 2021. In particular, this research attempts to determine exports-led growth, imports-led growth, growth-led exports, and growth-led imports in both the short-run and long-run. The four time-series datasets, GDP, merchandise exports, merchandise imports, and gross capital formation, were examined using the Dickey–Fuller unit root tests, the Phillips–Perron unit root test, and the Johansen’s trace tests for cointegration. The dynamic properties of the VAR(1) were summarized using Granger causality tests and impulse response functions. The test results showed that the impulse response functions indicated that there might be some short-run relationships among our datasets. The Johansen cointegration tests suggested that the series were not cointegrated, and hence there were no long-term relationships among the time series. It appeared that in the short-run, both GDP and gross capital formation Grangerly caused merchandise exports. A unit shock in merchandise exports, merchandise imports, and gross capital formation caused very small fluctuating responses from GDP, merchandise exports, merchandise imports, and gross capital in the short-run, and the responses approached zero in the long-run.

1. Introduction

Over the centuries, international trade expressed the international economic relations between countries across different world regions based on common interests. The Hashemite Kingdom of Jordan has made concerted efforts in recent years to mitigate the adverse effects of multiple regional crises on national employment and social stability.
In the era of globalization, and within this framework, trade has been at the forefront of policy development to support economic growth and job creation1. After a close inspection, according to the Department of Statistics (DoS)2 data, the volume of total exports3 in 2021 increased by 17.8 percent4 to JOD 6.643 billion, compared with 2020, where it stood at JOD 5.639 billion. Figure 1 reflects the values of exports and imports value in Jordan from 1994 to 2021.
The imbalance between exports and imports in the kingdom started in the early 2000s prior to the global financial crisis of 2008–2009. Imports are almost three times greater than gross exports (SNAP 2014); the negative balance of trade widened after 2009 following the negative external shocks which had affected the Jordanian economy, namely the conflicts in neighboring countries5, which had reduced the exports market; the 2010 Arab Spring, the 2011 Syrian Civil War, and ISIS conflict in Iraq and Syria (van IJzerloo 2016). The cascades of events led to an actual boarders closure with key export markets. Adding to that, the disruption of the energy supplies due to the repeated sabotage of the Arab Gas Pipeline6.
It is plausible to argue that the Hashemite Kingdom of Jordan, the upper-middle-income country8, with a population of 11,148,2789, survived the Arab Spring. The country is considered small but indeed not an unimportant country in the Middle East since it has geopolitical importance described as a stabilizing anchor in this context. It is true that the Jordanian economy is one of the smallest in the Middle East, it is poorly endowed with natural fresh water, oil, and other natural resources yet, it has a rich potash industry not only considered the largest in the MENA region but also competing on the global scale with one of the world’s top ten potash producers10, knowing that it is the only Arab country in the production. Jordan’s top export categories include chemicals11 (potassic fertilizers), packaged medicaments, textiles and knit garments, and mineral products (including potash and phosphates)12,13.
Since April 2000, Jordan has become a member of the World Trade Organization (WTO)14 in a step towards the trade liberalization process. The country has entered the 1998 Association Agreement (AA) with the European Union (EU), as well as the 1998 Greater Arab Free Trade Agreement (GAFTA). It also provides for the trade liberalization in agriculture accompanied by a precise set out including tariff removals along with monetary, administrative, and quantitative Non-Tariff Barriers to trade (NTBs) quotas (Abedini 2008). In 2001, the country entered into a Free Trade Agreement (FTA) with the United States15. In addition to the United States, the European Union and Jordan established a Free Trade Area (FTA)16 liberalizing two-way trade in goods17, which went into effect in 2002. The kingdom is attempting to further develop trade liberalization policies, in exchange; trade reforms emphasized the importance of opening to the rest of the world and the region, whether bilaterally or otherwise (Kardoosh 2019). All in all, trade liberalization is the path to connecting and integrating the economy with the global system, which contributes to the country’s growth and development (Sachs et al. 1995).
Nevertheless, Jordan has been suffering from a trade imbalance, with total annual imports tantamount to more than twice its exports. The issue is partly due to the scarcity of natural recourses, recurring droughts, extreme temperatures, erratic rainfall patterns18, a small manufacturing sector19, and rapid population growth fueled by periodic waves of refugees. As shown in Figure 2, the contribution of exports to GDP started decreasing, where imports of goods and services amounted to 51% of GDP and exports of goods and services 30% of GDP during 2021. Worldwide trade flows decreased significantly in 2020 due to the coronavirus disease (COVID-19).
In light of the Jordanian structural alteration strategy and the economic attributes framework, privatization has been an essential key element since mid-1996. Structural reforms have been implemented by the government to a large extent with the assistance of the International Monetary Fund (IMF). The reforms have aimed at fostering growth by stabilizing the economy (IMF 2004), a success story to be told in this context where macroeconomic policies started to restore the initial stabilization of the Jordanian Dinar based on a peg of the U.S. Dollar. Back then, the policy was endorsed by the Central Bank of Jordan (CBJ) (Mohaddes and Raissi 2011). Regionally speaking, Jordan has transformed its economy into a more open and dynamic system, following the liberalizing of foreign trade, reduction in public debt, and privatizing state-owned enterprises (WTO 2008). The country has taken significant strides to reform not only its economy but also its political and social latitude by increasing the intention towards building a modern economic and political state in parallel with robust growth and prosperity of socioeconomic indicators.
Theoretically speaking, stabilizing the exchange rate was targeted to achieve monetary stability to be able to attract both Arab and foreign investment to the country for the process of liberalizing foreign trade and domestic prices. The Jordanian structural reforms strategy has brought in return a structural modification in terms of more Foreign Direct Investment (FDI) and higher export-led growth. Insofar as the Jordanian reform momentum continues and the regional security environment improves, growth should increase further and make a dent in poverty and unemployment levels within the country since unemployment is the core of poverty. Despite the paradox of stagnant real per capita incomes, the economy doubtless benefited from trade, privatization, and other structural reforms (Ramachandran 2004). However, as shown in Figure 2, the contribution of exports and imports as a percentage of the GDP from 1994 to 2021 in Jordan. Throughout the analyzed period, the ratio of imports to GDP has been greater and continuously increasing compared to the ratio of exports to GDP since 1994. However, the ratio of exports to GDP has experienced a slight downward trend during the periods 2011–2013 and 2014–2017.
Jordan’s export contribution to GDP reached 56% in 2008, which was the largest contribution ever made during the analyzed time series, although the ratio started decreasing afterward and 46% and less. On the other hand, the imports to GDP ratio reached the value of 94% in 2005. In 2021, the contribution of exports to the Jordanian economy was 30.3%, whereas imports made a contribution of 51.13%. Indeed, the contribution of exports in 2021 (30.3%) was lower than the contribution in 1994 (47.86%). If the current trend persists, the Jordanian foreign trade will rely heavily on imports. For that reason, Jordanian case can be presented as a great example for the empirical analysis of the Export-Led Growth (ELG), Growth-Led Export (GLE), Import-Led Growth (ILG), and Growth-Led Import (GLI) hypotheses.
The four hypotheses, namely; ELG, GLE, ILG, and GLI, are considered controversial and indecisive. While there are several competing hypotheses regarding the connection between trade and economic growth, the empirical data supporting or contradicting them is inconsistent and inconclusive. Several studies have yielded either corroborating or contradicting evidence for one or more of these hypotheses. Thus, knowing that the four can offer some insights into the relationship between trade and economic growth in Jordan, the case must be viewed with caution, considering Jordan’s unique economic and social conditions. Moreover, there are several factors that can affect the correlation between economic growth and trade, namely political stability in the region, institutional quality, significant levels of youth unemployment, limited natural resources, and technological advancement. All of these factors can affect, and at the same time, complicate the correlation. Proportionately, Jordan requires a subtle method of formulating policy. Although the hypotheses are considered to be insightful in examining the correlation between economic growth and trade, they cannot be deemed conclusive or universally valid. According to the “Export hypotheses”, the ELG hypothesis, exports promote economic growth. In comparison, the GLE hypothesis implies that exports are a function of economic growth. The other way round for the “Imports hypotheses”, the ILG hypothesis states that imports promote economic growth, while the GLI hypothesis suggests that economic expansion drives imports.
In parallel to previous econometric studies supported by various literature review cases, a holistic approach is important to be followed while studying the four hypotheses from a broader social and economic context. Additionally, interpreting the results shall be examined with caution as interpretation could vary depending on the country/countries studied and the time studied for the case. Therefore, in the literature review, several countries were covered, from the Middle East to Asia, from Europe to Africa, as well as the Americas.
The objective of the study endeavors to discover the main elements that have influenced and reshaped Jordan’s exports and imports, and at the same time, understand the relationship between international trade and economic growth in the kingdom. As previously noted, Jordan joined the WTO as a member in 2000. As a result of Jordan’s accession, various structural and legal changes have been implemented. Jordan is facing a trade imbalance where its annual imports exceed its exports by a factor of more than two, causing economic hardship. Given Jordan’s heavy reliance on imports, it is highly important to examine the influence of trade, particularly exports and imports, on the country’s economic development. Therefore, the Jordanian case offers a valuable case for empirical research into the relationship between exports, imports, and economic growth. This paper will conduct an empirical investigation of the ELG, GLE, ILG, and GLI hypotheses using time-series data.
The novelty of the presented study shows the first instance of empirical research to explore the purpose and, at the same time, examine the relationships and dynamic causality between economic growth (measured as GDP), exports, and imports focusing on Jordan between 1994 and 2021 using the four hypotheses. Chronology of significant economic and political events that occurred during the mentioned years. Starting from the 1994 peace treaty with Israel, passing by the Liberalization and Privatization for the period 1999–2009, 2003 Jordan’s economy was hit by the Iraqi War, the 2009 Global Financial Crisis 2010 Arab Spring, the 2011 Syrian Civil War, and lately, the COVID-19 economic challenge.
The motivation for the research hypothesis stemmed from the disparity in exports and imports growth and the unbalanced rapid growth of imports in Jordan; this paper investigates the causality among GDP, merchandise exports, merchandise imports, and gross capital formation were examined using the Dickey–Fuller unit root tests, the Phillips–Perron unit root test, and the Johansen’s trace tests for cointegration. The dynamic properties of the VAR(1) were summarized using Granger causality tests and impulse response functions. The Johansen cointegration tests suggested that the series were not cointegrated, and hence there were no long-term relationships among the time series. It appeared that in the short-run, both GDP and gross capital formation Grangerly caused merchandise exports.
Overall, the Jordanian government has put into place a number of policies to increase exports and decrease imports, including tax incentives for export-oriented businesses and higher tariffs on some imported goods. To achieve a sustainable trade balance, however, the nation still faces significant obstacles.
This paper contributes to the existing literature in two primary ways; this study focuses on an upper-middle-income country experiencing several economic growth activities, and from a geopolitical perspective, the country has built up a reputation as an anchor of stability in the Middle East; the center of what so-called a volatile world. Moreover, the data examined in the analyses used tangible commodities referred to as merchandise exports (X) and merchandise imports (M) imports rather than using the total imports of goods and services in the analysis.
The rest of the paper is structured as follows. Section 2 offers a survey of the related economic literature, while Section 3 outlines the data and the empirical research methodology utilized. Finally, Section 4 provides concluding remarks and test results.

2. Literature Review

The link between economic growth and trade has been debated extensively for more than two centuries; the relationship has been investigated using both frameworks, theoretical and empirical. However, controversy still persists regarding the actual effects. The nexus between trade and economic growth has often been supported by the premise that an improvement in economic growth in return can be caused by an increase in trade liberalization policies in the globalized modern world (Stallings 2001; Syal 2007; IMF 2001; Edwards 1993). Trade liberalization has been interpreted in a wide range of ways in the previous economic literature. It has also been argued by the World Bank that “countries openness to international trade have created opportunities to innovate, increase growth potential of the economy, reduce poverty, create jobs, and improve productivity locally and globally through out economic integration and Global Value Chains (GVCs)21”. The economic effects of trade liberalization have often been studied in the literature, and there are varied results and arguments (Ju et al. 2010; Winters et al. 2004).
Previous research has documented that countries that are more open to the remainder of the world grow in a faster rhythm than closed economies (Edwards 1998). It was argued that economic growth could be generated by the reallocation (Melitz 2003) of the available/existing resources and not exclusively via an increase in the aggregate levels of capital and labor; let it be a shift towards the higher productivity export sector from the efficient non-export sector (Islam et al. 2012; Rani and Kumar 2018). Moreover, some evidence indicated that financial openness is frequently linked to greater economic growth (Bekaert et al. 2011; Fratzscher and Bussiere 2004; Quinn et al. 2011). In a similar way, there is a correlation between economic expansion and trade; increased foreign currency reserves, better utilization due to resource allocation, and increased efficiency due to the domestic output increase; by way of illustration, trade promotes economic growth (Awokuse 2007). It is not new and previously argued that exports play a role in economic growth; going back to the father of economics, Adam Smith, with his classical economic theories, as well as David Ricardo in 1817, with his theories in comparative advantage and international trade playing an important role in economic growth. The neoclassical approach identifies the importance of competitive advantages in international trade; based on a market base view. Countries tend to maximize their welfare through certain economic activities, which are considered to be the most efficient regarding both resource and factors of production during the existence of economic scarcity; it is more likely from a behavioral economic approach (Abu Shihab et al. 2014). The Export-Led Growth (ELG) hypothesis postulates that exports are the key determinant of overall economic growth (Feder 1983; Medina-Smith 2001). One of the main supportive arguments for this hypothesis is the dynamic spillover effect on the economy; in other words, export growth may influence the Total Factor Productivity (TFP)22. Based on the production function framework, empirical studies have included exports due to the spillover effect. According to Coe and Helpman (1995), investing in a country’s R&D affects the TFP of its trade partners. In a nutshell, it is called “learning by doing”, or to be more precise, it is considered “learning by exporting” (Tyler 1981; Lucas 1988); in all countries, exporters are more productive than non-exporters (Clerides et al. 1998). From an intercountry cross-section empirical analysis implemented for 55 developing countries with middle-income during the period 1960–1977, a relationship was found between export expansion and economic growth. Furthermore, there was a considerable positive association after conducting the bivariate tests between economic expansion and other factors/variables, including gross exports, manufacturing exports, investment, and manufacturing output growth (Tyler 1981). A production function model23 was also specified and estimated with the cross-sectional data. Results have shown that in explaining intercountry variance in GDP growth rates, all the following factors were important, starting with export performance all the way to capital formation. In conclusion, an increase in manufacturing exports leads as a result to technological advancements, which in return will increase economic development; let it be the growth in the size of the workforce/labor and/or the growth in productivity. Exports have been seen as the new paradigm (Debbarmaa et al. 2022).
In development economics literature, a major focus has been drawn toward the role of trade policies in increasing both efficiency and growth. However, this varies significantly across countries. A study has analyzed the data on sectoral TFP of four different countries, namely, Japan, Korea, Turkey, and Yugoslavia. It demonstrated the effects of various development strategies on the TFP growth in the manufacturing industries by examining the influence of different strategies, particularly export expansion and import substitution trade policies. The results indicated that TFP growth is hampered by imports growth, keeping in mind that there is a link between industrial productivity and trade policies performance. On the other hand, export growth elevates TFP by increasing the axiom functionality and economies of scale (Nishimizu and Robinson 1984).
Moreover, the thriving exports sector benefits the country in several ways; the role of technological innovation as a source of economic growth can lead to higher productivity, increased capacity utilization and decreased costs per unit, efficient resource allocation, and economies of scale (Helpman and Krugman 1987). If this trend continues with thriving exports, in this context, inclusive growth can be translated by creating employment opportunities (Hausmann et al. 2019; Warred 2014). In general, developing countries that have participated in international trade tend to make rapid progress in poverty alleviation and job creation (UNDP 2013).
The empirical analysis for the following hypotheses: The Export-Led Growth (ELG), Growth-Led Export (GLE), Import-Led Growth (ILG), and Growth-Led Import (GLI), are supported by literature review on trade and economic growth, which creates verifiable evidence using scientific methods for interpretation. To start with the first hypothesis, the ELG, also expressed as exports’ role in economic growth in the majority of empirical research. The ELG hypothesis is described as a development strategy that is concentrated on foreign exports and aims at the same time to foster productive capacity, which is lined up with economic growth (Medina-Smith 2001). This hypothesis involves promoting exports and acquiring foreign currency reserves by adopting certain policies; with this approach, importing high-tech goods and services can be in favor of economic growth. Exports are considered a tool for the long-run to economies of scale; exports drive economic growth in the domestic market through the use of more technology and skilled labor (Bhagwati 1988, 1989). This process leads to improved efficiency and productivity in the economy.
Noteworthy that ELG economic research is not exclusively limited to developing economies; it is rather for all countries across the continents. This part is divided into seven categories, starting with developing countries: Balassa (1978) studied 11 developing countries that have an industrial base, Kavoussi (1984) examined 73 developing countries where export growth is correlated with better economic performance, and that has a favorable impact on total factor productivity. Love and Chandra (2005) paper tested the ELG hypothesis for South Asia in a sample consisting of the large country India, as well as medium to small countries; Pakistan, Bangladesh, Sri Lanka, Nepal, Bhutan, and the Maldives, however; the findings of this study were mixed. Another study tested five different countries, namely India, Pakistan, the Philippines, Malaysia, and Thailand; empirical results have shown that exports have a profoundly positive effect on economic growth (Vohra 2001).
The following studies have been conducted on developed countries; Awokuse (2006) studied the connection between Japan’s real exports and GDP growth; output was bi-directional. Kónya (2006) investigated 24 OECD24 countries; results have shown three different interpretations; a two-way correlation between growth and exports, one-way causality from exports to GDP, and one-way causality from GDP to exports. Jin and Yu (1996) tested the ELG hypothesis for the US economy; results indicated that there are no significant causal impacts between exports and output. Shan and Sun (1999) tested the US economy using quarterly time series data using the developed method “Toda-Yamamoto (TY) Causality”; the Granger no-causality procedure and results have shown a two-way Granger causality between output and exports.
As for the Gulf region, Al-Yousif (1997) paper investigated four Arab Gulf countries, namely, Saudi Arabia, Kuwait, UAE, and Oman; the data estimates have indicated a significant positive correlation between economic growth and exports. Other studies were dedicated to Africa; (Ahmad and Kwan 1991; Foster 2006). CEECs case studied by Hagemejer and Mućk (2019). South America, including Mexico (Siliverstovs and Herzer 2006; Arteaga et al. 2020; Thornton 1996). Lastly, newly industrialized Asian (Ghatak et al. 1997; Kwan et al. 1999; Dhawan and Biswal 1999; Khalafalla and Webb 2001; Awokuse 2005; Siliverstovs and Herzer 2006). Correspondingly, the relationship between trade and economic expansion is still being studied and is considered to be an ongoing research topic (Were 2015).
A number of studies documented weak, no, or mixed support for the ELG hypothesis. Starting with (Jung and Marshall 1985), the Granger Causality test was used in this study to examine the relationship between economic growth and exports in 37 developing countries; results have shown uncertainty on the validity of the hypothesis and, therefore, weak support for the hypothesis. Dreger and Herzer (2013) examined 45 developing countries in the long-run and the short-run; results have shown that there is no significant association; therefore, this has reflected weak evidence for the ELG hypothesis. Darrat (1986) tested five countries, namely, Hong Kong, South Korea, Singapore, and Taiwan. Empirical results did not support the ELG hypothesis based on the Granger Causality test. Comparably, Oxley (1993) utilized data on Portugal, and the ELG was rejected, giving support to the reverse causality; therefore, no supportive evidence was found. Khemka et al. (2018) examined whether the ELG hypothesis is valid for India, and the results found no support. Mazumdar (2001) found evidence in developing countries and argued that imported machinery leads to higher growth.
Despite the previous arguments, many researchers have discovered evidence that supports the ELG hypothesis, linking exports to economic growth. For example, Balassa (1978) found a supportive argument for the ELG hypothesis. Fajana (1979) analyzed the impact of trade on Nigeria’s economic growth, and the results provided empirical support for the ELG hypothesis; also, it concluded that exports play an important role in economic growth. Onafowora et al. (1996) investigated using data from 12 Sub-Saharan African (SSA) countries, results suggested that it is possible to stimulate economic growth, and it supports the ELG hypothesis. Al-Yousif (1997) investigated the relationship between exports and economic growth for four Arab Gulf countries, namely, Saudi Arabia, Kuwait, UAE, and Oman; results found a significant positive association. Islam (1998) examined the relationship between exports and growth over a-15 year period in 15 Asian countries, results found consistent with the ELG hypothesis, and cointegration existed between exports and growth in five countries out of fifteen. Bahmani-Oskooee and Oyolola (2007) examined the data using 44 developing countries, and the results found evidence that supports the ELG hypothesis in 60% of the countries. Narayan et al. (2007) the authors examined the ELG hypothesis for Fiji and Papua New Guinea, and the discovered evidence supported the ELG in the long-run for the case of Fiji, while for Papua New Guinea, the was evidence only in the short-run for ELG. Rani and Kumar (2018) investigated the case of BRICS25; results indicated a long-run relationship among the competing variables, namely, exports, imports, gross capital formation, and economic growth.
Hagemejer and Mućk (2019) studied the case of CEECs; results documented that exports substantially boosted economic development. Arteaga et al. (2020) discovered that an increase in exports to China boosted the economic expansion of South American nations. Another study examined the nexus between export expansion and economic development in China from 1979 to 2001 using the error correction model; results showed that the variables had a bidirectional causal relationship (Mah 2005). Hye and Boubaker (2011) investigated ELG and ILG for the period 1960–2008 in Tunisia using the ARDL technique, outcomes indicated that both ELG and ILG are valid and at the same time, a bidirectional association existed between both exports and imports. Awokuse (2007) examined the effects of both export and import expansion on economic growth for three transition economies; Bulgaria, the Czech Republic, and Poland. Empirical results indicated that both ELG and GLE are valid for the case of Bulgaria, ELG and ILG hypotheses were valid for the case of the Czech Republic, and the ILG hypothesis was valid for the case of Poland; overall, it has been proved that international trade promotes economic expansion. However, another study by the same author the next year, Awokuse (2008), examined the nexus between economic growth and trade in 3 Latin American countries with hand on both exports and imports. Empirical findings indicated mixed results for the ELG, ILG, and GLE hypotheses.
South Korea and Japan cases were taken into account in Zang and Baimbridge (2012) research; the authors tested using the VAR model the causality between exports, imports, and economic growth. Empirical evidence indicated that for both East Asian countries, a bidirectional causality existed between economic expansion and imports, and the ELG hypothesis was valid for the case of Japan; however, in South Korea, economic growth had a negative impact on export growth. Mahadevan and Suardi (2008) examined the uncertainty of both ILG and ELG hypotheses for the case of Japan and the Four Asian Tigers; results have found evidence for the ILG hypothesis in Japan, no evidence of a cointegrating causal link between Korea’s economic growth and trade. Furthermore, Hong Kong’s economic growth supported both ELG and ILG hypotheses. Panta et al. (2022) examined the case of Nepal to understand the causal relationship between economic growth, exports, and imports. Their research indicated that in the long and short-run, there is no relationship supporting both ELG and GLE hypotheses, whereas evidences was found supporting ILG in the short-run and GLI in the long-run. Hye et al. (2013) examined ELG, ILG, GLE, and GLI hypotheses in six South Asian countries, results have shown that the ELG hypothesis was irrelevant to all countries except the case of Pakistan, whereas the ILG hypothesis was relevant to all six South Asian countries. The GLE hypothesis was relevant to all nations, barring Bangladesh and Nepal. The GLI model and export–import model are pertinent to all six countries. Ahmad and Harnhirun (1995) examined the ASEAN countries to investigate the nexus between economic growth and exports between 1967 and 1988; results found evidence supporting the GLE hypothesis for Singapore, Malaysia, the Philippines, and Indonesia.
Kristjanpoller and Olson (2014) ELG, GLE, and ILG hypotheses were examined using data from Latin American nations, empirical results were mixed, and in conclusion, a negative correlation existed between both impacts of exports and imports on GDP growth, to put it differently, and theoretically speaking, ILG and ELG hypotheses do not coexist. Hanson (1982) presented a performance assessment for three economies in the 1970s, namely the Soviet Union, Poland, and Hungary. The author examined the ILG hypothesis and suggested that infrastructure expansion and the importation of Western capital goods can promote economic growth. Mishra et al. (2010) examined ELG and ILG hypotheses for five Pacific Island countries during the period 1982–2004; results have found a find bidirectional Granger causality between the following variables, both exports and imports, export and economic growth, as well as import and economic growth. In Reppas and Christopoulos (2005), between 1969 and 1999, 22 less-developed African and Asian nations were examined to understand the nexus between exports and the growth of output, and evidence was found supporting the GLE hypothesis. Additionally, the study suggested that output growth causes exports but not vice versa. Lawrence and Weinstein (1999) controlled in their research the R&D spending and the degree of industry concentration; consequently, the authors concluded that for both developing and developed countries, a greater import proportion in domestic consumption is correlated with a statistically significant positive effect on subsequent TFP growth.
In conclusion, and with the previous findings, the four hypotheses, namely; ELG, GLE, ILG, and GLI, are considered controversial and indecisive. Results varied; some found robust evidence for GLE and ILG, while other research documented a little support for ELG and GLI. Accordingly, some can be misleading or even give spurious results if a certain variable is excluded from the empirical analysis. For that reason, the dynamic causality between economic expansion, exports, and imports will be presented in this research paper for the case of Jordan.

3. Data and Methodology

3.1. Data

The study utilized yearly time-series data for Jordan from 1976 to 2021. The data were obtained from the World Bank and the Jordanian Department of Statistics (DoS). The study variables included gross domestic product (GDP), merchandise exports, merchandise imports, and gross capital formation, all measured in the United States dollar (USD). Following the guidance of Hye et al. (2013), this study considered GDP as the response variable (serving as a proxy for economic growth (G)) and merchandise exports (X) and merchandise imports (M) as the explanatory variables. Gross capital formation (C), serving as a proxy for capital, was also included in the analysis to ensure the analysis results were not biased due to omitted variables (Dodaro 1993).
All variables were converted to real value using the GDP deflator, i.e., real value = nominal value/(GDP deflator/100). Furthermore, all variables were transformed into natural logarithmic scales before the empirical analysis as per the suggestions of Bahmani-Oskooee and Economidou (2009) and Hye et al. (2013).

3.2. Methodology

Figure 1 graphically presents the GDP, exports, and imports (all in real values) of Jordan from 1976 to 2021. A close-up analysis of Figure 1 shows that there was an upward trend for all three series, with GDP increasing rapidly, imports increasing moderately, and exports increasing slowly after 2004. Jordan’s foreign trade has been dominated by imports, with the imbalance between exports and imports starting to expand after 2004, leading to Jordan’s large trade deficit. In the past two decades, though slowly increasing, exports of Jordan have been stagnant. Jordan’s imports exploded between 2004 to 2014, experienced a downward trend between 2014 to 2020, and eventually increased from 2020 to 2021. As a result, Figure 1: GDP, exports, and imports of Jordan.
Figure 2 presents Jordan’s exports and imports as percentages of GDP from 1976 to 2021. The ratios of imports to GDP increased from 1976 (58%) to 1981 (72%), decreased from 1981 (72%) to 1986 (38%), and then increased since and stayed around 50% between 1986 and 2004. The ratios of imports to GDP experienced an upward trend starting in 2014 and reached a record high of 80% in 2007, and then started to exhibit a downward trend, with the 2021 ratio of imports to GDP equal to 48%.
The ratios of exports to GDP stayed between 10 and 17% between 1976 and 1988, experienced a sudden increase in 1989 (26%), and stayed stable for around 10 years (1989–2000). The ratios of exports to GDP slowly increased from 2000 (22%) and reached a record high of 35% in 2008. Percentages of exports to GDP experienced a downward trend after 2008. The 2021 ratio of exports to GDP equals 21%.
Before modeling the relationships and dynamic causality between economic growth (measured as GDP), exports, and imports in Jordan, the time-series properties of the data were first examined.
Table 1 reflects the assessment of stationarity. To test further if there was a unit root in the four time series, augmented Dickey–Fuller unit root tests and Phillips–Perron unit root tests for up to 3 lagged differences were utilized (Table 2). In the levels of the time series, the p-values of the tau test statistics for the ADF and PP tests were greater than 0.05, and hence the null hypothesis (the series is nonstationary, i.e., there is a unit root) was not rejected at the 5% level, implying the time series were nonstationary in their levels. In the first differences of the time series, the p-values of the tau test statistics for the ADF and PP tests were less than 0.05, and hence the null hypothesis was rejected at the 5% level, implying the time series were stationary in their first differences. In other words, the time series of the study were integrated into order 1 or I(1).
If the nonstationary data become stationary at the first differencing, then there is a high probability that there is a cointegration relationship (long-term relationship) among the variables.
To determine if there was a cointegration relationship among the study variables, Johansen’s trace tests for cointegration were performed (Table 3). The trace test tests the hypothesis that there, are at most, r cointegration vectors. If the value of the trace statistic is greater than the critical value (i.e., p < 0.05), then we conclude that there is a cointegration relation among the variables at rank r. For all 4 hypotheses (r = 0, 1, 2, and 3), the p-values were greater than 0.05. Hence, we concluded that there was no cointegration relationship among the four time series. Since the 4 time series were not cointegrated, it was concluded that there was no long-term or equilibrium relationship among GDP, merchandise exports, merchandise imports, and gross capital formation. Further details on the univariate model white noise diagnostics are explained in Appendix A.
As the series were stationary at I(1) and cointegrating relations were not present in the system of variables, a four-variable vector autoregressive (VAR) model with k lags (Sims 1980) was conducted to model the first differences of the variables and systematically capture the dynamics in the time series. Based on information criteria such as AIC, AICC, FPEC, HQC, and BIC (Table 4), a four-variable VAR model with 1 lag (VAR(1)) was conducted to systematically capture the dynamics in the four time series, GDP, merchandise exports, merchandise imports, and gross capital formation.
According to the parameter estimates of the VAR(1) (Table 4), the 4 univariate regression equations systematically capturing the dynamics in economic growth (i.e., GDP), merchandise exports, merchandise imports, and gross capital formation can be written as:
Δ G t = 0.0135 + 0.5571 Δ G t 1 0.1237 Δ X t 1 + 0.1797 Δ M t 1 0.1594 Δ C t 1 + v t G ,   Δ G t = 0.0260 + 0.4671 Δ G t 1 0.0057 Δ X t 1 0.0717 Δ M t 1 + 0.1361 Δ C t 1 + v t G ,   Δ G t = 0.0062 + 0.1806 Δ G t 1 + 0.2570 Δ X t 1 0.2003 Δ M t 1 + 0.1845 Δ C t 1 + v t G ,   Δ G t = 0.0061 + 0.4197 Δ G t 1 + 0.1693 Δ X t 1 0.2439 Δ M t 1 + 0.0524 Δ C t 1 + v t G ,  
It appeared that economic growth (i.e., GDP) was statistically significantly positively associated with lagged 1 economic growth (β = 0.5571, p = 0.0035) and not associated with lagged merchandise exports, merchandise imports, and gross capital formation. Merchandise exports were statistically significantly positively associated with lagged 1 GDP (β = 0.4671, p = 0.0461) and not associated with lagged merchandise exports, merchandise imports, and gross capital formation. Merchandise imports and gross capital formation were both not statistically significantly associated with lagged GDP, merchandise exports, merchandise imports, and gross capital formation.
Granger causality tests (Table 5), and impulse response functions were used to further examine the causality of the short-run relationships among the variables. It appeared that in the short-run, GDP Grangerly caused merchandise exports (χ2(1) = 9.32, p = 0.0023), and gross capital formation Grangerly caused merchandise exports (χ2(1) = 5.17, p = 0.0230) (Table 5).
The simple impulse response functions (Lütkepohl 1993) were used to quantify the impulse responses to shocks from one of the variables (GDP, exports, imports, and gross capital formation (after taking the logarithm and first differencing)) over a 30-year period Figure 3. A unit shock in GDP caused positive responses from GDP, exports, and gross capital formation in the short-run (within 5 years), and the responses approached zero in the long-run. Similarly, a unit shock in exports, imports, and gross capital formation caused fluctuated responses from GDP, exports, and gross capital formation in the short-run (within 5 years), and the responses approached zero in the long-run.
The economic significance of the results obtained sheds light on one of the most crucial factors is the requirement to boost exports and lessen Jordan’s reliance on imports. This can be accomplished by implementing policies that encourage the growth of local industries focused on exports, such as offering tax incentives and lowering trade-related bureaucratic barriers. R&D can help industries to thrive; this can be implemented by providing subsidies or grants for research that could create a favorable regulatory environment.

4. Conclusions

Using time series data for the period of 1976 to 2021, the study found that there was no long-term or equilibrium relationship among GDP, merchandise exports, merchandise imports, and gross capital formation in Jordan. After first differencing the time series, a four-variable VAR model with one lag was conducted to examine the short-run relationship among the GDP, merchandise exports, merchandise imports, and gross capital formation in Jordan from 1976 to 2021. The dynamic properties of the VAR(1) were summarized using Granger causality tests and impulse response functions. Based on the results of Granger causality tests, in the short-run, both GDP and gross capital formation Grangerly caused merchandise exports. The results of impulse response functions indicated that there might be some short-run relationships among GDP, merchandise exports, merchandise imports, and gross capital formation in Jordan for the period 1976 to 2021.
The fact that Jordan imports a significant portion of its needs helped drive up the inflation in the country and, at the same time, affected interest rate levels. This is rather a problem within the structure of the Jordanian economy; the country’s BOT is negative, and that illustrates the importance of imports for the economic growth process when food and oil are being imported. Noteworthy, the global situation of international trade and fuel prices and other global political conflicts can affect commodity prices. In parallel, the unemployment rate is persisting. The Jordanian case can be paired in the context of other developing nations by saying that it is relying heavily on imports.
Several implications for economic policy flow from Jordan’s import-export-driven growth case study. The findings of our study could be significant for policymakers at the national level who are seeking to create macroeconomic and trade policies that can achieve a sustainable balance between exports and imports over the long-term.
R&D can help in establishing several partnerships with international companies and organizations. However, it is crucial for the government in the aspect of economic policymaking to evaluate both the potential advantages and disadvantages of foreign investment and technology transfer thoroughly, taking into account the possible risks and benefits involved. This will ensure that the policies will be designed to minimize any potential risk to local businesses, and at the same time, maximize and enhance the positive impact. On the other hand, Technology transfer can help local businesses adopt new, more efficient production methods and techniques; simultaneously, new products can be developed and compete in the global market. Technology transfer can help in the development process of the local capabilities of R&D; it could be the case of sharing new ideas, technologies, or innovations between local and international businesses. This can foster the development of a sustainable innovation ecosystem in the country. As a result, trade development can help to stimulate economic growth by increasing revenue, creating jobs, and boosting investment.
Investors may be able to provide access to new markets on a global scale, distribution channels, key accounts, and supply chains that can assist local businesses in growing their clientele and exports. Foreign investors will be attracted by the conducive local business environment that plays a role in increasing opportunities for collaboration with international partners. Expanding trade opportunities can help diversify the local economy to enhance its resilience to external shocks and changes in global demand for specific products. With the aim of building an economic resilience, preserving macroeconomic stability, and reducing the impact of external shocks will help in the process. Trade expansion plays a crucial role in Jordan’s economic development, and through improved competitiveness, Jordan can enhance its productivity in the global market along with improving the efficiency and quality of its goods and services. Additionally, diversification is key; the Jordanian economy heavily depends on a handful of primary export industries, including pharmaceuticals, textiles, and clothing. All in all, expanding trade opportunities can potentially lead to creating new job opportunities in export-oriented industries, which can lead to a reduction in unemployment and a boost in disposable income.
The study has certain limitations: the research article does not explore the four hypotheses at a sectoral economical level. Correspondingly, the research is purely based on data from Jordan. Hence, future research can contribute to the existing literature on the relationship between trade and economic growth by studying the role of trade using a panel data set from various countries that share similar characteristics, including major economic sectors. Into the bargain, several structural breaks can be examined to understand the magnitude whereas this could be giving some insights to understand the problem of each specific case at a certain year/period of time.

Author Contributions

Resources, F.N.; Validation, N.S.; Writing—review & editing, R.I. All authors have read and agreed to the published version of the manuscript.

Funding

This research received no external funding.

Informed Consent Statement

Not applicable.

Data Availability Statement

The authors primarily used the World Development Indicators (WDI) data which is publicly available through the World Bank as well as the Jordanian Department of Statistics data.

Conflicts of Interest

The authors declare no conflict of interest.

Appendix A

Durbin–Watson test statistics were used to test the null hypothesis that the residuals were uncorrelated (Brooks 2014). The Durbin–Watson test statistics were around 2 (Table A1), indicating that the residuals for the VAR were uncorrelated. The Jarque–Bera normality test statistics (Jarque and Bera 1980) and quantile-quantile (QQ) plots (Wilk and Gnanadesikan 1968) were used to determine if the residuals were normally distributed. The results of the Jarque–Bera normality tests suggested that the residuals may be normally distributed for the models of imports and gross capital formation (p > 0.05) but may not be normally distributed for the models of GDP and exports (p < 0.05) (Table A1). However, the QQ plots (Figure A1) indicated that the residuals might be normally distributed as most of the data points in the QQ plots were close to the 45-degree straight line. Thus, as Jarque–Bera normality tests may be conservative, we concluded that the residuals were normally distributed based on the results of the QQ plots. The F statistics and their p-values for autoregressive conditional heteroskedasticity (ARCH), a method that explicitly models the change in variance over time in a time series, were used to test the null hypothesis that the residuals have equal covariances (Engle 2001). As the p-values of the F statistics for autoregressive conditional heteroskedasticity were greater than 0.05 (Table A1), we concluded that the residuals have equal covariances.
Table A1. Univariate model white noise diagnostics.
Durbin–WatsonJarque–Bera
Normality Test
ARCH
Model χ2pFp
Δ G t 1.85196.070.04810.100.7507
Δ X t 1.91599.000.01110.960.3326
Δ M t 1.87591.690.42870.020.8920
Δ C t 1.99403.070.21570.390.5367
Figure A1. QQ plots for models for GDP, merchandise exports, merchandise imports, and gross capital formation (from left to right).
Economies 11 00135 g0a1

Notes

1
More Trade for More Jobs Identifying the Employment Potential of Jordan’s Exports, International Labour Organization, Amman Office, Jordan, 2019.
2
Department of Statistics Interactive Database: External Trade Functions 1994–2021, by Kind of Trade, Unit, Commodity Groups and Time. Detailed information is also available in Jordan’s Trade and Investment Information System (JTIIS), which is hosted on the DOS website.
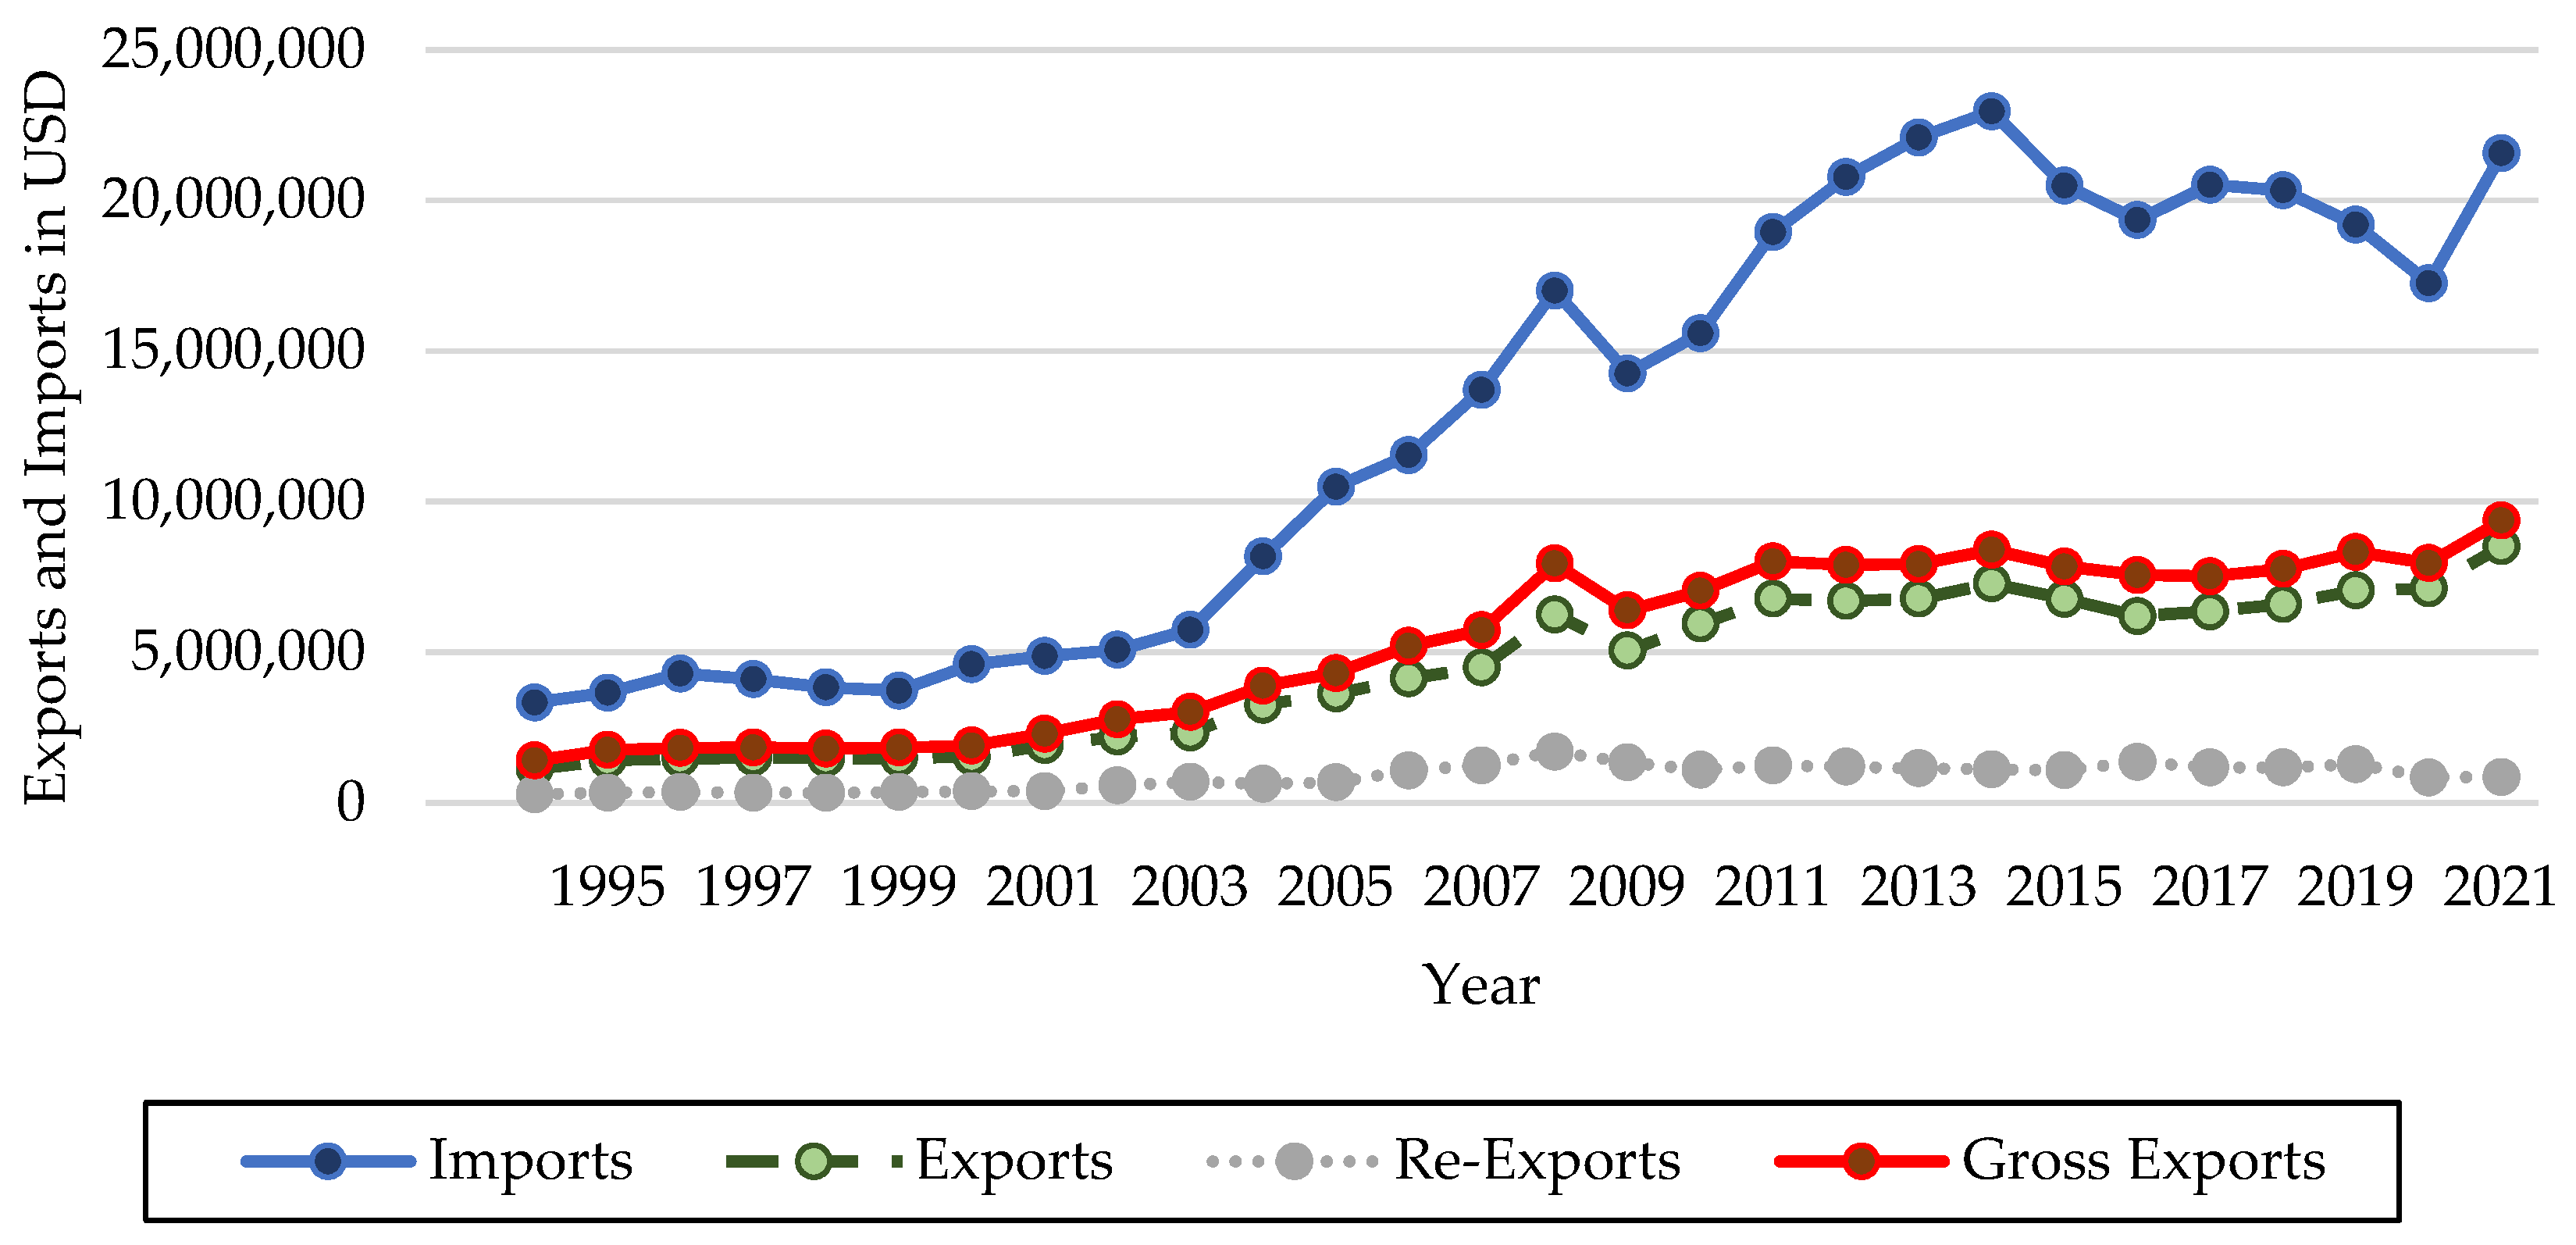
3
Gross Exports is the sum or Exports and Re-exports. The data are compiled in broad conformity with international practice and in accordance with definitions recommended by the United Nations for foreign trade statistics, specifically in accordance with the International Merchandise Trade Statistics.
4
(6.643 − 5.639)/5.639 × 100.
5
A Roadmap for Investment Promotion and Export Diversification: The Case of Jordan. Center for International Development at Harvard University (CID) Faculty—Working Paper Series: 374 (Hausmann et al. 2019).
6
Report by Mojahed Elsagheer from the Jordanian Ministry of Planning and International Cooperation, “Energy Situation in Jordan”, July 2013.
7
All exports and imports values are in USD.
8
World Bank list of economies, URL: https://data.worldbank.org/?locations=JO-XT | World Food Programme (WFP) Jordan Country Brief Published in May 2022 (accessed on 16 January 2023).
9
Population, total—Jordan. The World Bank Data, URL: https://data.worldbank.org/indicator/SP.POP.TOTL?locations=JO.
10
Ministry of Energy and Mineral Resources—Performance of Jordanian Mining Sector During 2014–2018, published in 2020.
11
The Observatory of Economic Complexity (OEC), Historical exports data (accessed on 14 December 2022).
12
Jordan—Country Commercial Guide, Market Overview by the International Trade Administration (ITA), December 2022.
13
Jordan’s Product Space, Part On, January 2017—The Jordan Strategy Forum (JSF).
14
Jordan and the WTO, URL: https://www.wto.org/english/thewto_e/countries_e/jordan_e.htm (accessed on 10 December 2022).
15
Jordan Free Trade Agreement, United States Trade Representative (USTR). URL: https://ustr.gov/trade-agreements/free-trade-agreements/jordan-fta (accessed on 9 December 2022).
16
The Jordanian Ministry of Industry, Trade and Supply—Foreign Trade Policy Directorate. URL: https://www.mit.gov.jo/EN/ListDetails/Departments/44/11 (accessed on 9 December 2022).
17
European Research Executive Agency “REA”: EU-Jordan Association Agreement—URL: https://ec.europa.eu/chafea/agri/en/content/eu-jordan-association-agreement (accessed on 9 December 2022).
18
The Jordan Time—Climate change to hit impoverished Jordanians the hardest, streamlining funding process vital to build resilience. By Mohammad Ghazal—September 2022.
19
Manufacturing Sector—Jordan’s Economic Vision Roadmap. The Jordan Strategy Forum (JSF) 2021.
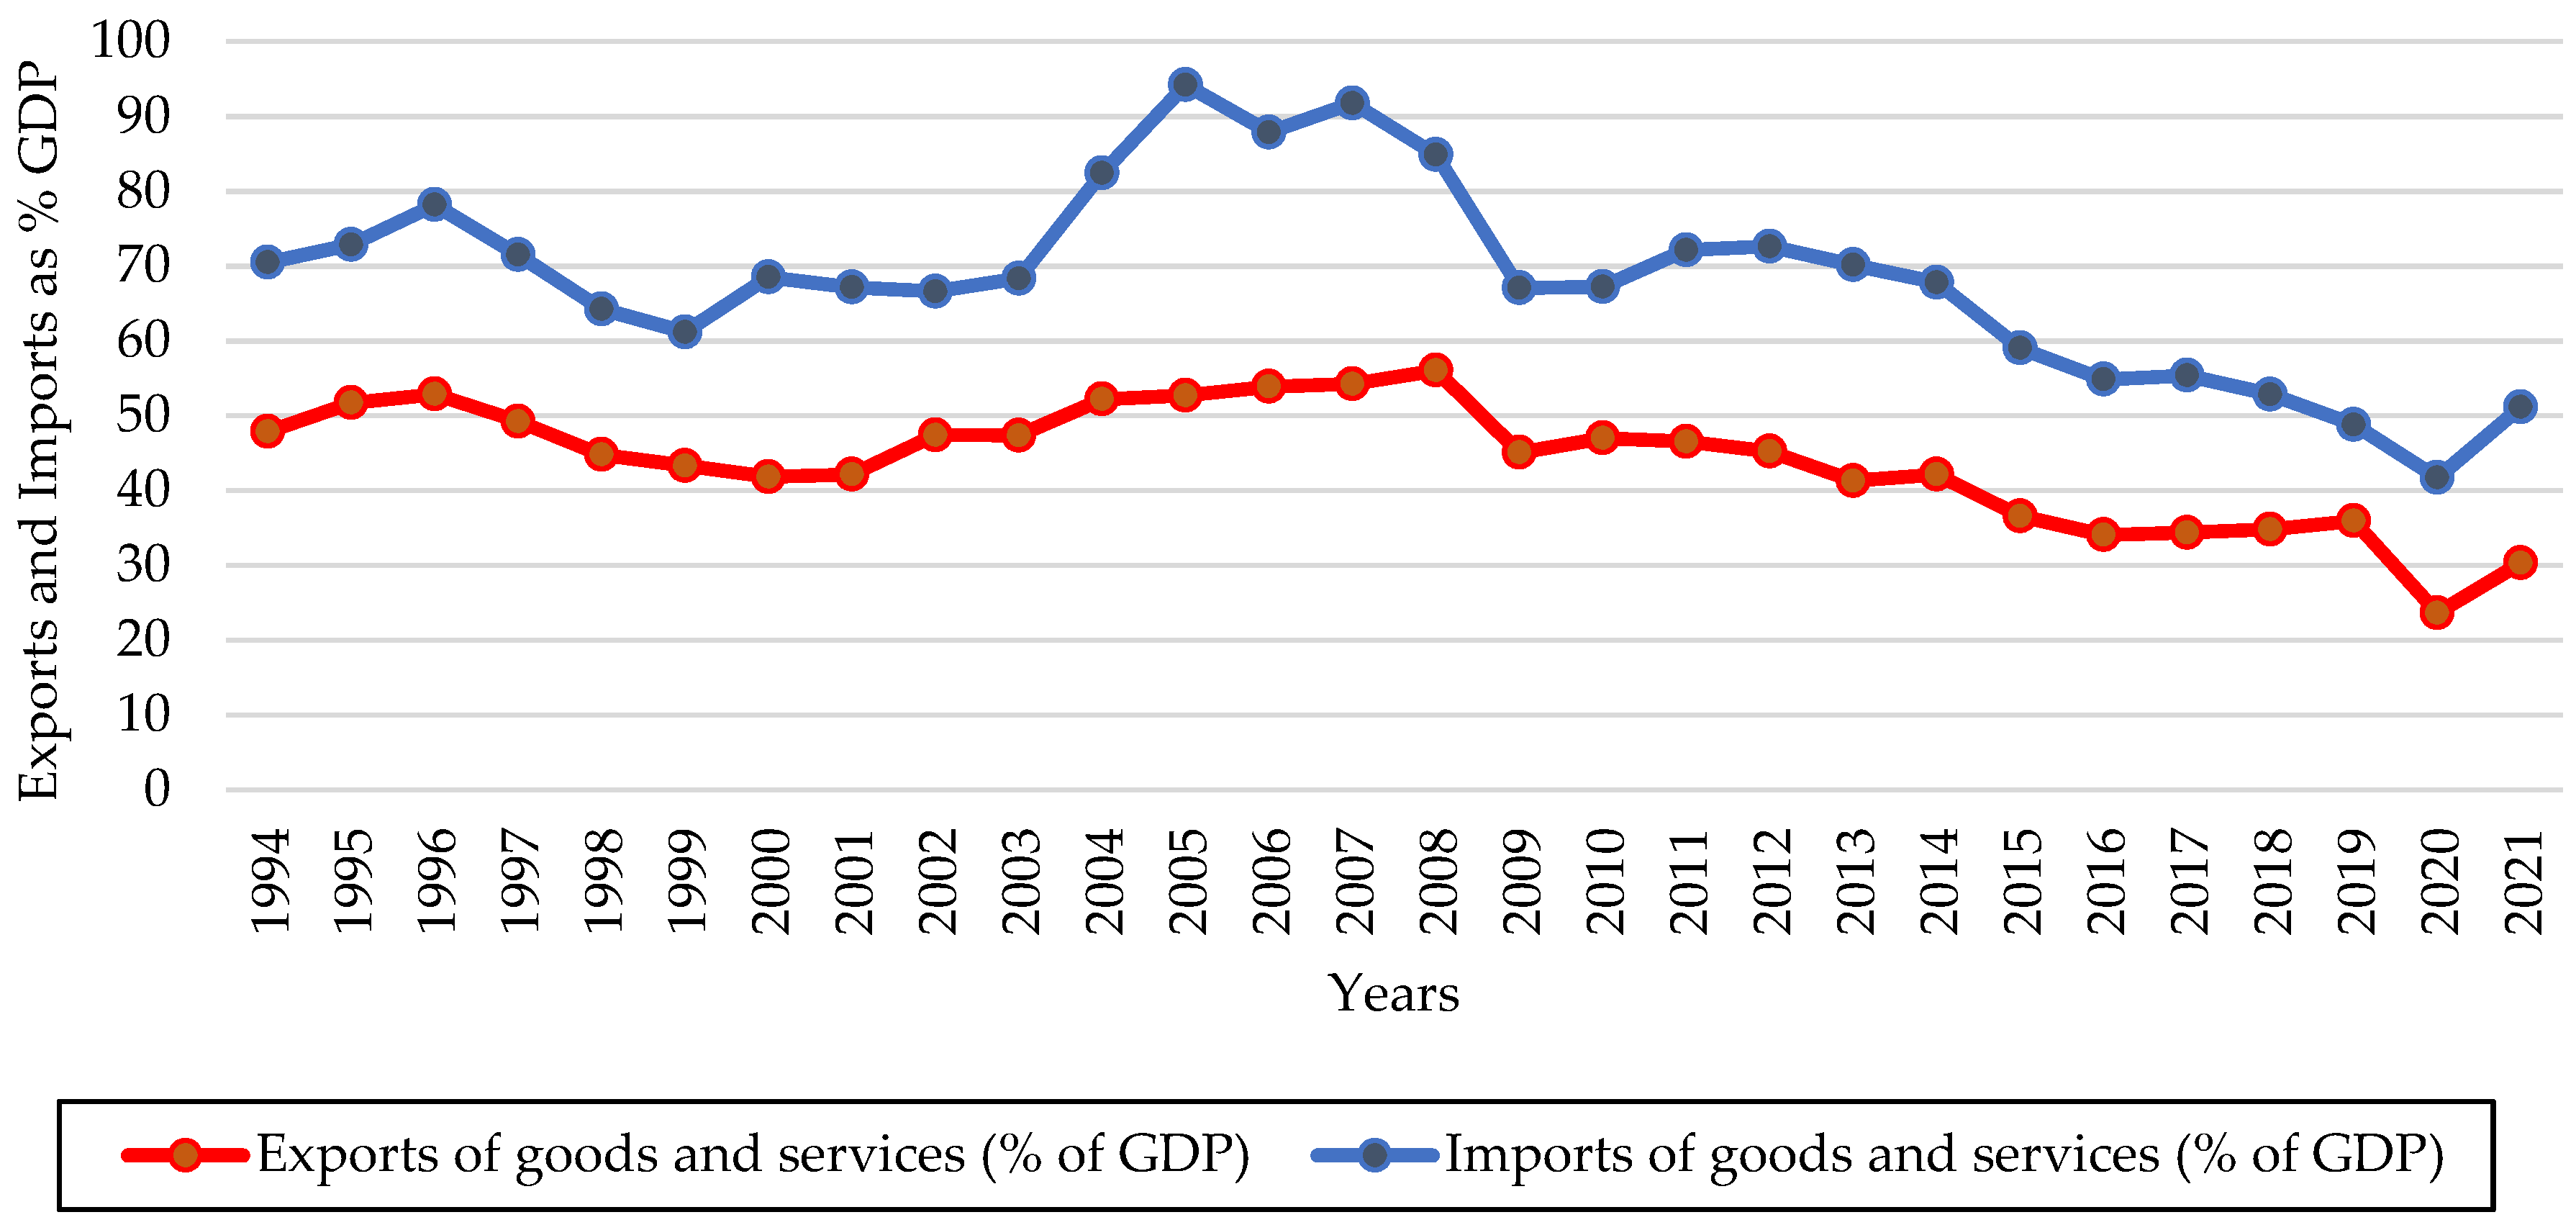
20
World Bank Data—Exports and Imports of goods and services (% of GDP).
21
22
Output divided by the weighted geometric average of both labor and capital input.
23
Representing the relationship between input factors and the output. Knowing that the factors of production are land, labor, capital, and entrepreneurship. A New Class of Production Function Model and Its Application. Published by De Gruyter in 2016, Journal of Systems Science and Information.
24
OECD: Organisation for Economic Co-operation and Development.
25
BRICS: Brazil, Russia, India, China, and South Africa.

References

  1. Abedini, Javad. 2008. The Greater Arab Free Trade Area (GAFTA): An Estimation of Its Trade Effects. Journal of Economic Integration 23: 848–72. [Google Scholar] [CrossRef]
  2. Abu Shihab, Ruba, Thikraiat Soufan, and Shatha Abdul-Khaliq. 2014. The Causal Relationship between Exports and Economic Growth in Jordan. Global Journal of Management and Business: (B) Economic & Commerce 14: 17–22. Available online: https://www.zuj.edu.jo/wp-content/staff-research/economic/dr.Thikraiat-Soufan/1.pdf (accessed on 1 January 2023).
  3. Ahmad, Jaleel, and Andy C. C. Kwan. 1991. Causality between exports and economic growth: Empirical evidence from Africa. Economics Letters 37: 243–48. Available online: https://www.sciencedirect.com/science/article/abs/pii/016517659190218A (accessed on 1 January 2023).
  4. Ahmad, Jaleel, and Somchai Harnhirun. 1995. Unit roots and cointegration in estimating causality between exports and economic growth: Empirical evidence from the ASEAN countries. Economics Letters 49: 329–34. Available online: https://www.sciencedirect.com/science/article/abs/pii/0165176595006789 (accessed on 2 January 2023).
  5. Al-Yousif, Yousif Khalifa. 1997. Exports and economic growth: Some empirical evidence from the Arab Gulf countries. Applied Economics 29: 693–97. [Google Scholar] [CrossRef]
  6. Arteaga, Julio César, Mónica Liseth Cardozo, and Márcia Jucá T. Diniz. 2020. Exports to China and economic growth in Latin America, unequal effects within the region. International Economics 164: 1–17. [Google Scholar] [CrossRef]
  7. Awokuse, Titus O. 2005. Exports, Economic Growth and Causality in Korea. Applied Economics Letters 12: 693–96. [Google Scholar] [CrossRef]
  8. Awokuse, Titus O. 2006. Export-led growth and the Japanese economy: Evidence from VAR and directed acyclic graphs. Applied Economics 38: 593–602. [Google Scholar] [CrossRef]
  9. Awokuse, Titus O. 2007. Causality between exports, imports, and economic growth: Evidence from transition economies. Economics Letters 94: 389–95. [Google Scholar] [CrossRef]
  10. Awokuse, Titus O. 2008. Trade openness and economic growth: Is growth export-led or import-led? Applied Economics 40: 161–73. [Google Scholar] [CrossRef]
  11. Bahmani-Oskooee, Mohsen, and Claire Economidou. 2009. Export led growth vs. growth led exports: LDCs experience. The Journal of Developing Areas 42: 179–212. Available online: https://muse.jhu.edu/article/253430 (accessed on 9 December 2022). [CrossRef]
  12. Bahmani-Oskooee, Mohsen, and Maharouf Oyolola. 2007. Export growth and output growth: An application of bounds testing approach. Journal of Economics and Finance 31: 1–11. Available online: https://link.springer.com/article/10.1007/BF02751507 (accessed on 9 December 2022). [CrossRef]
  13. Balassa, Bela. 1978. Exports and Economic Growth: Further Evidence. Journal of Development Economics 5: 181–89. [Google Scholar] [CrossRef]
  14. Bekaert, Geert, Campbell R. Harvey, and Christian Lundblad. 2011. Financial Openness and Productivity. World Development 39: 1–19. [Google Scholar] [CrossRef]
  15. Bhagwati, Jagdish N. 1988. Export-Promoting Trade Strategy: Issues and Evidence. The World Bank Research Observer 3: 27–57. [Google Scholar] [CrossRef]
  16. Bhagwati, Jagdish N. 1989. Protectionism. Cambridge: The MIT Press. Available online: https://mitpress.mit.edu/9780262521505/protectionism/ (accessed on 12 December 2022).
  17. Brooks, Chris. 2014. Introductory Econometrics for Finance. Cambridge: Cambridge University Press. [Google Scholar] [CrossRef]
  18. Clerides, Sofronis K., Saul Lach, and James R. Tybout. 1998. Is Learning-by-Exporting Important? Micro-Dynamic Evidence from Colombia, Mexico and Morocco. The Quarterly Journal of Economics 113: 903–47. Available online: https://www.jstor.org/stable/2586877 (accessed on 9 December 2022). [CrossRef]
  19. Coe, David T., and Elhanan Helpman. 1995. International R&D spillovers. European Economic Review 39: 859–87. [Google Scholar] [CrossRef]
  20. Darrat, Ali F. 1986. Trade and Development: The Asian Experience. Cato Journal 6: 695–99. Available online: https://www.cato.org/cato-journal/fall-1986/trade-development-asian-experience (accessed on 20 December 2022).
  21. Debbarmaa, Jahira, Yongrok Choia, Fan Yangb, and Hyoungsuk Lee. 2022. Exports as a new paradigm to connect business and information technology for sustainable development. Journal of Innovation & Knowledge 7: 100233. [Google Scholar] [CrossRef]
  22. Dhawan, Urvashi, and Bagala Biswal. 1999. Re-examining export-led growth hypothesis: A multivariate cointegration analysis for India. Applied Economics 31: 525–30. [Google Scholar] [CrossRef]
  23. Dodaro, Santo. 1993. Exports and growth: A reconsideration of causality. The Journal of Developing Areas 27: 227–44. Available online: https://www.jstor.org/stable/4192203 (accessed on 20 December 2022).
  24. Dreger, Christian, and Dierk Herzer. 2013. A further examination of the export-led growth hypothesis. Empirical Economics 45: 39–60. Available online: https://link.springer.com/article/10.1007/s00181-012-0602-4 (accessed on 21 December 2022). [CrossRef]
  25. Edwards, Sebastian. 1993. Openness, Trade Liberalization, and Growth in Developing Countries. Journal of Economic Literature 31: 1358–93. Available online: https://www.jstor.org/stable/2728244 (accessed on 21 December 2022).
  26. Edwards, Sebastian. 1998. Openness, Productivity and Growth: What Do We Really Know? The Economic Journal 108: 383–98. Available online: https://www.jstor.org/stable/2565567 (accessed on 21 December 2022). [CrossRef]
  27. Engle, Robert. 2001. GARCH 101: The use of ARCH/GARCH Models in Applied Econometrics. Journal of Economic Perspectives 15: 157–68. Available online: https://www.jstor.org/stable/2696523 (accessed on 21 December 2022). [CrossRef]
  28. Fajana, Olufemi. 1979. Trade and growth: The Nigerian experience. World Development 7: 73–78. [Google Scholar] [CrossRef]
  29. Feder, Gershon. 1983. On exports and economic growth. Journal of Development Economics 12: 59–73. [Google Scholar] [CrossRef]
  30. Foster, Neil. 2006. Exports, growth and threshold effects in Africa. The Journal of Development Studies 42: 1056–74. [Google Scholar] [CrossRef]
  31. Fratzscher, Marcel, and Matthieu Bussiere. 2004. Financial Openness and Growth: Short-Run Gain, Long-Run Pain? European Central Bank Working Paper. No. 348. Available online: https://www.ecb.europa.eu/pub/pdf/scpwps/ecbwp348.pdf (accessed on 22 December 2022).
  32. Ghatak, Subrata, Chris Milner, and Utku Utkulu. 1997. Exports, export composition and growth: Cointegration and causality evidence for Malaysia. Applied Economics 29: 213–23. [Google Scholar] [CrossRef]
  33. Hagemejer, Jan, and Jakub Mućk. 2019. Export-led growth and its determinants: Evidence from Central and Eastern European countries. The World Economy 42: 1994–2025. [Google Scholar] [CrossRef]
  34. Hanson, Philip. 1982. The end of import-led growth? Some observations on Soviet, Polish, and Hungarian experience in the 1970s. Journal of Comparative Economics 6: 130–47. [Google Scholar] [CrossRef]
  35. Hausmann, Ricardo, Tim O’Brien, Miguel Angel Santos, Ana Grisanti, and Jorge Tapia. 2019. Jordan: The Elements of a Growth Strategy. Center for International Development (CID) at Harvard University Working Papers. No. 346. Available online: https://growthlab.cid.harvard.edu/files/growthlab/files/2019-02-28-cid-wp-346-jordan-growth-strategy-revised.pdf (accessed on 22 December 2022).
  36. Helpman, Elhanan, and Paul Krugman. 1987. Market Structure and Foreign Trade. Increasing Returns, Imperfect Competition, and the International Economy. Cambridge: The MIT Press. Available online: https://mitpress.mit.edu/9780262580878/market-structure-and-foreign-trade/ (accessed on 22 December 2022).
  37. Hye, Qazi Muhammad Adnan, and Houda Bel Haj Boubaker. 2011. Exports, Imports and Economic Growth: An Empirical Analysis of Tunisia. The IUP Journal of Monetary Economics 9: 6–21. [Google Scholar]
  38. Hye, Qazi Muhammad Adnan, Shahida Wizarat, and Wee-Yeap Lau. 2013. Trade-led growth hypothesis: An empirical analysis of South Asian countries. Economic Modelling 35: 654–60. [Google Scholar] [CrossRef]
  39. International Monetary Fund (IMF). 2001. Global Trade Liberalization and the Developing Countries. November. Available online: https://www.imf.org/external/np/exr/ib/2001/110801.htm#i (accessed on 7 January 2023).
  40. International Monetary Fund (IMF). 2004. Jordan: Selected Issues and Statistical Appendix. IMF Country Report No. 04/121. Available online: https://www.elibrary.imf.org/view/journals/002/2004/121/002.2004.issue-121-en.xml (accessed on 1 January 2023).
  41. Islam, Faridul, Qazi Muhammad Adnan Hye, and Muhammad Shahbaz. 2012. Import-economic growth nexus: ARDL approach to cointegration. Journal of Chinese Economic and Foreign Trade Studies 5: 194–214. Available online: https://www.emerald.com/insight/content/doi/10.1108/17544401211263964/full/html (accessed on 2 January 2023). [CrossRef]
  42. Islam, Muhammed N. 1998. Export expansion and economic growth: Testing for cointegration and causality. Applied Economics 30: 415–25. [Google Scholar] [CrossRef]
  43. Jarque, Carlos M., and Anil K. Bera. 1980. Efficient tests for normality, homoscedasticity and serial independence of regression residuals. Economics Letters 6: 255–59. [Google Scholar] [CrossRef]
  44. Jin, Jang C., and Eden S. H. Yu. 1996. Export-led growth and the US economy: Another look. Applied Economics Letters 3: 341–44. [Google Scholar] [CrossRef]
  45. Ju, Jiandong, Li Wu, and Li Zeng. 2010. The Impact of Trade Liberalization on the Trade Balance in Developing Countries. International Monetary Fund (IMF). Available online: https://www.elibrary.imf.org/view/journals/024/2010/002/article-A006-en.xml (accessed on 2 January 2023).
  46. Jung, Woo S., and Peyton J. Marshall. 1985. Exports, growth and causality in developing countries. Journal of Development Economics 18: 1–12. [Google Scholar] [CrossRef]
  47. Kardoosh, Marwan A. 2019. Trade Liberalization in Jordan and Economic Diplomacy. A Story of Qualified Success. Konrad-Adenauer-Stiftung e.V. Available online: https://www.kas.de/en/web/jordanien/single-title/-/content/trade-liberalization-in-jordan-and-economic-diplomacy (accessed on 2 January 2023).
  48. Kavoussi, Rostam M. 1984. Export expansion and economic growth: Further empirical evidence. Journal of Development Economics 14: 241–50. [Google Scholar] [CrossRef]
  49. Khalafalla, Khalid Yousif, and Alan J. Webb. 2001. Export–led growth and structural change: Evidence from Malaysia. Applied Economics 33: 1703–15. [Google Scholar] [CrossRef]
  50. Khemka, Abhinav, Temesgen Kifle, and Bryan Morgan. 2018. Export-Led Growth in India: A Bounds Testing Approach. The Journal of Developing Areas 52: 1–14. [Google Scholar] [CrossRef]
  51. Kónya, László. 2006. Exports and growth: Granger causality analysis on OECD countries with a panel data approach. Economic Modelling 23: 978–92. [Google Scholar] [CrossRef]
  52. Kristjanpoller, Werner, and Josephine E. Olson. 2014. Economic Growth in Latin American Countries: Is It Based on Export-Led or Import-Led Growth? Emerging Markets Finance and Trade 50: 6–20. [Google Scholar] [CrossRef]
  53. Kwan, Andy C. C., John A. Cotsomitis, and Benjamin K. C. Kwok. 1999. Exports, economic growth and structural invariance: Evidence from some Asian NICs. Applied Economics 31: 493–98. [Google Scholar] [CrossRef]
  54. Lawrence, Robert Z., and David E. Weinstein. 1999. Trade and Growth: Import-Led or Export-Led? Evidence From Japan and Korea. National Bureau of Economic Research (NBER) Working Paper No. 7264. Available online: https://www.nber.org/papers/w7264 (accessed on 20 December 2022).
  55. Love, Jim, and Ramesh Chandra. 2005. Testing export-led growth in South Asia. Journal of Economic Studies 32: 132–45. [Google Scholar] [CrossRef]
  56. Lucas, Robert E., Jr. 1988. On the mechanics of economic development. Journal of Monetary Economics 22: 3–42. [Google Scholar] [CrossRef]
  57. Lütkepohl, Helmut. 1993. Testing for causation between two variables in higher-dimensional VAR models. In Studies in Applied Econometrics. Heidelberg: Physica-Verlag HD, pp. 75–91. [Google Scholar] [CrossRef]
  58. Mahadevan, Renuka, and Sandy Suardi. 2008. A dynamic analysis of the impact of uncertainty on import- and/or export-led growth: The experience of Japan and the Asian Tigers. Japan and the World Economy 20: 155–74. [Google Scholar] [CrossRef]
  59. Mah, Jai S. 2005. Export expansion, economic growth and causality in China. Applied Economics Letters 12: 105–7. [Google Scholar] [CrossRef]
  60. Mazumdar, Joy. 2001. Imported machinery and growth in LDCs. Journal of Development Economics 65: 209–24. [Google Scholar] [CrossRef]
  61. Medina-Smith, Emilio J. 2001. Is the export-led growth hypothesis valid for developing countries? A case study of Costa Rica. United Nations Publication: Trade Analysis Branch. University of Sussex, United Kingdom and Universidad de Carabobo, Venezuela Study Series No. 7. Available online: https://unctad.org/system/files/official-document/itcdtab8_en.pdf (accessed on 20 December 2022).
  62. Melitz, Marc J. 2003. The Impact of Trade on Intra-Industry Reallocations and Aggregate Industry Productivity. The Econometric Society 71: 1695–725. Available online: https://scholar.harvard.edu/files/melitz/files/aggprod_ecma.pdf (accessed on 20 December 2022). [CrossRef]
  63. Mishra, Vinod, Susan Sunila Sharma, and Russell Smyth. 2010. Is economic development in the Pacific island countries export led or import led? Pacific Economic Bulletin 25: 6–63. Available online: http://hdl.handle.net/1885/157962 (accessed on 21 December 2022).
  64. Mohaddes, Kamiar, and Mehdi Raissi. 2011. Oil Prices, External Income, and Growth: Lessons from Jordan. International Monetary Fund (IMF) Working Paper No. 11/291. Washington, DC: IMF. [Google Scholar]
  65. Narayan, Paresh Kumar, Seema Narayan, Biman Chand Prasad, and Arti Prasad. 2007. Export-led growth hypothesis: Evidence from Papua New Guinea and Fiji. Journal of Economic Studies 34: 341–51. [Google Scholar] [CrossRef]
  66. Nishimizu, Mieko, and Sherman Robinson. 1984. Trade policies and productivity change in semi-industrialized countries. Journal of Development Economics 16: 177–206. [Google Scholar] [CrossRef]
  67. Onafowora, Olugbenga A., Oluwole Owoye, and Akorlie A. Nyatepe-Coo. 1996. Trade policy, export performance and economic growth: Evidence from sub-Saharan Africa. The Journal of International Trade and Economic Development 5: 341–60. [Google Scholar] [CrossRef]
  68. Oxley, Les. 1993. Cointegration, causality and export-led growth in Portugal. Economics Letters 43: 163–66. [Google Scholar] [CrossRef]
  69. Panta, Humnath, Mitra Lal Devkota, and Dhruba Banjade. 2022. Exports and Imports-Led Growth: Evidence from a Small Developing Economy. Journal of Risk and Financial Management 15: 11. [Google Scholar] [CrossRef]
  70. Quinn, Dennis, Martin Schindler, and A. Maria Toyoda. 2011. Assessing Measures of Financial Openness and Integration. IMF Economic Review 59: 488–522. [Google Scholar] [CrossRef]
  71. Ramachandran, S. 2004. Jordan Economic Development in the 1990s and World Bank Assistance. Report No. 821031. Washington, DC: World Bank Group. Available online: https://documents.worldbank.org/en/publication/documents-reports/documentdetail/774801468271825681/jordan-economic-development-in-the-1990s-and-world-bank-assistance (accessed on 20 December 2022).
  72. Rani, Ritu, and Naresh Kumar. 2018. Is There an Export- or Import-led Growth in BRICS Countries? An Empirical Investigation. Jindal Journal of Business Research 7: 13–23. [Google Scholar] [CrossRef]
  73. Reppas, Panayiotis A., and Dimitris K. Christopoulos. 2005. The export-output growth nexus: Evidence from African and Asian countries. Journal of Policy Modeling 27: 929–40. [Google Scholar] [CrossRef]
  74. Sachs, Jeffrey D., Andrew Warner, Anders Åslund, and Stanley Fischer. 1995. Economic Reform and the Process of Global Integration. Brookings Papers on Economic Activity 1995: 1–118. [Google Scholar] [CrossRef]
  75. Shan, Jordan, and Fiona Sun. 1999. Export-led growth and the US economy: Some further testing. Applied Economics Letters 6: 169–72. [Google Scholar] [CrossRef]
  76. Siliverstovs, Boriss, and Dierk Herzer. 2006. Export-led growth hypothesis: Evidence for Chile. Applied Economics Letters 13: 319–24. [Google Scholar] [CrossRef]
  77. Sims, Christopher A. 1980. Macroeconomics and Reality. Econometrica 48: 1–48. [Google Scholar] [CrossRef]
  78. SNAP. 2014. Jordan Baseline Information. The Syria Needs Analysis Project. ACAPS and MapAction. Available online: https://www.acaps.org/sites/acaps/files/products/files/16_jordan_baseline_information.pdf (accessed on 28 December 2022).
  79. Stallings, Barbara. 2001. Globalization and Liberalization: The Impact on Developing Countries. “CEPAL—SERIE Macroeconomía del desarrollo No 4”. United Nations Publication, Economic Development Division, LC/L.1571-P. Available online: https://hdl.handle.net/11362/5427 (accessed on 28 December 2022).
  80. Syal, Huma Nawaz. 2007. The Role of Trade Liberalization in Economic Growth Theories, Evidence, and Challenges. Strategic Studies 27: 50–72. Available online: http://www.jstor.org/stable/45242406 (accessed on 29 December 2022).
  81. Thornton, John. 1996. Cointegration, causality and export-led growth in Mexico 1895–1992. Economics Letters 50: 413–16. [Google Scholar] [CrossRef]
  82. Tyler, William G. 1981. Growth and export expansion in developing countries: Some empirical evidence. Journal of Development Economics 9: 121–30. [Google Scholar] [CrossRef]
  83. UNDP. 2013. Human Development Report 2013—The Rise of the South: Human Progress in a Diverse World. United Nations Development Programme (UNDP). Available online: https://www.undp.org/egypt/publications/human-development-report-2013-rise-south-human-progress-diverse-world (accessed on 4 January 2023).
  84. van IJzerloo, Jeroen. 2016. Jordan’s economy remains in jeopardy. RaboResearch—Economic Research. Available online: https://economics.rabobank.com/publications/2016/may/jordans-economy-remains-in-jeopardy/ (accessed on 4 January 2023).
  85. Vohra, Rubina. 2001. Export and economic growth: Further time series evidence from less-developed countries. International Advances in Economic Research 7: 345–50. [Google Scholar] [CrossRef]
  86. Warred, Taleb Awad. 2014. The potential economic impact of Aid for Trade in the MENA region: Case of Jordan. In Connecting to Global Markets. Challenges and Opportunities: Case Studies Presented by WTO Chair-Holders. Edited by Marion Jansen, Mustapha Sadni Jallab and Maarten Smeets. Geneva: World Trade Organization (WTO), chp.13. pp. 219–34. Available online: https://www.wto.org/english/res_e/booksp_e/cmark_full_e.pdf (accessed on 7 January 2023).
  87. Were, Maureen. 2015. Differential effects of trade on economic growth and investment: A cross-country empirical investigation. Journal of African Trade 2: 71–85. [Google Scholar] [CrossRef]
  88. Wilk, M. B., and R. Gnanadesikan. 1968. Probability Plotting Methods for the Analysis of Data. Biometrika 55: 1–17. [Google Scholar] [CrossRef]
  89. Winters, L. Alan, Neil McCulloch, and Andrew McKay. 2004. Trade Liberalization and Poverty: The Evidence so Far. American Economic Association 42: 72–115. Available online: https://www.jstor.org/stable/3217037 (accessed on 7 January 2023). [CrossRef]
  90. WTO. 2008. Trade Policy Review Report: Jordan. Press Release: PRESS/TPRB/306. Available online: https://www.wto.org/english/tratop_e/tpr_e/tp306_e.htm (accessed on 12 January 2023).
  91. Zang, Wenyu, and Mark Baimbridge. 2012. Exports, imports and economic growth in South Korea and Japan: A tale of two economies. Applied Economics 44: 361–72. [Google Scholar] [CrossRef]
Figure 1. Exports and Imports in Jordan. This graph is generated using the available data through the Jordanian Department of Statistics (DoS) between 1994 and 20217.
Economies 11 00135 g001
Figure 2. Exports and Imports (% GDP) in Jordan. This graph is generated using the available data through the World Bank between 1994 and 202120.
Economies 11 00135 g002
Figure 3. Plots of impulse responses. Note. The top-left figures (“Response to impulse in gdp_log”) show the responses of GDP, exports, imports, and gross capital formation to a forecast error impulse in GDP with two standard errors. The top-right figures (“Response to impulse in export_log”) show the responses of GDP, exports, imports, and gross capital formation to a forecast error impulse in exports with two standard errors. The bottom-left figures (“Response to impulse in import_log”) show the responses of GDP, exports, imports, and gross capital formation to a forecast error impulse in imports with two standard errors. The bottom-right figures (“Response to impulse in capital_log”) show the responses of GDP, exports, imports, and gross capital formation to a forecast error impulse in gross capital formation with two standard errors.
Economies 11 00135 g003aEconomies 11 00135 g003b
Table 1. Assessment of stationarity.
LevelsFirst Differences
ADFPPADFPP
LagsTaupTaupTaupTaup
GDP0−1.080.7140−1.080.7140−3.850.0003−3.850.0003
1−1.550.4980−1.260.6384−4.18<0.0001−3.910.0002
2−0.900.7794−1.340.6042−4.69<0.0001−3.900.0002
3−0.320.9136−1.340.6043−2.780.0065−3.700.0004
Exports0−2.150.2274−2.150.2274−5.17<0.0001−5.17<0.0001
1−2.100.2440−2.120.2371−4.110.0001−5.16<0.0001
2−1.820.3643−2.120.2375−3.260.0017−5.13<0.0001
3−1.300.6196−2.110.2407−3.760.0004−5.17<0.0001
Imports0−1.480.5335−1.480.5335−5.27<0.0001−5.27<0.0001
1−1.390.5768−1.570.4879−4.16<0.0001−5.27<0.0001
2−1.320.6114−1.610.4681−3.370.0012−5.22<0.0001
3−1.230.6525−1.660.4439−3.000.0035−5.23<0.0001
Capital0−1.930.3158−1.930.3158−5.92<0.0001−5.92<0.0001
1−1.980.2929−2.050.3640−4.25<0.0001−5.92<0.0001
2−2.060.2606−2.120.2364−3.980.0002−5.92<0.0001
3−1.800.3775−2.140.2294−3.700.0004−5.90<0.0001
Note. ADF = augmented Dickey–Fuller unit root test; PP = Phillips–Perron unit root test.
Table 2. Cointegration rank test using trace.
H0: Rank = rH1: Rank > rEigenvalueTracep
000.437446.73670.0624
110.241721.42970.3298
220.15009.25310.3425
330.04672.10310.1467
Table 3. Information criteria to determine the optimum lag k for the VAR.
k = 1k = 2k = 3k = 4k = 5
AICC−427.19−1619.28−906.67−835.65−837.21
HQC−550.41−508.41−495.18−462.67−455.08
AIC−570.26−538.28−534.67−511.34−512.48
BIC−516.74−457.27−426.93−377.68−353.73
FPEC0.00270.00430.00370.00530.0048
Note. Bold text indicated the smallest number for the information criteria. Optimum lag k = 1 was selected as the model had the smallest information criteria based on HQC, AIC, BIC, and FPEC.
Table 4. Parameter estimates of VAR(1).
VariableβSEtp
Δ G t Constant0.01350.01590.850.4010
Δ G t 1 0.55710.17943.100.0035 *
Δ X t 1 −0.12370.1390−0.890.3792
Δ M t 1 0.17970.18450.970.3359
Δ C t 1 −0.15940.1347−1.180.2438
Δ X t Constant0.02600.02011.290.2032
Δ G t 1 0.46710.22672.060.0461 *
Δ X t 1 −0.00570.1757−0.030.9742
Δ M t 1 −0.07170.2331−0.310.7601
Δ C t 1 0.13610.17020.800.4288
Δ M t Constant0.00620.02240.280.7833
Δ G t 1 0.18060.25280.710.4792
Δ X t 1 0.25700.19591.310.1972
Δ M t 1 −0.20030.2599−0.770.4456
Δ C t 1 0.18450.18980.970.3369
Δ C t Constant−0.00610.0298−0.210.8385
Δ G t 1 0.41970.33641.250.2197
Δ X t 1 0.16930.26070.650.5199
Δ M t 1 −0.24390.3459−0.700.4850
Δ C t 1 0.05240.25260.210.8366
Note. β = coefficient, SE = standard error, t = t-statistic, and p = p-value. * indicated significance at the 0.05 level.
Table 5. Granger causality tests.
Null Hypothesis (H0)χ2dfpConclusion
Exports did not Grangerly cause GDP0.4710.4923Not reject H0
Imports did not Grangerly cause GDP010.9589Not reject H0
Gross capital formation did not Grangerly cause GDP0.7810.3757Not reject H0
GDP did not Grangerly cause exports9.3210.0023Reject H0
Imports did not Grangerly cause exports2.2110.1371Not reject H0
Gross capital formation did not Grangerly cause exports5.1710.0230Reject H0
GDP did not Grangerly cause imports1.5310.2167Not reject H0
Exports did not Grangerly cause imports1.5910.2078Not reject H0
Gross capital formation did not Grangerly cause imports1.4910.2218Not reject H0
Note. χ2 = chi-square test statistic, df = degrees of freedom, and p = p-value.
Disclaimer/Publisher’s Note: The statements, opinions and data contained in all publications are solely those of the individual author(s) and contributor(s) and not of MDPI and/or the editor(s). MDPI and/or the editor(s) disclaim responsibility for any injury to people or property resulting from any ideas, methods, instructions or products referred to in the content.

