Abstract
An array of global events, including the global financial crisis, natural disasters, and the recent coronavirus pandemic, have consistently shown the vulnerability of global systems and humans to externally undesirable contagions. In order to further provide alternative approaches to information valuation, this study utilized the economic policy uncertainty (EPU) of 21 leading developed and developing economies (Australia, Brazil, Canada, Chile, China, Colombia, Denmark, France, Germany, Greece, India, Ireland, Italy, Japan, Korea, Netherlands, Russia, Spain, Sweden, the United Kingdom, and the United States of America) over the period January 1997 to May 2021. The information theory reveals the hierarchy of degrees of randomness in the EPU indices; it shows the information flow among the EPU indices through the mutual information metric and the graphical illustration of the information flows using network theory. Importantly, the Entropy measures indicate higher predictability of the Netherlands and Ireland’s EPU indices, suggesting that they have less randomness than other indices. Contrarily, Greece and the United Kingdom share the lowest predictability of the EPU indices. Moreover, the complex networks analysis shows that the EPU indices is generally shaped by geographic location. In order of significance, the United States of America’s EPU index exhibits the strongest correlation with other countries’ EPU indices and followed by the EPU indices of France, the United Kingdom (UK), and Germany. In general, the result of the investigation communicates relevant policy measures that potentially ameliorate shocks from external contagions.
1. Introduction
Given the impact of shocks on the economy, numerous techniques in information theory (IT) have been implemented to understand the complexities of financial and economic contagion across the global. A fundamental metric of information, which is known as entropy, developed by Shannon (1948), refers to the level of uncertainty inherent in a random variable. Thus, the level of uncertainty inherent in a random variable which is typically measured in bits is required to assess the expected value of the information retained in a message. Moreover, the Shannon entropy is also viewed as a measure of unpredictability and gains its highest value for a uniform discrete distribution. Compared with the variance or standard deviation, entropy is a more general indicator of uncertainty since it is influenced more by distribution features and may be related to higher moments of the distribution (Ebrahimi et al. 1999). On the other hand, variance reflects the level of spread around the mean, while entropy describes the amount of diffuseness of the density regardless of location.
Similarly, mutual information (MI) describes the degree to which two random variables are dependent on one another in statistics and information theory. In other words, it involves reducing uncertainty about one random variable when one knows about another. The MI measure is well-defined for categorical variables, yet it is also devised to measure nonlinear associations and has appealing information-theoretic interpretations. When the mutual information between random variables is high, there is a large reduction in uncertainty. When it is low, there is a small reduction, and zero suggests a completely independent relationship. By using the mutual information matrix, it is possible to build a network where each country is denoted by a node. Meanwhile, the minimum spanning tree (MST) is a common approach to constituting an informative subgraph of a full network. By keeping only those dependencies that satisfy the MST criterion, it eliminates weak dependencies drastically. This network procedure has been used to examine considerable economic and financial studies. Moreover, a less severe method of filtering, i.e., the Planar Maximally Filtered Graph (PMFG) proposed by (Tumminello et al. 2005), is also found fashionable because it allows for more information regarding the networks to be preserved than the MST.
Additionally, PMFG and MST are both connected and planar graphs in that they can be displayed on a plane such that no links cross one another. In the MST, the N vertices of the subgraph are connected by N-1 links, while in the PMFG, the number of links is 3(N − 2). As a result of the construction process, the PMFG contains the MST. A key advantage of PMFG over MST is the loose topological restriction that permits it to preserve more of the information contained in the similarity matrix, such as loops and cliques. Moreover, the uncertainty of economic policies exhibits a high degree of cross-dependence due to the mutual flow of information and globalization. Hence, an understanding of the current policymaking environment can be better understood in the context of a complex network (network, in this case, is a set of nodes or vertices linked by links or edges). While Pearson correlation-based similarity or distance is a standard metric for building networks, however, it is only effective if returns are linearly related and is unable to detect nonlinear relationships.
Given this motivation, this study is unique and makes several important contributions to the relevant literature, especially in the context of further exploring information and shock contagion among economies. Although, in studying the contagion of economic policies, EPU has been widely employed in the literature from several perspectives (Klößner and Sekkel 2014; Antonakakis et al. 2018; Liow et al. 2018; Kang and Yoon 2019; Marfatia et al. 2020), the gap in the existing studies can be further explored from the aspects of empirical approach and framework. Specifically, the paper explores the strength and extent of the information exchange between the economic policy uncertainty indices among selected 21 countries (Australia, Brazil, Canada, Chile, China, Colombia, Denmark, France, Germany, Greece, India, Ireland, Italy, Japan, Korea, Netherlands, Russia, Spain, Sweden, the United Kingdom, and the United States of America). Additionally, the mutual-information-based metric is used to build the MST and PMFG to reveal the fundamental core structure of the current policymaking environment. Furthermore, this study identifies the important countries by applying metrics from the social network analysis. Again, the community detection algorithm is implemented in the network to find the cluster of countries sharing similar uncertainties. Finally, the information-theoretic measures were implemented to analyze the degrees of randomness and complexity of EPU indices. The order parts of the study are arranged such that the review of the existing literature, data presentation, method of the investigation, discussion of the results, and the conclusion alongside policy implication are detailed in Section 2, Section 3, Section 4, Section 5 and Section 6, respectively.
2. Literature Review
An attempt has been made in several studies to capture the relevance of EPU across domestic and global economies (Bai et al. 2019; Akadiri et al. 2020; Abakah et al. 2021; Osei et al. 2021; Yang et al. 2021; Zhou et al. 2022). For instance, in the recent study by Zhou et al. (2022), the spillover effects, the dynamic characteristics of the EPU spillover network, and the corresponding impact of the coronavirus (COVID-19) pandemic on these spillover effects across 19 countries were investigated. In achieving this objective, a combination of the vector autoregression (VAR) model and the least absolute shrinkage and selection operator (LASSO), i.e., LASSO-VAR and spillover index approaches, was implemented. The approach involves the construction of a spillover network for the countries’ EPU and subsequently deconstructing the new spillover network using block models. By implication, the result of the study implies that EPU exhibits significant transnational contagion with a time-varying spillover network of policy uncertainty. Moreover, without evidence of a significant impact on net spillovers, COVID-19 deaths and new infection cases exert a statistically significant effect on transmission and reception directional EPU spillovers. Like Zhou et al. (2022), with the complex network analysis, the effects of EPU have been linked to market systems across global economies, including the Asia-Pacific region (Osei et al. 2021; Yang et al. 2021), and the selected developed economies (Abakah et al. 2021).
Moreover, empirical approaches have also varied in establishing the link between the countries’ EPUs. For instance, cointegration and Granger causality approaches were adopted by Osei et al. (2021) in establishing the long- and short-run asymmetric dynamism between the EPU of China–India, China–Japan, China–Korea, India–Japan, India–Korea, and Japan–Korea during the period from January 1997 to April 2020. Furthermore, in Tiwari et al. (2021), network analysis from the graph-theory framework was adopted in examining the link between the developed countries’ economic and financial uncertainties. Tiwari et al. (2021) examined the interconnectedness and nonlinear dependence of macroeconomic and financial uncertainties across 11 developed countries for the period January 1997 to September 2017. By applying the structure learning with a weakly additive noise model, a nonlinear relationship among uncertainties was found across the economies considered. Other developed economies tend to be a major source of macroeconomic and financial uncertainty for Spain. Kang and Yoon (2019) examined the dynamic interconnectivity across nine economic policy uncertainty (EPU) indices by using the Diebold and Yilmaz (2012, 2014, 2015) spillover index model to calculate the total spillover index. They found that as the global financial crisis and European debt crisis unfold, China becomes a net transmitter of connectedness.
Furthermore, Marfatia et al. (2020) analyzed the dynamic and static network of economic policy uncertainty across 17 developed and emerging economies employing MST and dependency networks using partial correlations. According to the results, EPUs exhibit geographical characteristics, and the United States of America plays a crucial role in the global network. According to the dependency network, most information flows from the US and Germany. Dynamic time-varying MST indicates dramatic shifts in the nature and dominance of the EPU network over time. Based on the novel concept proposed by Baruník and Křehlík (2018) and Cui and Zou (2020) explores the frequency connectedness between economic policy uncertainties of G20 countries, both over time as well as across different frequencies. According to the empirical results obtained in the study, economic policy uncertainties are significantly connected, and most spillovers of economic policy uncertainty occur within the short term. Moreover, the spillover effects during the financial crisis and the subsequent recovery period are greater than those during the pre-financial crisis period. Accordingly, the United States of America, French, and Australian economic policy uncertainty are the main sources of spillovers, and large international events can have significant impacts on the transmission of economic policy uncertainty across countries.
Moreover, Polat (2021) employed the frequency-dependent network structure of EPU within G-7 countries over the period of January 1998 to April 2021. The study proposed a quasi-Bayesian local likelihood method to build dynamic networks based on a locally stationary time-varying parameter-vector autoregressive model. Interestingly, the findings revealed that there were more interdependencies among G-7 EPUs around well-known economic and geopolitical incidents, frequency-dependent ties among them, and more powerful interdependencies than medium- and long-term ties.
3. Data
Our study uses the monthly EPU index calculated by Baker et al. (2016) from January 1997 to May 2021 for a group of 21 leading developed and emerging economies. They reflect news coverage derived from the country’s leading newspaper. Given the limited data availability, the study could only consider as many countries as possible that have a common length of dataset period. The monthly indices are converted to the rate of changes for each country as follows:
where denotes the rate of changes in i-th country at time t, and represents the monthly index of the i-th country at month t and t − 1, respectively.
Descriptive statistics of the rate of changes for each EPU Index are presented in Table 1. Based on this, there appears to be clearly different uncertainty behavior among the countries in the sample period. While Ireland has the largest standard deviation, Sweden has the smallest one. This suggests that Ireland has encountered severe shifts in EPU. As evidenced by the highly significant results of the Jarque–Bera (J-B) test for normality, the distributions of all EPU index series are skewed and fat-tailed. Moreover, the ADF test (the unit root test) indicates that the series is stationary, making them appropriate for use in the following analysis.

Table 1.
Summary statistics of the EPU differences.
4. Methodology
4.1. Shannon Entropy
The Shannon entropy represents the average uncertainty associated with a random variable X. The more uniform the distribution, the higher the uncertainty and the higher the entropy. Shannon entropy quantifies the amount of information that is needed to describe the variable or the uncertainty of the variable. The calculation of Shannon entropy is based on discrete data. Therefore, continuous data must be discretized. This can be achieved by symbolic encoding, i.e., partitioning the data into a finite number of bins. Shannon’s entropy for discrete distributions is defined by Shannon (1948) as follows:
where is a discrete random variable with the probabilities of occurrence of a set of events, and E is the expected value operator. If the base of the log is set to 2, entropy is measured in bits. If the base is e, then it is expressed in nats.
In this study, the Shannon entropy was normalized between 0 and 1 by dividing it by the information length log(M). Therefore, a 1 represents the greatest uncertainty of the system, and a 0 indicates no uncertainty.
4.2. Mutual Information
The mutual information I (X; Y) is a measure of how much information is shared between two discrete random variables X and Y. We can express it as follows:
where is the joint probability mass function of X and Y, and p(x) and p(y) are marginal probability mass functions (Shannon 1948).
There exist two different versions of mutual information metrics defined by Kraskov et al. (2005). The first one is based on a universal mutual information adjacency matrix referred to as version 1 or AUV1, which is defined by being normalized by dividing by the total entropy as follows:
where H(X, Y) is the joint entropy and can be computed from the joint distribution of X and Y. The dissimilarity is defined as dissAUV1 = 1 − AUV1, which is a universal distance function. It is a proper metric and meets the triangle inequality (Kraskov et al. 2005; Song et al. 2012).
The second one is based universal mutual information adjacency matrix referred to as version 2 or AUV2, which is formulated as follows:
Similarly, the dissimilarity defined as dissAUV2 = 1 − AUV2 is also a universal metric (Kraskov et al. 2005; Song et al. 2012). dissAUV2 is sharper than dissAUV2, that is, . As dissAUV2 does not have any practical benefit over dissAUV1, it is recommended to employ dissAUV1 due to its plainness (Fiedor 2014).
In this work, to obtain mutual information adjacency matrix, we first discretized each of the EPU differences into eight distinct states through the equal-width method. Secondly, entropy and mutual information between each pair of discretized EPU differences are estimated by using the plug-in method estimation technique. Finally, the MI matrix is normalized by Equation (4) and transformed into a distance matrix to construct both minimal spanning trees and planar maximally filtered networks from the dataset. In this paper, the R/infotheo package is used to estimate the entropy and mutual information”.
4.3. Network Construction
By using the distance matrix, it is possible to build a network where each country is denoted by a node. If d(X,Y) is nonzero, then country i and country j are associated by an undirected link with the weight of W. This resulting network is a complete dependency network for N variables with N(N − 1) edges, representing an interconnection among all countries. Since the size of this network is very large, such a representation will not produce insightful information about the system, such as topology, community, and the most noteworthy countries.
Specific filtering methods have been suggested to further decrease the complexity by creating from the complete network simpler layouts of graphs that can enable analysis. The minimum spanning tree (MST) is a common approach to constituting an informative subgraph of a full network. By keeping only those dependencies that satisfy the MST criterion, it eliminates weak dependencies drastically. This network procedure has been used to examine considerable economic and financial studies (Khashanah and Miao 2011; Mantegna 1999; Vidal-Tomás 2021).
A less severe method of filtering is the Planar Maximally Filtered Graph (PMFG) proposed by Tumminello et al. (2005), which allows for more information regarding the networks to be preserved than the MST. PMFG and MST are both connected and planar graphs in that they can be displayed on a plane such that no links cross one another. In the MST, the N vertices of the subgraph are connected by N − 1 links, while in the PMFG, the number of links is 3 (N − 2). As a result of the construction process, the PMFG contains the MST. A key advantage of PMFG over MST is the loose topological restriction that permits it to preserve more of the information contained in the similarity matrix, such as loops and cliques.
In this work, we first illustrated the results for both filtering approaches to compare the differences between them. Then, PMFG were used for the following analysis.
4.4. Dependency Network and Country Influence
Mutual information describes how much we learn about the EPU of one country from the EPU of another country. It can be considered as the reduction in uncertainty about the EPU of one country because of the knowledge of the EPU of another country. It should be noted, however, that the mutual information does not indicate whether the observed relationship between two countries is ultimately controlled by another country or countries. One way to tackle the problem is to employ the statistical method of partial correlation. This approach may be useful in dealing with issues where there is a possibility of confounding variables affecting the correlation between two variables.
Partial correlation is a statistical technique used to measure the strength and direction of the linear relationship between two variables while controlling for the effect of one or more additional variables (Kenett et al. 2010). In other words, it allows us to assess the correlation between two variables while holding constant the influence of other variables.
Formally, partial correlation is defined as the correlation between two variables, say X and Y, after removing the linear effect of one or more other variables, say Z. Mathematically, it can be expressed as:
where PC(X,Y|Z) represents the partial correlation coefficient between X and Y, controlling for Z, C(X,Y) represents the correlation coefficient between X and Y, and C(X,Z) and C(Y,Z) represent the correlation coefficients between X and Z and Y and Z, respectively (Kenett et al. 2010). The partial correlation coefficient PC(X, Y|Z) ranges between −1 and 1, with a value of 0 indicating no linear relationship between X and Y after controlling for Z, while positive and negative values indicate a positive and negative linear relationship, respectively.
As a way of quantifying the Influence of Z on the pair of X and Y:
We refer to this quantity as the correlation influence, which represents the effect of Z on the pair of elements X and Y. The correlation influence is substantial only when Z can account for a significant portion of the correlation between X and Y. Therefore, in our analysis, we concentrated on significant values of d (X, Y:Z).
The total influence of element j on the correlations between element i and all other elements in the system is defined by (Kenett et al. 2010) as follows:
The dependency matrix D is constructed from the dependencies between variables, where each element D (i, j) represents the dependency of variable i on variable j. Unlike the correlation matrix, the dependency matrix is asymmetric because the influence of variable j on variable i may not be equal to the influence of variable i on variable j. The dependency matrix allows us to create a directed dependency network, which reveals the flow of influence among variables in the system. This network differs from the minimum spanning tree (MST) as it captures directed relationships.
5. Results and Discussion
5.1. Entropy Measures
In this section, we quantified the randomness in economic policy uncertainty indices by utilizing the normalized Shannon entropy. Figure 1 shows the normalized entropy values for the indices. From Figure 1, the Netherlands has the lowest entropy value at 0.461, whereas Greece has the highest value at 0.81. The Netherlands is followed by Ireland (0.482), China (0.505), Spain (0.508), and the USA (0.55), respectively. On the other hand, Greece is followed by the United Kingdom (0.804) and Sweden (0.795). While South America is found to have the highest average entropy value of 0.69, North America has the lowest entropy value of 0.63. The average entropy values for Asia, Europe, and Australia are 0.65, 0.66, and 0.68 in ascending order, respectively.
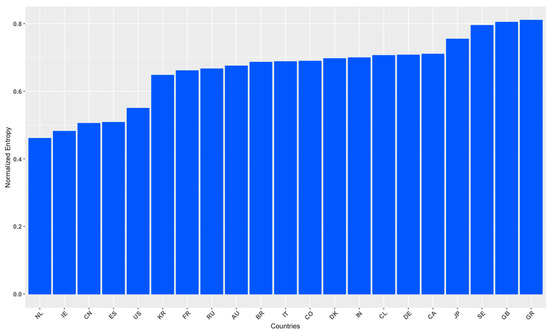
Figure 1.
Normalized entropy values for the countries’ EPUs.
The entropy measure yields a non-negative number to a time series, with higher scores indicating a greater degree of obvious process randomness or serial disorder and lower results indicating more observations of clearly identifiable features or patterns in the data. Consequently, countries with low entropy levels (Netherlands, Ireland, China, Spain, and the United States) are easy to predict, in contrast to countries (Greece, United Kingdom, and Sweden) with high entropy, for which forecasting should need more complicated techniques and algorithms. Korea (0.647), France (0.661), Russia (0.666), Australia (0.675), Brazil (0.686), Italy (0.688), Colombia (0.689), Denmark (0.697), India (0.699), Chile (0.706), Germany (0.707), and Canada (0.709) have very close entropy measures indicating that similar pattern diversity and information content for these countries.
The assessment of the Shannon entropy for EPU data enables us to gauge the level of uncertainty or information embedded within policy uncertainty levels across various countries. When a country’s entropy value is high, it indicates that its policy uncertainty is comprised of a wider range of outcomes or a more diverse distribution of uncertainty. Thus, there is a greater degree of variability or unpredictability in the policy-related events or factors that affect that country. However, if a country has a low entropy value, it implies that its EPU is more concentrated or limited in terms of possible outcomes. This may mean that the policy environment is more stable or predictable, with fewer sources of uncertainty or fewer variations in events related to policy-related events.
Accordingly, high entropy values reflect a greater level of uncertainty and information content, reflecting a wider range of policy-related outcomes and events. A low entropy value, on the other hand, indicates a lower level of uncertainty and a more concentrated distribution of policy uncertainty outcomes. The interpretation of entropy values within the context of EPU facilitates a comparative assessment of the diversity and predictability of policy uncertainty across different countries.
5.2. The Network
The mutual information-based MST and PMFG are shown in Figure 2. A color has been assigned to each country according to its geographical location. Specifically, Australia (grey), South America (green), North America (yellow), Europe (cyan), and Asia (brown).
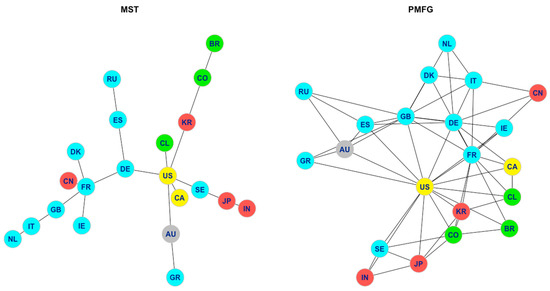
Figure 2.
The mutual information-based MST (left) and PMFG (right) for the economic policy uncertainty indices of 21 countries.
The analysis reveals significant patterns of geographic connectivity in both networks, underscoring the influential role of US policymaking on a global scale. Within the PMFG network, a noteworthy observation is the close association between uncertainty levels in North America and South America. Additionally, there is evidence of interdependence among European countries, with uncertainty in one nation closely linked to that of others. Notably, France’s policymaking uncertainty exerts a crucial influence within the European region. Direct linkages between the US and several European countries, namely Germany, France, the United Kingdom, Sweden, and Spain, are evident, with other European nations indirectly connected to the US via these intermediary countries.
Examining the MST network, it becomes apparent that Korea stands as the sole country directly linked to the United States. However, upon closer examination using the PMFG approach, it is discovered that Korea, along with India and Japan, also maintains direct connections with the United States. Moreover, compelling evidence indicates that Chinese policy uncertainty exhibits a stronger association with European policy uncertainty than with the policy uncertainties of other nations.
When comparing our study’s findings with those of (Marfatia et al. 2020), we observed noteworthy similarities and variations. They identified uncertainty in German policymaking as playing the most crucial role in the European region. However, our analysis using the PMFG network reveals a different outcome, indicating that this role is assumed by France as the number of networked connections expands.
Furthermore, they found that Asian economies were not directly linked to the United States and were more closely connected to European economies, based solely on the MST network. In contrast, our examination using the PMFG network demonstrates that Asian economies, with the exception of China, are directly associated with US economic and political uncertainty.
Another distinct finding is that France and the United Kingdom are influenced by shocks originating from the United States through Germany. In contrast, within the PMFG framework, it becomes apparent that these countries establish direct connections with the USA. These discrepancies may arise from the broader data set employed in our study and methodological variances. Marfatia et al. (2020) utilized the monthly EPU index developed by Baker et al. (2016) for a sample period spanning from January 1998 to May 2018, encompassing 17 leading developed and emerging economies.
5.3. Network Centrality Measures
In network analysis, centrality indices are used to measure the importance of nodes in a network. Many metrics have been proposed to measure centrality for network analysis since importance can be interpreted differently depending on the context. Most centrality measures are associated with social network analysis, and many of the terms used to describe centrality indicate their origins in sociology. This method can be applied in many different ways outside of social media network analysis, notably biology, computer science, urban networks, physics, finance, the Internet, and the detection of super-spreaders of a disease (Newman 2002).
Identifying contagion within a network is a compelling challenge, particularly in large networks. Nodes within the network assume diverse roles, ranging from active spreaders to neutral entities. The impact of contagion is influenced by the network’s topology, which provides certain nodes with advantages in terms of spreading the contagion. However, it is important to note that there is currently no universal model, formal procedure, or methodology for identifying the optimal measurements in a network (Dey et al. 2019).
The relative importance of a node within a network is ranked based on its centrality indices in the study of network analysis. There has been a wide variety of metrics proposed to measure centrality for network analysis because importance varies depending on the context. We computed four different measures of centrality: degree centrality, closeness centrality, betweenness centrality, and eigenvector centrality. These results are shown in Figure 3. Based on the degree of centrality, the most important country is the one that shares a great deal of information with other countries in the network. By inspecting Figure 3, it is evident that the US has the highest degree of centrality (15 nodes), followed by France (12 nodes), the United Kingdom (11 nodes), and Germany (8 nodes). Global uncertainty is dominated by uncertainty surrounding the economic policies of these four countries. This means these countries can influence the rest of the world in the event of a crisis that would spread shocks throughout the system.
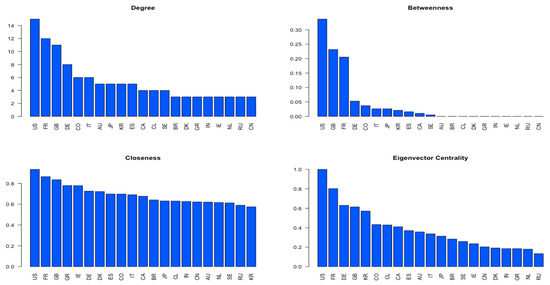
Figure 3.
Centrality scores for the economic policy uncertainty indices of 21 countries: degree (top-left), betweenness (top-right), closeness (bottom-left), eigenvector centrality (bottom-right).
With high betweenness scores, these countries will serve as intermediaries in transferring information between countries in the network. During times of crisis, they spread uncertainty from one tightly connected region to another region. For a weighted network, betweenness centrality is measured as follows:
where refers to the number of shortest paths connecting node and , and is the number of shortest paths from to passing though node v (Freeman 1977). The results from betweenness centrality indicate that the USA has the highest betweenness score, followed by the United Kingdom and France.
Based on the evidence, Korea and Russia’s policy uncertainties are least closely linked to uncertainties worldwide, while the USA, France, and the United Kingdom have relatively higher closeness scores and, therefore, are most closely linked to the PMFG.
Eigenvector centrality is a natural extension of degree centrality; however, beyond first-degree ties, it calculates the number of links their connections have, etc. (Bonacich 1987). This metric is particularly useful if a node is connected to nodes with a high degree yet has a low degree, thus having an indirect influence on other nodes. In eigenvector analysis, a high score indicates that a node is connected to other nodes with high scores. A node with a high degree score may not necessarily have a relatively high eigenvector centrality score if most of those links involve low-scoring ones.
Eigenvector centrality considers not only the direct connections of a country but also the connections of its neighboring countries. It assigns a higher centrality score to a country if it is connected to other influential countries. By employing eigenvector centrality, we can determine countries that have a significant impact on the overall network dynamics. A country with a high eigenvector centrality score is not only directly connected to other important countries but is also connected to countries that themselves have high centrality. This indicates that the influence of the country ripples through the network, affecting other countries that are closely connected to it.
High eigenvector centrality indicates that a country has strong connections to other important and influential countries in the network. These connections represent potential channels for the transmission of shocks or spillover effects. Understanding the pattern of eigenvector centrality helps identify the pathways through which economic disturbances can propagate and affect other parts of the network. Clearly, the eigenvector centrality of the USA is the highest, followed by France.
The countries with low centrality scores may have less influence on the overall network dynamics and may provide a certain degree of insulation from systemic risks or spillover effects. They may be considered more resistant to external shocks and more dependent on local factors. Russia, Netherlands, and China are some examples in this case.
5.4. Network Community Structure
On the mesoscopic level, one can determine clusters of nodes that are strongly linked within each other but weakly linked with the remainder of the network. Interconnected groups are often referred to as communities, and they can exist in any number of different networks (Newman 2003).
Uncovering an underlying community structure in a network is essential for a few reasons. Firstly, an organization of the internal network at the coarse grain level becomes visible. The additional information obtained from this allows for the inference of special relationships between nodes that may not be as easily observable directly from empirical tests. Secondly, as individual communities act like meta-nodes in a network, we can use them to map large networks. Finally, it enables us to comprehend the characteristics of dynamic processes that occur in networks, such as the spread of disease and the diffusion of innovation (Fortunato 2010).
Several algorithms have been designed to identify communities. In this work, the edge-betweenness algorithm (EBC) is applied, in which communities are detected by iteratively removing edges with the largest betweenness scores to split a network into a hierarchy of nested communities (Newman 2004).
Figure 4 shows the discovered community structures of economic policy uncertainty across 21 developed and emerging economies. The colors correspond to the best partition found by optimizing the modularity of Newman (2002, 2003, 2004). Communities are also represented by the dendrogram, or hierarchical tree. Cutting the dendrogram horizontally corresponds to dividing the network into communities. The results of the community structure detection reveal that there are six communities. Based on the result, it appears that the communities recognize geographical ties between indices, with indices located in the same region connected to each other. While it appears that the communities recognize geographical ties between indices, some countries cluster with other countries located in different regions: Greece has her own cluster; Chile, South Korea, Republic of Ireland cluster with countries in North America; China is part of the European cluster and is tightly composed by European countries; Sweden is part of Asian cluster; the most interesting cluster is composed of Russia, the United Kingdom, Spain, Australia.
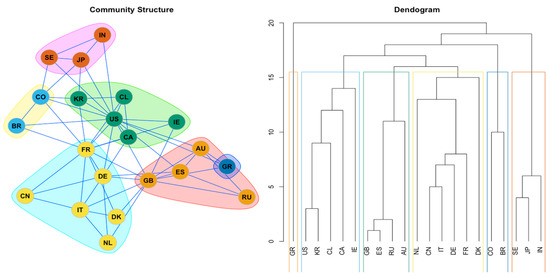
Figure 4.
Community structure in the economic policy uncertainty indices network. Note: Colors correspond to the best partition found by optimizing the modularity of Newman (2002, 2003, 2004).
5.5. Dependency Network Analysis
The heat map in Figure 5 displays the dependency matrix of the complete data, where lighter colors represent higher dependency values. The matrix captures the influence of one country’s economic policy uncertainty (EPU) on the correlation between another country’s EPU and all other countries’ EPUs. The range of dependency matrix values lies between 0 and 0.1487. The figure highlights the prominent position of the US EPU in the dependency matrix, indicated by its highest net information flow (both incoming and outgoing). Among the countries receiving the most information from the US, Korea (0.149), Germany (0.134), Canada (0.129), France (0.127), Australia (0.125), and the United Kingdom (0.121) stand out as the top recipients.
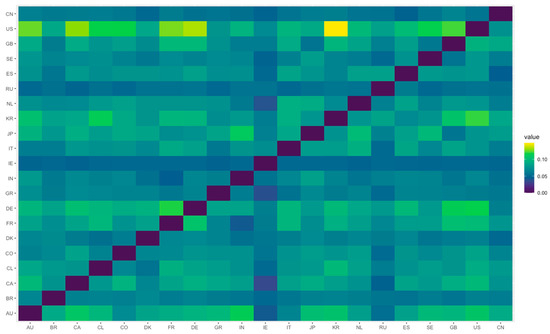
Figure 5.
Heat map of the dependency matrix.
When considering all available information, the dependency matrix can be considered as the complete network consisting of N*(N − 1)*(N − 2)/2 links. However, to simplify the system description and focus on the most robust information regarding the influence of specific countries on the partial-correlation structure, we applied the partial correlation threshold network (PCTN). The PCTN retains correlation influence values, denoted as d(X, Y: Z), that exceed a threshold specific to each influential stock Z. In our study, we chose a threshold value of 0.86 to preserve the top 20% of links with the highest values (Marfatia et al. 2020). This value strikes a balance, being high enough to ensure the PCTN is meaningful yet low enough to prevent excessive filtering resulting from partial correlation selection. Therefore, the selection of links is less affected by statistical uncertainties inherent in partial correlation estimates derived from finite-length time series.
Figure 6 represents the partial correlation threshold network for the 21 EPU data. We maintained the same color assignments for each country based on its geographical location, as performed previously. Figure 6 illustrates that while higher thresholds significantly reduce the number of links in the network, the dominance of the US remains qualitatively consistent. Furthermore, we observed that Russia and Ireland are not linked to any other countries and are disconnected from the rest of the network. It indicates that they do not play a key role in the influence correlations of other pairs, and other countries also do not have an influence on them either.
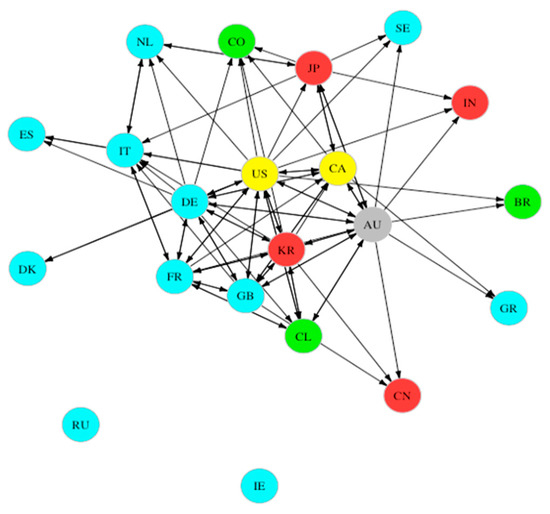
Figure 6.
PCTN of the 21 EPU indices.
In a weighted directed network, each edge or connection between nodes is assigned a weight, which represents the strength or intensity of the relationship. In the context of the partial correlation threshold network (PCTN), we utilized the weighted outdegree measure as an approximation for assessing the influence of a country. Specifically, the weighted outdegree corresponds to the summation of weights associated with the directed links originating from the country and extending outward within the network.
The weighted indegree strength, on the other hand, refers to a measure that quantifies the total incoming weighted connections of a country in the network. The indegree strength of a node is calculated by summing up the weights of all the incoming connections to that node. Significant values of the weighted outdegree signify the substantial influence of a specific country within the system. Conversely, substantial values of the weighted indegree indicate that the country is significantly impacted by the economic uncertainty originating from other countries.
In Figure 7, the weighted indegree and outdegree of each country in the PCPG are displayed. The dominance of the USA, indicated by its highest weighted outdegree, clearly highlights its pivotal role in the system, implying its significant control or influence over other countries.
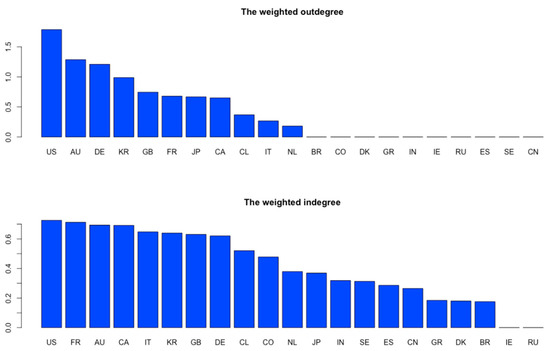
Figure 7.
The weighted outdegrees and indegrees of countries in PCTN.
The difference between the weighted outdegree and the weighted indegree in a directed network is often referred to as the net flow or net influence of a node. It is calculated by subtracting the weighted indegree from the weighted outdegree. The net flow provides a measure of the overall influence or impact that a node has on the network, considering both the influence it exerts on other nodes (outdegree) and the influence it receives from other nodes (indegree). A positive net flow indicates that the node has a greater influence on the network, while a negative net flow suggests that the node is more influenced by other nodes than it influences them. In this context, the USA, Australia, Germany, South Korea, Japan, and the United Kingdom exert influence on the global EPU environment with a positive net dependence. Conversely, EPU levels of Colombia, Italy, India, Sweden, Spain, China, Netherlands, Greece, Denmark, Brazil, Chile, Canada, and France exhibit a negative net dependence, suggesting that these countries are influenced by external conditions or factors originating from other regions of the world. The findings of our study indicate that the United Kingdom exhibits characteristics of a net transmitter of information, contrary to the assertion made by Marfatia et al. (2020), suggesting the United Kingdom is a net receiver of policy uncertainty. The observed discrepancy in outcomes can potentially be attributed to the broader time span and more extensive inclusion of countries in our investigation compared to their study. Consequently, a more comprehensive understanding of the United Kingdom’s economic policy uncertainty (EPU) unfolds when considering the global spillover dynamics and incorporating a larger number of countries in the analysis.
6. Conclusions
As digitalization and globalization have intensified, each country’s economic and financial systems are becoming increasingly interconnected. As a result, the uncertainties and risks associated with the economies and financial systems of various countries impact those of other countries as well. Through this process, known as financial contagion, countries are more vulnerable to external crises. The purpose of this study is to identify the extent of contagion of economic policies between countries. By using information theory, in contrast to the studies in the literature, this study attempted to determine the hierarchy of degrees of randomness in the EPU indices. Obviously, there will be a situation involving maximum randomness, making it impossible to predict, but there will also be other situations with varying degrees of randomness, allowing us to order the data series using their complexity. This task can be carried out with the help of information theory. The information flow between the EPU indices was also investigated using the mutual information metric, and then these information flows were graphed using network theory to illustrate these relationships. Finally, the community detection analysis was conducted, and the countries were clustered based on the strength of the relationship between the EPU indices. In this respect, the study provides an original contribution to the literature.
By utilizing the EPU index data of 21 countries whose data were collected between 1997 and 2021, the research objective was to reveal the relationship between uncertainty in economic policies using entropy, complex networks, and mutual information. Entropy measures indicate that Netherlands and Ireland’s EPU indices are more predictable than other countries’ indices, i.e., they have less randomness than other indices. In contrast, the predictability of the EPU indices of Greece and the United Kingdom is lower than those of other countries. As a result of the complex network analysis, the relationship between the EPU indices was generally shaped by their geographic location. The US EPU index became the leading index with the strongest correlation with other EPU indices. In order of significance, the US EPU index is followed by the EPU indices of France, the United Kingdom, and Germany. The clustering analysis revealed six clusters. As a result of cluster analysis, Greece has been determined to have its own cluster. It was found that clustering is primarily formed by geographical relationships.
6.1. Policy Implication
The findings of the analysis suggest there is a serious contagion between the economic policies of the countries. This implies that no country is truly isolated from the global economic network. For instance, given the synchronization of the global economy, the decision(s) of leading developed countries such as the US central bank, i.e., the Federal Reserve System (FED), or the international apex organizations like the Organization of the Petroleum Exporting Countries (OPEC) plays a significant role in global economic policy, thus considered a critical factor contributing to global (un)certainty. The economic policies of the United States are observed to have serious influences on the economic policies of other countries. Consequently, it is crucial that policymakers in other countries take US policies into account when making decisions. Moreover, the analysis indicates that the uncertainties in the economic policies of the countries may be internal or external. As a result, authorities and policymakers need to closely monitor the contagion between countries’ economic policy uncertainties and develop modern measurement techniques and risk management strategies to assess the extent of this risk. In order to protect against these risks, policymakers should pay close attention to external uncertainties. A strong policy stance against such uncertainties has the potential to eliminate their negative effects on domestic economic activity.
6.2. Limitations and Future Recommendations
Although the result reveals important results for portfolio management, the investigation is without some limitations. For instance, the inclusion of financial assets from countries with weak contagion will reduce the portfolio’s risk, especially the systematic risk. In the future, studies will be conducted to reveal the effects of contagion between EPU indices on financial assets in the relevant countries. Additionally, utilizing the EPU to assess potential contagion among global economies has been critiqued on the basis that (i) the EPU indices are based on news reporting of events, and (ii) the news-based EPU indicators are only available for a limited number of countries. Future studies and implementation could utilize other economic and macroeconomic-based indicators, especially those that are not merely based on reports of news and event. Moreover, other complementary approaches, such as that of Diebold and Yilmaz (2012), could also be incorporated into future consideration.
Author Contributions
Conceptualization, S.A. (Serkan Alkan) and S.A. (Saffet Akdağ); Methodology, S.A. (Saffet Akdağ); Software, S.A. (Serkan Alkan); validation, S.A. (Serkan Alkan), S.A. (Saffet Akdağ) and A.A.A.; Formal analysis, S.A. (Serkan Alkan); Investigation S.A. (Serkan Alkan); Resources, S.A. (Serkan Alkan); Data curation, S.A. (Serkan Alkan); Writing—original draft preparation, S.A. (Serkan Alkan) and S.A. (Saffet Akdağ); Writing—review and editing, S.A. (Serkan Alkan), S.A. (Saffet Akdağ), and A.A.A.; Visualization, S.A. (Serkan Alkan) and A.A.A. All authors have read and agreed to the published version of the manuscript.
Funding
This research received no external funding.
Informed Consent Statement
Not applicable.
Data Availability Statement
Data declaration and information has been provided in the manuscript.
Conflicts of Interest
The authors declare no conflict of interest.
References
- Abakah, Emmanuel Joel Aikins, Guglielmo Maria Caporale, and Luis Alberiko Gil-Alana. 2021. Economic policy uncertainty: Persistence and cross-country linkages. Research in International Business and Finance 58: 101442. [Google Scholar] [CrossRef]
- Akadiri, Seyi Saint, Andrew Adewale Alola, and Gizem Uzuner. 2020. Economic policy uncertainty and tourism: Evidence from the heterogeneous panel. Current Issues in Tourism 23: 2507–14. [Google Scholar] [CrossRef]
- Antonakakis, Nikolaos, David Gabauer, Rangan Gupta, and Vasilios Plakandaras. 2018. Dynamic connectedness of uncertainty across developed economies: A time-varying approach. Economics Letters 166: 63–75. [Google Scholar] [CrossRef]
- Bai, Lan, Xuhui Zhang, Yuntong Liu, and Qian Wang. 2019. Economic risk contagion among major economies: New evidence from EPU spillover analysis in time and frequency domains. Physica A: Statistical Mechanics and Its Applications 535: 122431. [Google Scholar] [CrossRef]
- Baker, Scott R., Nicholas Bloom, and Steven J. Davis. 2016. Measuring economic policy uncertainty. The Quarterly Journal of Economics 131: 1593–636. [Google Scholar] [CrossRef]
- Baruník, Jozef, and Tomáš Křehlík. 2018. Measuring the frequency dynamics of financial connectedness and systemic risk. Journal of Financial Econometrics 16: 271–96. [Google Scholar]
- Bonacich, Phillip. 1987. Power and centrality: A family of measures. American Journal of Sociology 92: 1170–82. [Google Scholar] [CrossRef]
- Cui, Jinxin, and Huiwen Zou. 2020. Connectedness among economic policy uncertainties: Evidence from the time and frequency domain perspectives. Journal of Systems Science and Information 8: 401–33. [Google Scholar] [CrossRef]
- Dey, Paramita, Agneet Chaterjee, and Sarbani Roy. 2019. Influence maximization in online social network using different centrality measures as seed node of information propagation. Sadhana–Academy Proceedings in Engineering Sciences 44: 205. [Google Scholar] [CrossRef]
- Diebold, Francis X., and Kamil Yilmaz. 2012. Better to give than to receive: Predictive directional measurement of volatility spillovers. International Journal of Forecasting 28: 57–66. [Google Scholar] [CrossRef]
- Diebold, Francis X., and Kamil Yilmaz. 2014. On the network topology of variance decompositions: Measuring the connectedness of financial firms. Journal of Econometrics 182: 119–34. [Google Scholar] [CrossRef]
- Diebold, Francis X., and Kamil Yilmaz. 2015. Trans-Atlantic equity volatility connectedness: US and European financial institutions, 2004-–2014. Journal of Financial Econometrics 14: 81–127. [Google Scholar]
- Ebrahimi, Nader, Esfandiar Maasoumi, and Ehsan S. Soofi. 1999. Ordering univariate distributions by entropy and variance. Journal of Econometrics 90: 317–36. [Google Scholar] [CrossRef]
- Fiedor, Paweł. 2014. Networks in financial markets based on the mutual information rate. Physical Review E-Statistical, Nonlinear, and Soft Matter Physics 89: 052801. [Google Scholar] [CrossRef]
- Fortunato, S. 2010. Community detection in graphs. Physics Reports 486: 75–174. [Google Scholar] [CrossRef]
- Freeman, Linton C. 1977. A set of measures of centrality based on betweenness. Sociometry 40: 35–41. [Google Scholar] [CrossRef]
- Kang, Sang Hoon, and Seong-Min Yoon. 2019. Dynamic connectedness network in economic policy uncertainties. Applied Economics Letters 26: 74–78. [Google Scholar] [CrossRef]
- Kenett, Dror Y., Michele Tumminello, Asaf Madi, Gitit Gur-Gershgoren, Rosario N. Mantegna, and Eshel Ben-Jacob. 2010. Dominating clasp of the financial sector revealed by partial correlation analysis of the stock market. PLoS ONE 5: 15032. [Google Scholar] [CrossRef]
- Khashanah, Khaldoun, and Linyan Miao. 2011. Dynamic structure of the US financial systems. Studies in Economics and Finance 28: 321–39. [Google Scholar] [CrossRef]
- Klößner, Stefan, and Rodrigo Sekkel. 2014. International spillovers of policy uncertainty. Economics Letters 124: 508–12. [Google Scholar] [CrossRef]
- Kraskov, Alexander, Harald Stögbauer, Ralph G. Andrzejak, and Peter Grassberger. 2005. Hierarchical clustering using mutual information. EPL (Europhysics Letters) 70: 278. [Google Scholar] [CrossRef]
- Liow, Kim Hiang, Wen-Chi Liao, and Yuting Huang. 2018. Dynamics of international spillovers and interaction: Evidence from financial market stress and economic policy uncertainty. Economic Modelling 68: 96–116. [Google Scholar] [CrossRef]
- Mantegna, Rosario N. 1999. Hierarchical structure in financial markets. The European Physical Journal B 11: 193–97. [Google Scholar] [CrossRef]
- Marfatia, Hardik, Wan-Li Zhao, and Qiang Ji. 2020. Uncovering the global network of economic policy uncertainty. Research in International Business and Finance 53: 101223. [Google Scholar] [CrossRef]
- Newman, Mark E. J. 2002. The structure and function of networks. Computer Physics Communications 147: 40–45. [Google Scholar] [CrossRef]
- Newman, Mark E. J. 2003. Mixing patterns in networks. Physical Review E 67: 26126. [Google Scholar] [CrossRef]
- Newman, Mark E. J. 2004. Detecting community structure in networks. European Physical Journal B 38: 321–30. [Google Scholar] [CrossRef]
- Osei, Prince Mensah, Reginald Djimatey, and Anokye M. Adam. 2021. Economic policy uncertainty linkages among asian countries: Evidence from threshold cointegration approach. Discrete Dynamics in Nature and Society 2021: 6656176. [Google Scholar] [CrossRef]
- Polat, Onur. 2021. Time-Varying Network Connectedness of G-7 Economic Policy Uncertainties: A Locally Stationary TVP-VAR Approach. World Journal of Applied Economics 7: 27–59. [Google Scholar] [CrossRef]
- Shannon, Claude Elwood. 1948. A Mathematical Theory of Communication. Bell System Technical Journal 27: 379–423. [Google Scholar] [CrossRef]
- Song, Lin, Peter Langfelder, and Steve Horvath. 2012. Comparison of co-expression measures: Mutual information, correlation, and model based indices. BMC Bioinformatics 13: 1–21. [Google Scholar] [CrossRef] [PubMed]
- Tiwari, Aviral Kumar, Micheal Kofi Boachie, and Rangan Gupta. 2021. Network analysis of economic and financial uncertainties in advanced economies: Evidence from graph-theory. Advances in Decision Sciences 25: 188–215. [Google Scholar]
- Tumminello, Michele, Tomaso Aste, Tiziana Di Matteo, and Rosario N. Mantegna. 2005. A tool for filtering information in complex systems. Proceedings of the National Academy of Sciences 102: 10421–26. [Google Scholar]
- Vidal-Tomás, David. 2021. Transitions in the cryptocurrency market during the COVID-19 pandemic: A network analysis. Finance Research Letters 43: 101981. [Google Scholar] [CrossRef] [PubMed]
- Yang, L. I., Jingqiu Luo, and Yongmu Jiang. 2021. Policy uncertainty spillovers and financial risk contagion in the Asia-Pacific network. Pacific-Basin Finance Journal 67: 101554. [Google Scholar]
- Zhou, Yuqin, Zhenhua Liu, and Shan Wu. 2022. The global economic policy uncertainty spillover analysis: In the background of COVID-19 pandemic. Research in International Business and Finance 61: 101666. [Google Scholar] [CrossRef]


Disclaimer/Publisher’s Note: The statements, opinions and data contained in all publications are solely those of the individual author(s) and contributor(s) and not of MDPI and/or the editor(s). MDPI and/or the editor(s) disclaim responsibility for any injury to people or property resulting from any ideas, methods, instructions or products referred to in the content. |
© 2023 by the authors. Licensee MDPI, Basel, Switzerland. This article is an open access article distributed under the terms and conditions of the Creative Commons Attribution (CC BY) license (https://creativecommons.org/licenses/by/4.0/).