Resilience Factors of Ukrainian Micro, Small, and Medium-Sized Business
Abstract
1. Introduction
2. Literary Review
3. Methodology
- (1)
- One-way ANOVA and a t-test with a statistical significance of 5% are used to check the statistical significance of the differences; ANOVA (Thomsen et al. 2013) factor analysis is used to determine the differences between the number of two groups of entrepreneurs (like gender difference). The t-test and ANOVA are analytical methods used to determine whether there is a significant difference between groups. The t-test compares the means of two groups, assessing whether any observed difference is statistically significant or likely due to chance. ANOVA, on the other hand, is used when comparing the means across multiple groups to identify any significant differences among them (Student 1908).
- (2)
- Descriptive statistics are used to assess the difference in levels and diversity within data sets because many observations are physically unavailable for analysis using a graph or table.
- (3)
- The Wilcoxon rank-sum test (McCullough 2004) is used to assess differences in responses between two groups (e.g., gender) by testing the null hypothesis that both subgroups are independent samples drawn from the same overall distribution. If the test rejects the null hypothesis, the alternative hypothesis suggests that the values in one group tend to differ significantly from those in the other group.
- (4)
- In analyzing conditional independence between series within a group, EViews presents measures of association for each conditional table in a tabular format. These measures function similarly to correlation coefficients, where a higher measure indicates a stronger association between the row and column series in the table. Alongside the Pearson χ2 statistic for the table, EViews also reports three additional measures of association:
- (1)
- Limitation of Sample Representation (while the study covered a relatively large number of enterprises (696), the sample may not fully represent all sectors and regions of Ukraine).Decision to solve: to address this, we ensured diverse geographic and sectoral representation within the sample, though further stratification could improve generalizability.
- (2)
- Limitation of Self-Reported Data (the research relied on a direct questionnaire method, which inherently carries the risk of response bias).Decision to solve: to minimize this, the survey design included carefully structured, neutral questions to reduce subjectivity, and multiple-choice options were validated to align with the research objectives.
- (3)
- Limitation of Temporal Constraints (the data collection period (December 2023 to January 2024) reflects a snapshot of the ongoing challenges faced by SMEs. The rapidly changing economic and geopolitical landscape in Ukraine may limit the applicability of findings over time).Decision to solve: we recognize this limitation and suggest future studies adopt a longitudinal approach to capture evolving trends.
- (4)
- Limitation of Specificity of Context (the study focuses on SMEs within the unique context of Ukraine, particularly during a time of war and economic turbulence. While this provides valuable insights, it limits the generalization of results to other countries or contexts).Decision to solve: further comparative studies across different economies could provide a broader perspective.
- (5)
- Limitation of Data Interpretation (the statistical analysis tested 10 hypotheses but relied on aggregated data, which might overlook nuanced differences among micro, small, and medium enterprises).Decision to solve: we conducted subgroup analyses where feasible and clarified in the discussion that variations among subcategories should be interpreted cautiously.
4. Data Description
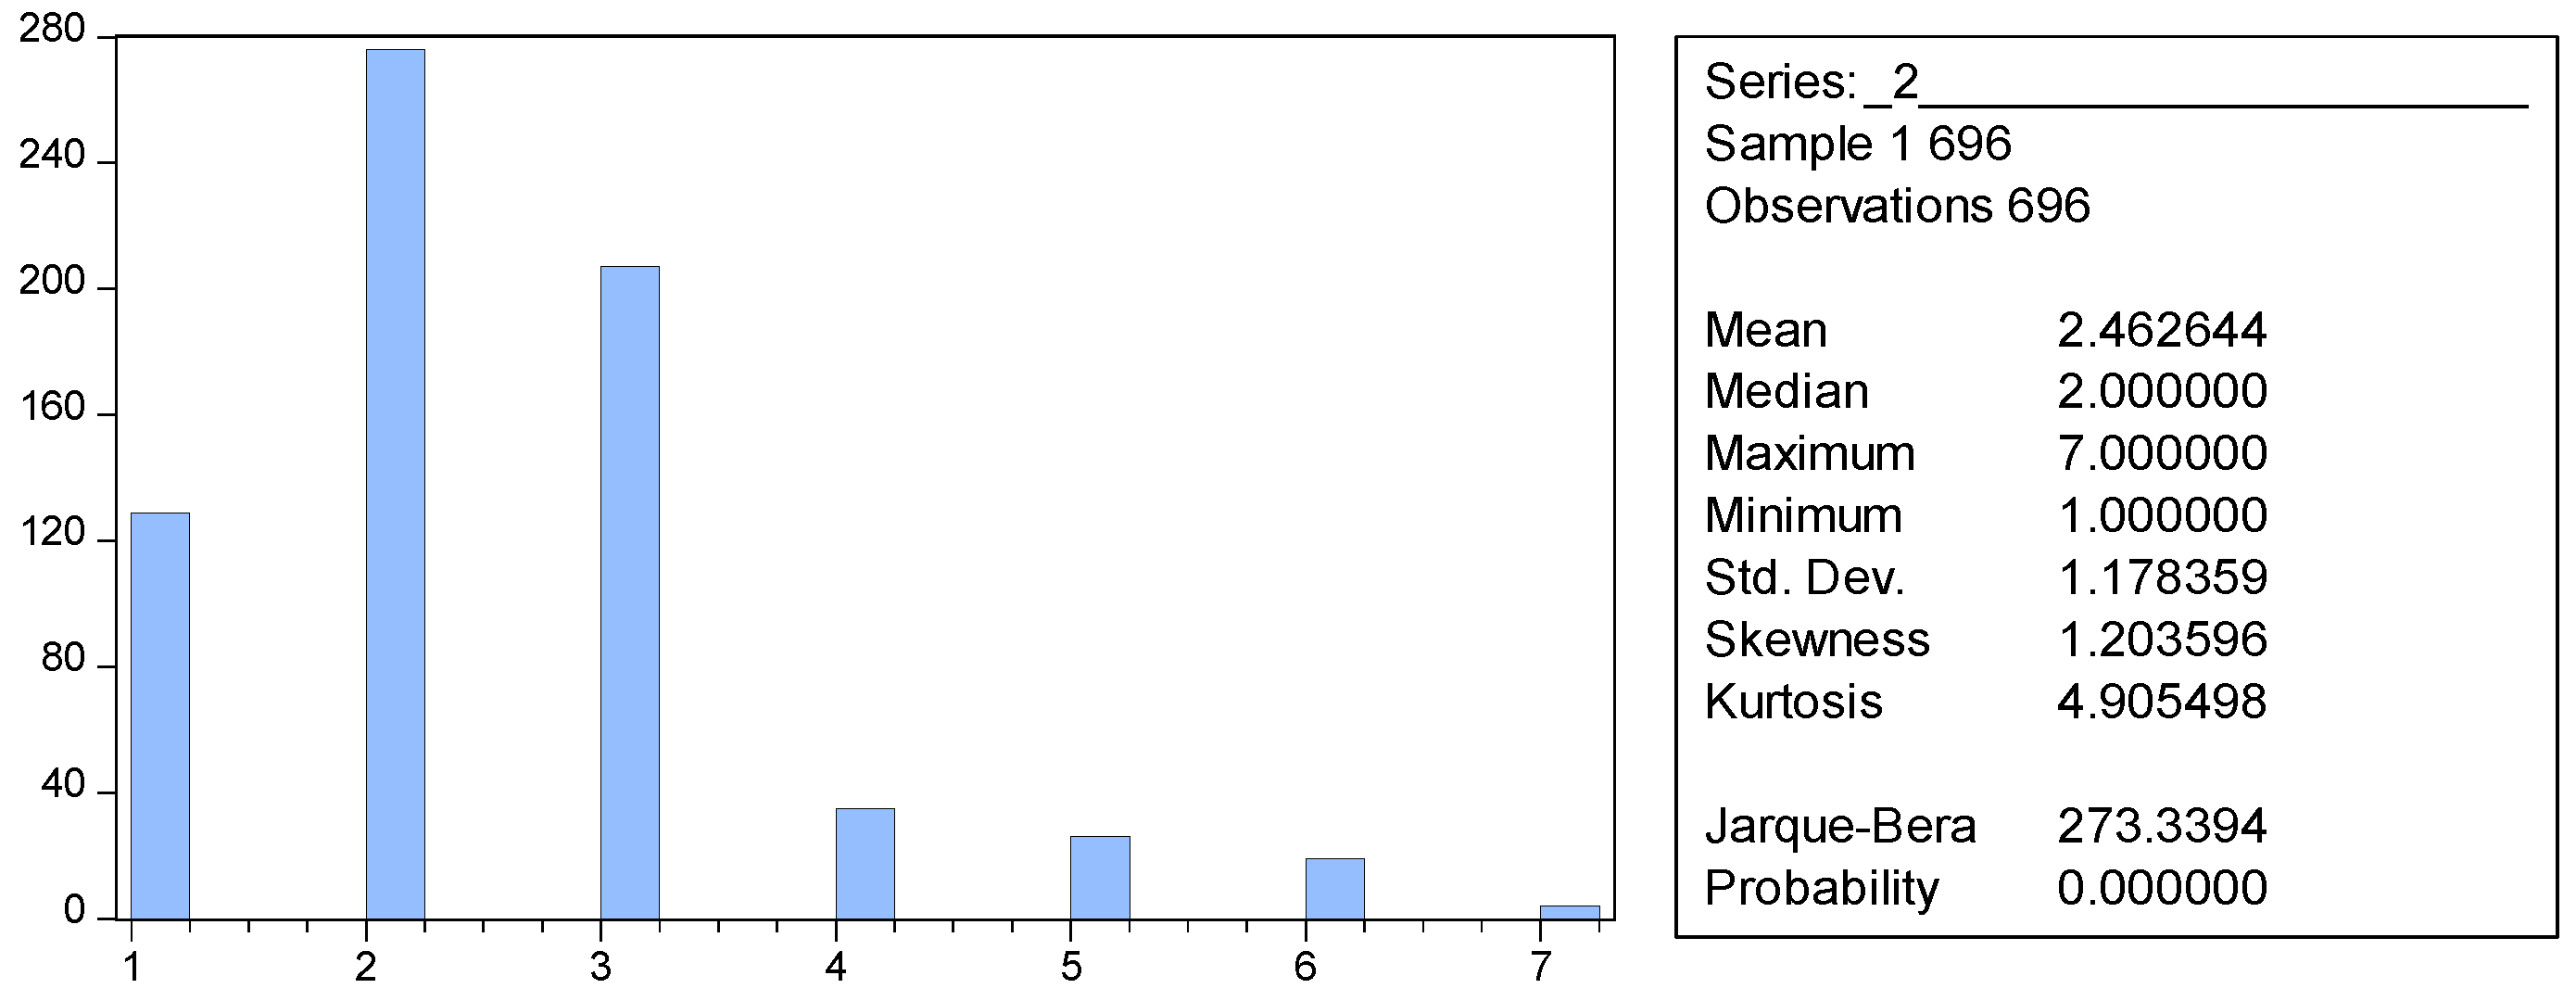
- (1)
- Maturity: we can see (Figure 1) that in general, the distribution of the surveyed enterprises by the year of establishment does not correspond to a normal distribution (as shown by the Jarque–Bera test); with slight variability, enterprises from the 2000–2013 year of establishment prevail.
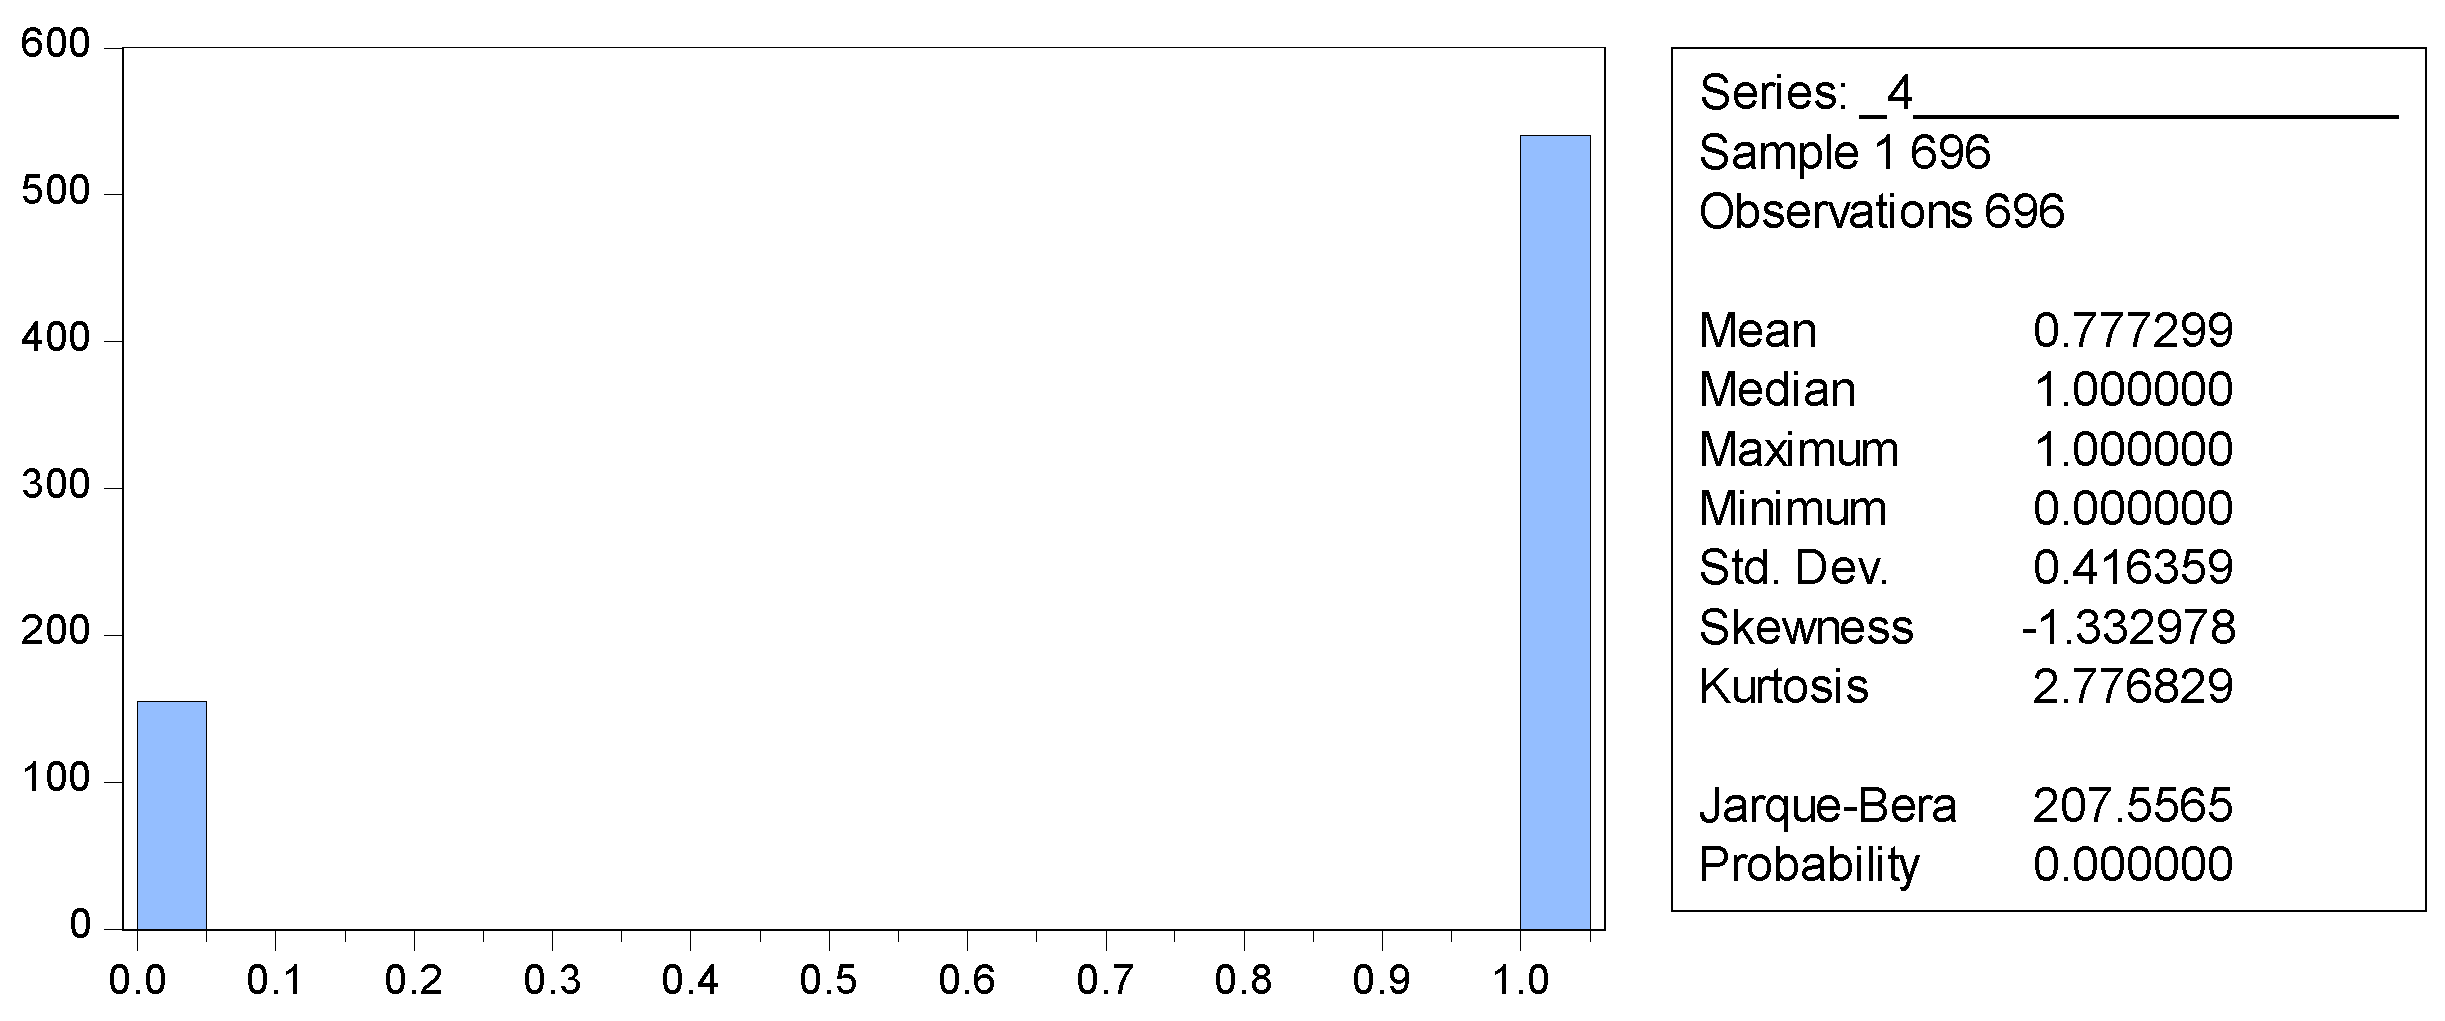
- (2)
- Gender: we can see (Figure 2) that in general, the distribution of surveyed enterprises by the gender of the owner does not correspond to a normal distribution (as shown by the Jarque–Bera test); with slight variability, enterprises with male management prevail.
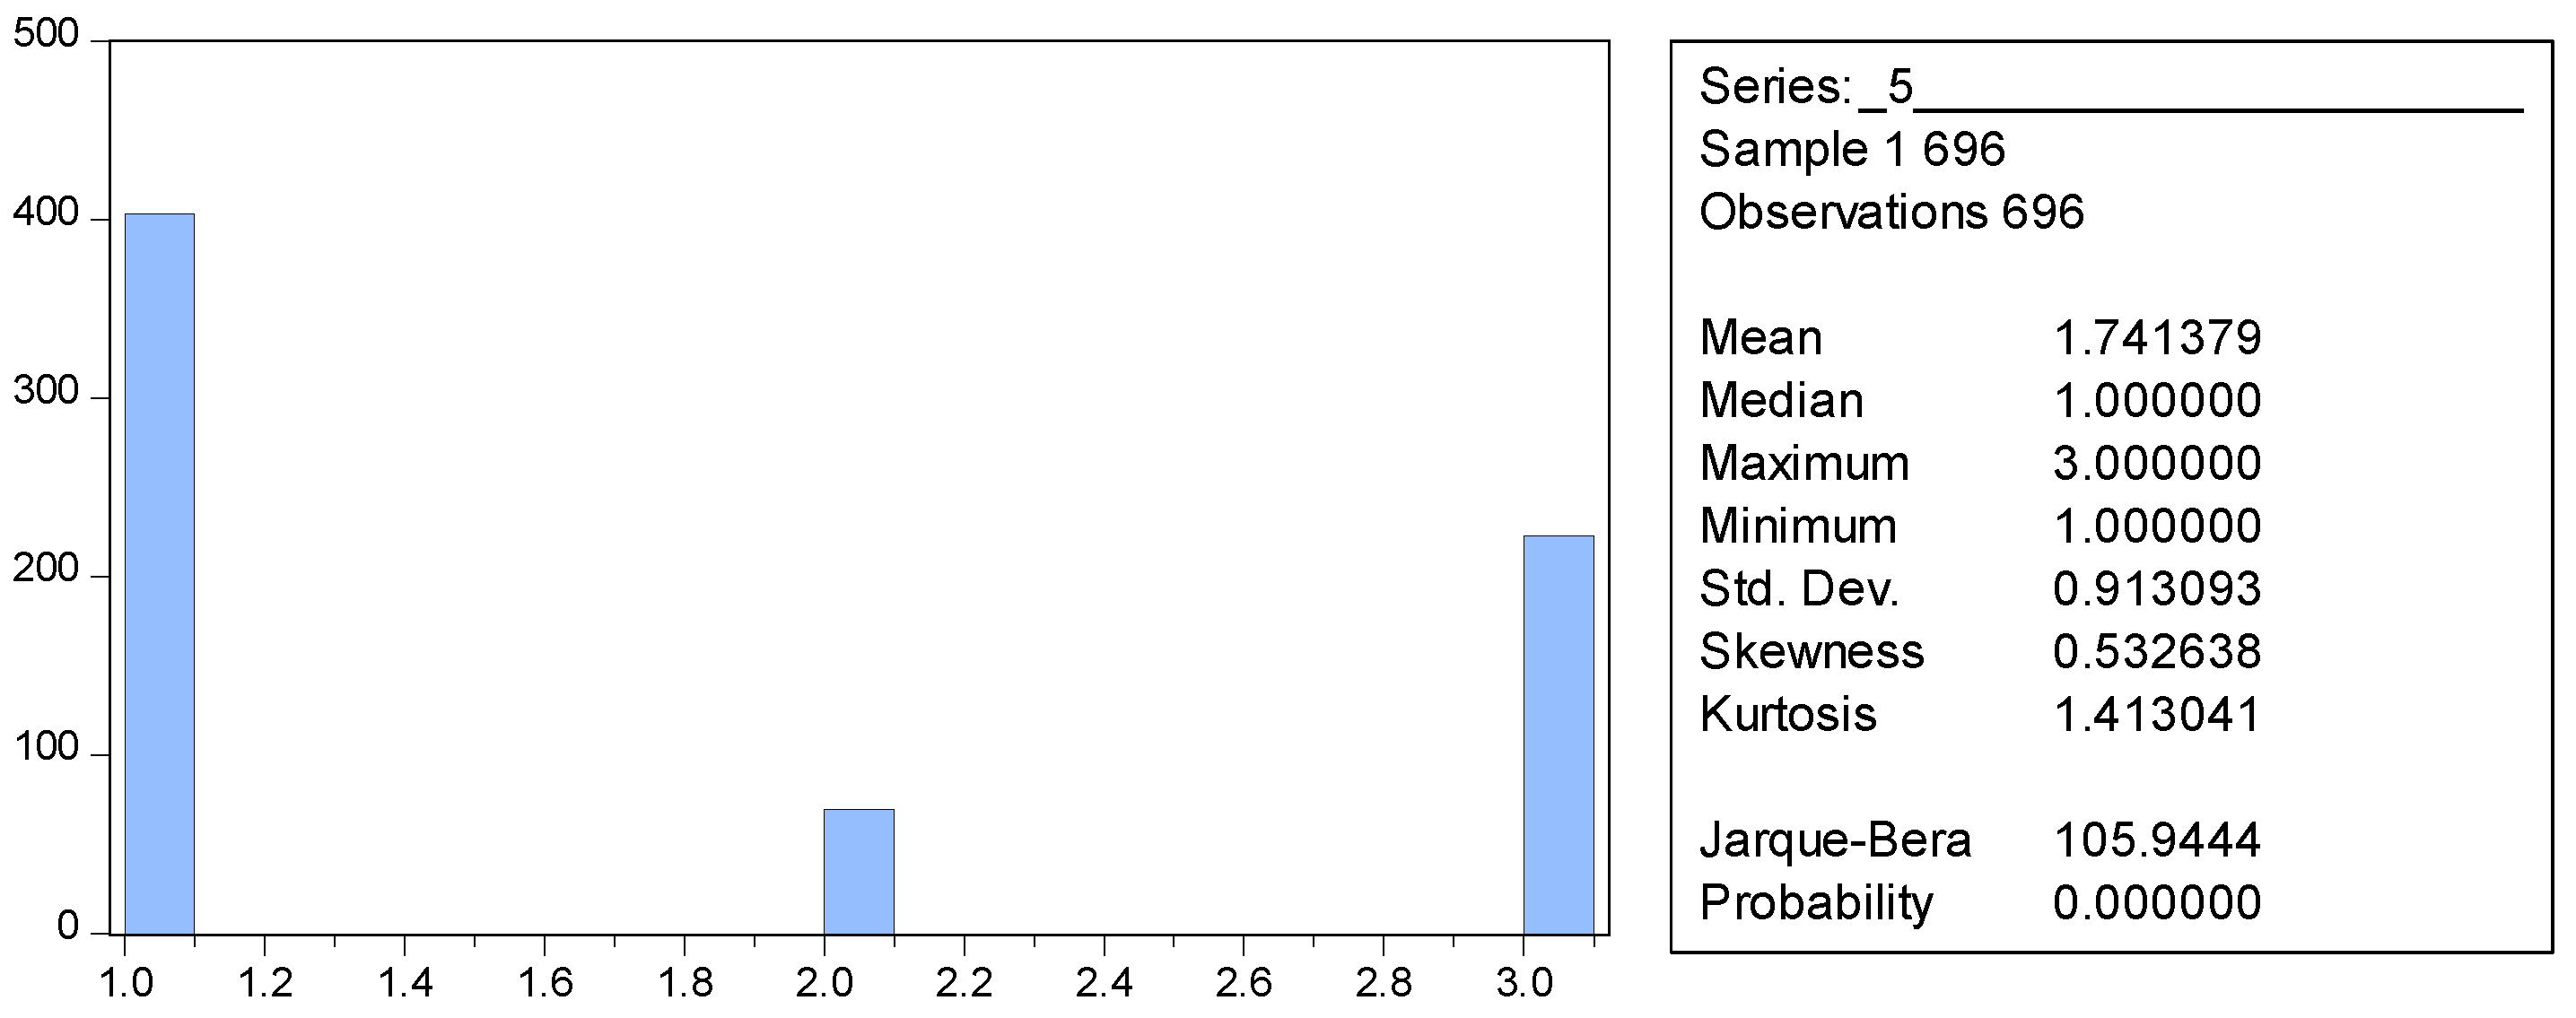
- (3)
- Region: we can see (Figure 3) that in general, the distribution of surveyed enterprises by location as of the beginning of the full-scale war does not correspond to a normal distribution (as shown by the Jarque–Bera test); with slight variability, enterprises with a regional presence prevail.
- (4)
- Taxation: we can see (Figure 4) that in general, the distribution of surveyed enterprises by the form of taxation does not correspond to a normal distribution (as shown by the Jarque–Bera test); with slight variability, enterprises with the single tax and the VAT prevail.
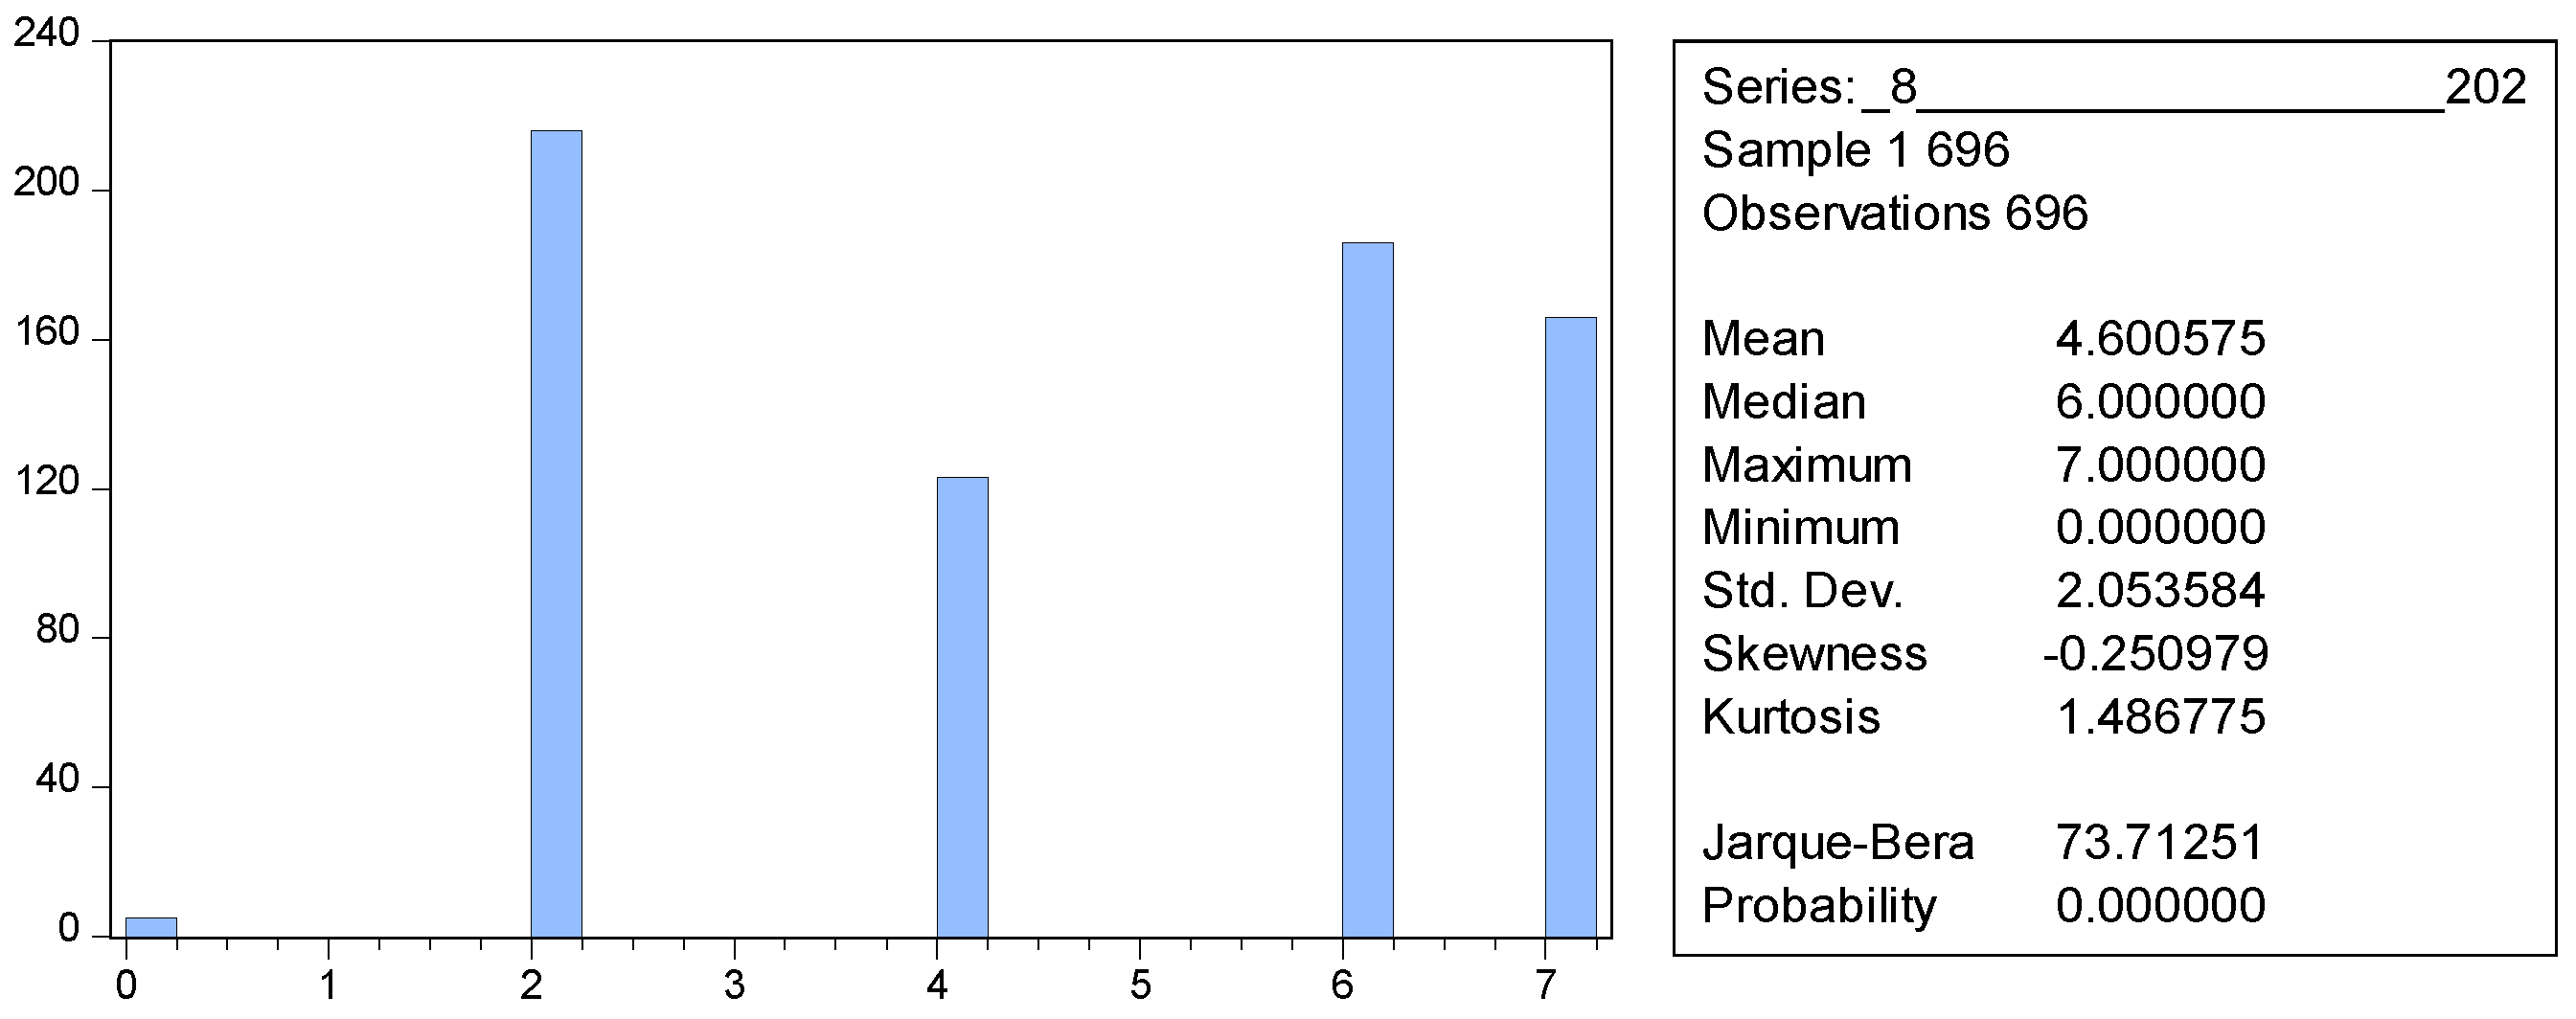
- (5)
- Turnover: we can see (Figure 5) that in general, the distribution of surveyed enterprises by turnover volume does not correspond to a normal distribution (as shown by the Jarque–Bera test); with fairly insignificant variability, enterprises with UAH 5–10 million prevail.
- (6)
- Workforce: we can see (Figure 6) that in general, the distribution of surveyed enterprises by the number of employees does not correspond to a normal distribution (as shown by the Jarque–Bera test); with fairly insignificant variability, enterprises with 6–10 employees prevail.
- (7)
- Cancelation: in general, the majority of surveyed companies suspended their activities, but for less than 1 month (Figure 7).
- (8)
- Internationalization: most of the companies that took part in the survey had not been involved in international partnerships either before or during the full-scale invasion (Table 1).

- (1)
- Reduction in personnel: if in 2023, most companies noted that, compared to the period before the full-scale invasion, there was an insignificant reduction in personnel (−10%), then in 2023, compared to 2022, the number of personnel remained unchanged for the most part (Table 2).
- (2)
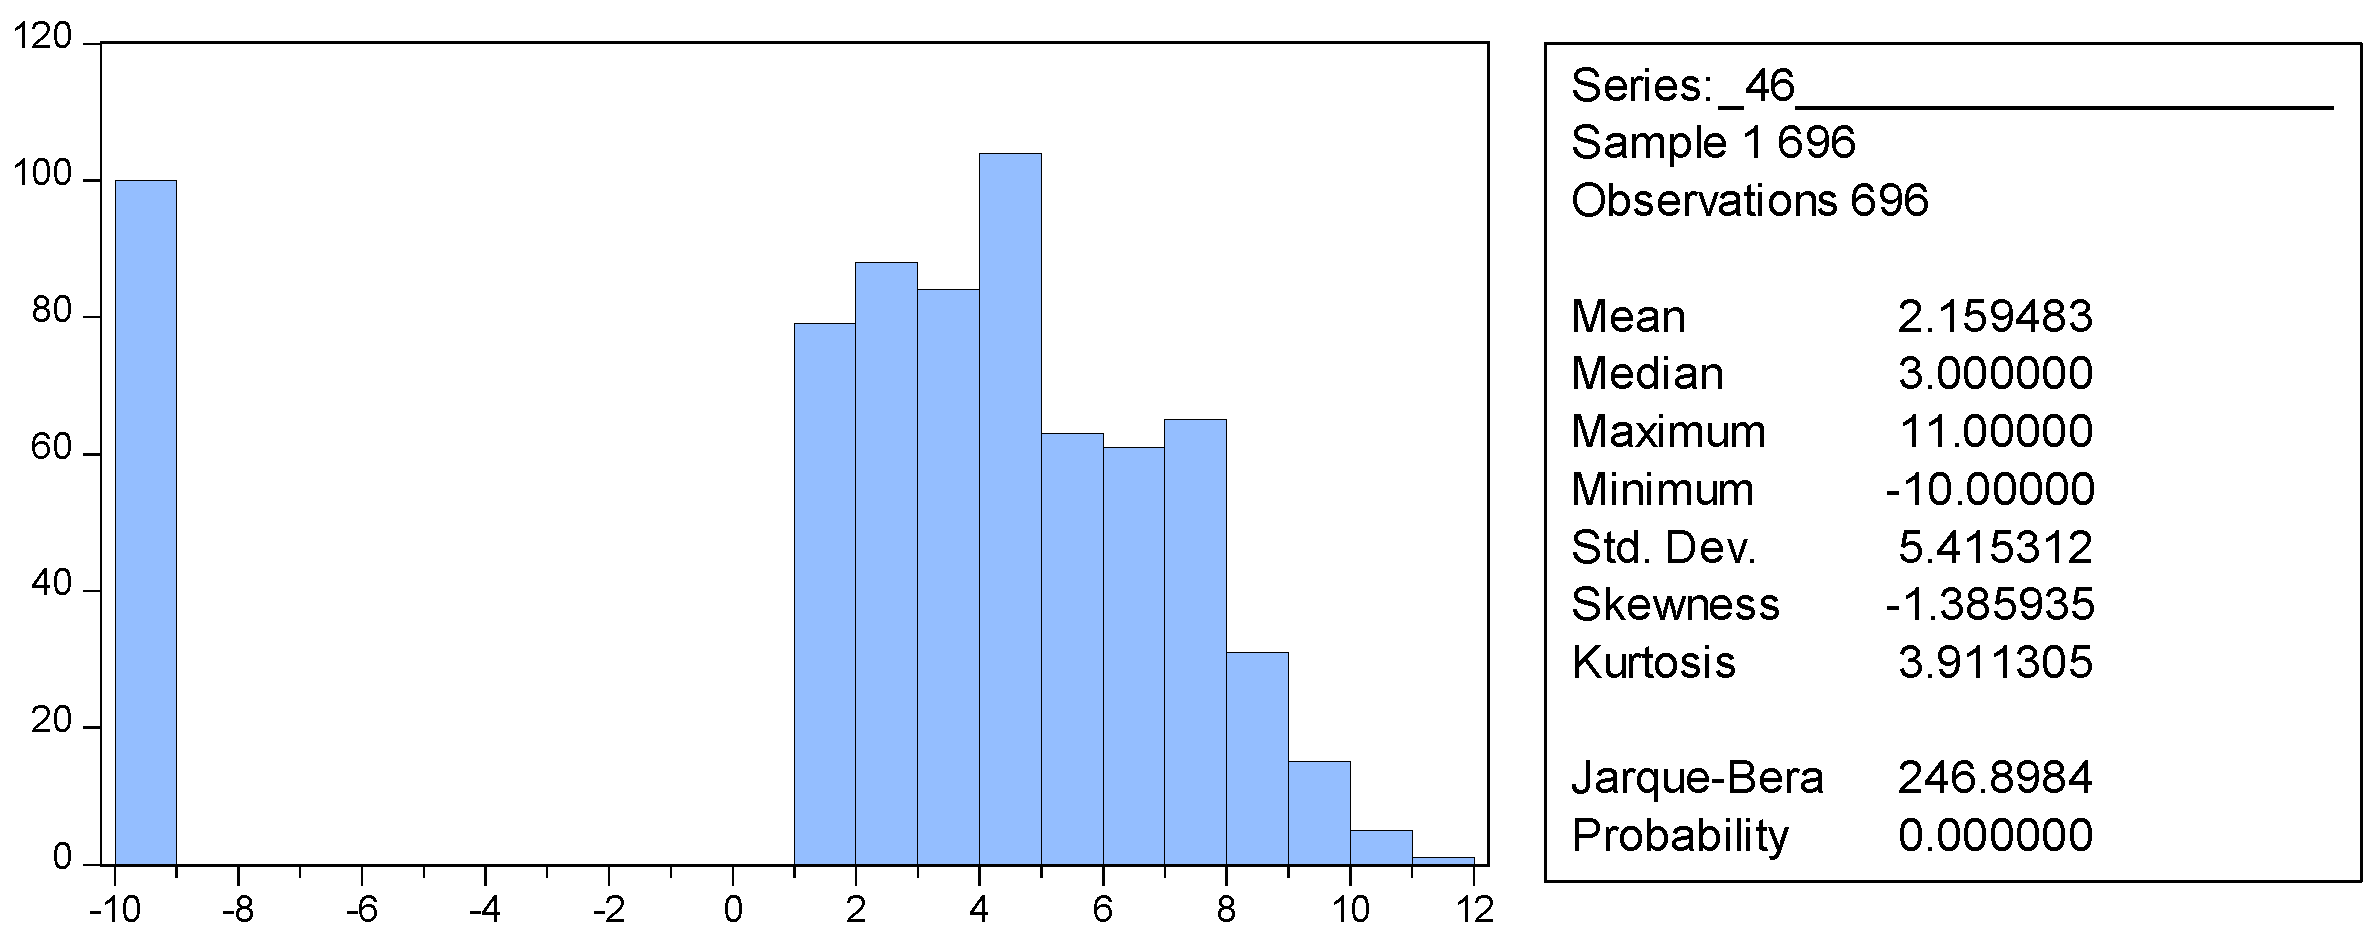
- For most companies, the average amount of investment in the business for the next year does not exceed USD 5000–USD 10,000 (Figure 8).
- (3)
- Most companies note that they need an average of USD 30,000–USD 300,000 additionally (to available resources) to implement their business development strategy within 3 years (Figure 9).
- (4)
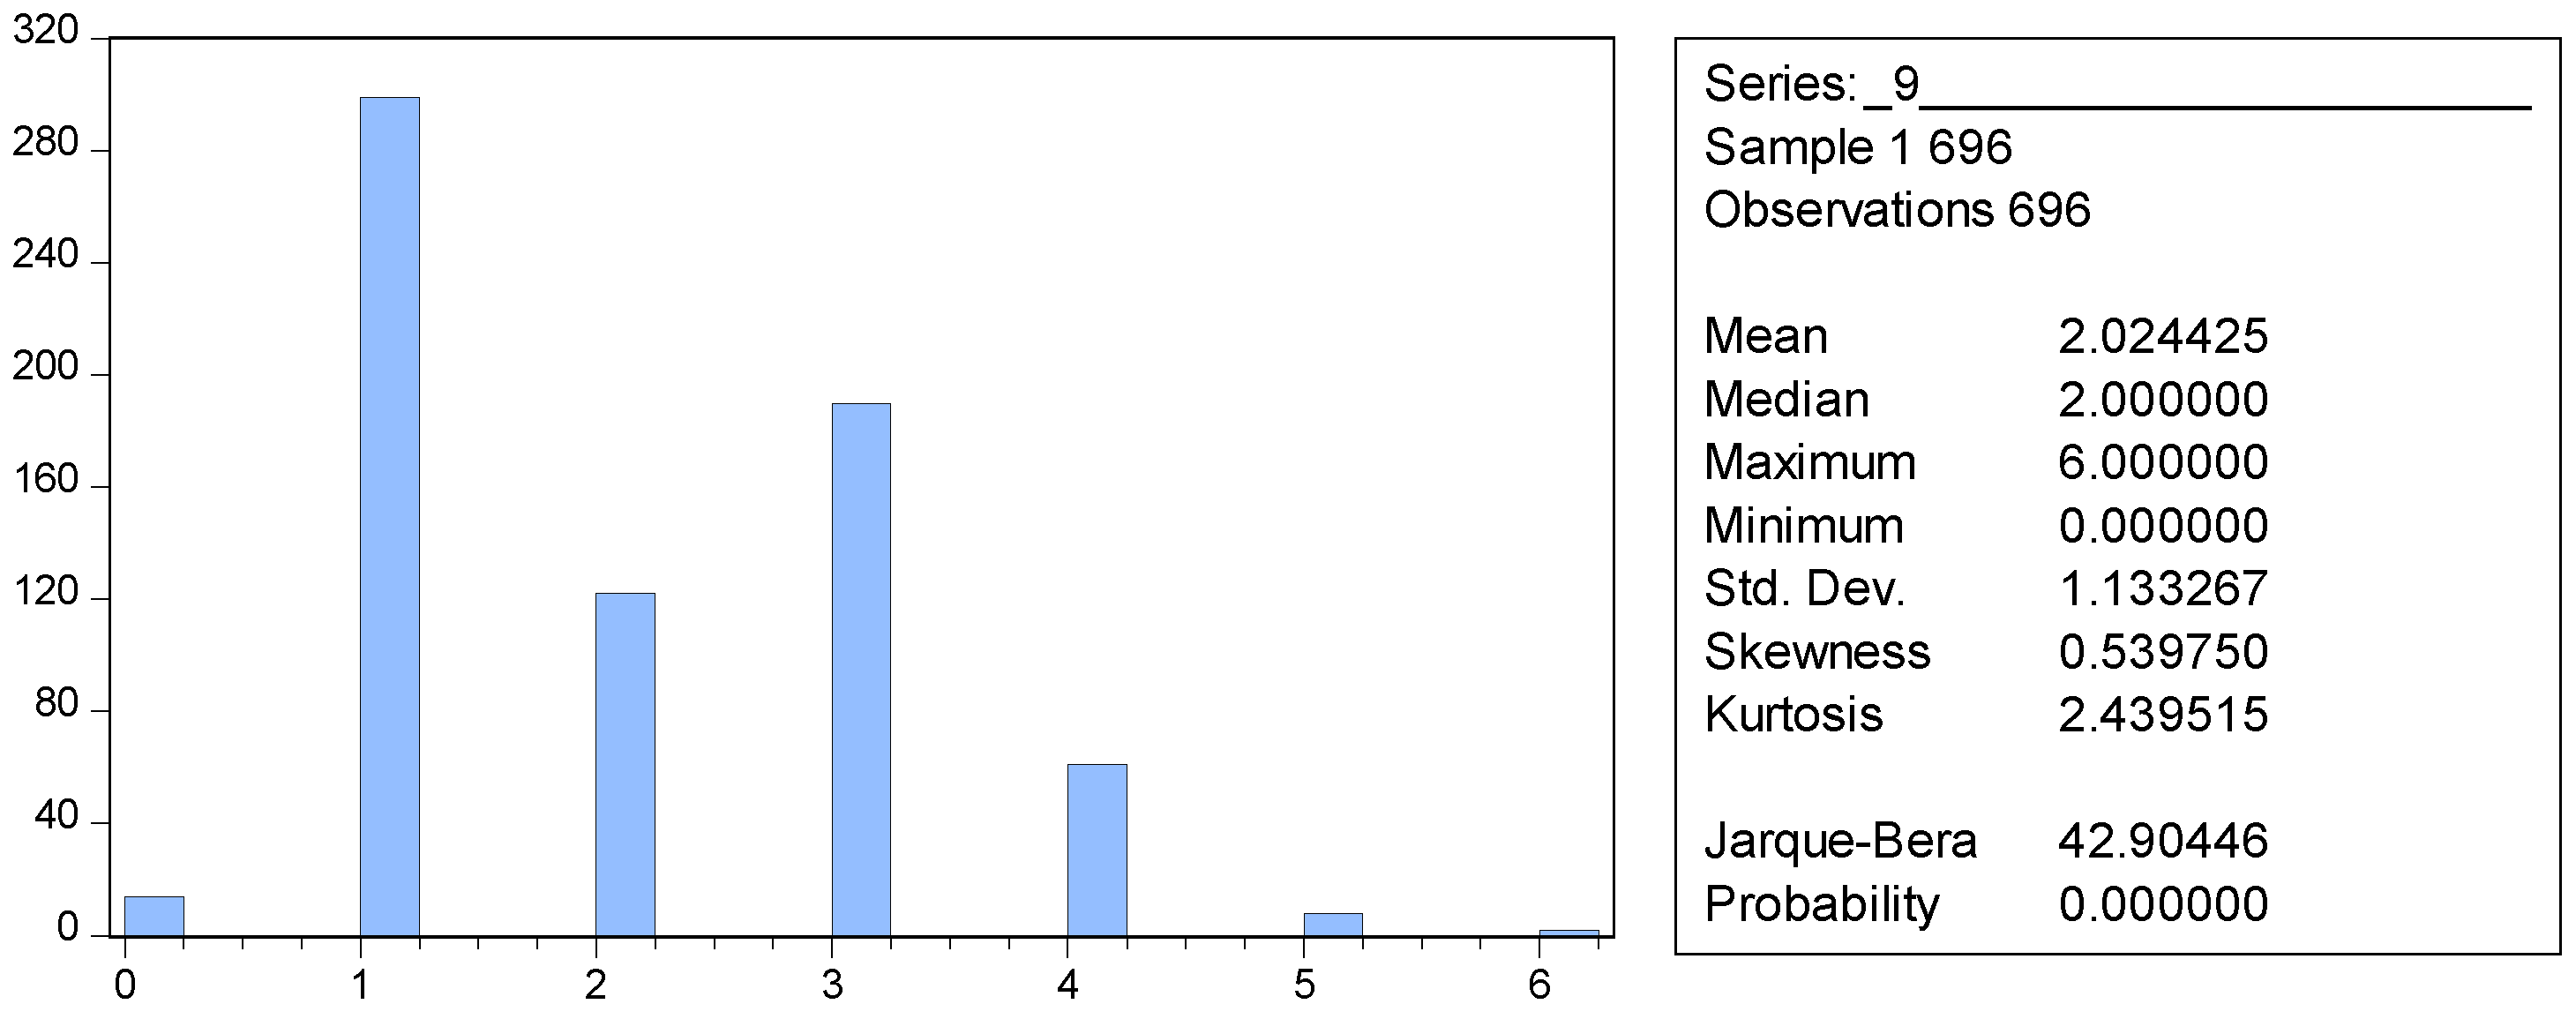
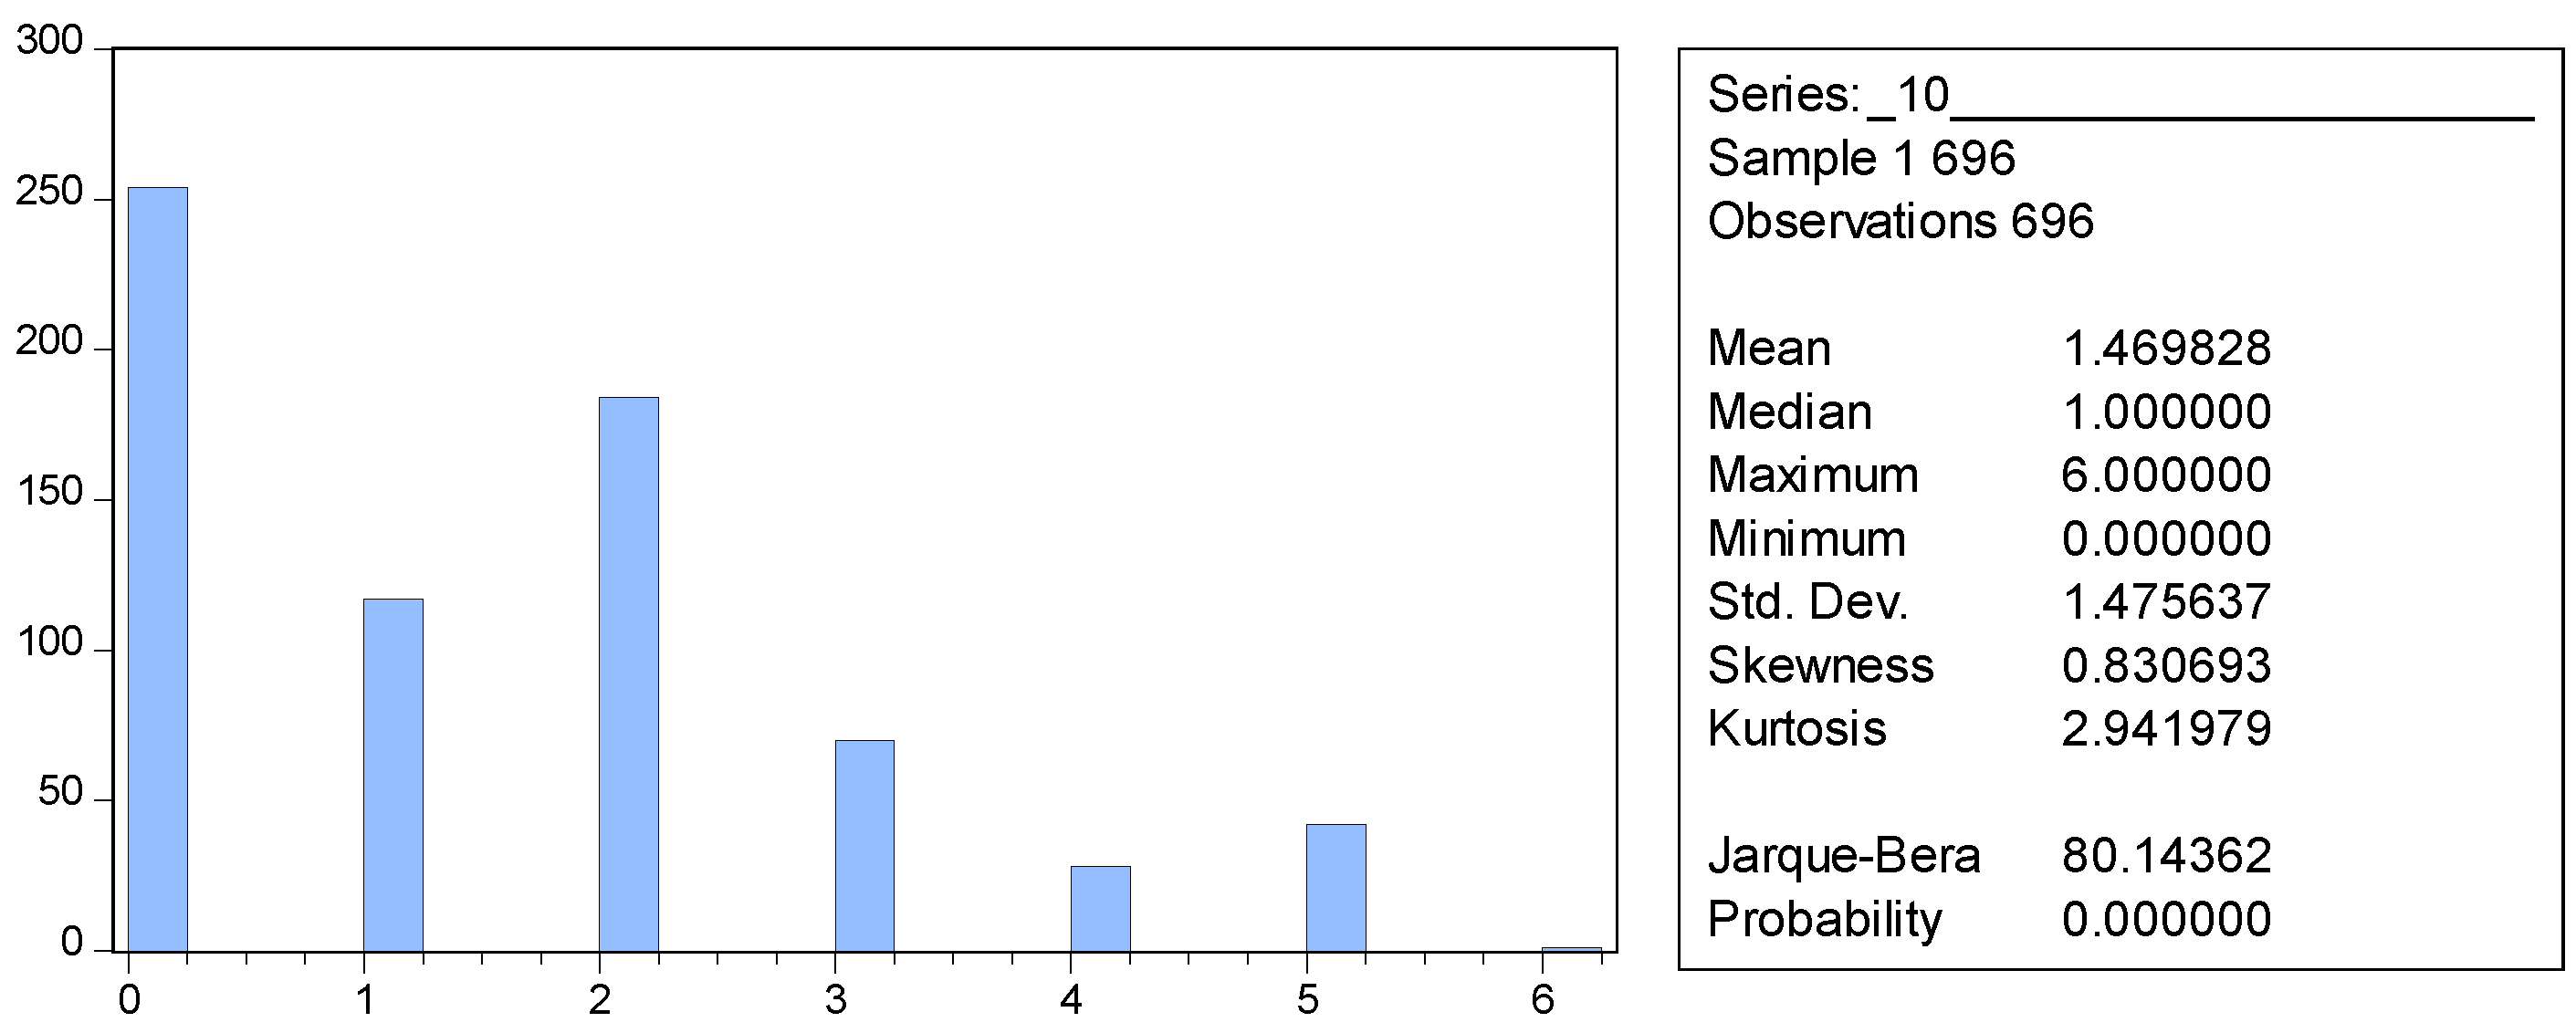
- Most of the companies that took part in the survey estimate the financial losses due to the full-scale invasion at the “from USD 50,000 to USD 100,000” level, while for the future, they mostly predict that 2024 will be “almost the same as 2022” (Table 3).
- (5)
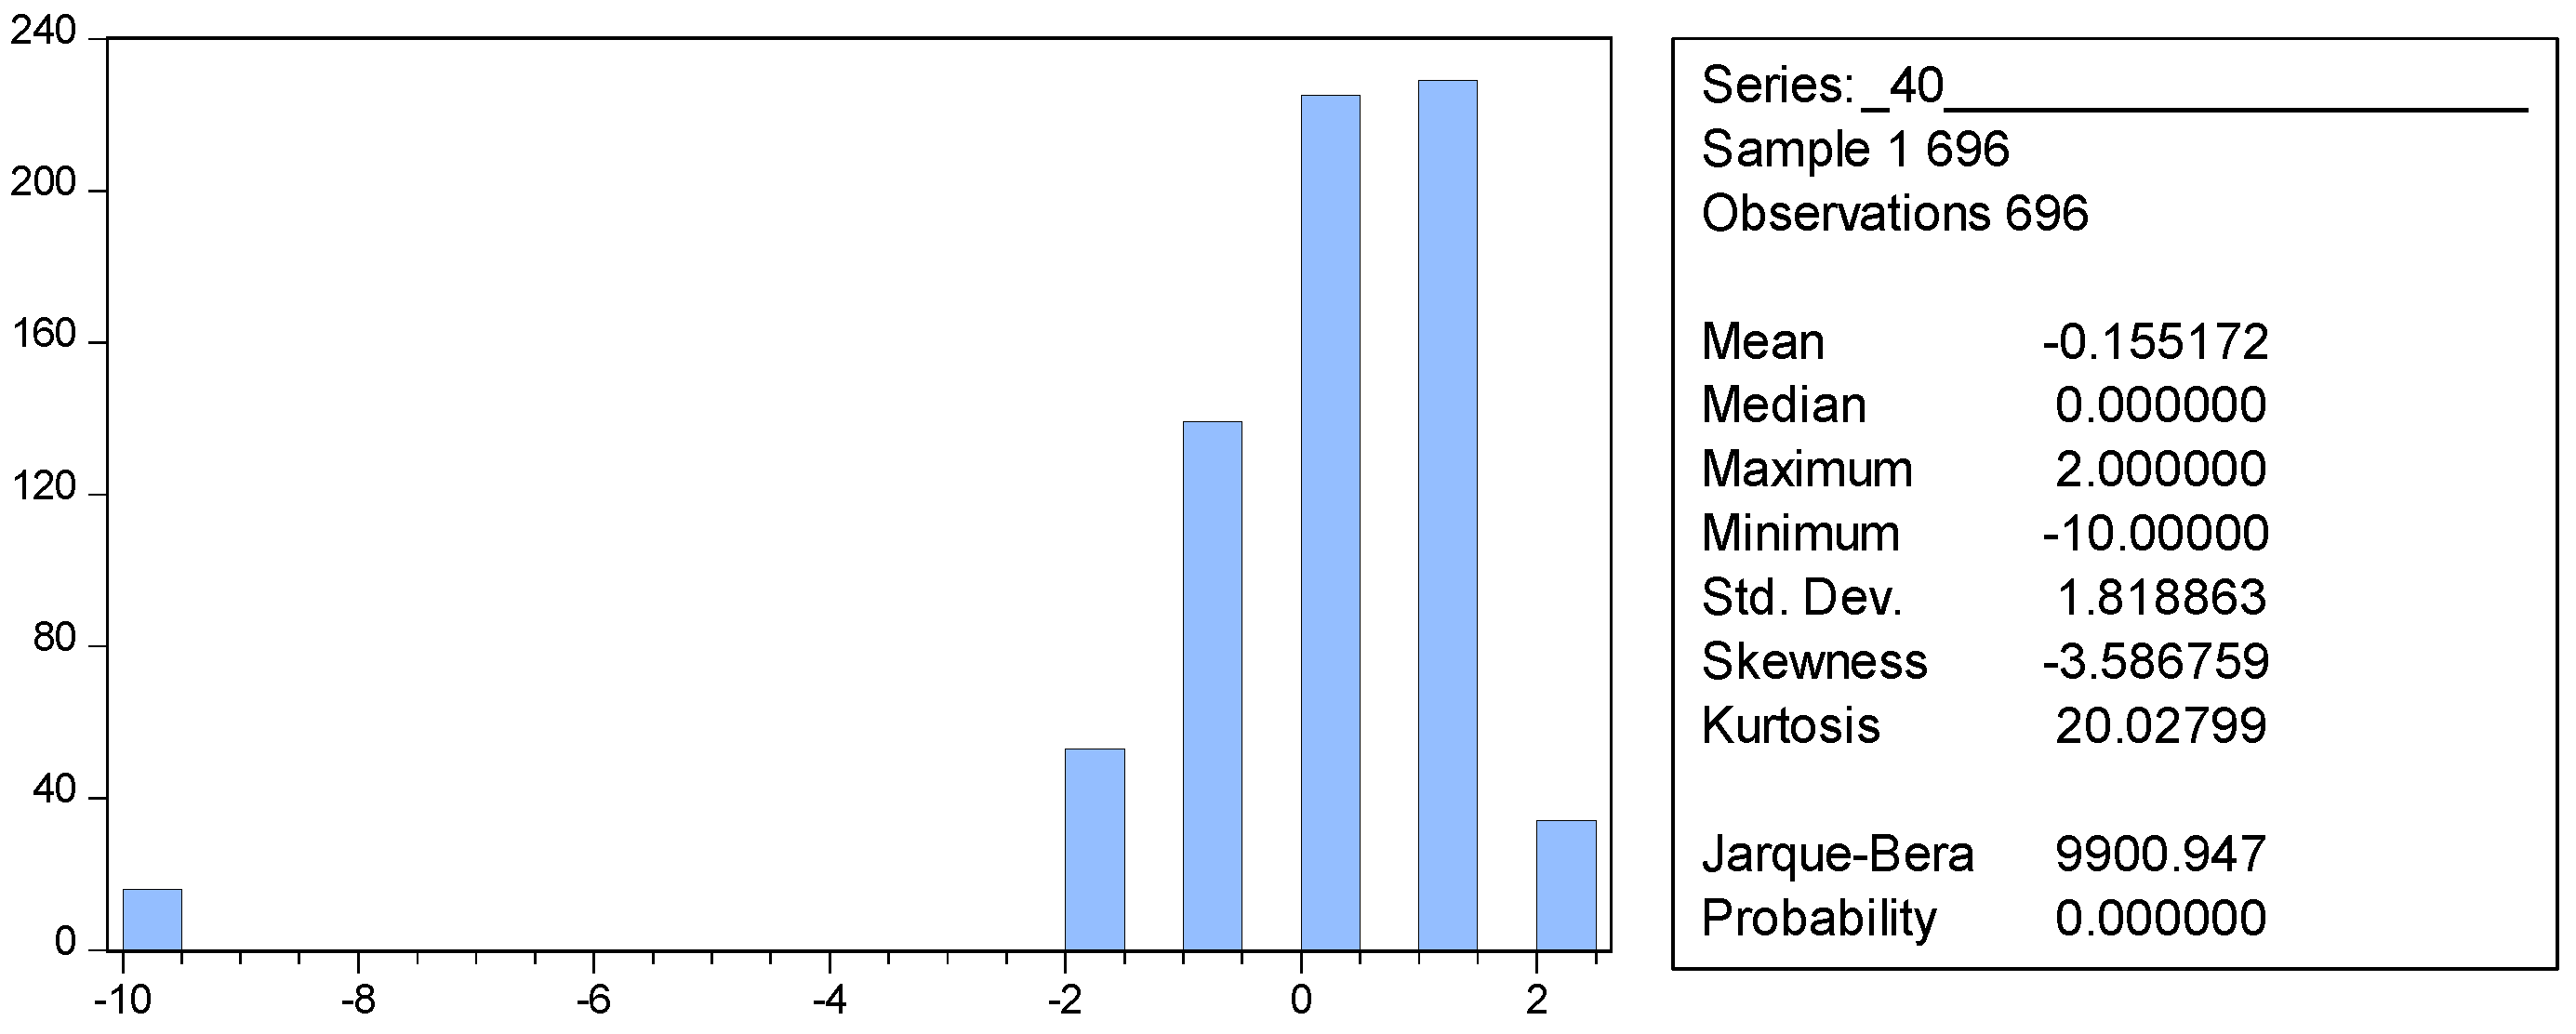
- The financial and economic situation in 2024 is predicted by the majority of companies to remain unchanged (Figure 10).
- (6)
- At the same time, business expects effective GDP stability from the Ukrainian economy compared to 2023 (Figure 11).
| var24 | var25 | |
|---|---|---|
| Mean | −0.985632 | −0.396552 |
| Median | −1.000000 | 0.000000 |
| Maximum | 4.000000 | 4.000000 |
| Minimum | −10.00000 | −10.00000 |
| Std. Dev. | 1.920677 | 1.982859 |
| Skewness | −0.870288 | −1.797403 |
| Kurtosis | 7.886398 | 10.57603 |
| Jarque–Bera | 780.2883 | 2039.246 |
| Probability | 0.000000 | 0.000000 |
| Sum | −686.0000 | −276.0000 |
| Sum Sq. Dev. | 2563.856 | 2732.552 |
| Observations | 696 | 696 |
| var19 | var38 | |
|---|---|---|
| Mean | 3.018678 | 3.579023 |
| Median | 3.000000 | 3.000000 |
| Maximum | 7.000000 | 10.00000 |
| Minimum | −1.000000 | 0.000000 |
| Std. Dev. | 1.874769 | 2.354745 |
| Skewness | 0.080440 | 0.860162 |
| Kurtosis | 2.271498 | 3.499046 |
| Jarque–Bera | 16.14132 | 93.04836 |
| Probability | 0.000313 | 0.000000 |
| Sum | 2101.000 | 2491.000 |
| Sum Sq. Dev. | 2442.757 | 3853.654 |
| Observations | 696 | 696 |


5. Results
| Method | df | Value | Probability |
|---|---|---|---|
| Wilcoxon/Mann–Whitney | 13.08462 | 0.0000 | |
| Wilcoxon/Mann–Whitney (tie-adj.) | 14.18985 | 0.0000 | |
| Med. Chi-square | 1 | 87.13282 | 0.0000 |
| Adj. Med. Chi-square | 1 | 85.02059 | 0.0000 |
| Kruskal–Wallis | 1 | 171.2091 | 0.0000 |
| Kruskal–Wallis (tie-adj.) | 1 | 201.3540 | 0.0000 |
| van der Waerden | 1 | 143.0076 | 0.0000 |
| Method | df | Value | Probability |
|---|---|---|---|
| Wilcoxon/Mann–Whitney | 27.46618 | 0.0000 | |
| Wilcoxon/Mann–Whitney (tie-adj.) | 27.88713 | 0.0000 | |
| Med. Chi-square | 1 | 676.1027 | 0.0000 |
| Adj. Med. Chi-square | 1 | 673.3118 | 0.0000 |
| Kruskal–Wallis | 1 | 754.3945 | 0.0000 |
| Kruskal–Wallis (tie-adj.) | 1 | 777.6957 | 0.0000 |
| van der Waerden | 1 | 687.1557 | 0.0000 |
| Method | df | Value | Probability |
|---|---|---|---|
| Wilcoxon/Mann–Whitney | 6.298173 | 0.0000 | |
| Wilcoxon/Mann–Whitney (tie-adj.) | 6.452535 | 0.0000 | |
| Med. Chi-square | 1 | 36.69260 | 0.0000 |
| Adj. Med. Chi-square | 1 | 36.04605 | 0.0000 |
| Kruskal–Wallis | 1 | 39.66782 | 0.0000 |
| Kruskal–Wallis (tie-adj.) | 1 | 41.63609 | 0.0000 |
| van der Waerden | 1 | 26.46780 | 0.0000 |
| Method | df | Value | Probability |
|---|---|---|---|
| Wilcoxon/Mann–Whitney | 22.09608 | 0.0000 | |
| Wilcoxon/Mann–Whitney (tie-adj.) | 22.79107 | 0.0000 | |
| Med. Chi-square | 1 | 822.4731 | 0.0000 |
| Adj. Med. Chi-square | 1 | 819.2945 | 0.0000 |
| Kruskal–Wallis | 1 | 488.2397 | 0.0000 |
| Kruskal–Wallis (tie-adj.) | 1 | 519.4360 | 0.0000 |
| van der Waerden | 1 | 370.6450 | 0.0000 |
| Method | df | Value | Probability |
|---|---|---|---|
| Wilcoxon/Mann–Whitney | 7.942360 | 0.0000 | |
| Wilcoxon/Mann–Whitney (tie-adj.) | 8.046791 | 0.0000 | |
| Med. Chi-square | 1 | 36.19793 | 0.0000 |
| Adj. Med. Chi-square | 1 | 35.54865 | 0.0000 |
| Kruskal–Wallis | 1 | 63.08214 | 0.0000 |
| Kruskal–Wallis (tie-adj.) | 1 | 64.75194 | 0.0000 |
| van der Waerden | 1 | 56.60441 | 0.0000 |
| Method | df | Value | Probability |
|---|---|---|---|
| Wilcoxon/Mann–Whitney | 13.11496 | 0.0000 | |
| Wilcoxon/Mann–Whitney (tie-adj.) | 14.06874 | 0.0000 | |
| Med. Chi-square | 1 | 306.2156 | 0.0000 |
| Adj. Med. Chi-square | 1 | 303.7805 | 0.0000 |
| Kruskal–Wallis | 1 | 172.0039 | 0.0000 |
| Kruskal–Wallis (tie-adj.) | 1 | 197.9314 | 0.0000 |
| van der Waerden | 1 | 161.8713 | 0.0000 |
| Method | df | Value | Probability |
|---|---|---|---|
| Wilcoxon/Mann–Whitney | 15.39878 | 0.0000 | |
| Wilcoxon/Mann–Whitney (tie-adj.) | 15.89107 | 0.0000 | |
| Med. Chi-square | 1 | 620.1121 | 0.0000 |
| Adj. Med. Chi-square | 1 | 617.2246 | 0.0000 |
| Kruskal–Wallis | 1 | 237.1244 | 0.0000 |
| Kruskal–Wallis (tie-adj.) | 1 | 252.5283 | 0.0000 |
| van der Waerden | 1 | 191.6135 | 0.0000 |
6. Conclusions and Discussion
Author Contributions
Funding
Informed Consent Statement
Data Availability Statement
Conflicts of Interest
Correction Statement
Appendix A

| Text Question | Var | Answers | Codes |
|---|---|---|---|
| 1. Position of the person filling out the questionnaire | var01 | owner | 1 |
| Senior manager | 0 | ||
| 2. Year of business establishment | var02 | before 2000 | 1 |
| 2000–2013 | 2 | ||
| 2014–2019 | 3 | ||
| 2020 | 4 | ||
| 2021 | 5 | ||
| 2022 | 6 | ||
| 2023 | 7 | ||
| 3. Organizational form of your business | var03 | Individual entrepreneur | 1 |
| Legal entity | 2 | ||
| 4. Company owner | var04 | Woman | 0 |
| Man | 1 | ||
| 5. Specify the location of your business (where the main income is generated) | var05 | One region | 1 |
| Kyiv | 2 | ||
| All of Ukraine | 3 | ||
| 6. Which area of business is the MAIN one in your activity? | var06 | Construction | 1 |
| Production of furniture | 2 | ||
| Production of food | 3 | ||
| Water supply, sewage, waste management | 4 | ||
| Hotel business | 5 | ||
| Activities in the field of administrative and auxiliary services | 6 | ||
| Mining and quarrying | 7 | ||
| Media | 8 | ||
| Other types of processing industry | 9 | ||
| IT sector | 10 | ||
| Light industry | 11 | ||
| Engineering | 12 | ||
| Arts, sports, entertainment, and recreation | 13 | ||
| Provision of other types of services | 14 | ||
| Real estate transactions | 15 | ||
| Wholesale trade | 16 | ||
| Education | 17 | ||
| Health care and provision of social assistance | 18 | ||
| Supply of electricity, gas, steam, and air conditioning | 19 | ||
| Professional, scientific, and technical activity | 20 | ||
| Professional services: marketing, consulting, design | 21 | ||
| Repair of motor vehicles | 22 | ||
| Restaurants and cafés | 23 | ||
| Retail trade of other products | 24 | ||
| Retail trade of food | 25 | ||
| Agriculture, forestry, and fisheries | 26 | ||
| Telecommunications | 27 | ||
| Transport, warehousing, postal and courier activities | 28 | ||
| Tourism | 29 | ||
| Financial and insurance activities | 30 | ||
| 7. Which form of tax payment is the main one in your business? | var07 | General system of taxation | 1 |
| Single tax | 2 | ||
| 8. Business turnover in 2022 | var08 | Up to UAH 1 million | 1 |
| UAH 1–5 million | 2 | ||
| UAH 5–10 million | 3 | ||
| UAH 10–50 million | 4 | ||
| UAH 50–100 million | 5 | ||
| UAH 100–500 million | 6 | ||
| UAH 500+ million | 7 | ||
| 9. How many employees are currently working in your business? | var09 | Up to 5 | 1 |
| 6–10 | 2 | ||
| 11–50 | 3 | ||
| 51–250 | 4 | ||
| 251–1000 | 5 | ||
| more than 5,000 | 6 | ||
| 10. Did your company suspend operations due to a full-scale intrusion? | var10 | No | 0 |
| Yes, for less than 1 month | 1 | ||
| Yes, for 1–3 months | 2 | ||
| Yes, for 3–6 months | 3 | ||
| Yes, for 6–12 months | 4 | ||
| Yes, for more than 12 months | 5 | ||
| 11. What was the average load level (according to capacity) of your company? [Before the full-scale invasion] | var11 | [0;100] | [0; 100] |
| 12. What was the average load level (according to capacity) of your company? [2022] | var12 | [0;100] | [0; 100] |
| 13. What was the average load level (according to capacity) of your company? [2023] | var13 | [0;100] | [0; 100] |
| 14. What was the average load level (according to capacity) of your company? [2024 (forecast)] | var14 | [0;100] | [0; 100] |
| 15. Did the business relocate due to the war? | var15 | No relocation | 1 |
| Partially moved to another region | 2 | ||
| Yes, business completely relocated to another region | 3 | ||
| New branches were opened in another region | 4 | ||
| New sales points were opened in another region | 5 | ||
| 16. If so, what were the main factors that influenced your choice of a new region? | var16 | Yes | 1 |
| No | 0 | ||
| 17. Was the company part of the supply chain of international companies [Before the full-scale invasion] | var17 | Yes | 1 |
| No | 0 | ||
| 18. Was the company part of the supply chain of international companies [After the full-scale invasion] | var18 | Yes | 1 |
| No | 0 | ||
| 19. How do you estimate the financial loss due to the full-scale invasion? | var19 | No financial losses incurred | 0 |
| Up to USD 10,000 | 1 | ||
| From USD 10,000 to USD 50,000 | 2 | ||
| From USD 50,000 to USD 100,000 | 3 | ||
| From USD 100,000 to USD 500,000 | 4 | ||
| USD 100,000–USD 1 million | 5 | ||
| USD 1 million– USD 10 million | 6 | ||
| More than USD 10 million | 7 | ||
| 20. What was the financial and economic condition of your enterprise before the full-scale invasion? | var20 | Bad | 0 |
| Satisfactory | 1 | ||
| Good | 2 | ||
| Excellent | 3 | ||
| 21. How do you assess the current financial and economic condition of your enterprise? | var21 | Bad | 0 |
| Satisfactory | 1 | ||
| Good | 2 | ||
| Excellent | 3 | ||
| 22. Business performance results in 2023 compared to the period before the full-scale invasion (dollar equivalent) | var22 | Business effectively ceased operations (0–30%) | 0 |
| Significantly below expectations (40–60%) | 1 | ||
| Below expectations (70–90%) | 2 | ||
| Meet expectations (100%) | 3 | ||
| Exceeded expectations (110–130%) | 4 | ||
| Significantly exceeded expectations (140%+) | 5 | ||
| 23. Business performance results in 2023 compared to the same period in 2022 (dollar equivalent) | var23 | Business effectively ceased operations (0–30%) | 0 |
| Significantly below expectations (40–60%) | 1 | ||
| Below expectations (70–90%) | 2 | ||
| Meet expectations (100%) | 3 | ||
| Exceeded expectations (110–130%) | 4 | ||
| Significantly exceeded expectations (140%+) | 5 | ||
| 24. How has the number of employees changed in 2023 compared to the period before the full-scale invasion? | var24 | Significant reduction: −50 to −100% | −3 |
| 20–40% reduction | −2 | ||
| Minor reduction: −10% | −1 | ||
| Remained unchanged | 0 | ||
| Minor increase: +10% | 1 | ||
| 20–40% increase | 2 | ||
| 50–100% increase | 3 | ||
| More than doubled | 4 | ||
| 25. How has the number of personnel changed in 2023 compared to 2022? | var25 | Significant reduction: −50 to −100% | −3 |
| 20–40% reduction | −2 | ||
| Minor reduction: −10% | −1 | ||
| Remained unchanged | 0 | ||
| Minor increase: +10% | 1 | ||
| 20–40% increase | 2 | ||
| 50–100% increase | 3 | ||
| More than doubled | 4 | ||
| 26. How has the number of ORDERS from customers that the business receives changed over the past month? | var26 | Has fallen | −1 |
| Remained unchanged | 0 | ||
| Has grown | 1 | ||
| 27. How has the number of EMPLOYEES (full-time and part-time) changed over the past month? | var27 | Has fallen | −1 |
| Remained unchanged | 0 | ||
| Has grown | 1 | ||
| 28. How has the PRODUCTION VOLUME of products/provided services changed over the past month? | var28 | Has fallen | −1 |
| Remained unchanged | 0 | ||
| Has grown | 1 | ||
| 29. How has the overall level of INVENTORIES changed over the past month? | var29 | Has fallen | −1 |
| Remained unchanged | 0 | ||
| Has grown | 1 | ||
| Our business has no inventories | 2 | ||
| 30. How has the number of your ORDERS from your suppliers changed over the past month? | var30 | Has fallen | −1 |
| Remained unchanged | 0 | ||
| Has grown | 1 | ||
| 34. What proportion of the staff has been reduced at the current moment? (percentage of the number as of 23 February 2022) | var34 | [0; 100] | [0; 100] |
| 35. What proportion of the staff is on unpaid leave (as a percentage of the workforce as of 23 February 2022) | var35 | [0; 100] | [0; 100] |
| 36. What proportion of the staff (of those who are currently working) is working for reduced wages? (percentage of currently employed people) | var36 | [0; 100] | [0; 100] |
| 37. What proportion of employees (of those hired since the start of the full-scale invasion) have IDP status? | var37 | [0; 100] | [0; 100] |
| 38. Your forecasts for 2024 regarding your business—compared to 2023 (in hryvnias) | var38 | Business will not operate/ceased operations | 0 |
| to 50% from 2022 | 1 | ||
| 50–90% from 2022 | 2 | ||
| Almost like in 2022 | 3 | ||
| 110–120% from 2022 (10–20% growth) | 4 | ||
| 130–140% from 2022 (30–40% growth) | 5 | ||
| 150–160% from 2022 (50–60% growth) | 6 | ||
| 170–180% from 2022 (70–80% growth) | 7 | ||
| 190–200% from 2022 (90–100% growth) | 8 | ||
| Business will grow 2–3 times (in hryvnias, compared to 2022) | 9 | ||
| Business will grow 4 times or more (in hryvnias, compared to 2022) | 10 | ||
| 39. To what extent do you plan to change the number of the staff in the company in 2024 (percentage of those currently employed)? | var39 | Significant reduction: −50 to −100% | −3 |
| Reduction by 20–40% | −2 | ||
| Minor reduction: −10% | −1 | ||
| Will remain unchanged | 0 | ||
| Minor increase: +10% | 1 | ||
| Increase by 20–40% | 2 | ||
| Increase by 50–100% | 3 | ||
| Will more than double | 4 | ||
| 40. What are your expectations regarding the financial and economic condition of your enterprise in 2024? | var40 | Will significantly worsen | −2 |
| Will worsen | −1 | ||
| Will remain unchanged | 0 | ||
| Will improve | 1 | ||
| Will improve significantly | 2 | ||
| 41. How do you assess the prospects of the Ukrainian economy in 2024? | var41 | GDP will decrease significantly (by 5% or more) | −2 |
| GDP will decrease slightly (between −1% and −4%) | −1 | ||
| GDP will actually not change compared to 2023 | 0 | ||
| GDP growth in the range of 1–4% | 1 | ||
| GDP growth in 2024 by 5–9% | 2 | ||
| GDP growth in 2024 by 10% or more | 3 | ||
| 42. Are you engaged in foreign economic activity as of now? | var42 | We do not carry out foreign economic transactions | 0 |
| We plan to enter international markets in 2024 | 1 | ||
| We only carry out export transactions | 2 | ||
| We only carry out import transactions | 3 | ||
| We carry out export and import transactions | 4 | ||
| 44. What amount of additional financial resources does your business need (in addition to resources available to you) to implement your business development strategy within 3 years? | var44 | up to USD 30,000 | 1 |
| USD 30,000–USD 300,000 | 2 | ||
| USD 300,000–USD 1,000,000 | 3 | ||
| USD 1,000,000–USD 3,000,000 | 4 | ||
| USD 3,000,000–USD 10,000,000 | 5 | ||
| More than USD 10,000,000 | 6 | ||
| 46. What amount do you plan to invest in business development next year? | var46 | Up to USD 1000 | 1 |
| USD 1000–USD 5000 | 2 | ||
| USD 5000–USD 10,000 | 3 | ||
| USD 10,000–USD 30,000 | 4 | ||
| USD 30,000–USD 50,000 | 5 | ||
| USD 50,000–USD 100,000 | 6 | ||
| USD 100,000–USD 300,000 | 7 | ||
| USD 300,000–USD 1,000,000 | 8 | ||
| USD 1,000,000–USD 3,000,000 | 9 | ||
| USD 3,000,000–USD 10,000,000 | 10 | ||
| More than USD 10,000,000 | 11 | ||
| 47. Do you plan to attract foreign investments? If so, how much do you plan to raise? | var47 | We do not plan to attract foreign investments | 0 |
| USD 10,000–100,000 | 1 | ||
| USD 100,000–500,000 | 2 | ||
| USD 500,000–USD 1 million | 3 | ||
| USD 1–5 million | 4 | ||
| USD 5–10 million | 5 | ||
| more than USD 10 million | 6 | ||
| 49. How useful was this assistance? | var49 | Not useful at all | −2 |
| Not very useful | −1 | ||
| Somewhat useful | 0 | ||
| Very useful | 1 | ||
| Extremely useful | 2 |
References
- Candiya Bongomin, George Okello, John C. Munene, Joseph Mpeera Ntayi, and Charles Akol Malinga. 2018. Determinants of SMMEs growth in post-war communities in developing countries: Testing the interaction effect of government support. World Journal of Entrepreneurship, Management and Sustainable Development 14: 50–73. [Google Scholar] [CrossRef]
- Çörekçioğlu, Selim, Tahmina Musayeva, Deniz Horuz, and Mark Molnar. 2021. The effect of the Syrian war on trade and the role of SME development organization. Studia Mundi-Economica 8: 105–16. [Google Scholar] [CrossRef]
- Djip, Vernesa. 2014. Entrepreneurship and SME development in post-conflict societies: The case of Bosnia & Herzegovina. Journal of Entrepreneurship and Public Policy 3: 254–74. [Google Scholar]
- Erdiaw-Kwasie, Michael Odei, Matthew Abunyewah, Salifu Yusif, and Patrick Arhin. 2023. Small and medium enterprises (SMEs) in a pandemic: A systematic review of pandemic risk impacts, coping strategies and resilience. Heliyon 9: e20352. [Google Scholar] [CrossRef]
- Farja, Yanay, Eli Gimmon, and Zeevik Greenberg. 2016. The effect of entrepreneurial orientation on SME growth and export in Israeli peripheral regions. New England Journal of Entrepreneurship 19: 25–41. [Google Scholar] [CrossRef]
- Farja, Yanay, Eli Gimmon, and Zeevik Greenberg. 2017. The developing in the developed: Rural SME growth in Israel. The International Journal of Entrepreneurship and Innovation 18: 36–46. [Google Scholar] [CrossRef]
- Felsenstein, Daniel, and Dafna Schwartz. 1993. Constraints to small business development across the life cycle: Some evidence from peripheral areas in Israel. Entrepreneurship & Regional Development 5: 227–46. [Google Scholar]
- Govori, Arbiana. 2013. Factors affecting the growth and development of SMEs: Experiences from Kosovo. Mediterranean Journal of Social Sciences 4: 701–8. [Google Scholar] [CrossRef][Green Version]
- Hossin, Md Manir, Md Shah Azam, and Md Shamim Hossain. 2023. Understanding the Concept of SMEs in Driving Economic Growth and Development in Bangladesh. International Journal of Finance, Economics and Business 2: 195–204. [Google Scholar] [CrossRef]
- Marom, Shaike, and Robert N. Lussier. 2014. A business success versus failure prediction model for small businesses in Israel. Business and Economic Research 4: 63. [Google Scholar] [CrossRef]
- McCullough, B. D. 2004. Wilkinson’s tests and econometrics software. Journal of Economic and Social Measurement 29: 261–70. [Google Scholar] [CrossRef]
- Naradda Gamage, Sisira Kumara, E. M. S. Ekanayake, G. A. K. N. J. Abeyrathne, R. P. I. R. Prasanna, J. M. S. B. Jayasundara, and P. S. K. Rajapakshe. 2020. A review of global challenges and survival strategies of small and medium enterprises (SMEs). Economies 8: 79. [Google Scholar] [CrossRef]
- Nate, Silviu, Valentin Grecu, Andriy Stavytskyy, and Ganna Kharlamova. 2022. Fostering entrepreneurial ecosystems through the stimulation and mentorship of new entrepreneurs. Sustainability 14: 7985. [Google Scholar] [CrossRef]
- National Bank of Ukraine. 2024. Available online: https://bank.gov.ua/ (accessed on 23 September 2024).
- Oklander, Mykhailo, Oksana Yashkina, Iryna Zlatova, Ilke Cicekli, and Nataliia Letunovska. 2024. Digital Marketing in the Survival and Growth Strategies of Small and Medium-Sized Businesses During the War in Ukraine. Marketing i Menedžment Innovacij 15: 15–28. [Google Scholar] [CrossRef]
- Pulka, Buba Musa, and Muhammad Sani Gawuna. 2022. Contributions of SMEs to employment, gross domestic product, economic growth and development. Jalingo Journal of Social and Management Sciences 4: 1–18. [Google Scholar]
- Soini, Eveliina, and Labinot Veseli. 2011. Factors influencing SMEs growth in Kosovo. Bachelor’s thesis, Turku University of Applied Sciences, Turku, Finland. [Google Scholar]
- Stavytskyy, Andriy, Ganna Kharlamova, Vincentas Rolandas Giedraitis, Oksana Cheberyako, and Dmytro Nikytenko. 2020. Gender question: Econometric answer. Economics & Sociology 13: 241–55. [Google Scholar]
- Student. 1908. The probable error of a mean. Biometrika 6: 1–25. [Google Scholar] [CrossRef]
- Sultan, Suhail. 2014. Enhancing the competitiveness of Palestinian SMEs through clustering. EuroMed Journal of Business 9: 164–74. [Google Scholar] [CrossRef]
- Taiwo, Onifade Stephen, A. C. E. T. Hakan, and Çevik Savaş. 2022. Modeling the impacts of MSMEs’ contributions to GDP and their constraints on unemployment: The case of African’s most populous country. Studies in Business and Economics 17: 154–70. [Google Scholar] [CrossRef]
- Thomsen, Anders, Rune Sandager, Andreas Vig Logerman, Jannick Severin Johanson, and Steffen Haldrup Andersen. 2013. Introduction to EViews 6.0/7.0. Boston: Analytics Group. [Google Scholar]
- United Nations Development Programme in Ukraine. 2024. Rapid Assessment of the War’s Impact on Micro, Small and Medium Enterprises in Ukraine. Analytical Report. Kyiv: United Nations Development Programme in Ukraine. 73p, Available online: https://www.undp.org/sites/g/files/zskgke326/files/2022-10/EN_Rapid_Assessment_of_War_on_MSMEs_in_Ukraine.pdf (accessed on 23 September 2024).
- Woźniak, Maciej, Joanna Duda, Aleksandra Gąsior, and Tomasz Bernat. 2019. Relations of GDP growth and development of SMEs in Poland. Procedia Computer Science 159: 2470–80. [Google Scholar] [CrossRef]
- Yapicioglu, Balkiz. 2023. Navigating Turbulent Environments: Exploring Resilience in SMEs through Complex Adaptive Systems Perspective. Sustainability 15: 9118. [Google Scholar] [CrossRef]
| var17 | var18 | |
|---|---|---|
| Mean | 0.283046 | 0.251437 |
| Median | 0.000000 | 0.000000 |
| Maximum | 1.000000 | 1.000000 |
| Minimum | 0.000000 | 0.000000 |
| Std. Dev. | 0.450803 | 0.434151 |
| Skewness | 0.963216 | 1.145878 |
| Kurtosis | 1.927785 | 2.313035 |
| Jarque–Bera | 140.9627 | 165.9978 |
| Probability | 0.000000 | 0.000000 |
| Sum | 197.0000 | 175.0000 |
| Sum Sq. Dev. | 141.2399 | 130.9986 |
| Observations | 696 | 696 |
| Method | df | Value | Probability * |
|---|---|---|---|
| Wilcoxon/Mann–Whitney | 13.82434 | 0.0000 | |
| Wilcoxon/Mann–Whitney (tie-adj.) | 15.36673 | 0.0000 | |
| Med. Chi-square | 1 | 34.85125 | 0.0000 |
| Adj. Med. Chi-square | 1 | 32.83133 | 0.0000 |
| Kruskal–Wallis | 1 | 191.1141 | 0.0000 |
| Kruskal–Wallis (tie-adj.) | 1 | 236.1388 | 0.0000 |
| van der Waerden | 1 | 196.9102 | 0.0000 |
| Method | df | Value | Probability |
|---|---|---|---|
| Wilcoxon/Mann–Whitney | 28.87786 | 0.0000 | |
| Wilcoxon/Mann–Whitney (tie-adj.) | 29.21388 | 0.0000 | |
| Med. Chi-square | 1 | 758.6940 | 0.0000 |
| Adj. Med. Chi-square | 1 | 755.7275 | 0.0000 |
| Kruskal–Wallis | 1 | 833.9347 | 0.0000 |
| Kruskal–Wallis (tie-adj.) | 1 | 853.4550 | 0.0000 |
| van der Waerden | 1 | 747.6143 | 0.0000 |
| Method | df | Value | Probability |
|---|---|---|---|
| Wilcoxon/Mann–Whitney | 6.362183 | 0.0600 | |
| Wilcoxon/Mann–Whitney (tie-adj.) | 6.610234 | 0.0601 | |
| Med. Chi-square | 1 | 2.979955 | 0.0843 |
| Adj. Med. Chi-square | 1 | 2.796618 | 0.0945 |
| Kruskal–Wallis | 1 | 40.47822 | 0.0702 |
| Kruskal–Wallis (tie-adj.) | 1 | 43.69611 | 0.0700 |
| van der Waerden | 1 | 40.32758 | 0.0790 |
| Method | df | Value | Probability |
|---|---|---|---|
| Wilcoxon/Mann–Whitney | 22.36292 | 0.0000 | |
| Wilcoxon/Mann–Whitney (tie-adj.) | 23.33464 | 0.0000 | |
| Med. Chi-square | 1 | 162.4995 | 0.0000 |
| Adj. Med. Chi-square | 1 | 160.9628 | 0.0000 |
| Kruskal–Wallis | 1 | 500.1032 | 0.0000 |
| Kruskal–Wallis (tie-adj.) | 1 | 544.5089 | 0.0000 |
| van der Waerden | 1 | 524.3138 | 0.0000 |
| Method | df | Value | Probability |
|---|---|---|---|
| Wilcoxon/Mann–Whitney | 3.410994 | 0.0006 | |
| Wilcoxon/Mann–Whitney (tie-adj.) | 3.745022 | 0.0002 | |
| Med. Chi-square | 1 | 14.14338 | 0.0002 |
| Adj. Med. Chi-square | 1 | 13.71804 | 0.0002 |
| Kruskal–Wallis | 1 | 11.63533 | 0.0006 |
| Kruskal–Wallis (tie-adj.) | 1 | 14.02574 | 0.0002 |
| van der Waerden | 1 | 20.58897 | 0.0000 |
| Method | df | Value | Probability |
|---|---|---|---|
| Wilcoxon/Mann–Whitney | 25.60255 | 0.0000 | |
| Wilcoxon/Mann–Whitney (tie-adj.) | 26.48651 | 0.0000 | |
| Med. Chi-square | 1 | 876.9274 | 0.0000 |
| Adj. Med. Chi-square | 1 | 873.6705 | 0.0000 |
| Kruskal–Wallis | 1 | 655.4942 | 0.0000 |
| Kruskal–Wallis (tie-adj.) | 1 | 701.5390 | 0.0000 |
| van der Waerden | 1 | 524.0656 | 0.0000 |
| Method | df | Value | Probability |
|---|---|---|---|
| Wilcoxon/Mann–Whitney | 15.40211 | 0.0000 | |
| Wilcoxon/Mann–Whitney (tie-adj.) | 15.66053 | 0.0000 | |
| Med. Chi-square | 1 | 208.5791 | 0.0000 |
| Adj. Med. Chi-square | 1 | 206.9960 | 0.0000 |
| Kruskal–Wallis | 1 | 237.2271 | 0.0000 |
| Kruskal–Wallis (tie-adj.) | 1 | 245.2542 | 0.0000 |
| van der Waerden | 1 | 229.4758 | 0.0000 |
| Method | df | Value | Probability |
|---|---|---|---|
| Wilcoxon/Mann–Whitney | 18.97573 | 0.0000 | |
| Wilcoxon/Mann–Whitney (tie-adj.) | 19.52611 | 0.0000 | |
| Med. Chi-square | 1 | 376.6982 | 0.0000 |
| Adj. Med. Chi-square | 1 | 374.5967 | 0.0000 |
| Kruskal–Wallis | 1 | 360.0809 | 0.0000 |
| Kruskal–Wallis (tie-adj.) | 1 | 381.2715 | 0.0000 |
| van der Waerden | 1 | 396.7999 | 0.0000 |
| Method | df | Value | Probability |
|---|---|---|---|
| Wilcoxon/Mann–Whitney | 7.878484 | 0.0000 | |
| Wilcoxon/Mann–Whitney (tie-adj.) | 8.008908 | 0.0000 | |
| Med. Chi-square | 1 | 229.5285 | 0.0000 |
| Adj. Med. Chi-square | 1 | 227.7731 | 0.0000 |
| Kruskal–Wallis | 1 | 62.07155 | 0.0000 |
| Kruskal–Wallis (tie-adj.) | 1 | 64.14369 | 0.0000 |
| van der Waerden | 1 | 49.85394 | 0.0000 |
| Variables | Description | Pearson X2 | Likelihood Ratio G2 | Cramer’s V |
|---|---|---|---|---|
| var02 | Business establishment year | 114.5637 Prob = 0.0150 | 101.5574 Prob = 0.0933 | |
| var41 | How do you assess prospects of the Ukrainian economy in 2024? | |||
| var04 | Company owner | |||
| Conditional var04 = 0 (var02–var41) | Condition: the owner of the company is a woman; is there any difference in the establishment year and assessment prospects of the Ukrainian economy in 2024? | 39.28415 Prob = 0.3249 | 40.6084 Prob = 0.2745 | 0.205526 * |
| Conditional var04 = 1 (var02–var41) | Condition: the owner of the company is a man; is there any difference in the establishment year and assessment prospects of the Ukrainian economy in 2024? | 50.13307 Prob = 0.0590 | 39.13184 Prob = 0.3310 | 0.124276 |
| Unconditional var02–var41 | No condition: is there any difference in the establishment year and assessment prospects of the Ukrainian economy in 2024? | 33.90021 Prob = 0.5688 | 32.59059 Prob = 0.6315 | 0.090099 |
| var44 | 44. What amount of financial resources does your business need additionally (additionally to resources available to you) to implement your business development strategy within 3 years? | 1814.476 Prob = 0.0000 | 720.5307 Prob = 0.0000 | |
| var46 | 46. What amount do you plan to invest in business development in the following year? | |||
| var02 | Business establishment year | |||
| Conditional var02 = 1 (var44–var46) | Condition: business establishment year is before 2000. Is there any difference between the amount of necessary additional financial resources for business and a planned amount of investment in the following year? | 113.6952 Prob = 0.0000 | 112.5079 Prob = 0.0000 | 0.383266 |
| Conditional var02= 2 (var44–var46) | Condition: business establishment year is 2000–2013. Is there any difference between the amount of necessary additional financial resources for business and a planned amount of investment in the following year? | 291.8439 Prob = 0.0000 | 199.7963 Prob = 0.0000 | 0.419803 |
| Conditional var02 = 3 (var44–var46) | Condition: business establishment year is 2014–2019. Is there any difference between the amount of necessary additional financial resources for business and a planned amount of investment in the following year? | 223.0970 Prob = 0.0000 | 155.6882 Prob = 0.0000 | 0.423825 |
| Conditional var02 = 4 (var44–var46) | Condition: business establishment year is 2020. Is there any difference between the amount of necessary additional financial resources for business and a planned amount of investment in the following year? | 41.42619 Prob = 0.2106 | 36.74545 Prob = 0.3879 | 0.486540 |
| Conditional var02 = 5 (var44–var46) | Condition: business establishment year is 2021. Is there any difference between the amount of necessary additional financial resources for business and a planned amount of investment in the following year? | 47.76778 Prob = 0.0736 | 41.86354 Prob = 0.1975 | 0.606172 |
| Conditional var02 = 6 (var44–var46) | Condition: business establishment year is 2022. Is there any difference between the amount of necessary additional financial resources for business and a planned amount of investment in the following year? | 37.96769 Prob = 0.1506 | 24.81173 Prob = 0.7341 | 0.632187 |
| Conditional var02 = 7 (var44–var46) | Condition: business establishment year is 2023. Is there any difference between the amount of necessary additional financial resources for business and a planned amount of investment in the following year? | 4.000000 Prob = 0.1353 | 4.498681 Prob = 0.1055 | 1.000000 |
| Unconditional var44–var46 | No condition: Is there any difference between the amount of necessary additional financial resources for business and a planned amount of investment in the following year? | 578.6611 Prob = 0.0000 | 416.4818 Prob = 0.0000 | 0.372248 |
Disclaimer/Publisher’s Note: The statements, opinions and data contained in all publications are solely those of the individual author(s) and contributor(s) and not of MDPI and/or the editor(s). MDPI and/or the editor(s) disclaim responsibility for any injury to people or property resulting from any ideas, methods, instructions or products referred to in the content. |
© 2024 by the authors. Licensee MDPI, Basel, Switzerland. This article is an open access article distributed under the terms and conditions of the Creative Commons Attribution (CC BY) license (https://creativecommons.org/licenses/by/4.0/).
Share and Cite
Dligach, A.; Stavytskyy, A. Resilience Factors of Ukrainian Micro, Small, and Medium-Sized Business. Economies 2024, 12, 319. https://doi.org/10.3390/economies12120319
Dligach A, Stavytskyy A. Resilience Factors of Ukrainian Micro, Small, and Medium-Sized Business. Economies. 2024; 12(12):319. https://doi.org/10.3390/economies12120319
Chicago/Turabian StyleDligach, Andrii, and Andriy Stavytskyy. 2024. "Resilience Factors of Ukrainian Micro, Small, and Medium-Sized Business" Economies 12, no. 12: 319. https://doi.org/10.3390/economies12120319
APA StyleDligach, A., & Stavytskyy, A. (2024). Resilience Factors of Ukrainian Micro, Small, and Medium-Sized Business. Economies, 12(12), 319. https://doi.org/10.3390/economies12120319


