Article

Influence of the Russia–Ukraine War and COVID-19 Pandemic on the Efficiency and Herding Behavior of Stock Markets: Evidence from G20 Nations

by
Bilal Ahmed Memon
1,
Faheem Aslam
2,3,4,
Hafiz Muhammad Naveed
5,
Paulo Ferreira
4,6,* and
Omonjon Ganiev
1
1
School of Business and Economics, Westminster International University, Tashkent 100047, Uzbekistan
2
School of Business Administration (SBA), Al Akhawayn University, Ifrane 53003, Morocco
3
Department of Management Sciences, COMSATS University Islamabad, Islamabad 44000, Pakistan
4
VALORIZA—Research Center for Endogenous Resource Valorization, 7300-555 Portalegre, Portugal
5
College of Management, Shenzhen University, Shenzhen 518060, China
6
Department of Economic Sciences and Organizations, Polytechnic Institute of Portalegre, 7300-555 Portalegre, Portugal
*
Author to whom correspondence should be addressed.
Economies 2024, 12(5), 106; https://doi.org/10.3390/economies12050106
Submission received: 27 March 2024 / Revised: 25 April 2024 / Accepted: 29 April 2024 / Published: 1 May 2024
(This article belongs to the Special Issue Economics after the COVID-19)

Abstract

:
Efficiency in stock markets is essential for economic stability and growth. This study investigates the efficiency and herding behavior of the stock markets from the top economies of the world (known as G20 countries). We classify stock market indices using MSCI classification for the developed and emerging markets to provide a comparative examination using the latest data and by employing the robust multifractal detrended fluctuation (MFDFA) method. In addition to the full sample, the analysis uses sub-sample periods to reveal the hidden features and efficiencies of the G20 markets during the Russia–Ukraine War and COVID-19 for the first time. The findings show the availability of varied multifractality among all G20 stock markets during the overall and crisis periods, exhibit long-range correlations, and may support the fractal market hypothesis. In addition, Italy remains the least efficient, while Germany remains the most efficient stock market. The sub-sample results further reveal unevenness in the local fluctuations and resultant higher inefficiency considering the sheer magnitude and impact of crises on the G20 stock markets. However, the efficiency of developed stock markets performed better as compared to emerging markets. The study of G20 stock markets is useful and provides several implications for a wider audience.
JEL:
F36; G14; G15; N20; O16; P34

1. Introduction

Stock price analysis is a challenging phenomenon, and numerous methods have been produced in a limitless stream. The noise and volatility characteristics of the stock market are often a reflection of various factors, and it is the distinct behavior of investors that makes stock markets quite complicated. Therefore, the sudden and continual changes in stock prices provide a platform for speculations and risks that may lead to economic losses for investors and affect economic stability (Chang et al. 2017; Sezgin Alp et al. 2022).
Previous studies follow analysis and assumptions based on the efficient market hypothesis (EMH), which assumes markets to be efficient, and the prices follow a Brownian motion known as random walk (Fama 1965, 1970). However, the rapid emergence of fractal and chaos theories has allowed for the exploration of new dimensions and has managed to overcome the weaknesses posed by the EMH. In addition, Stock markets are nonlinear by nature, and the variations in prices can be classified by turbulent and fractal behavior (Memon et al. 2022). We use multifractal detrended fluctuation analysis (MFDFA) proposed by (Kantelhardt et al. 2002) that has served as a key tool in exploring the multifractal behavior of the non-stationary time series. In the context of the stock market index, a barometer of overall market behavior, the robust tool of MFDFA provides assistance to determine the availability of long-range dependencies incorporating with the EMH and shows the level of inefficiency (Podobnik and Stanley 2008). MFDFA has been employed by several researchers to study structural features and to explore the efficiency levels of various financial markets (Mali and Mukhopadhyay 2014; Mnif and Jarboui 2021; Memon et al. 2023) and more specifically stock markets of different regions including Europe (Caraiani 2012; Tiwari et al. 2019), Asia (Wang et al. 2009; Rizvi and Arshad 2016; Zhu and Zhang 2018), and America (Wang et al. 2014). However, there is an obstacle in the way of studying the behaviors and comparing the efficiencies of Group of Twenty (G20) stock markets.
The ongoing conflict between Russia and Ukraine has tremendous implications that expand further than the realm of geopolitics. On the one hand, it is affecting the pricing efficiency of stock markets, which is restricted to the combination of several aspects, including geopolitical uncertainty, economic instability, and investor sentiments. Upon the occurrence of conflicts, market participants often become uncertain about the future trajectory of events, including potential economic sanctions, trade disruptions, or military escalations. Therefore, uncertainty can lead to increased volatility and decreased liquidity in stock markets. Investor sentiment, influenced by the ongoing conflict, can also impact stock market efficiency. Negative sentiment driven by geopolitical tensions can lead to a flight of capital from the affected region. As a result, stock prices may deviate from their intrinsic values, making it challenging for markets to efficiently allocate capital. Moreover, the Russia–Ukraine War can cause a spillover effect beyond the region, due to the connectedness of financial markets. Conflicts and crises events are severe factors that affect economies, specifically financial markets. Due to heavy reliance on information technology, investors from all around the world can easily trade, and financial markets have become more subtle to the revelation of shocks. There are many ways this geopolitical risk (GPR) can affect financial markets. First, due to external shocks, GPR investors become more reluctant to trade in financial markets and eventually prolong the decision-making process. Second, GPR can exert panic among market participants, which eventually alters the demand and supply mechanism. Third, firms exposed to GPR and conflicts incur a high cost of operations and therefore are unable to survive for a long period. Therefore, investors and policymakers consider conflict and GPR events seriously, and numerous studies have been conducted that examine the impact of wars, conflicts, and military assaults (Bloom 2009; Schneider and Troeger 2006; Balcilar et al. 2018; Wang et al. 2021; Hudson and Urquhart 2022; Zaremba et al. 2022).
Financial constancy in stock markets is a prerequisite for assuring investment efficacy and safety, and many financial innovation techniques are utilized to effectively evaluate market efficiency. While investigating the efficiency of the Russian stock market, Ikeda (2018) used the MFDFA method to endure financial crises. In addition to finding multifractal structures of the Russian stock market, his results also showed deteriorating structures of the Russian stock market during the 1998 Russian crisis and the global financial crisis of 2008. Similarly, Arshad et al. (2016) used MFDFA to assess the efficiency of eleven Organization of Islamic Conference (OIC) member countries and found higher efficiency during the economic boom compared with lower efficiency during the crisis period. (Miloş et al. 2020) applied the MFDFA method when studying seven central and eastern European stock markets till August 2018, and their results found long-range correlation while supporting evidence of inefficient stock markets. In addition, Alam et al. (2016) performed a comparative analysis of ten global and Islamic stock indices using MFDFA. Their results demonstrated a higher efficiency of Islamic sectoral indices in comparison with conventional stock indices. Moreover, the MFDFA technique was also employed by Balasubramanian (2020) to inspect the herding behavior of the Indian stock market. Their results found no herding or bubble in the market during the catastrophic event of demonetization in the country.
A few studies have examined the efficiency of financial markets regarding the global pandemic. Xu et al. (2021) performed time-varying multifractal analysis of the Chinese stock market around COVID-19 and found the Chinese stock market to be affected by the pandemic. Choi (2021) used the MFDFA method to analyze the efficiency of 11 US stock market sectors during crisis periods. In addition to categorizing sectors with low market efficiency, his results report that consumer discretionary and utilities sectors carry the highest and lowest levels of efficiency during crisis periods. (Mnif et al. 2020) studied five cryptocurrencies using the MFDFA method and showed herding behavior and multifractal structures before the COVID-19 period. However, all cryptocurrencies became highly efficient after the spread of the pandemic, indicating that the best possible strategies can be devised to deal with a pandemic-related financial crisis. Mensi et al. (2020) investigated the multifractality of gold and oil prices using asymmetric multifractal detrended fluctuation analysis (A-MFDFA), and their results confirmed inefficiency in the gold and oil markets due to the uncertainty created from the outbreak. Recently, Aslam et al. (2020b) performed fractal analysis of the foreign exchange market using MFDFA between October 2019 and March 2020. They also found a decline in efficiency along with lower volatility for foreign exchange markets during COVID-19. From the literature, it is evident that the MFDFA method is an important and vital tool in examining the efficiency of financial markets. In addition, there is a need to explore G20 stock markets, which represent the world’s largest economies, during the overall and crisis periods of the global pandemic (COVID-19) and Russia–Ukraine War and to better comprehend the behavior of these stock markets.
In the present work, we thoroughly examine the multifractal properties of stock market indices of the Group of Twenty (G20 countries. The member countries of the G20 account for higher than 80 percent of world’s GDP, thus constituting both developed and emerging stock markets. Our paper fills the existing gap in the literature in many ways. First, owing to the great importance of market efficiency, which is critical for a better-functioning stock market and growth of the economy, this paper aims to test the efficiency of blue chip G20 stock market indices while comparing developed and emerging stock markets. The literature demonstrates higher efficiency for developed countries’ stock markets in comparison with emerging stock markets (Butler and Malaikah 1992; Rizvi et al. 2014); hence, it is important to further evaluate this argument. Second, with financial markets becoming more vulnerable to the contagion, we measure the efficiency of G20 markets during the time periods of the global pandemic (COVID-19) and the recent Russia–Ukraine War, for the first time. A massive black swan event like the global pandemic (Mishra 2020), which dismantled world economies and finance, brought the movement of people to a standstill (Fernando et al. 2020), requiring fresh insights for the policymakers to set due policy responses to overcome and avoid the possible future financial crisis. Third, a powerful technique of MFDFA is applied to the G20 stock market indices during the overall and stress periods. Such a well-known methodology will capture important information about the dynamics and complexity of these stock markets. Additionally, MFDFA offers a powerful analytical tool for exploring herding behavior in stock markets by revealing multifractal properties and long-range correlations in price dynamics (Aslam et al. 2020a, 2020c; Memon et al. 2023). Moreover, MFDFA can quantify the extent and persistence of the trends resulting from synchronized trading activities among investors, providing insights into the presence of herding behavior (Aslam et al. 2021; Sun et al. 2020). Fourth, the comparative work of G20 stock markets serves as a guide for a wider audience, including investors and policymakers worldwide. Finally, the Russia–Ukraine War has had a notable impact on the pricing efficiency of stock markets. Geopolitical uncertainty, economic instability, investor sentiment, and potential spillover effects can all contribute to market inefficiencies. Therefore, it is important for investors and market participants to carefully consider the implications of this conflict and its potential repercussions on pricing accuracy, risk management, and investment strategies.
The objectives of this study are outlined in the rest of this paper as follows: Section 2 presents the data and methodology. Section 3 discusses the results, and finally conclusions are offered in Section 4.

2. Methodology and Data

2.1. Data

The data set covers 19 major stock market indices of G20 member countries categorized as developed and emerging stock markets according to Morgan Stanley Capital International (MSCI) country classification, presented in Table 1 (country classification available at: https://www.msci.com/our-solutions/index/emerging-markets, accessed on 1 March 2024). We used data of the stock markets from G20 countries that offer a more comprehensive assessment of global market efficiency. By increasing the analysis, researchers can gain insights into a broader range of economies and market dynamics, such as inclusion of major emerging economies and diversity of market characteristics. It recognizes the significance of major emerging economies, captures diverse market characteristics, explores interconnectedness and spillover effects, informs policy discussions, and helps investors make informed decisions. By expanding the analysis beyond the developed countries of G7, the results achieved in this paper will contribute to a deeper understanding of global market dynamics and promote more effective policymaking and investment strategies. The analysis makes use of the closing index price data (until 9 May 2022), while the starting date of each index’s data varies depending upon the availability of the data. The stock index data were obtained from www.finance.yahoo.com and www.investing.com.
To examine stock market efficiencies and to reveal the inner dynamics of G20 countries, we performed distant analysis of the emergence of the global COVID-19 pandemic and Russia–Ukraine War. Previous studies show that complex systems like stock markets disclose a better structure under stress (Sornette 2003). Therefore, two sub-sample periods were created separately; to examine the impact of the global pandemic, the data were portioned based on the first reported COVID-19 case, and for the Russia–Ukraine War, we chose 24 February 2022 (the day Russia launched a military invasion of Ukraine) as the starting point, as shown in Table 2.

2.2. Methodology

This study performs multifractal detrended fluctuation analysis (MFDFA) to analyze the multifractal pattern and to measure the efficiency of the G20 stock market indices during the overall and the sub-sample period of the COVID-19 outbreak. We converted the daily index prices of all the stock markets into index returns, where P i ( t ) is the closing price of index i on the business day t , and log returns for the index after the interval t can be calculated as:
r i t = l n   P i t l n P i ( t t )
The process of MFDFA as mentioned by Kantelhardt et al. (2002) is summarized as follows:
Let X t ( t = 1 , 2 , , N ) signify a time series of finite length N having an insignificant fraction of zero values. In a condition where the series includes zero values, for example, X t = 0 , this can be considered as having no value at the period t . The corresponding profile is determined by integration as follows (Chattopadhyay et al. 2018):
Y i = t = 1 i X t X , i = 1 , 2 , , N ,
In the above equation, X represents average value of X i . Following the creation of corresponding profile Y i , it is divided into N s = i n t ( N / s ) non-overlapping boxes of equal size s . In addition, the least-square fit is applied to the individual segment to obtain local trends. However, the record length N of the time series does not necessarily indicate multiplication of the considered segment s , and a short part of the profile Y i might exist in majority of cases. To overcome this issue, a similar process is repeated beginning from the other end of the profile and therefore resulting in 2 N s segments (Bao et al. 2016). Further, the local trend y υ ( i ) against every window υ = 1 , 2 , , 2 N s is achieved by the least square fit, and then the variance is calculated based on the following:
F 2 S , υ = 1 S i = 1 S Y υ 1 S + i y υ i 2
for υ = 1 , 2 , , N s and using
F 2 S , υ = 1 S i = 1 S Y N υ N s S + i y υ i 2
for υ = N s + 1 , , 2 N s . Here, Y υ i is the polynomial fit in box υ . Since the detrending of the time series is performed through deduction of the fits from the profile, different-order MFDFA differs in its capability of eliminating trends in the series. In the m th order of MFDFA, trends of order m in the profile along with m 1 in the original record are disregarded. Therefore, linear (MFDFA1), quadratic (MFDFA2), cubic (MFDFA3), or greater order polynomials can be examined in the fitting process (San José Martínez et al. 2021). Moreover, a comparison of the results for various orders of MFDFA permits approximation of the polynomial trends in the data.
The q th-order fluctuation function is obtained by averaging over all the segments.
F q S = 1 2 N S υ = 1 2 N S F 2 S , υ q 2 1 q
The index variable q can take any real non-zero value. For q = 0 , the fluctuation function can be obtained using the following:
F 0 S = e x p 1 4 N S υ = 1 2 N S ln F 2 S , υ
For q = 2 , the standard DFA procedure is obtained. Finally, the scaling behavior of the fluctuation function is determined by considering the log–log graphs of F q S versus S for that particular q . A power law dependence of F q S on the segment size S is given as follows, which signals the availability of scaling behavior:
F q S ~ S h q
The exponent h q is denoted as a generalized Hurst index, and h ( 2 ) is the well-known Hurst exponent H (Zhang et al. 2008). Normally, if h ( q ) is independent of q , which means Δ h q = h q m i n h q m a x = 0 , the time series is monofractal, and if h q depends on q , the correlation is multifractal (Zhang et al. 2019a). Numerous studies used h ( q ) , known as the degree of multifractality, to measure market efficiency (Zunino et al. 2009; Kristoufek and Vosvrda 2013; Miloş et al. 2020). For positive values of q , h ( q ) explains the scaling behavior of segments with greater fluctuations, while for negative values of q , h ( q ) shows the scaling behavior of segments with lower fluctuations (Zhang et al. 2019b). If h ( 2 ) > 0.5 , these types of fluctuations towards q are persistent, highlighting an increase (decrease) is likely to be followed by another increase (decrease). However, if h ( 2 ) < 0.5 , this represents fluctuations towards q being anti-persistent, which implies that an increase (decrease) is likely to be followed by another decrease (increase). Moreover, in a condition where h ( 2 ) = 0.5 , this shows types of fluctuations depicting a random walk behavior.
Further, we obtained the Renyi exponent τ ( q ) , which can be utilized to specify the multifractal properties (Shadkhoo and Jafari 2009). This relationship among τ ( q ) and that of the generalized Hurst exponent h ( q ) can be achieved by the following:
τ q = q h q 1
If the association between τ ( q ) and q is linear, the cross-correlation among the two series is considered monofractal. If the scaling exponent τ ( q ) is not linear to q , the cross-correlation between the two sequences is multifractal.
The complexity in a time series can be rightly obtained by the singularity spectrum, f α . α and f ( α ) can be formed by a Legendre transform of q and τ ( q ) .
α = d τ q d q
f α = q α q τ q
The curve f ( α ) is an individual humped function in a multifractal time series that decreases to a point for a monofractal. The multifractal spectrum highlights the significance of numerous fractal exponents in the time series (Zou and Zhang 2019), where H is the width of the multifractal spectrum that is utilized to obtain the intensity of the multifractality.
H = H m a x q H m i n q

3. Empirical Results and Discussion

This section presents the findings of the MFDFA method conducted on the G20 stock market indices during the overall and sub-sample periods. The analysis and discussion in this section focus on the statistics of the stock index returns followed by a detailed examination of the fractal structures and behavior of G20 stock markets.

3.1. Descriptive Statistics

The descriptive statistics of G20 stock markets in Table 3 show the average, maximum value, minimum value, standard deviation, skewness, and kurtosis of developed and emerging stock markets under overall sample and crisis periods of the COVID-19 outbreak and Russia–Ukraine War. The results show that returns are almost zero for the G20 stock markets, with an average of 0.00015 for the developed and 0.00042 for the emerging stock markets during the overall period. Similarly, the average standard deviation for emerging stock markets is slightly higher at 0.01621 compared with 0.01270 for the developed stock markets. These results prove a key hypothesis of corporate finance, which mentions that higher returns are associated with higher risk (Chari et al. 2019). In addition, all the returns are negatively skewed, except for the emerging stock markets of Brazil and Mexico. The results further show a kurtosis coefficient value of above three during the overall period, representing the fat-tailed behavior of the G20 stock markets.
To assess the changes during the crises, the data set was divided into sub-sets of during the COVID-19 outbreak and during the Russia–Ukraine War. We observed zero mean returns for all the stock markets during COVID-19, with an average of 0.00026 for the developed and 0.00080 for emerging stock markets. Except for Japan and Indonesia, all other stock index returns were negatively skewed during the pandemic period. Moreover, the high kurtosis values show the availability of heavy tails in the G20 stock markets. A consistent small fluctuation in the statistics of returns is observed for all the G20 stock markets specifically during the outbreak. In addition, the period of the Russia–Ukraine War represents negative average stock returns for the developed countries of −0.00089 compared to −0.00006 for the emerging markets. Moreover, positive standard deviation was observed during this period for all the stock returns, except for Brazil.

3.2. Multifractal Structures of G20 Stock Markets

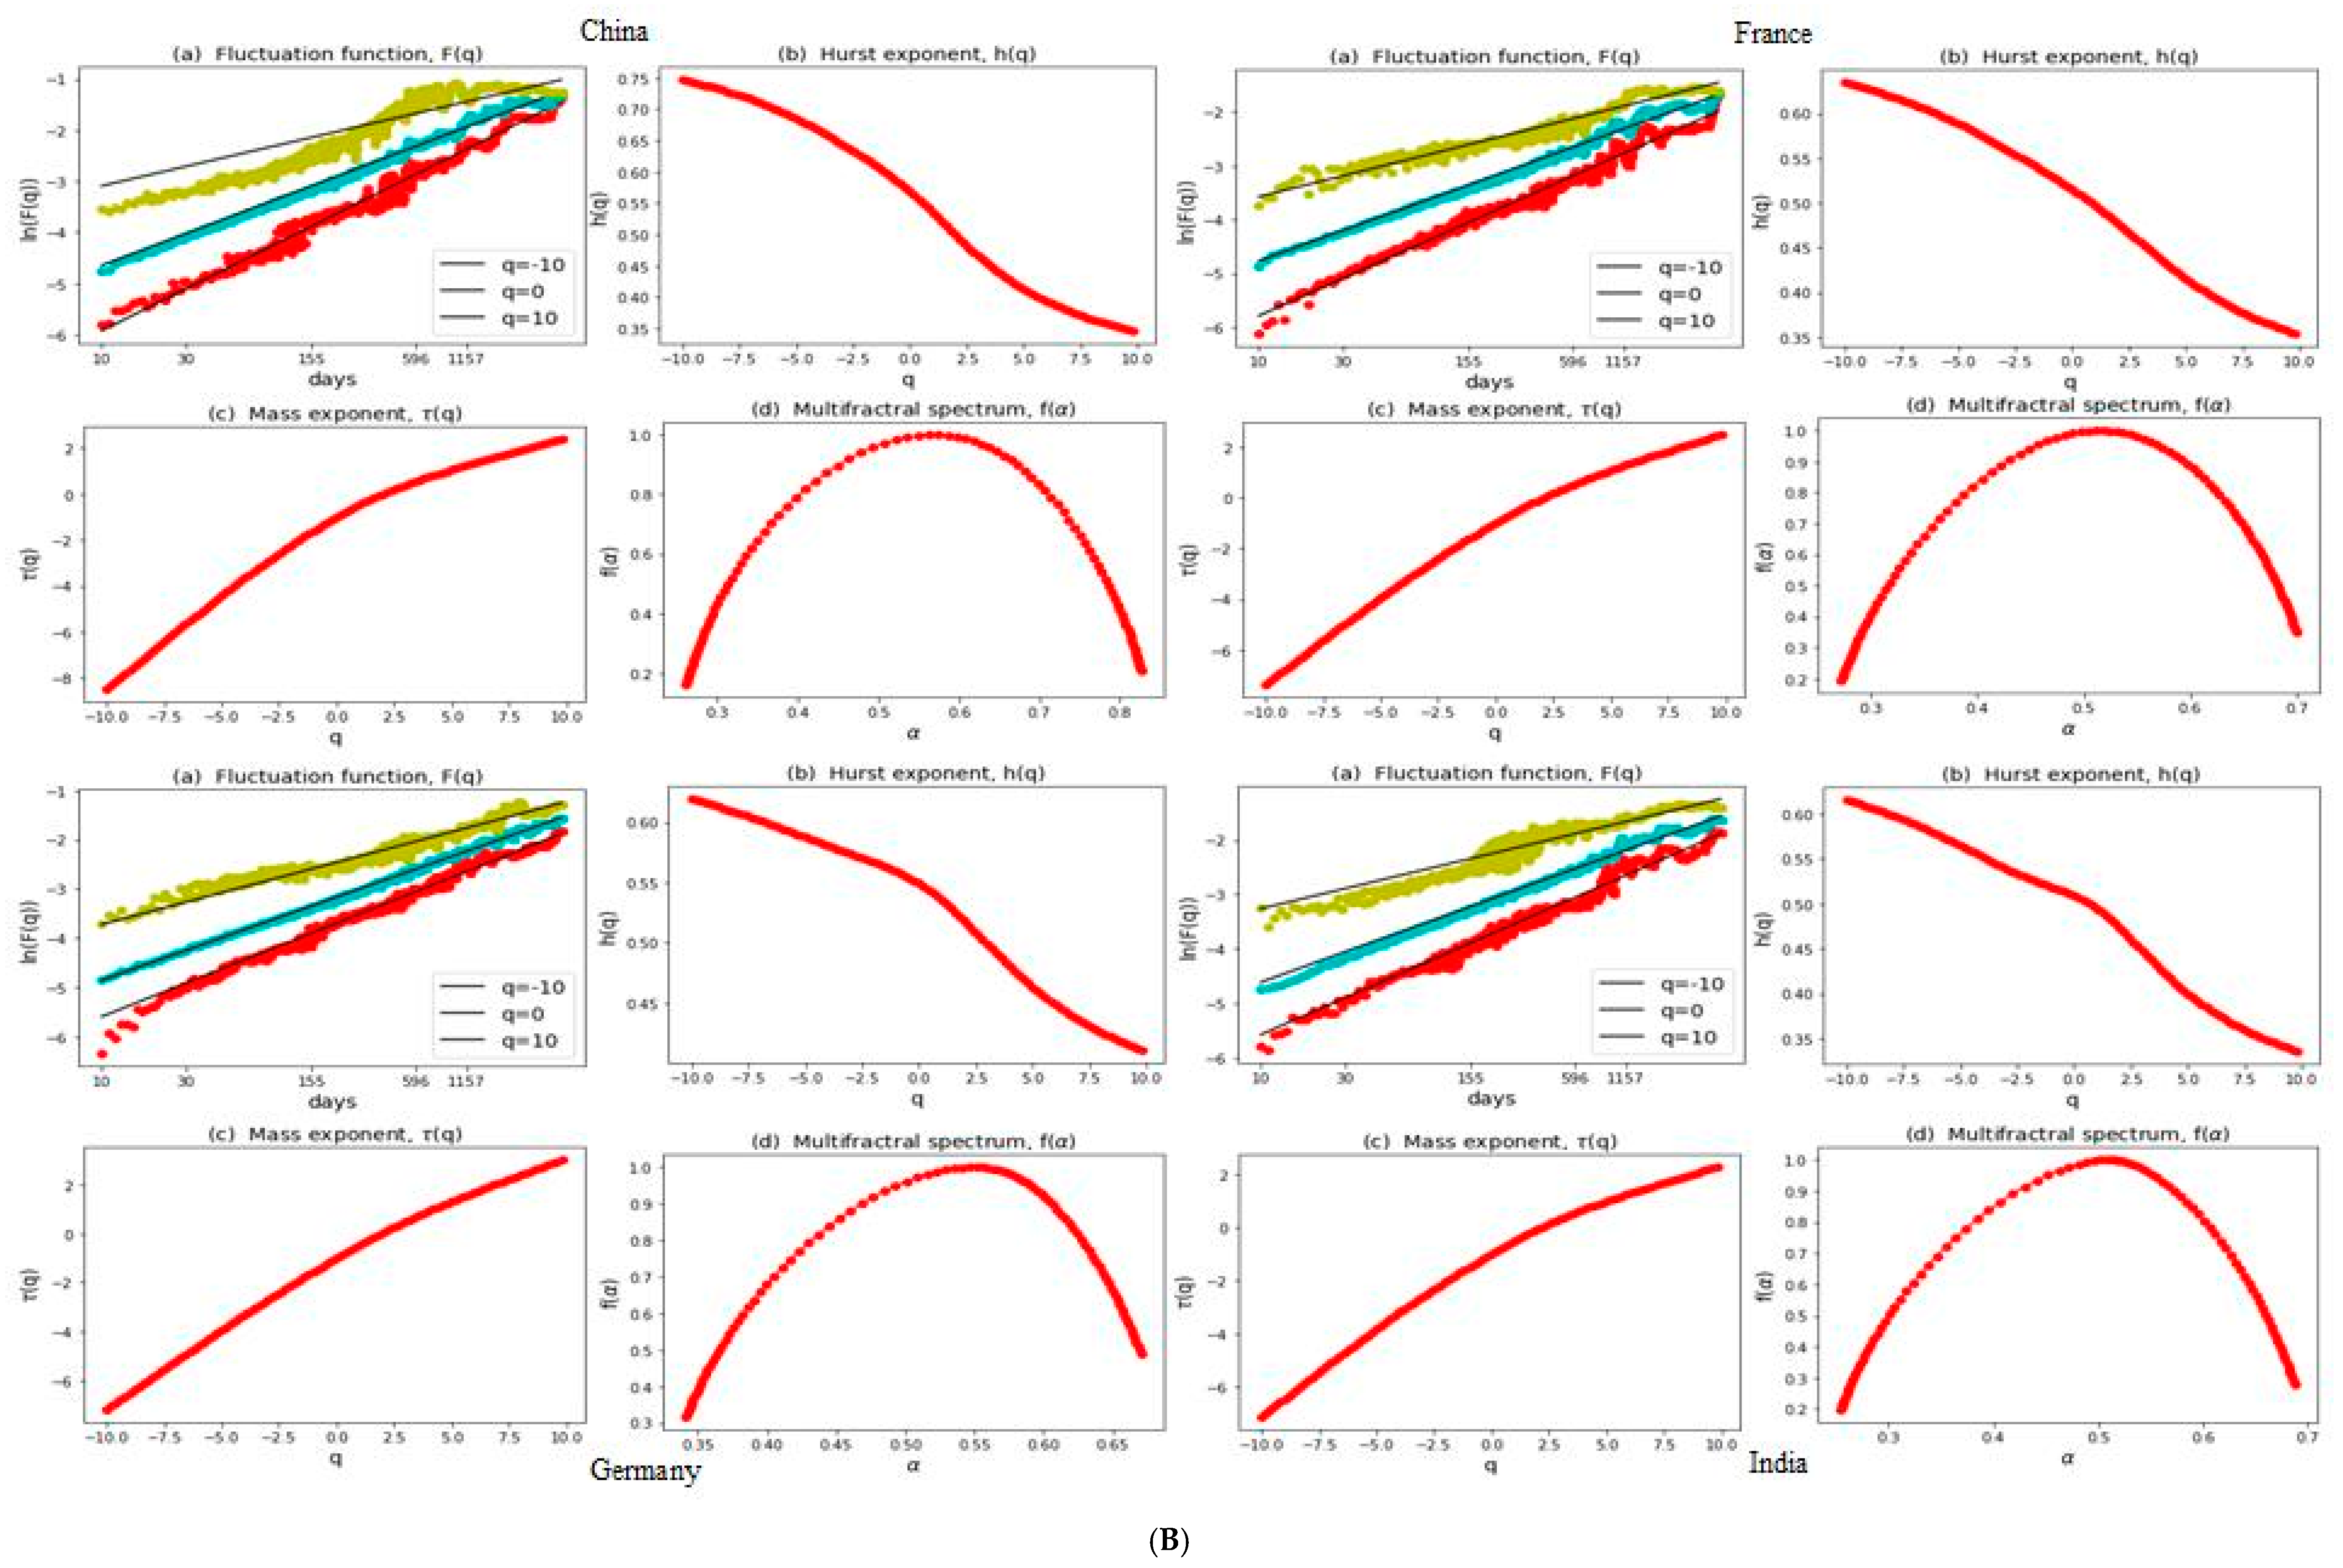
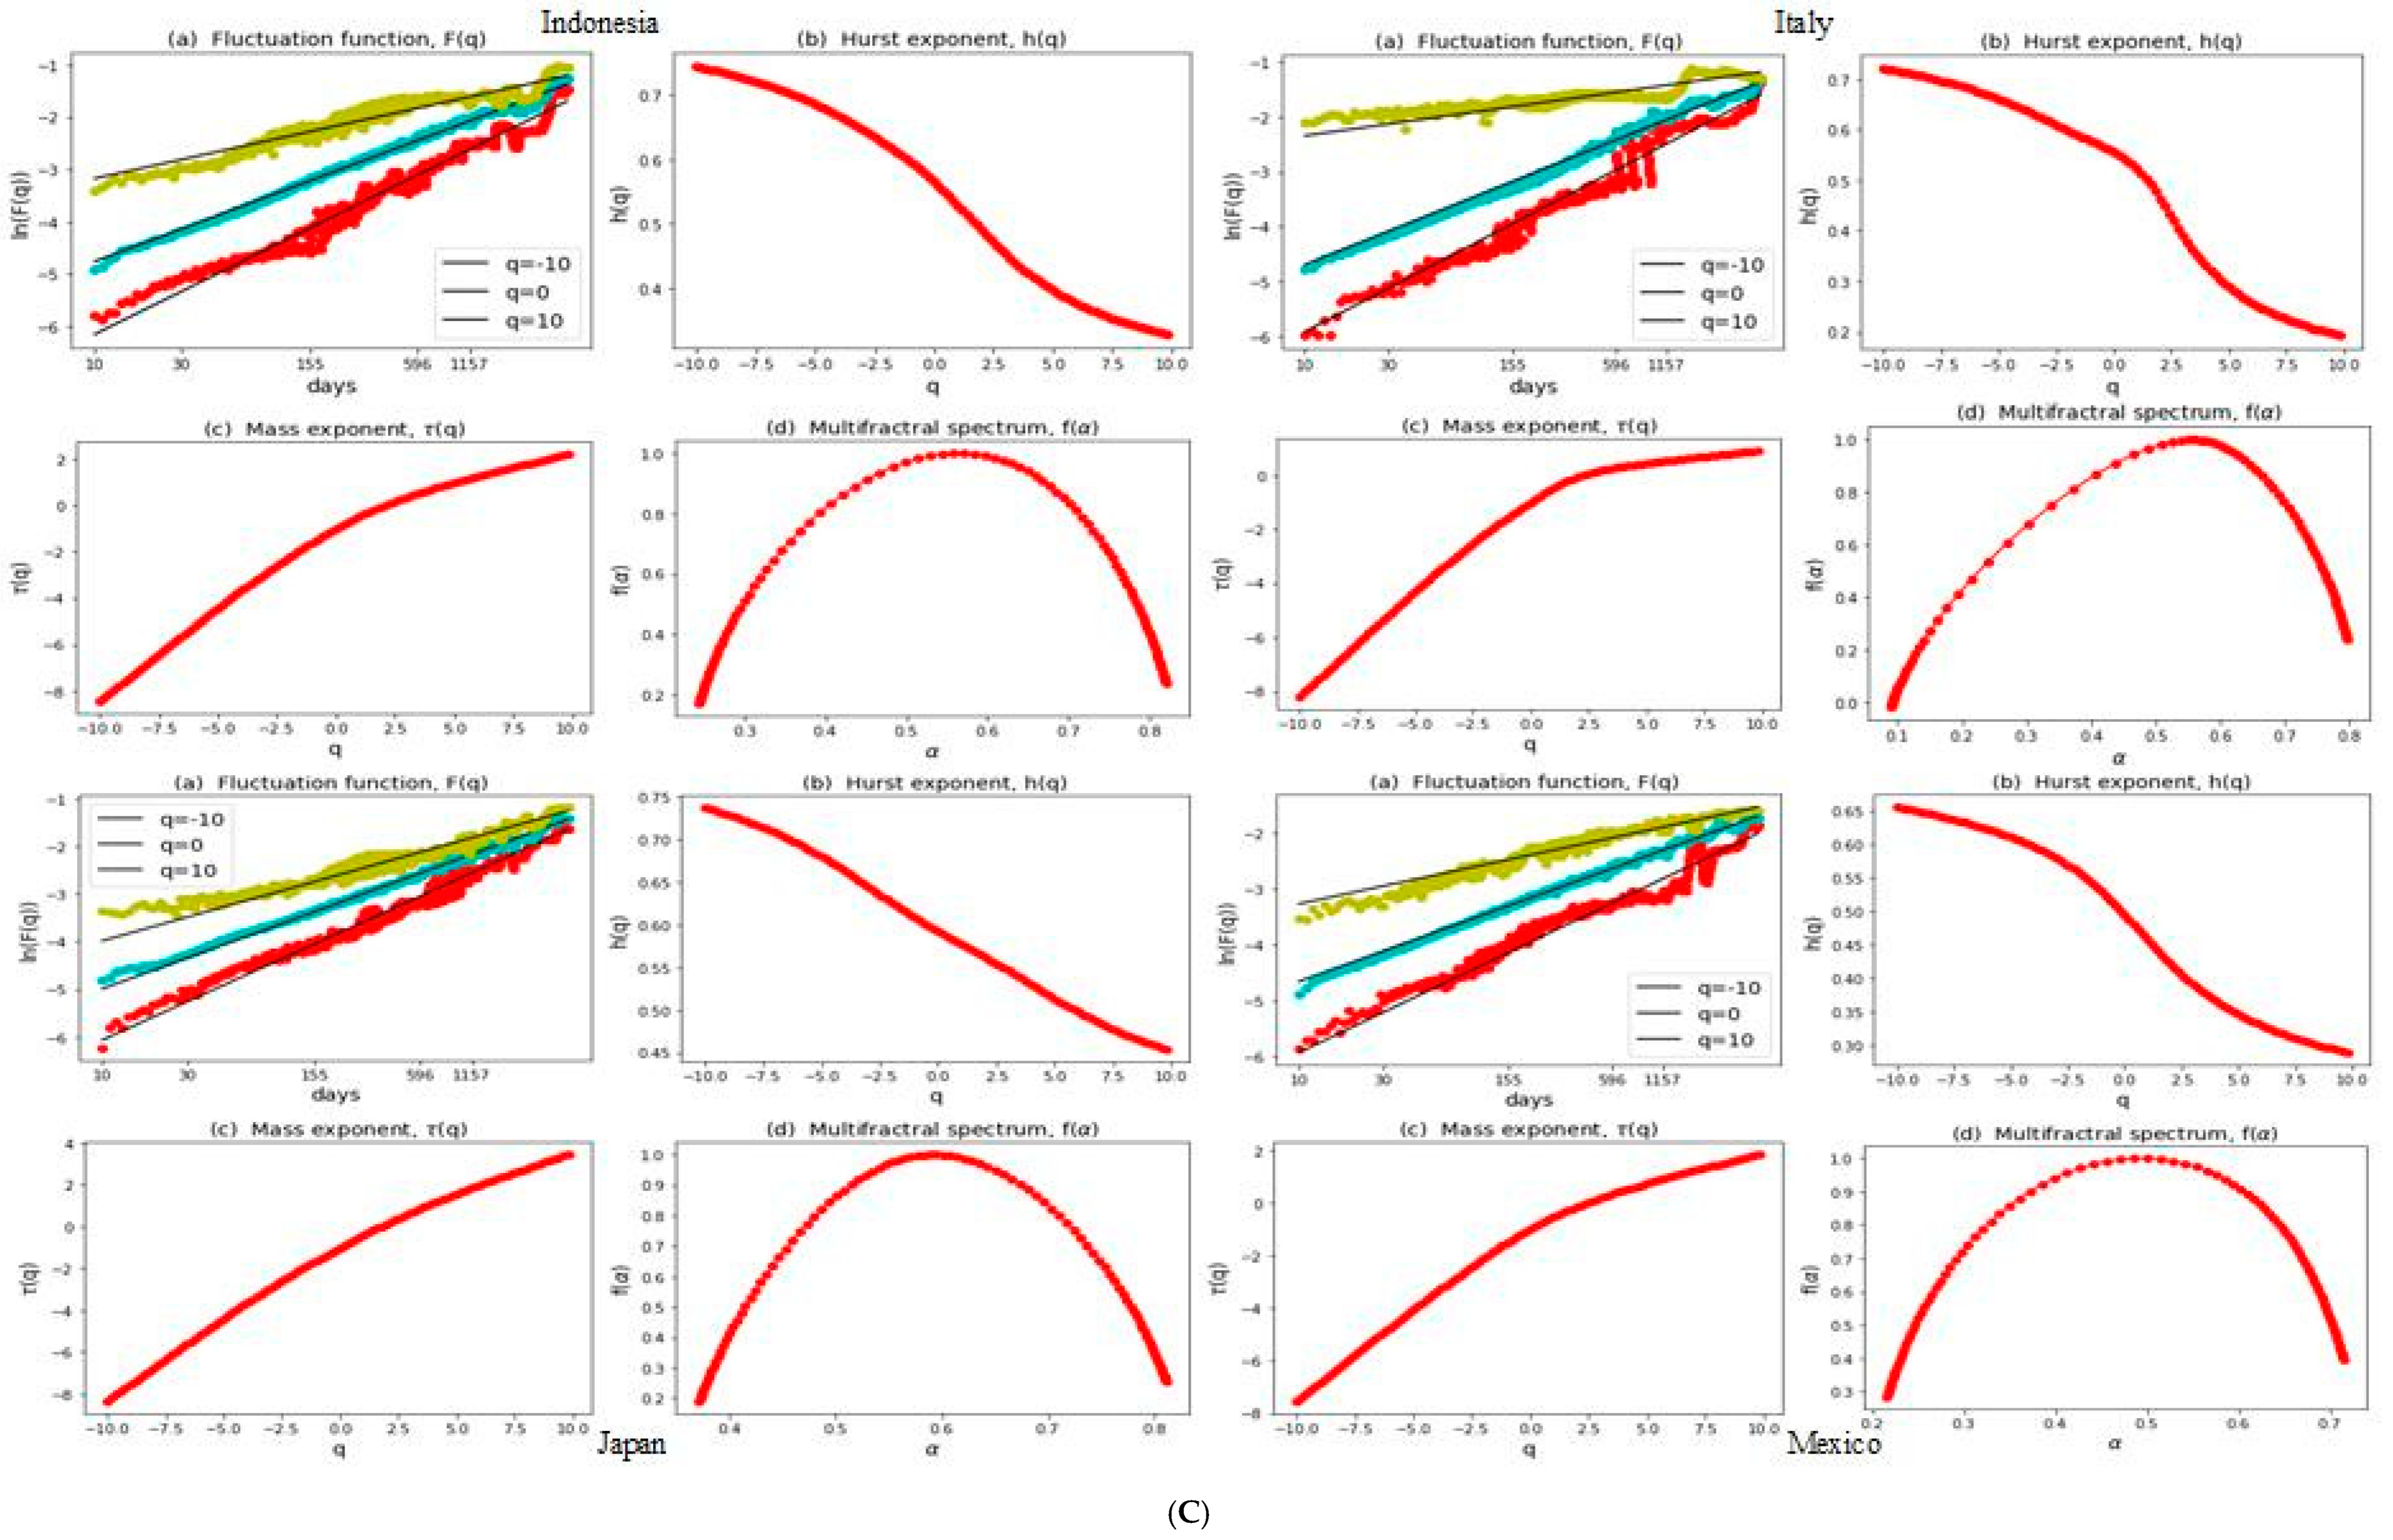
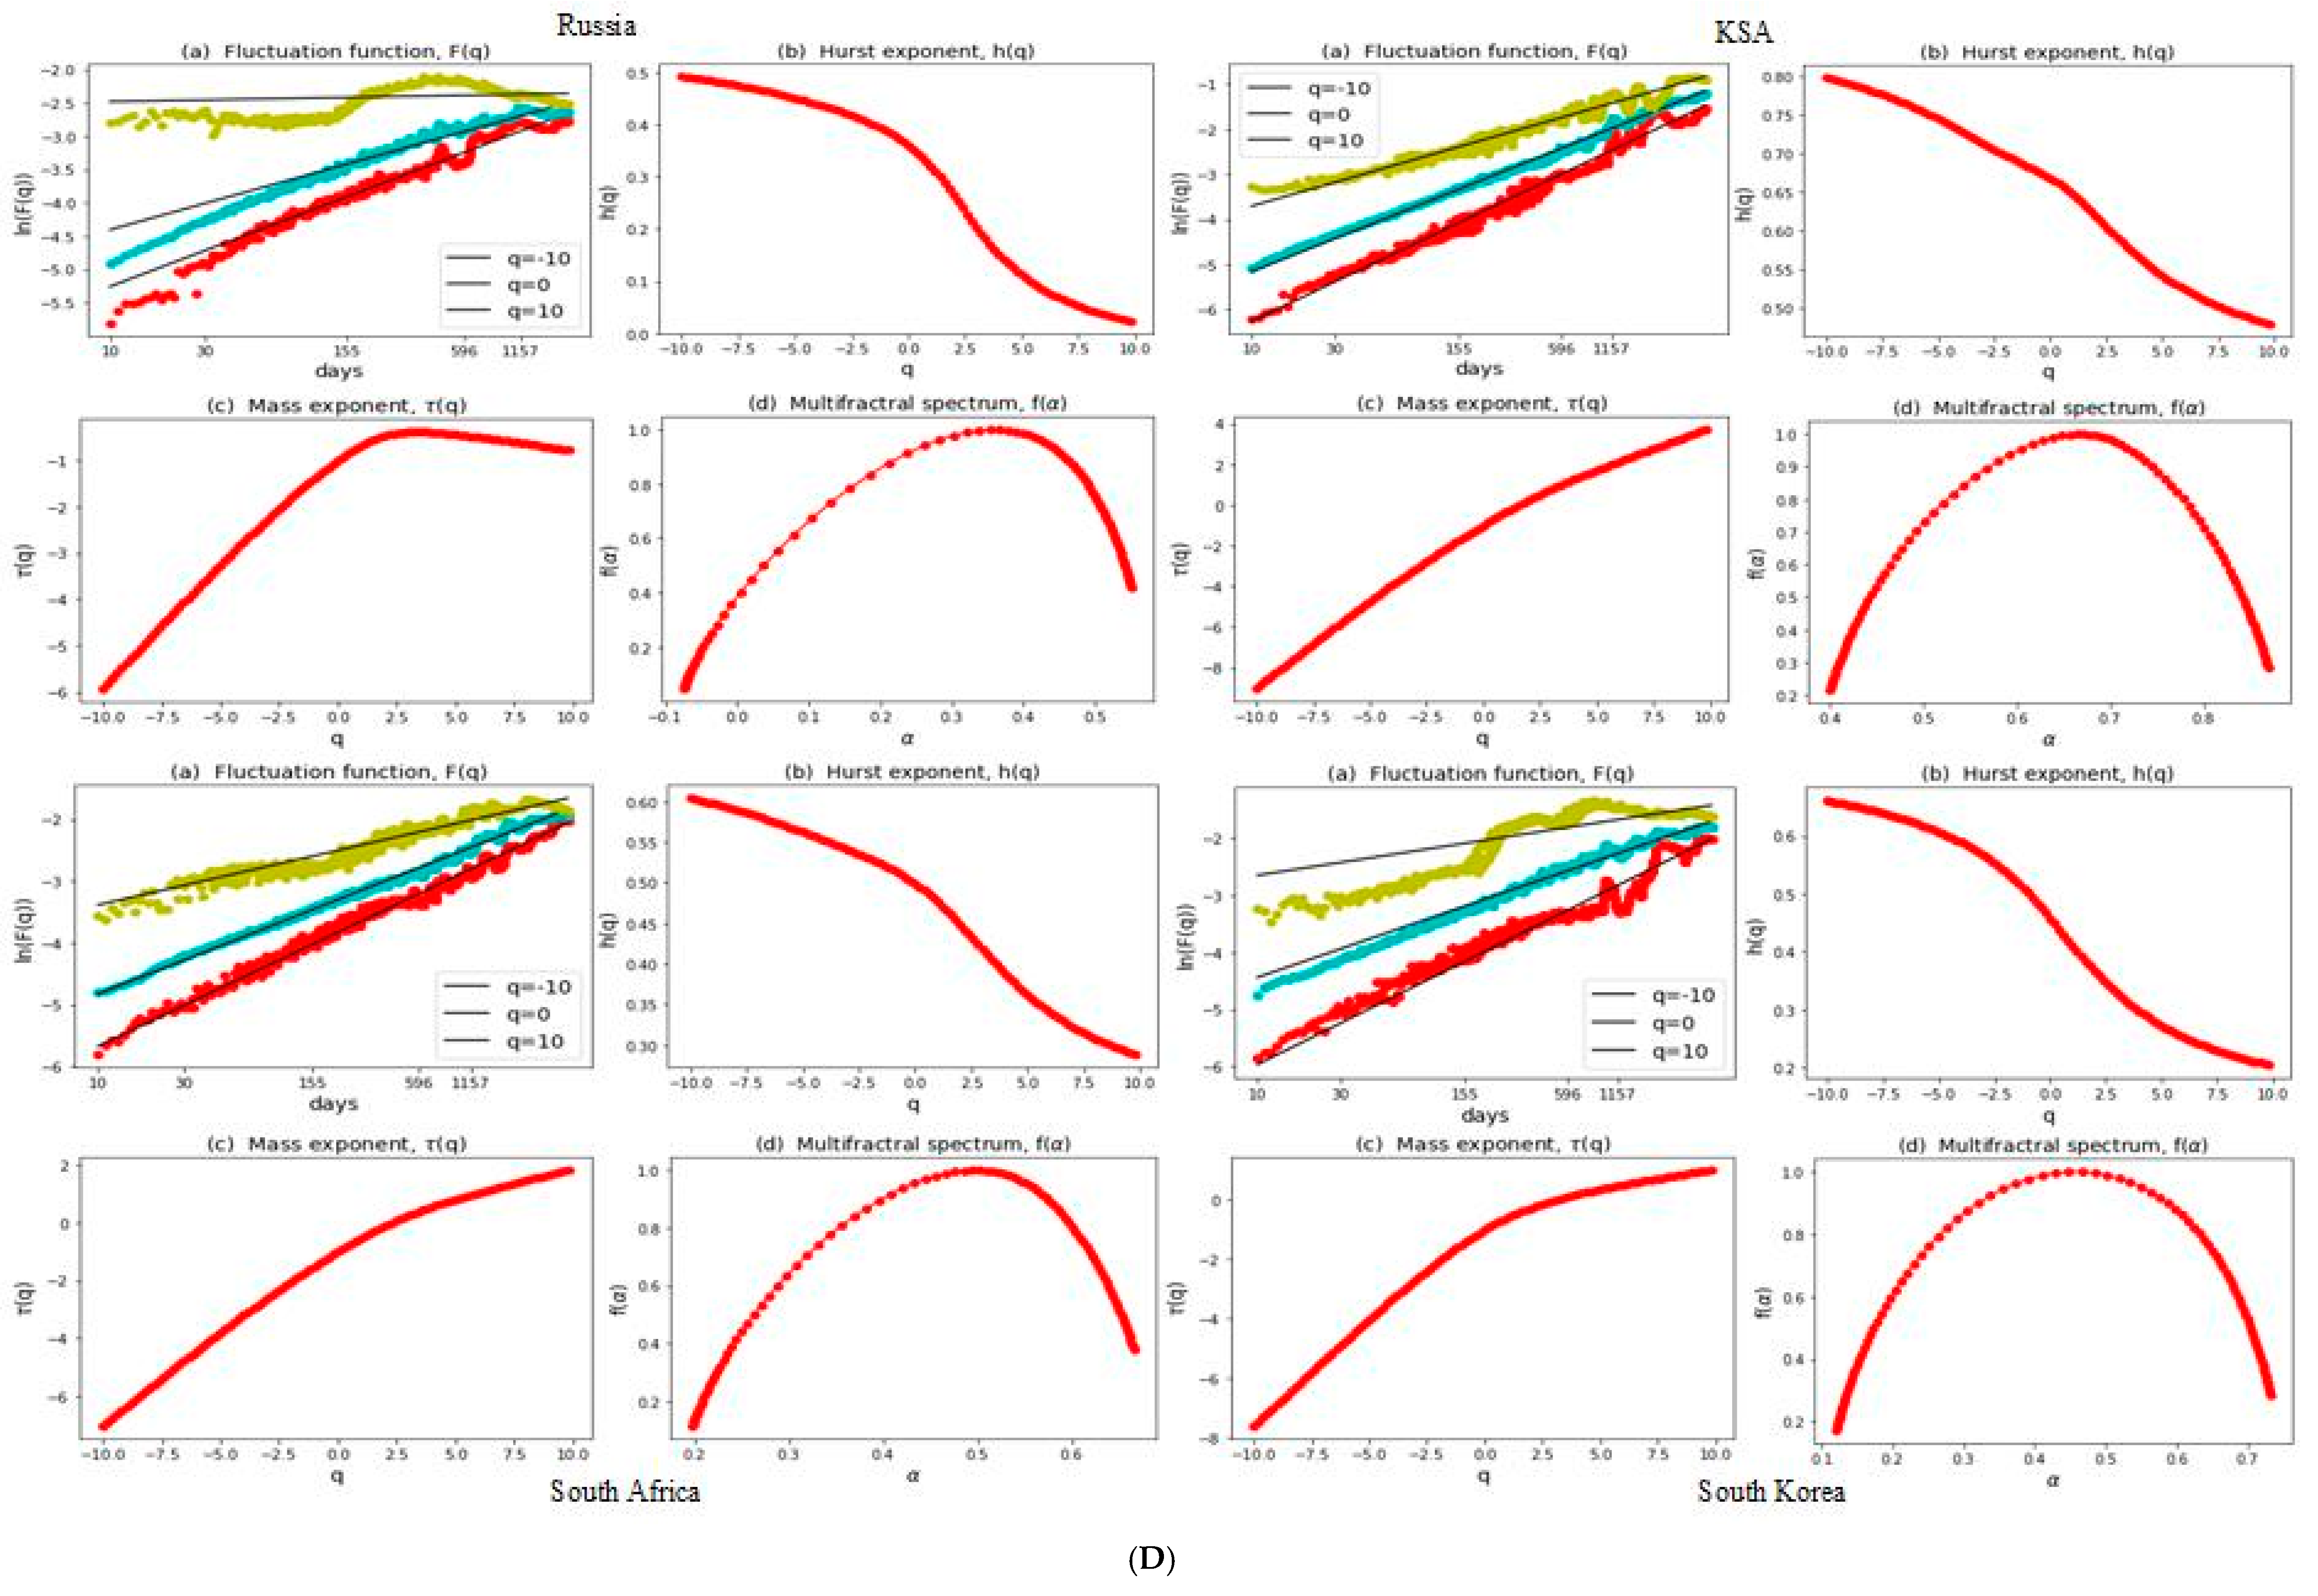
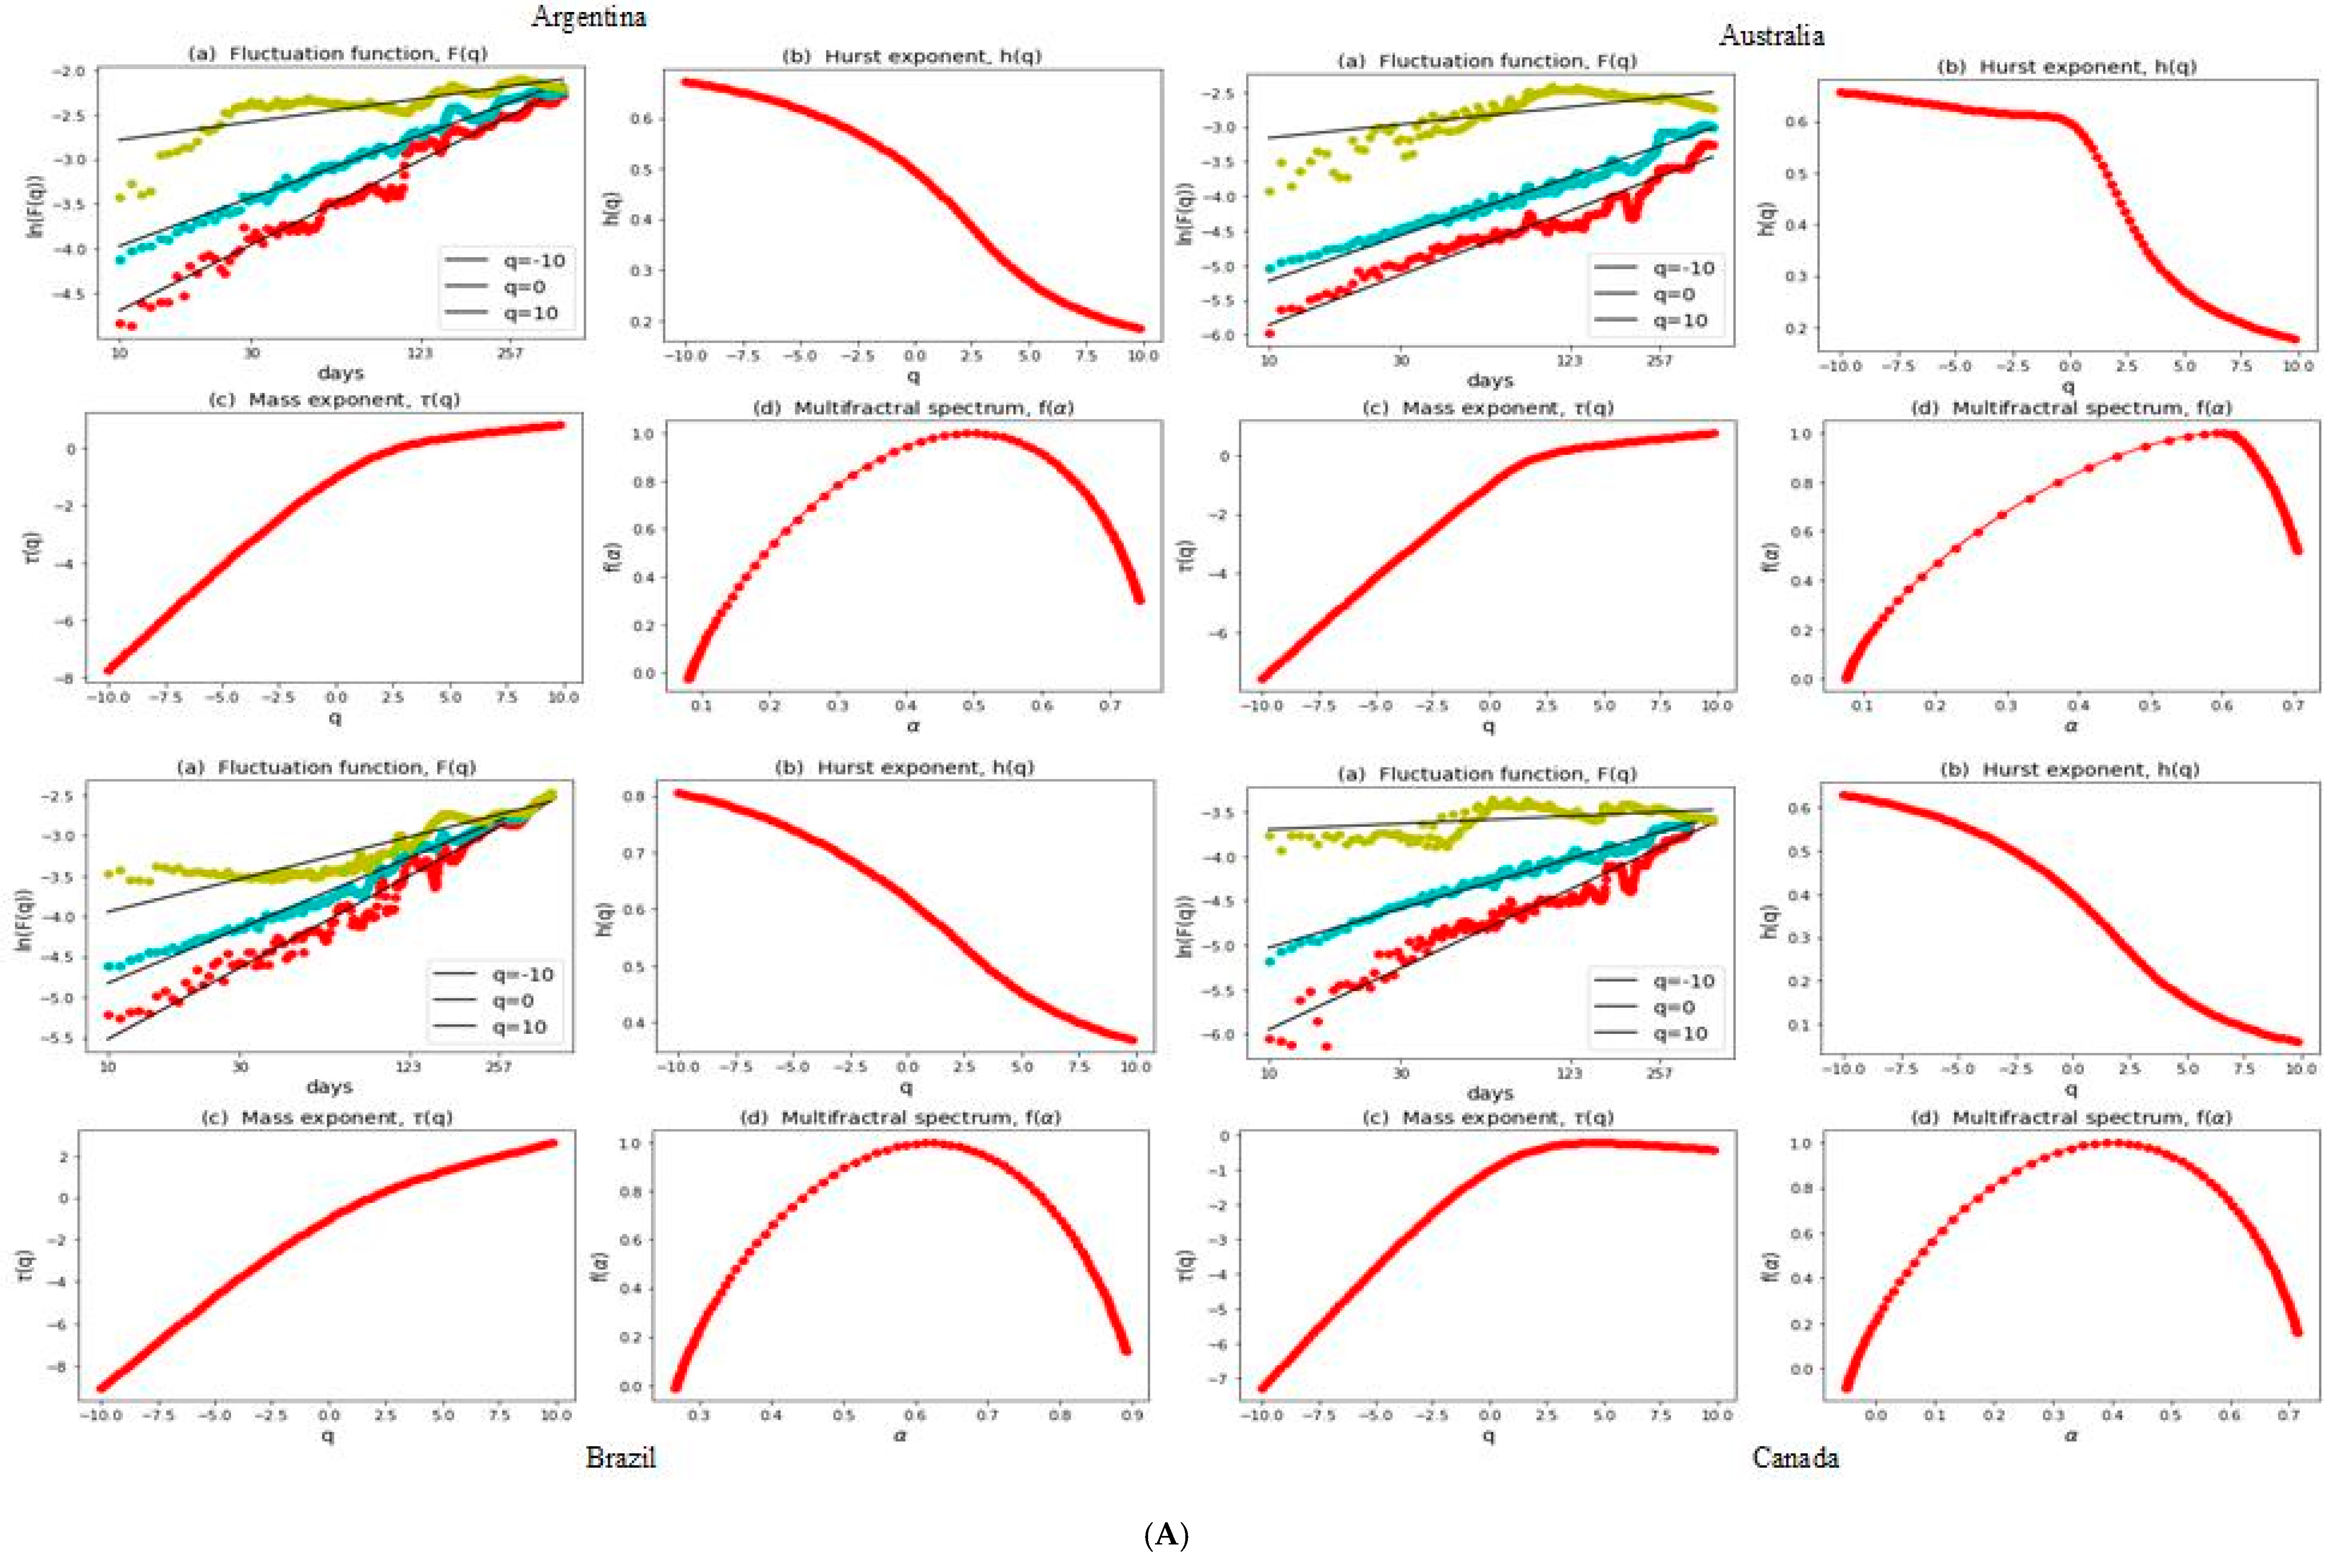
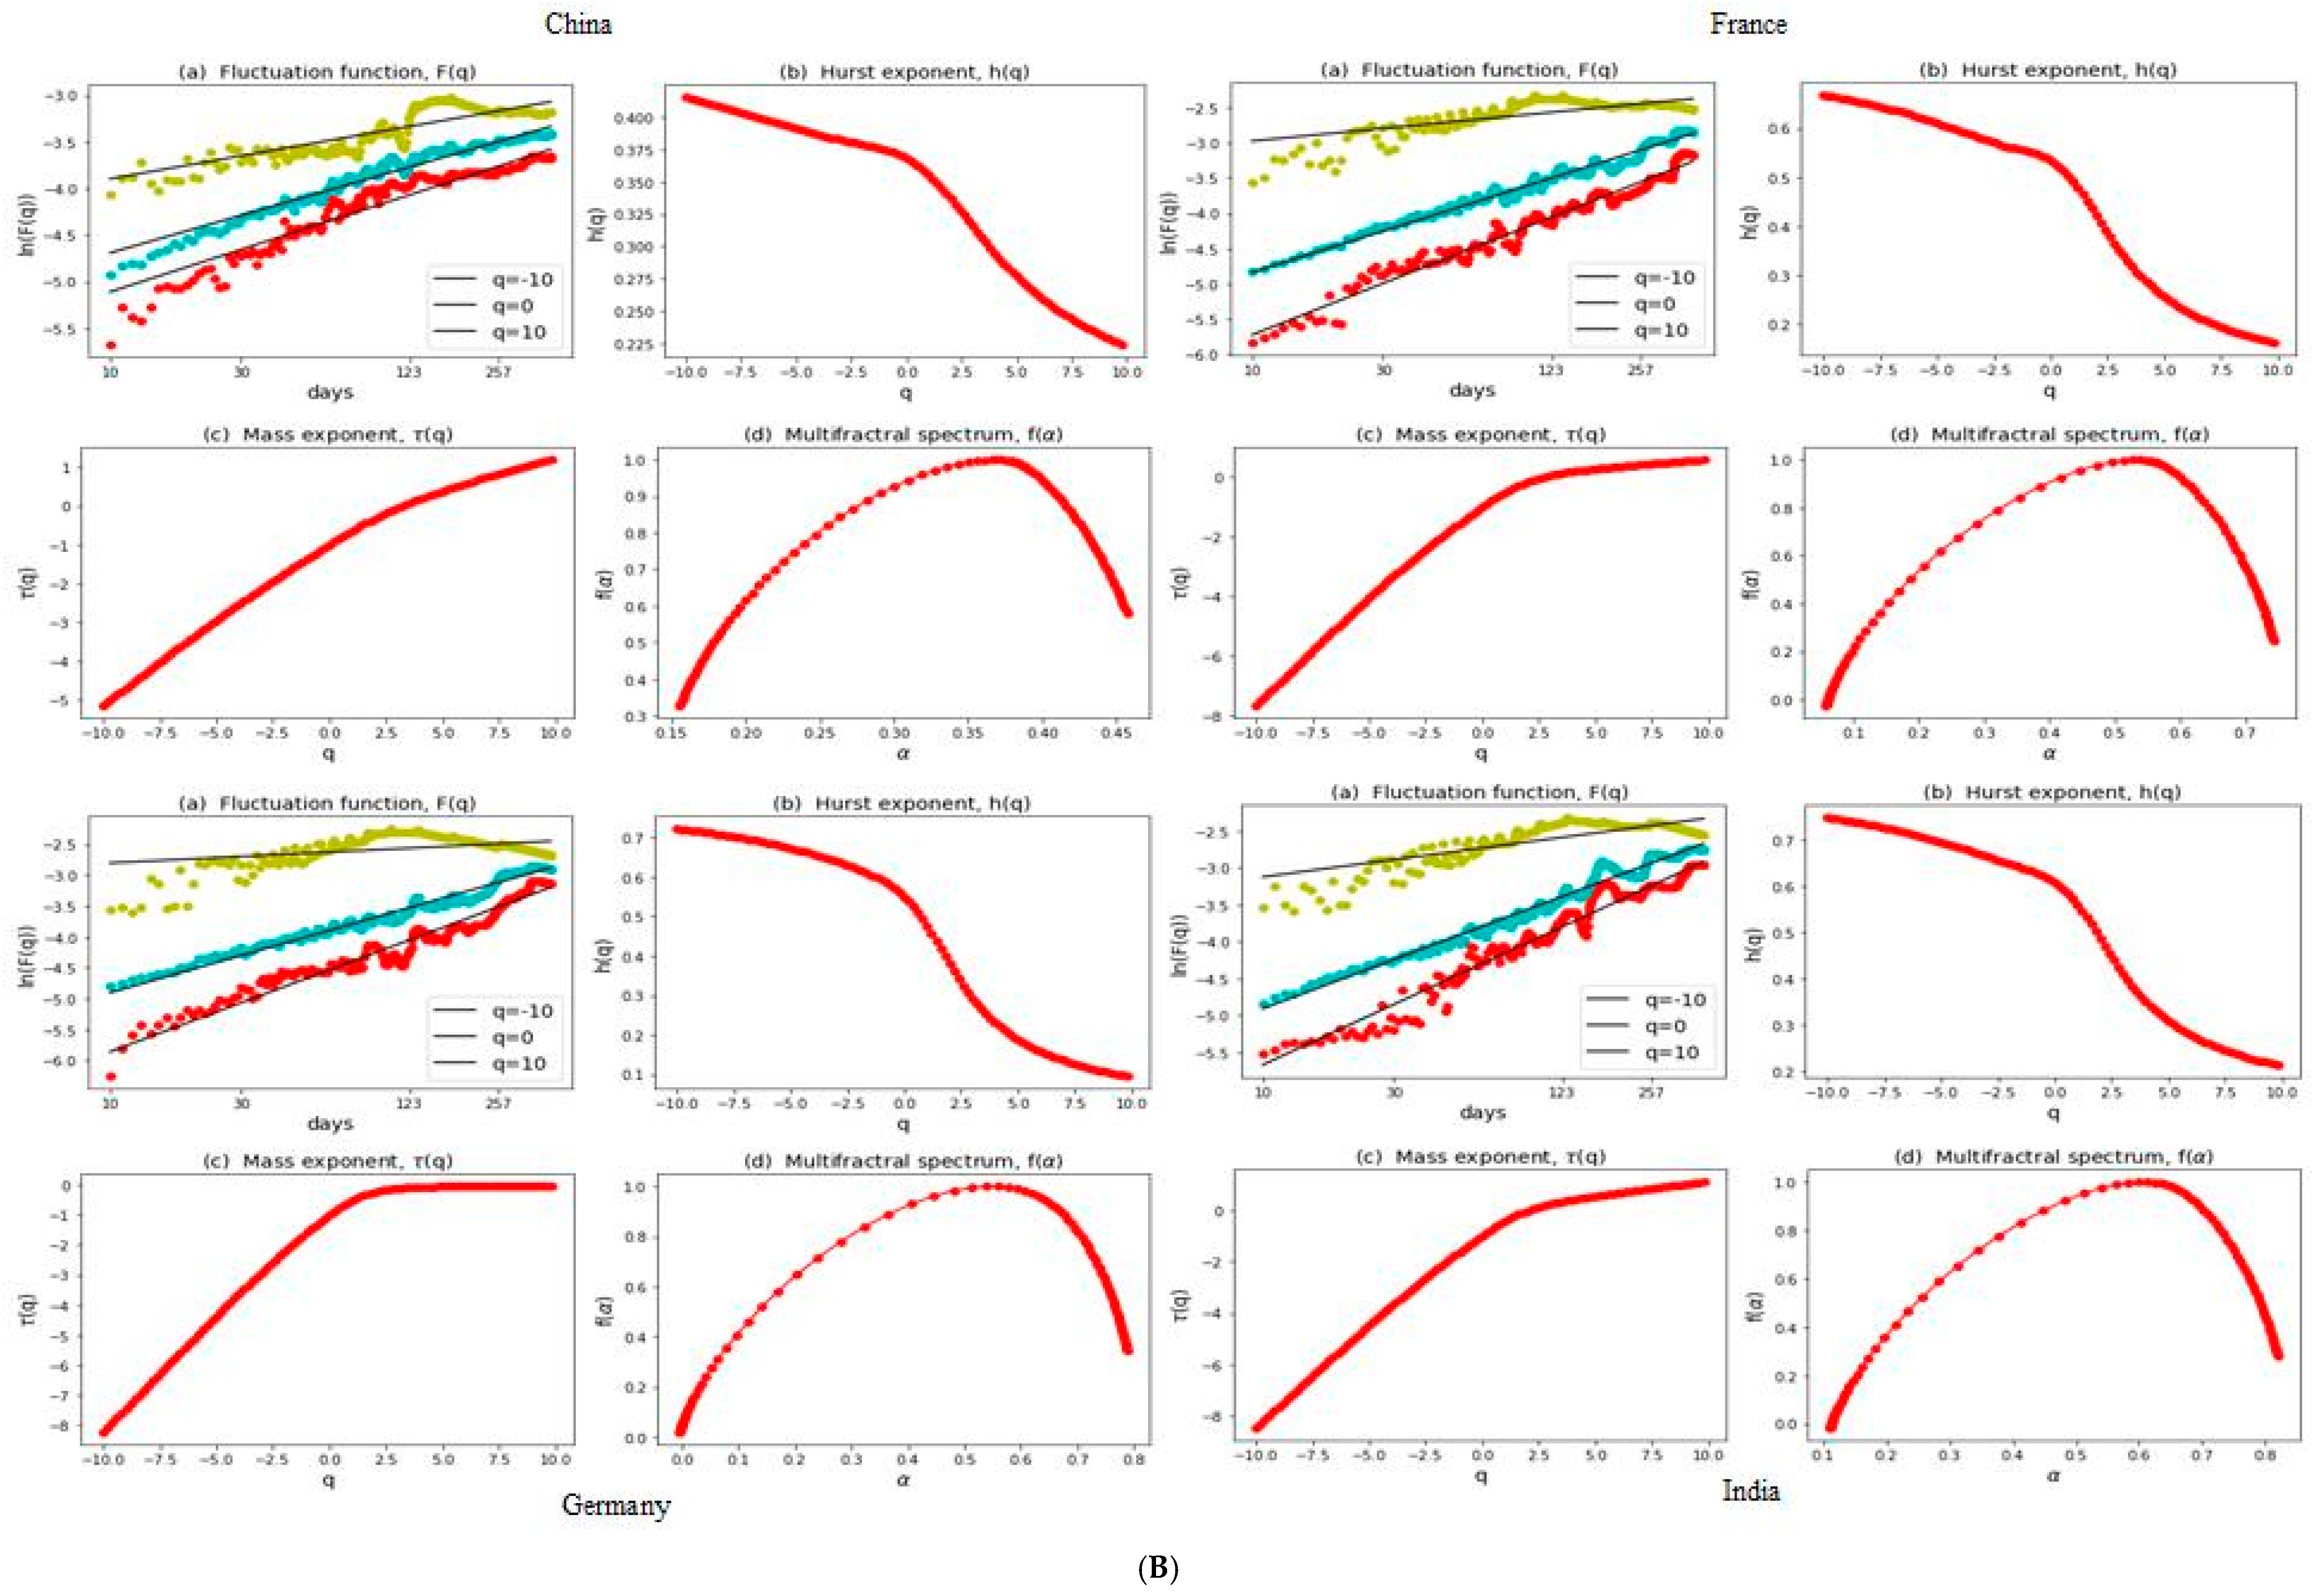
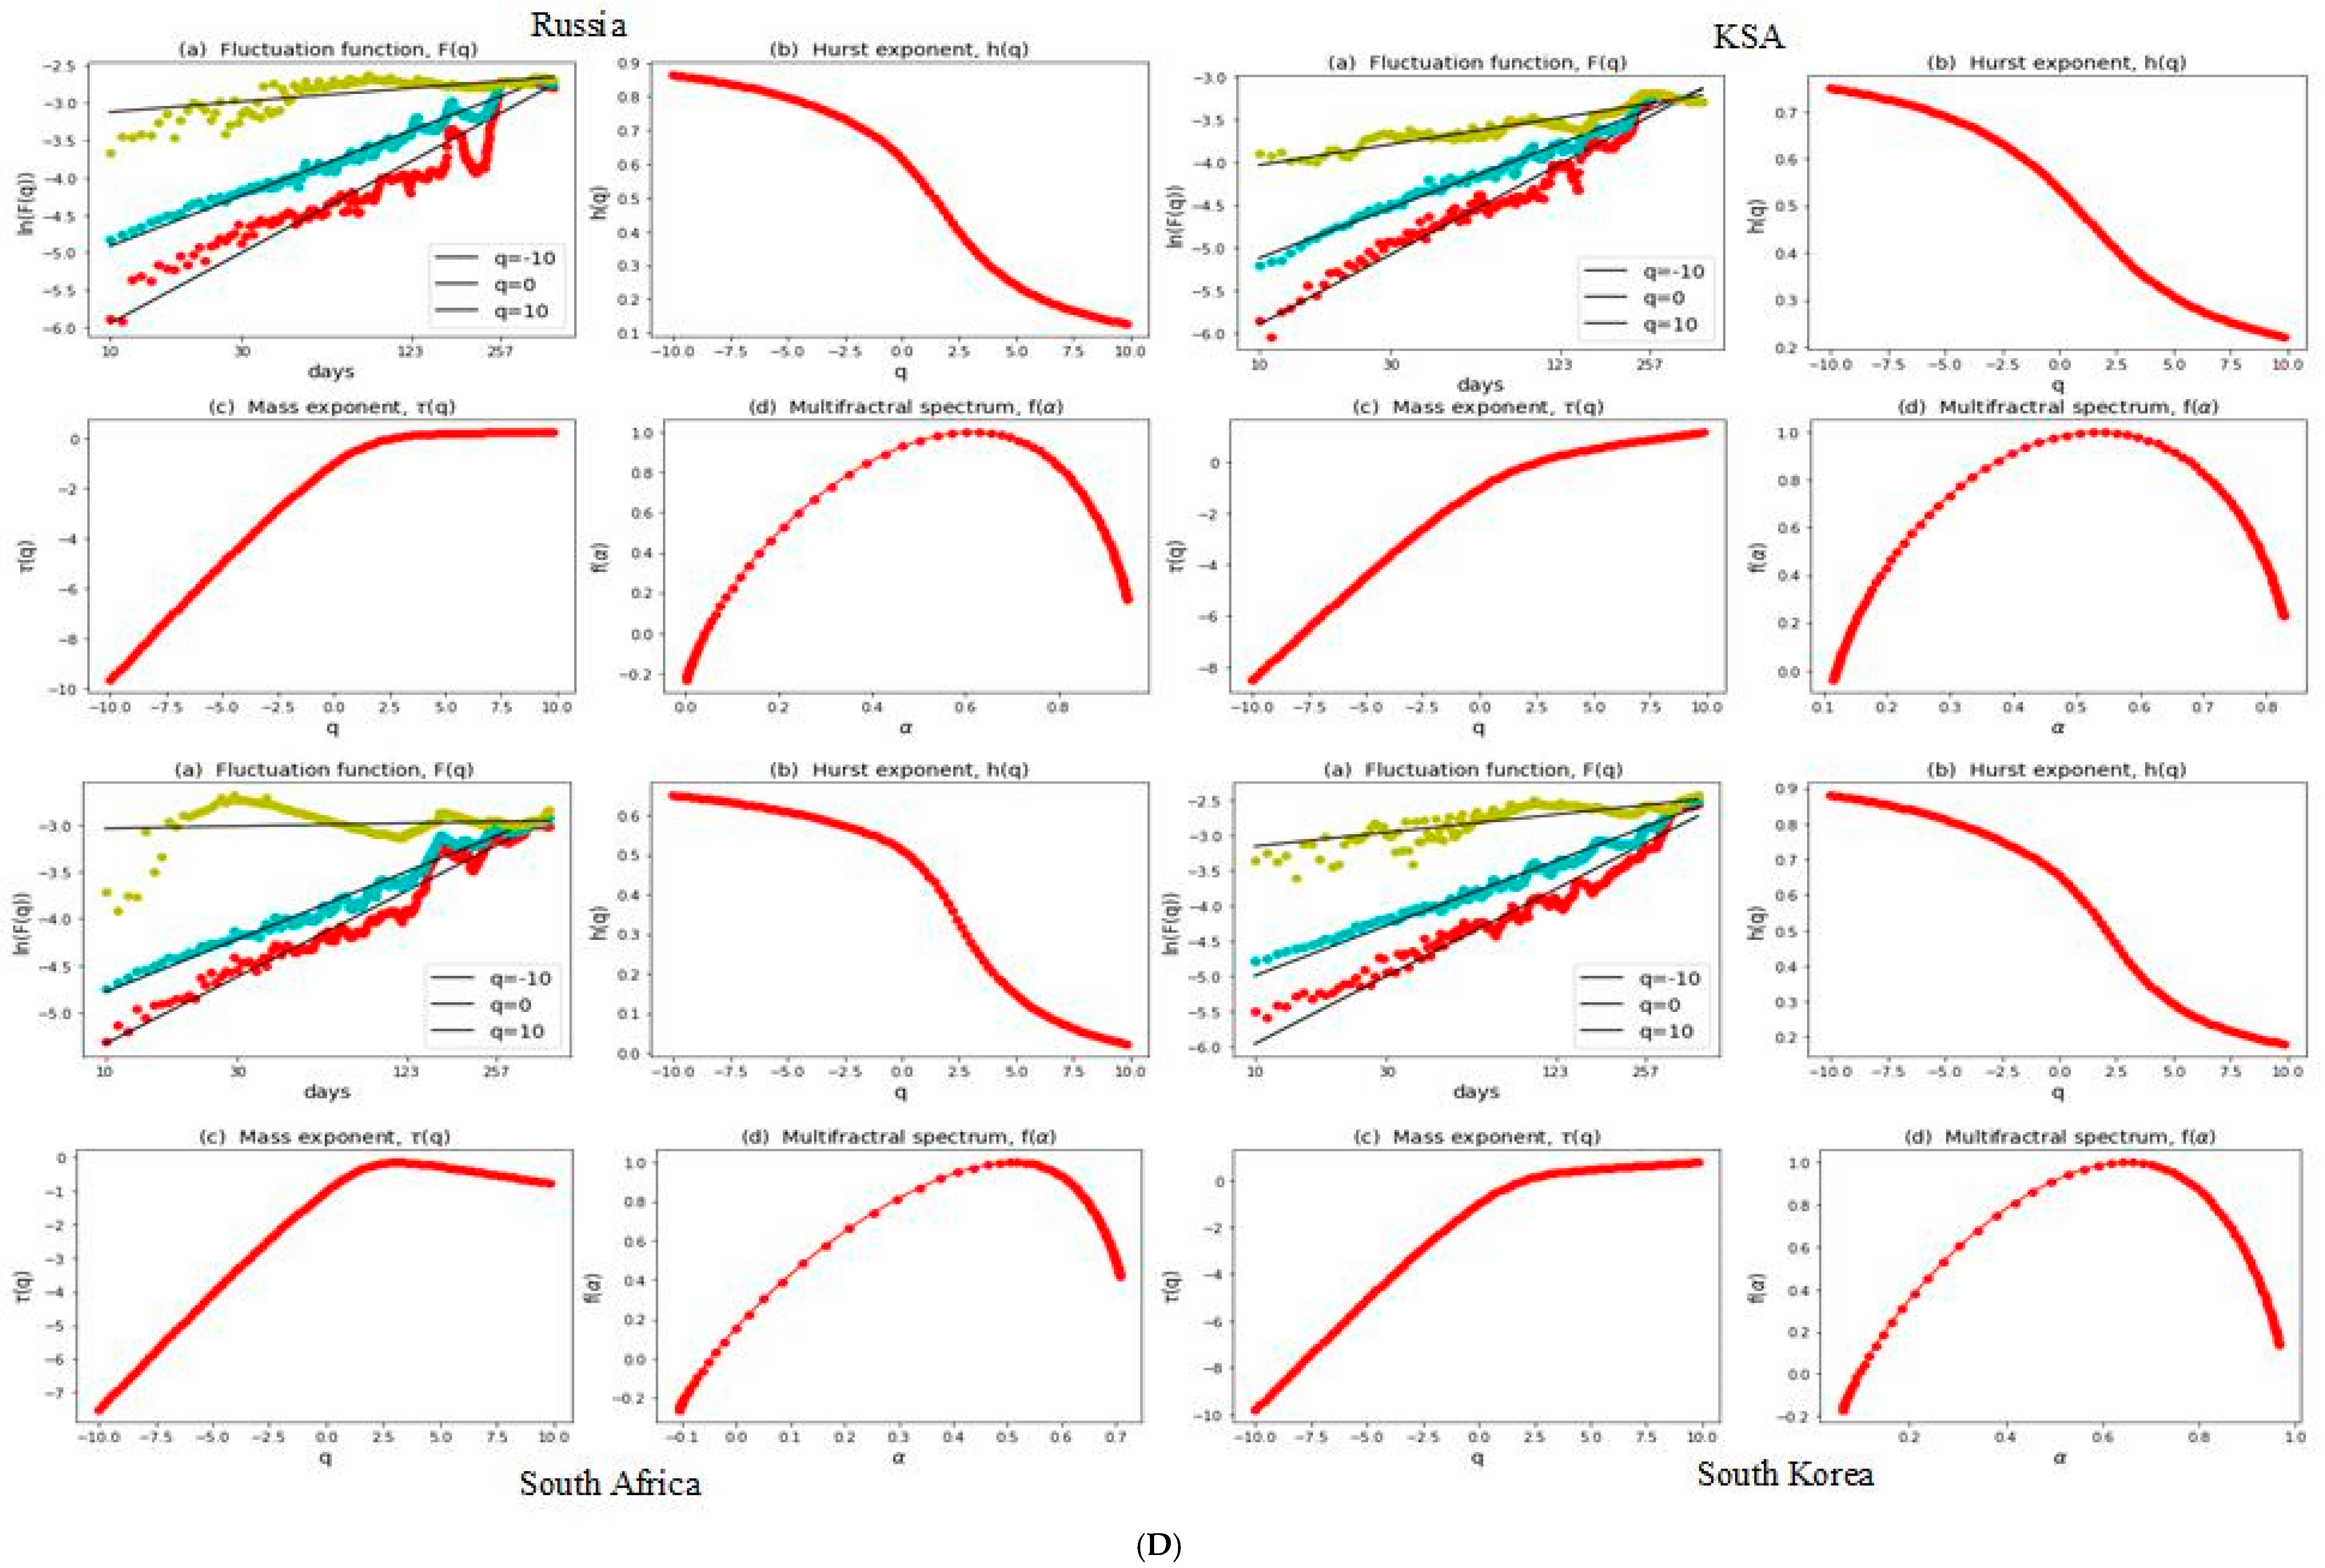
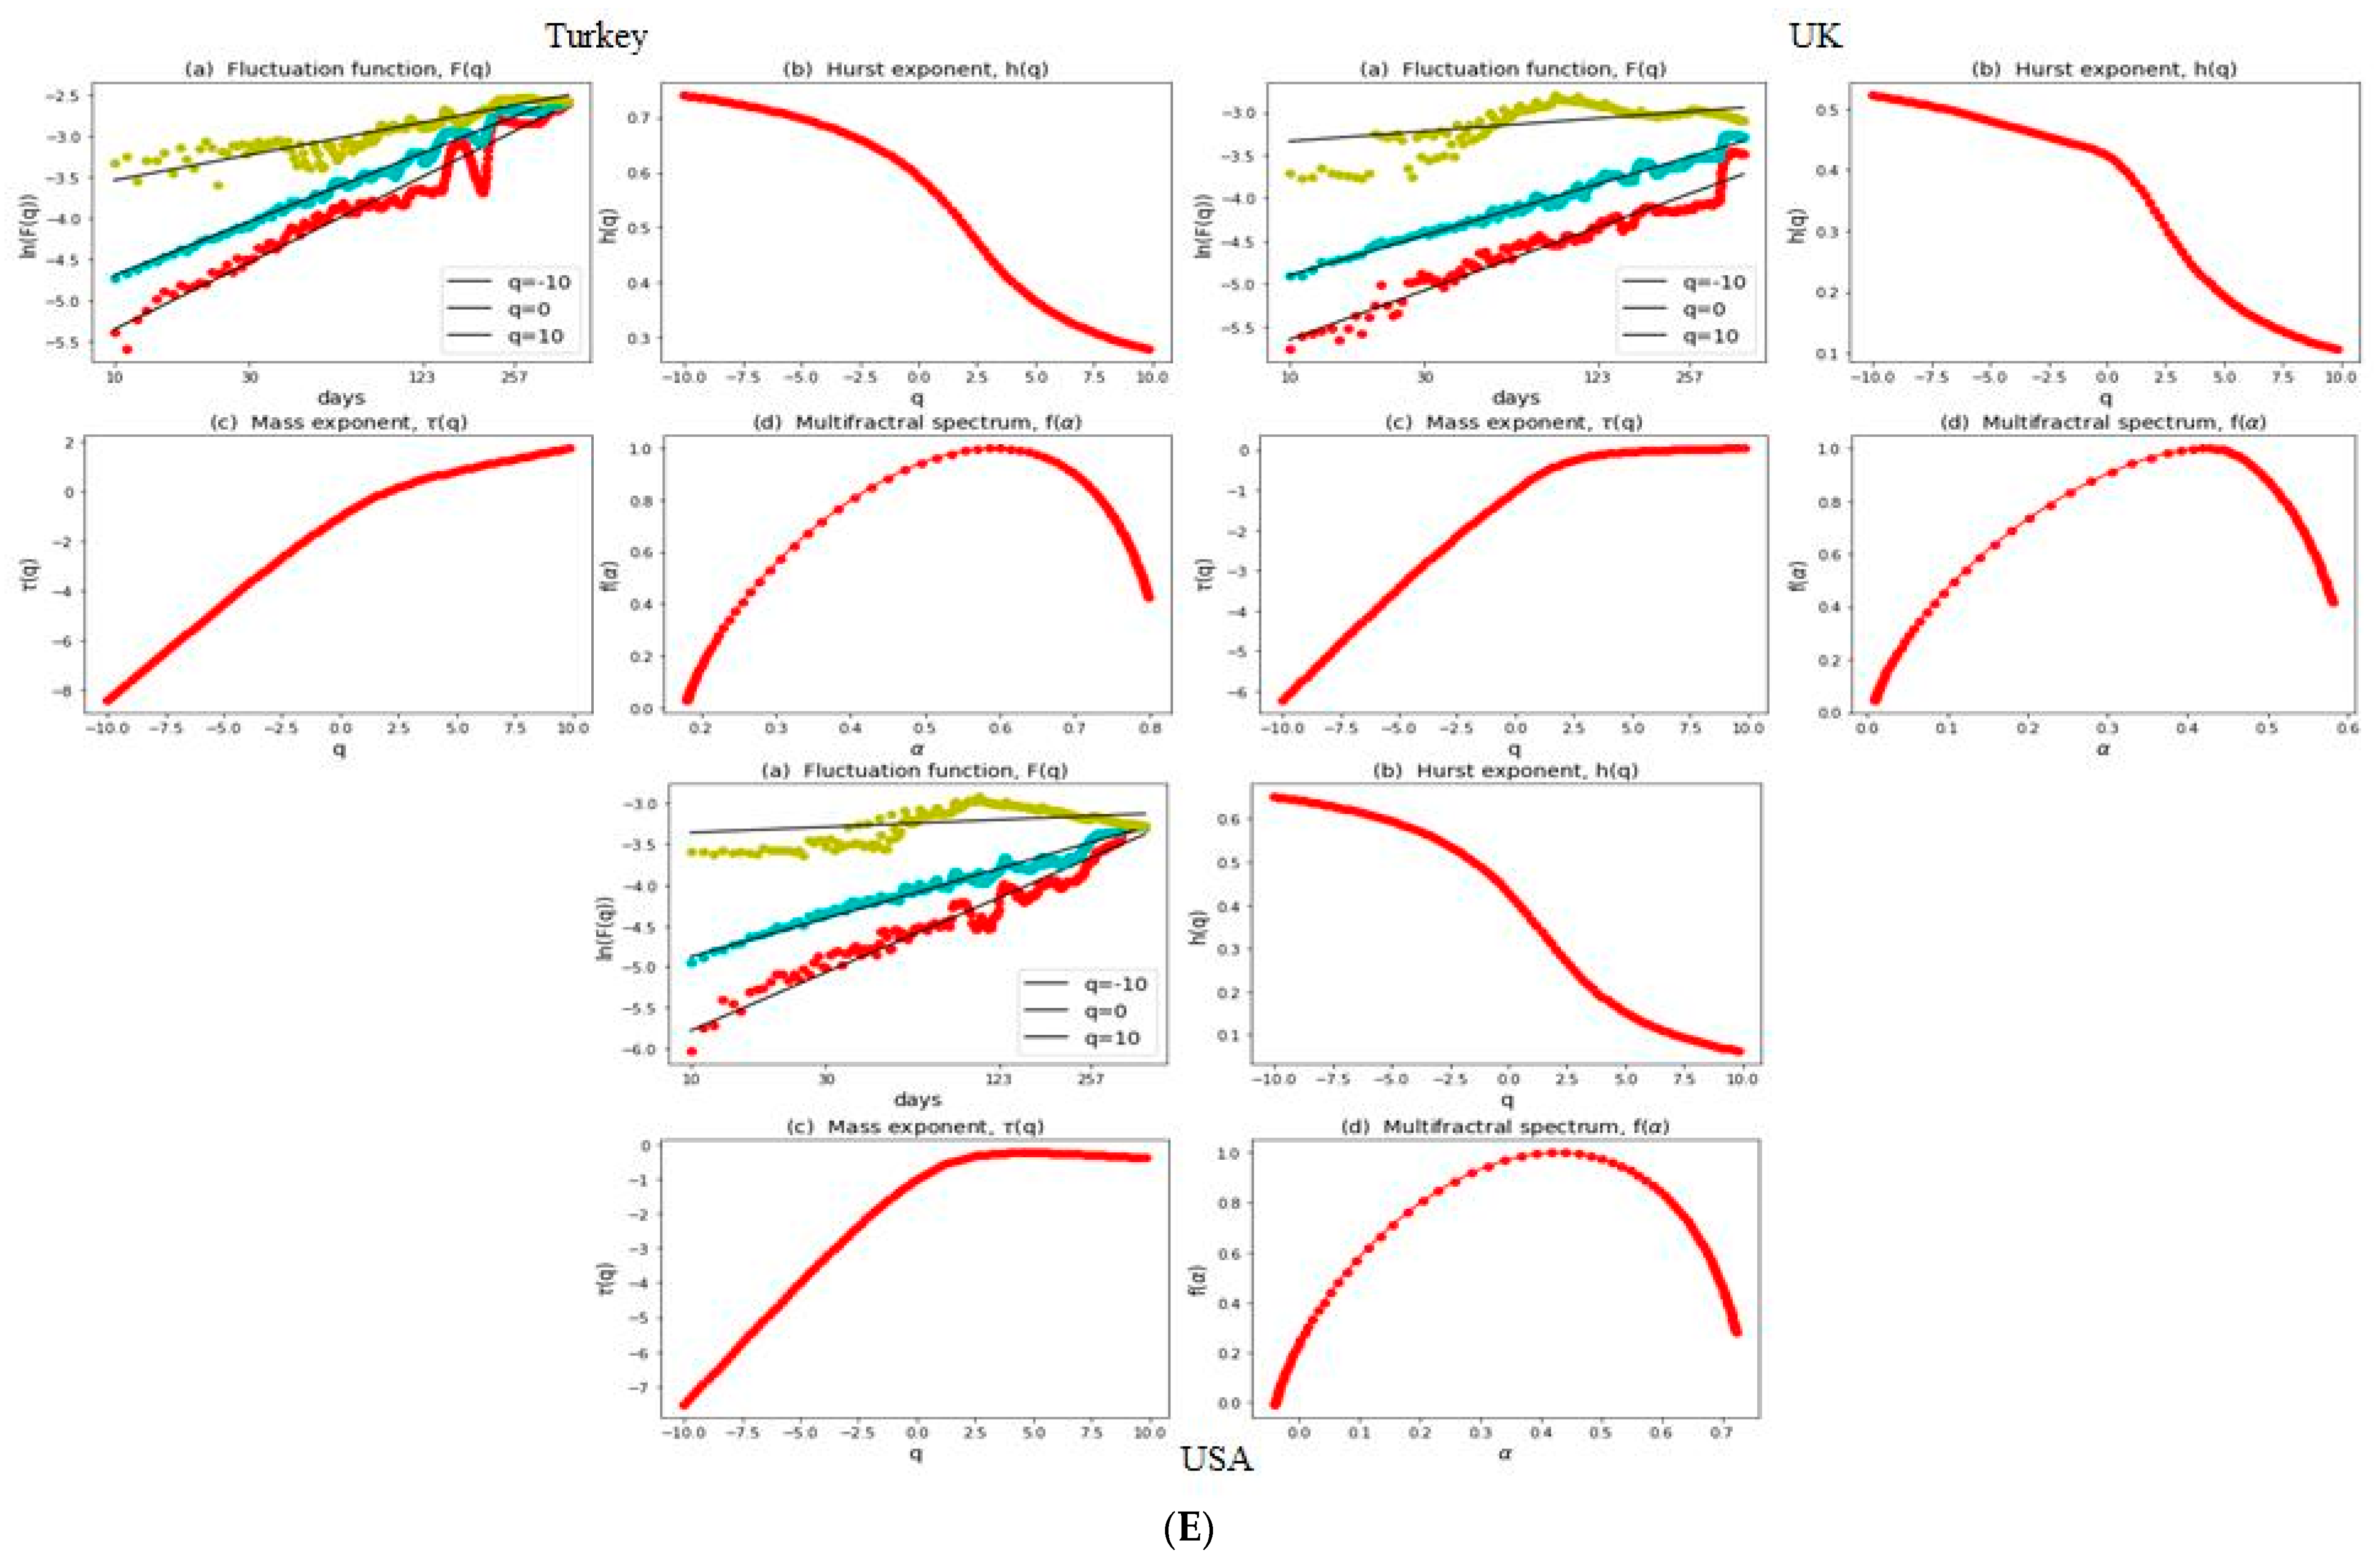
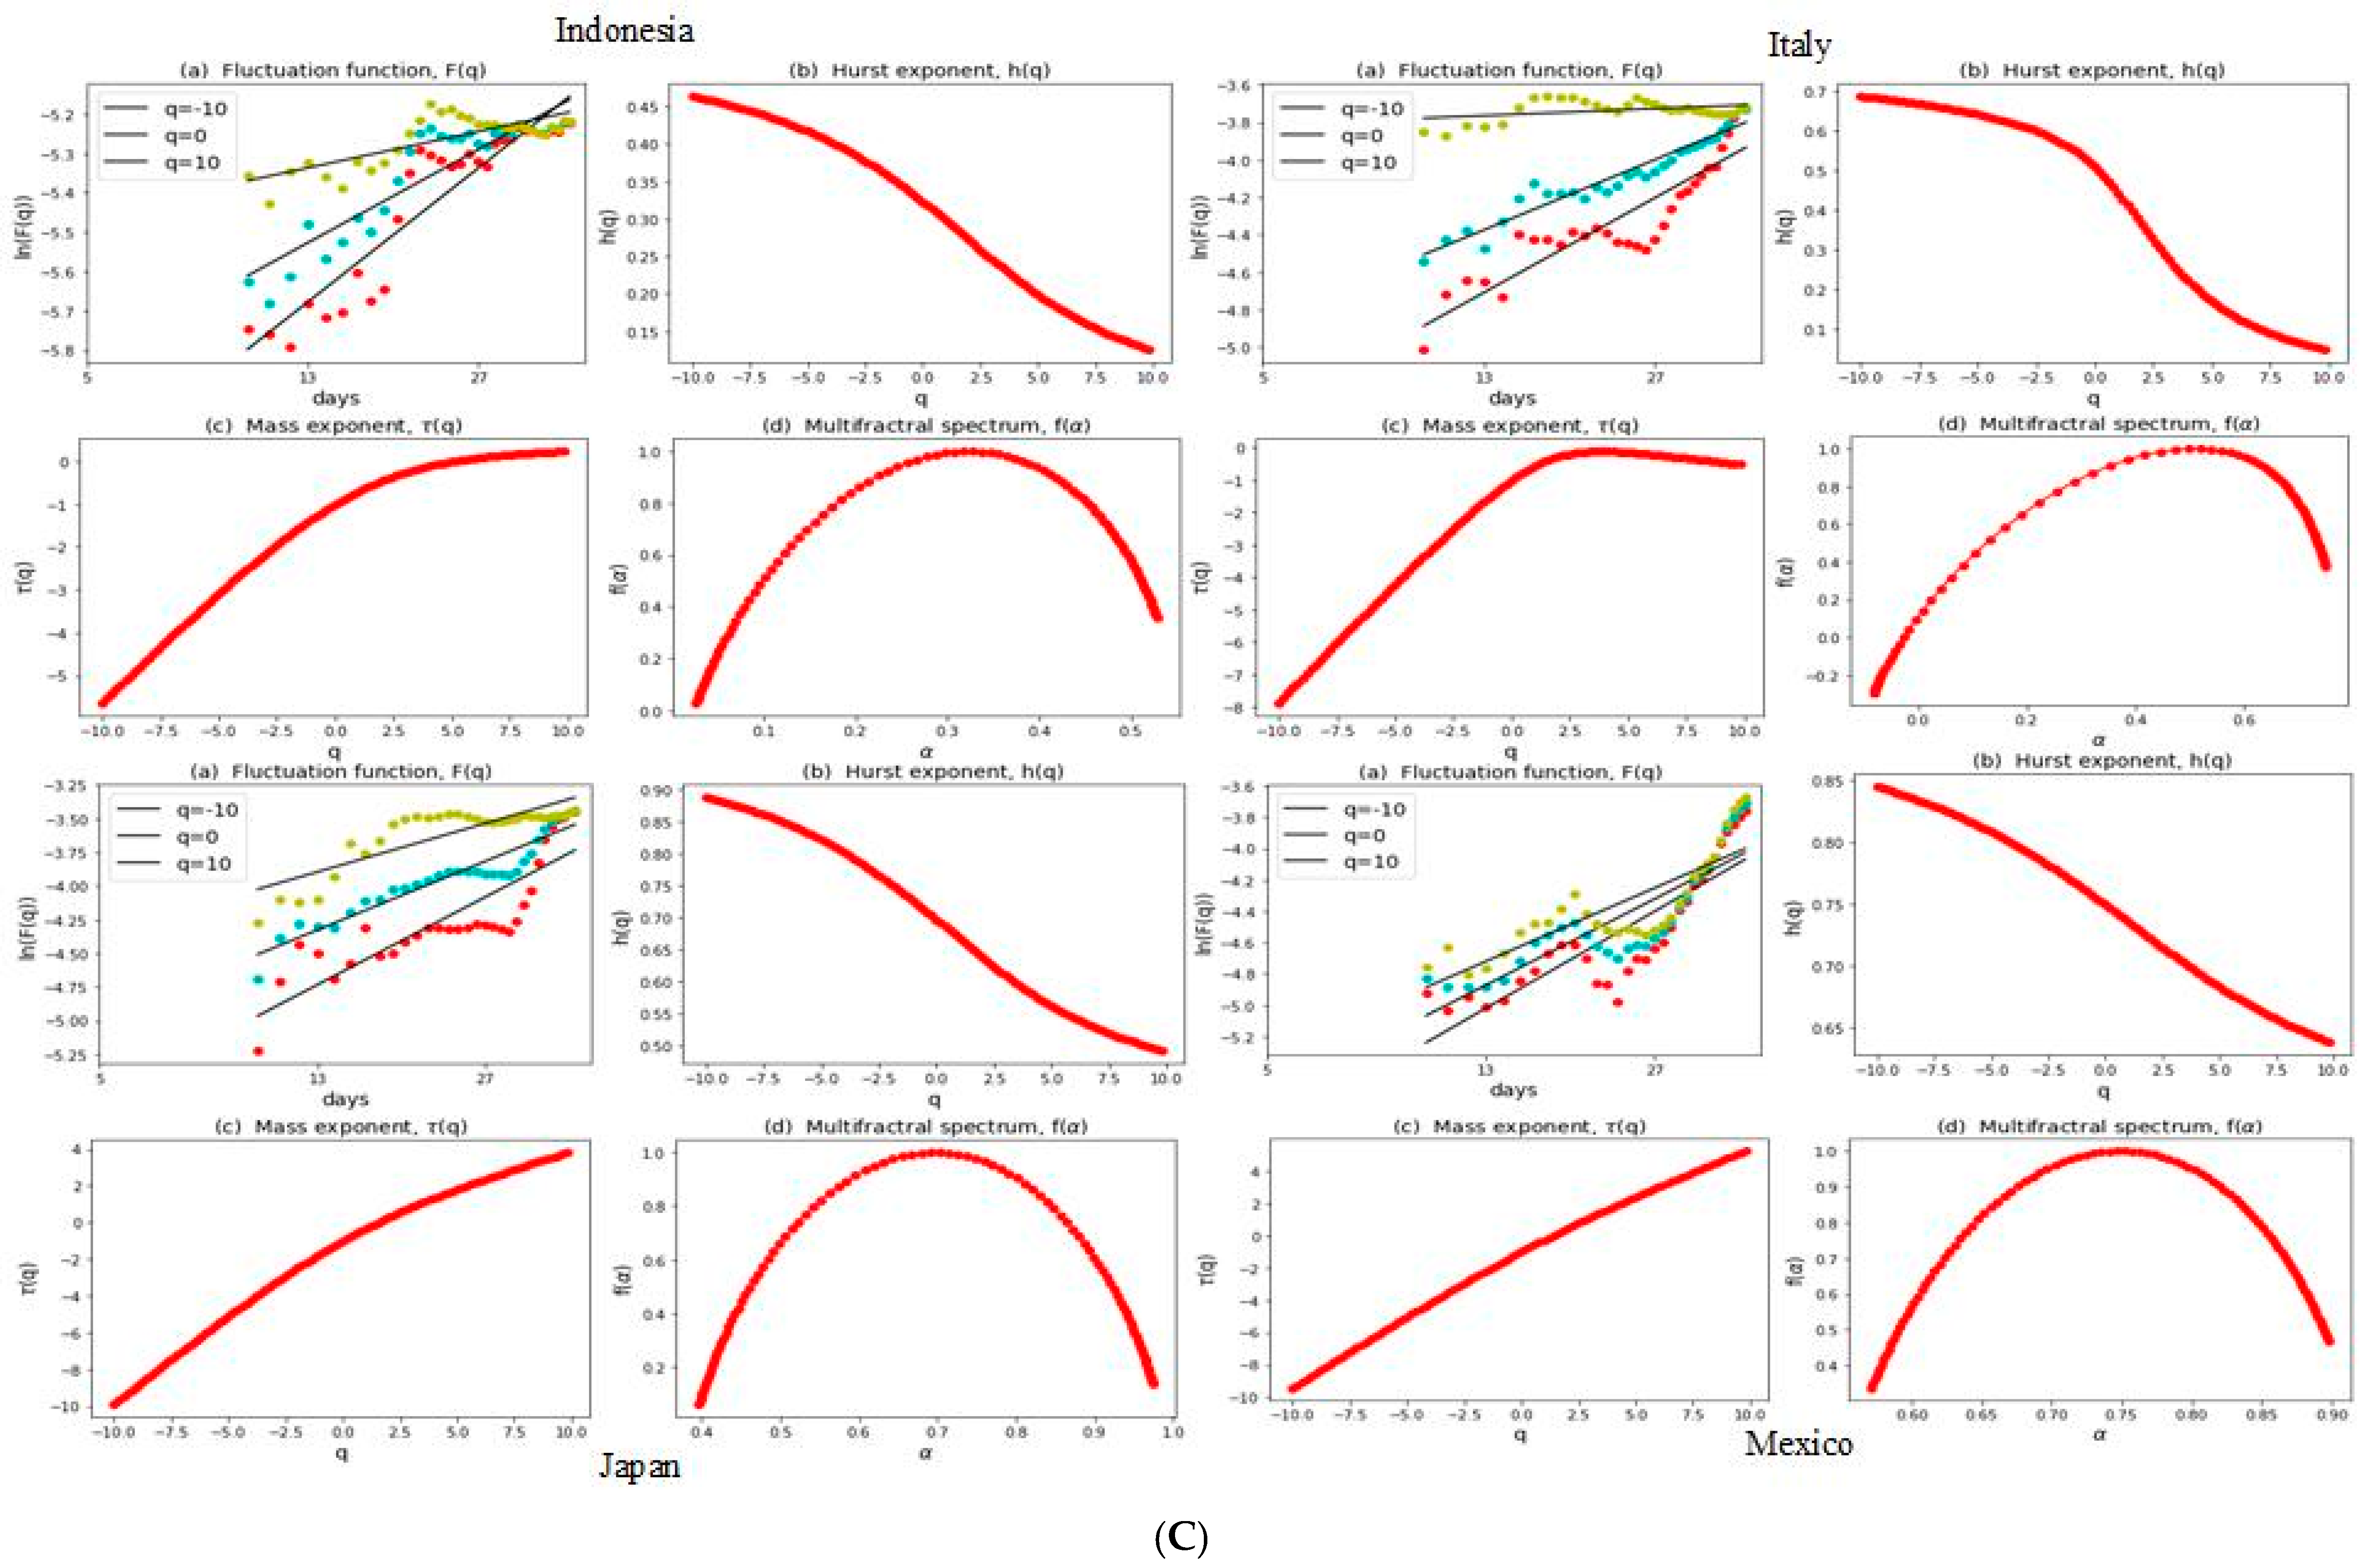
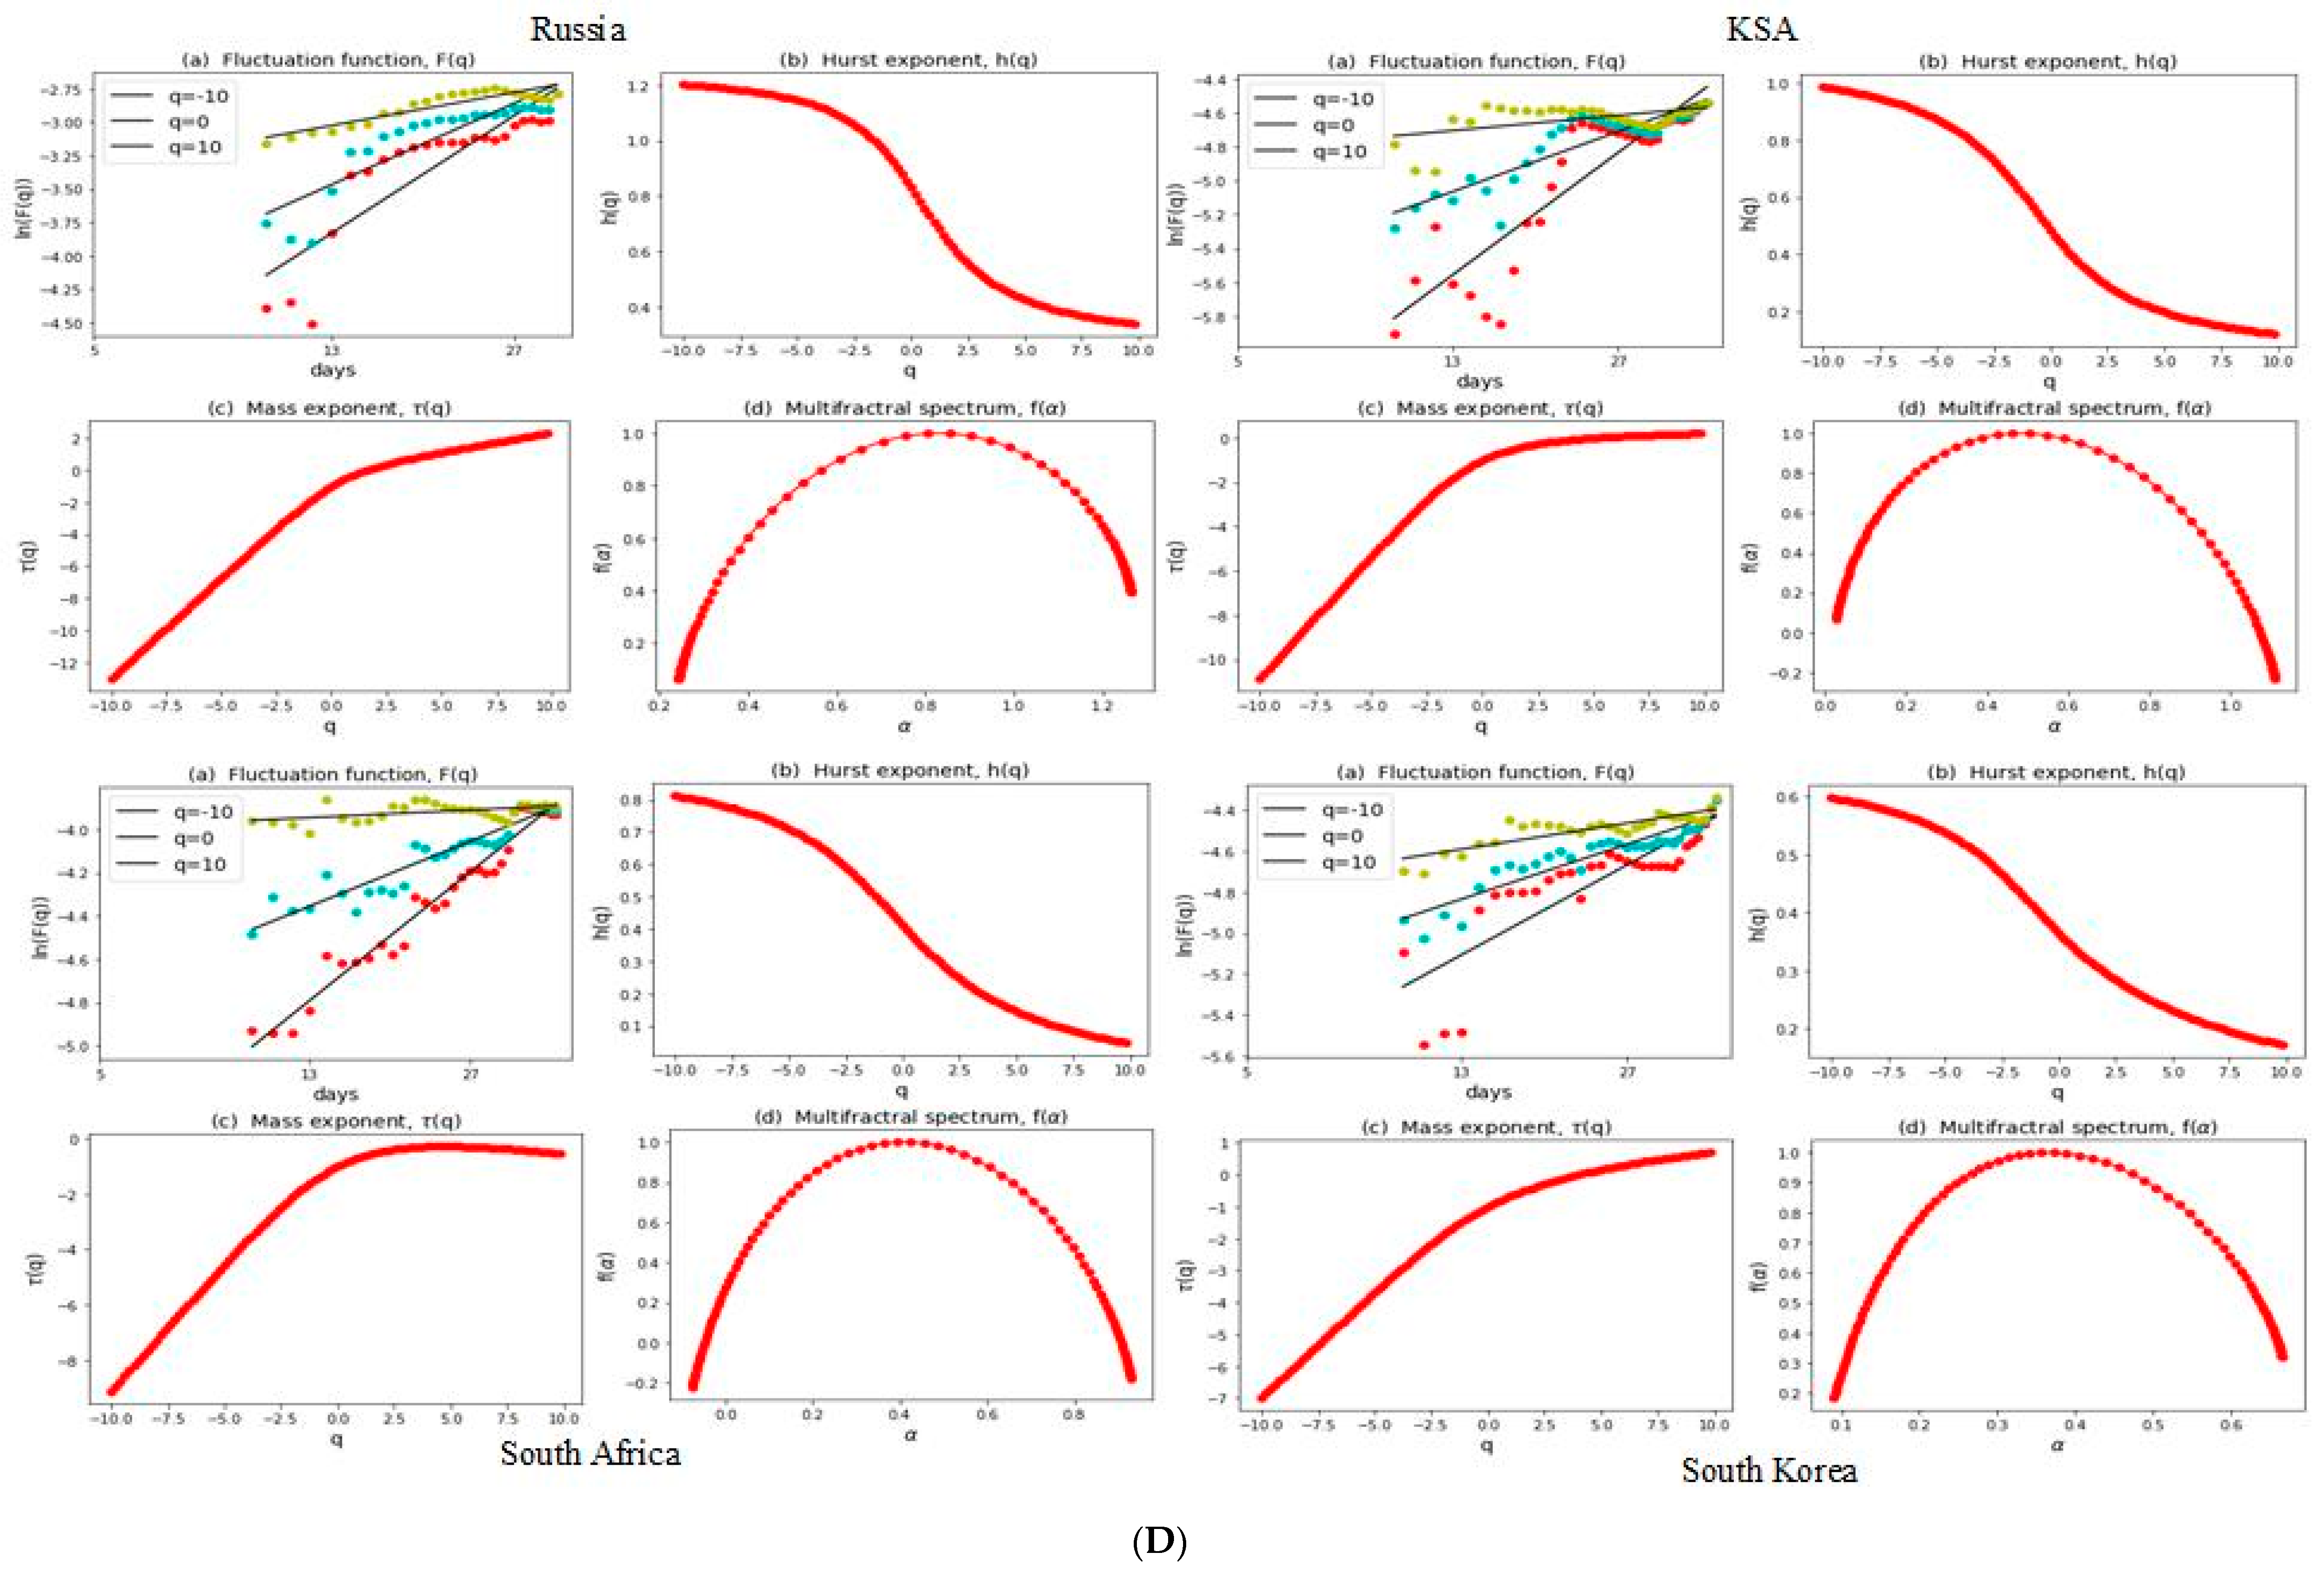
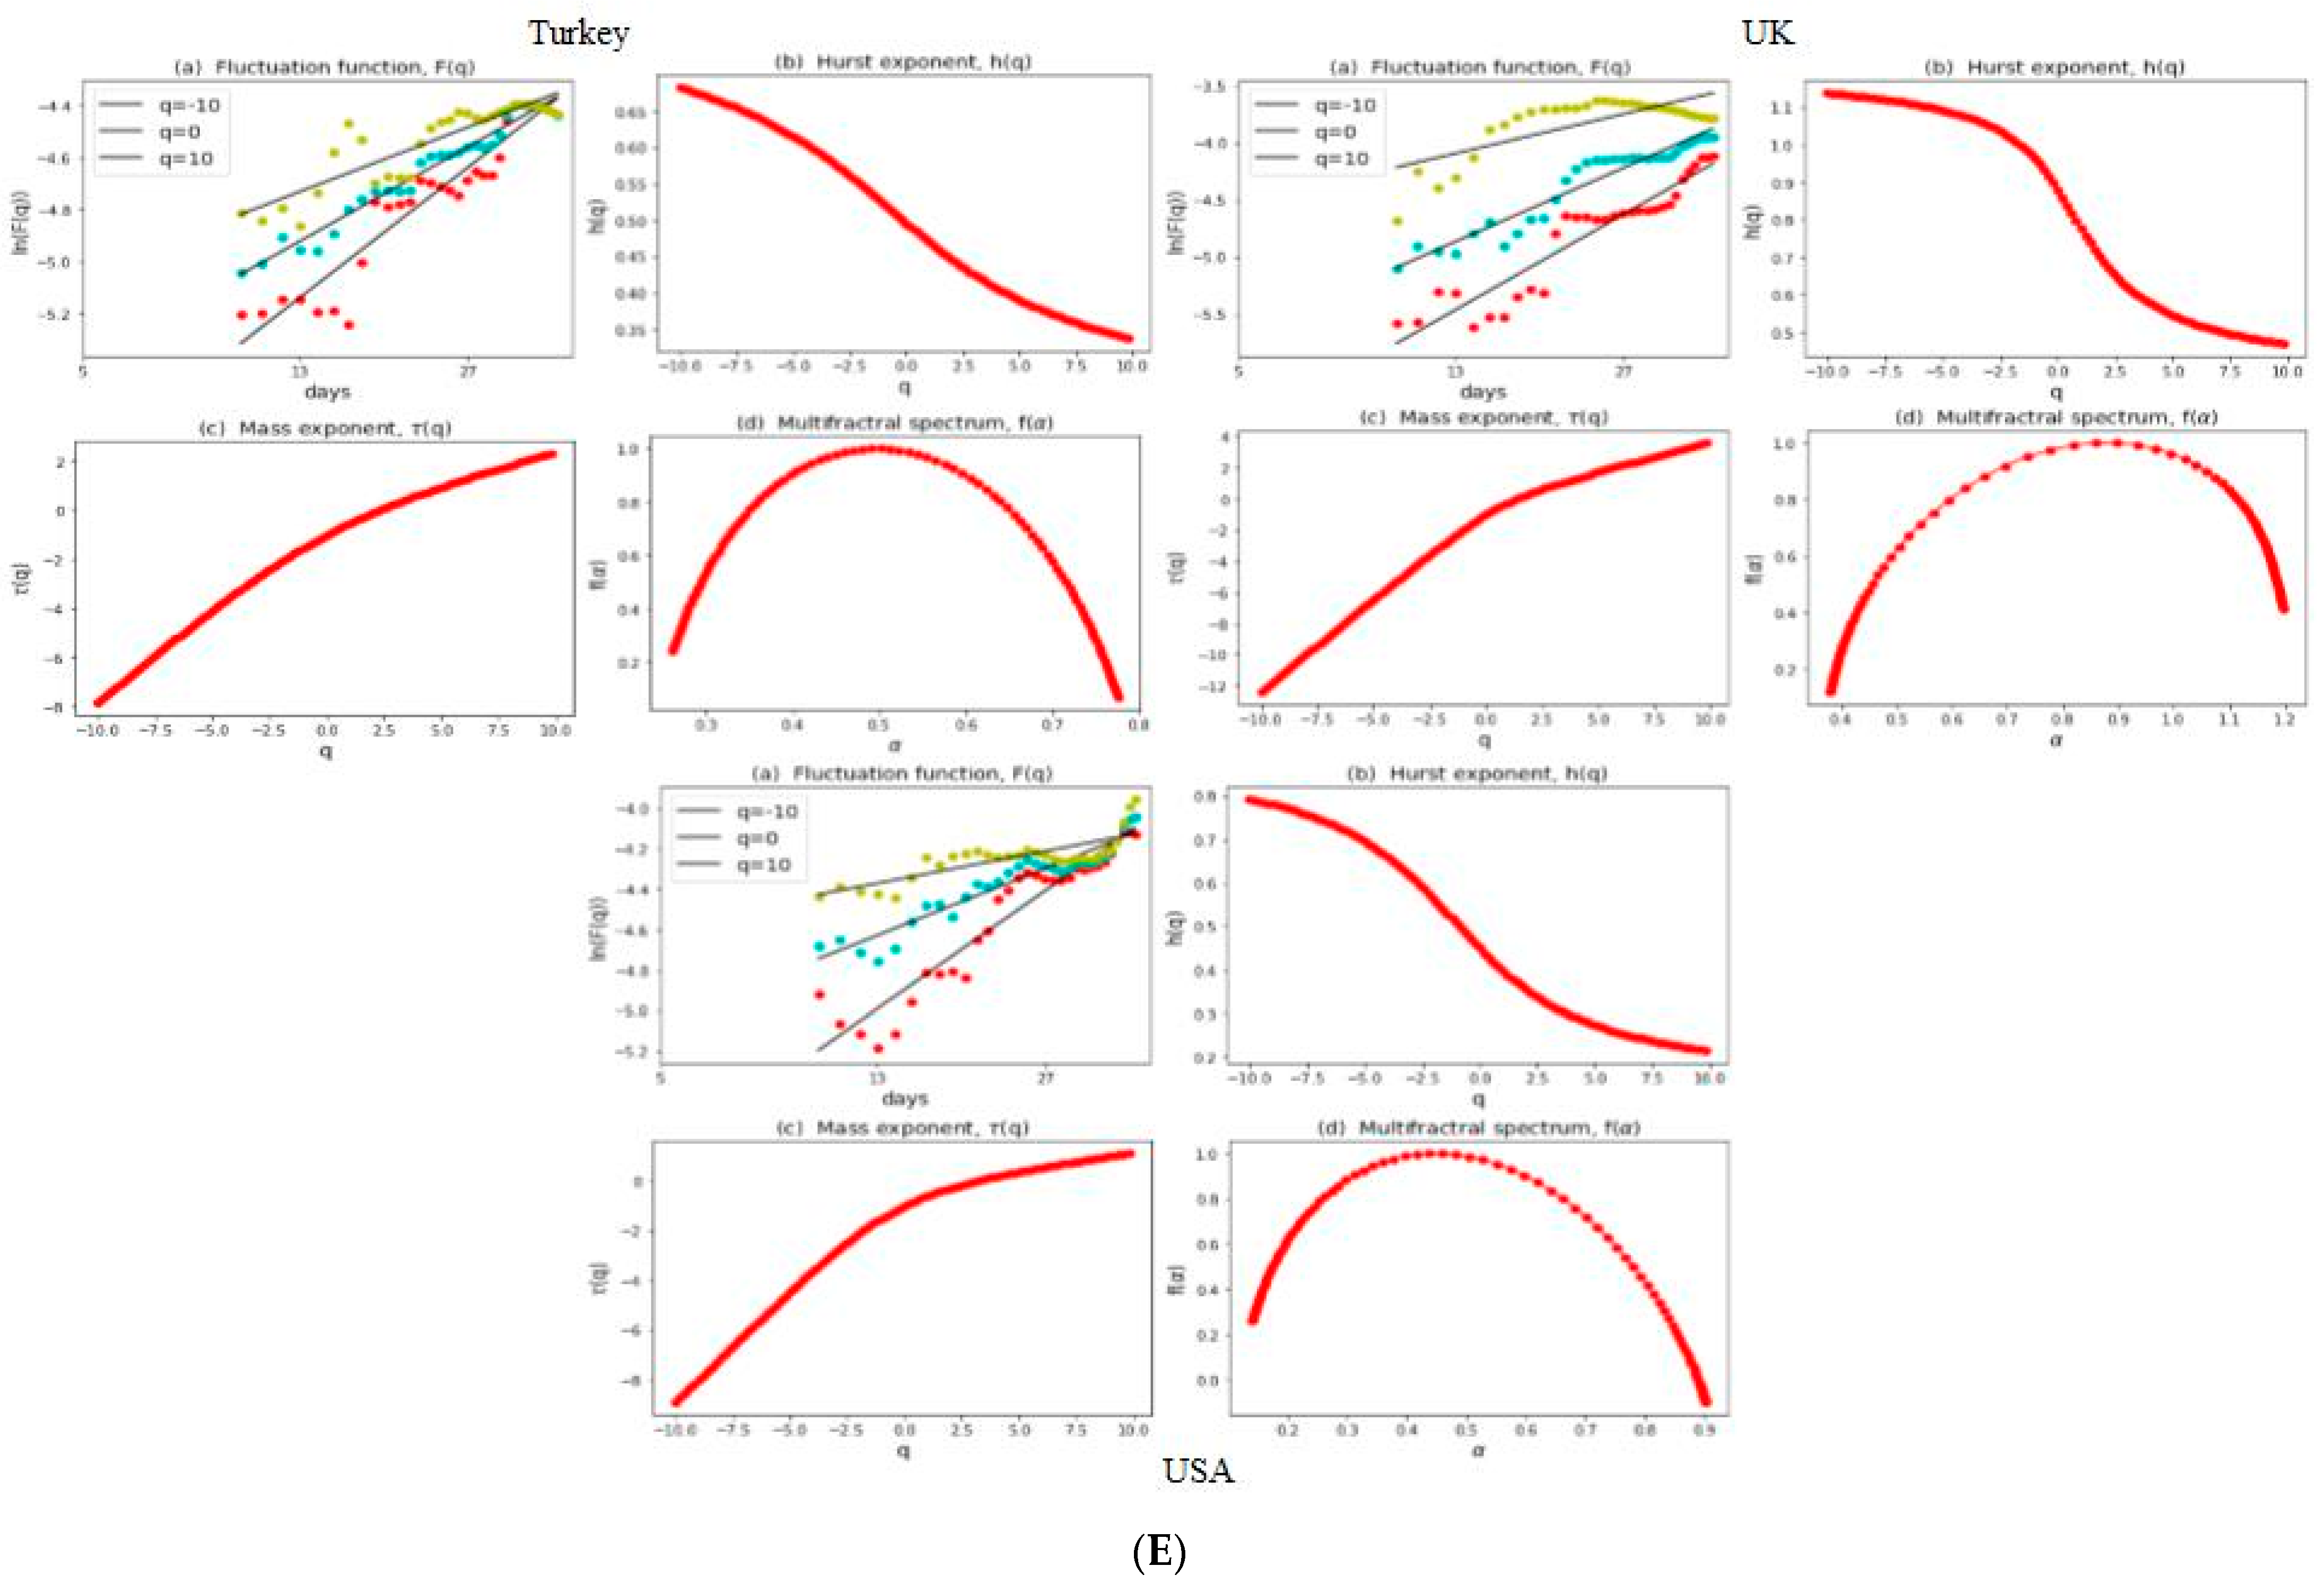
Figure 1A–E represents the MFDFA results for all G20 markets during the overall period of study. The fluctuation function F ( q ) shows a well-fitted straight line in log–log scale at q = 10 , q = 0 , and q = 10 . The slopes of fitted lines correspond to the generalized Hurst exponent, which is calculated by defining q = 2 for the scaling exponent, for the stationary time series. The Hurst exponent in Figure 1A(b) represents the dependence of the generalized Hurst exponent with q . While considering the case of the Argentina stock market, the slopes of fitted lines related to the generalized Hurst exponent certainly rely on q (i.e., h 10 = 0.772 , h 0 = 0.608 , h 10 = 0.330 ). The q -dependency for the scaling exponent indicates the multifractal structures of the Argentina stock market. This declining trend, where the slope of negative q becomes steeper, compared with the positive values of q , matches with the theoretical property of the generalized Hurst exponent (Diniz-Maganini et al. 2021). Figure 1A(c) displays the Renyi exponent, τ q , which clearly shows an exponential shape representing the multifractal series. Figure 1A(d) displays the multifractal spectrum f ( α ) , represented by a single humped shape, verifying the presence of multifractality in the MERVAL stock index. In addition, the supplementary file includes all the figures of the results during the overall and sub-sample crisis periods. Further, we obtained the same results and structures from all the remaining G20 stock markets. Moreover, the range of multifractality degree h obtains the level of multifractality, with higher values corresponding to higher multifractality in the return series (Kantelhardt et al. 2002). In our case, the width of the generalized Hurst exponent h for the Argentina stock market is noted to be 0.442.
Table 4 presents a summary of all the G20 stock markets for the overall period and categorized in accordance with the MSCI classification for the developed and emerging stock markets with the range of q ϵ [ 10 , 10 ] . We immediately observed a declining pattern of the h ( q ) for all the G20 stock markets during the overall period of study. This signifies the availability of multifractality in the overall return series of the G20 stock markets during the entire period of study. In addition, the highest range of the Hurst exponent ( h = 0.528 ) was noted for the Italian stock market, thus representing the highest level of multifractality, whereas the narrowest ranges of the Hurst exponent were observed for Germany ( h = 0.210 ), and India ( h = 0.281 ), showing the lowest degree of multifractality. The degree of long-range correlations is connected with the multifractal properties, as mentioned in a previous work by Anagnostidis et al. (2016). Therefore, the markets of Germany from the developed markets and India from the emerging markets are displaying the lowest range of dependence.
While comparing the developed and emerging stock markets, the average width of the Hurst exponent remained high for the emerging stock markets ( h = 0.5303 ), compared with the developed stock markets’ average width of ( h = 0.5260 ). This result is in line with the evidence from Ali et al. (2018) that shows higher market efficiency for the developed stock markets. However, financial liberalization policy initiatives combined with higher capital flows are observed for the emerging stock markets compared with developed stock markets (Cajueiro et al. 2009; Yang et al. 2019). Moreover, France and Germany remain the most efficient developed stock markets with the lowest degrees of multifractality, carrying Hurst exponents of h = 0.282 and h = 0.210 , respectively. Meanwhile, from the developed stock markets, the UK and USA remain in the middle with scores of h = 0.383 and h = 0.394 , respectively. While comparing all the G20 countries, the results show Germany and India to be the most efficient stock markets among all G20 countries, and Italy remains the least efficient stock market. While examining east Asian stock markets, Rizvi and Arshad (2014) also show the South Korean stock market as dominating with highest efficiency level during both short and long terms. However, the results indicate better efficiency for the China stock market compared with the South Korean stock market. Furthermore, the results should be considered with caution, due to the large sample period of the G20 stock market indices and the variations in the liquidity and volatility of these stock markets that might impact the stock market efficiency (Alam et al. 2016). Our results agree with Figliola et al. (2010) and Wang and Liu (2020), who mention the multifractal structures of stock markets. In addition, the results of our study corroborate with Arshad et al. (2016) and Rizvi and Arshad (2017) regarding the efficiency of stock markets.
The COVID-19 crisis period’s MFDFA results for all G20 markets are presented in Figure 2 and Figure 3A–E. Similarly, all the figures exhibit the remaining figures [i.e., fluctuation function F ( q ) , Hurst exponent h ( q ) , Renyi exponent τ q , and multifractal spectrum f ( α ) ] of all G20 stock markets during the sub-sample crisis periods of the COVID-19 pandemic and the Russia–Ukraine War. The results show a declining pattern of h ( q ) for all the G20 stock markets (Table 5), confirming the multifractality of G20 stock markets during both of the crisis periods as well. In addition, we immediately observed a tremendous increase in the width of generalized Hurst exponent h for almost all the G20 stock markets, except Italy and China. This shows a high level of unevenness in the local fluctuations of G20 stock markets, considering the sheer magnitude and impact of COVID-19 on the world stock markets (Aslam et al. 2020d). As crises often involve a high degree of complexity and uncertainty, the irregular pattern becomes visible and is shown by other similar studies, in particular for the crisis caused by the COVID-19 pandemic (Aslam et al. 2020c; Saâdaoui 2023). Furthermore, the crisis period of the Russia–Ukraine War presents an interesting finding of the highest width of generalized Hurst exponent for the two developed stock markets of Canada and the UK and for the six emerging stock markets of Argentina, China, India, Russia, Saudi Arabia, and South Africa. The decline in the efficiency of G20 stock markets is evident due to uncertainty and discouraging investment by the investors in these stock markets during these crisis events (Salisu and Vo 2020). More specifically, the least efficient G20 stock markets during the global pandemic with the highest multifractality are Russia, with a width of generalized Hurst exponent of h = 0.7394 , followed by South Korea, which demonstrated a higher range of generalized Hurst. Similarly, the width of the generalized Hurst exponent further increased to h = 0.8659 for the Russian stock market during the crisis period of the Russia–Ukraine War, thus nominating the Russian stock market as the least efficient stock market among the stock markets of all the G20 countries. The growth of the Hurst exponent for the Russian stock market suggests a high degree of long-range dependence in the stock price. According to Derindere Köseoğlu et al. (2024), the Moscow exchange index went down following the start of the conflict and reached the bottom level in point-wise causal effect. Moreover, the impact of the Russia–Ukraine conflict was significant and affected the Russian stock market directly, along with various sectors and assets (Izzeldin et al. 2023). The results further reveal the Chinese stock market to be more efficient with h = 0.1923 during the COVID-19 pandemic, while the stock market of Mexico remains the most efficient with h = 0.2066 during the crisis period of the Russia–Ukraine War. Being the first affected country, it is interesting to note that the Chinese stock market was not impacted much during the pandemic. Particularly, the uncertainty lasted for a shorter period, and impacted few sectors (Wu et al. 2021; Lee et al. 2021), but overall the Chinese stock market remained stable and less sensitive to the COVID-19 shock (He et al. 2020; Gao et al. 2021).
In addition, the average width of the generalized Hurst exponent is lower for the developed markets at h = 0.5264 , compared with a higher average width of h = 0.5833 for the emerging markets during the COVID-19 period. Furthermore, the period of the Russia–Ukraine crisis shows a lower width of emerging stock markets of h = 0.5607 , compared with a slightly higher width of h = 0.5635 for the developed stock markets. Previous studies mention that stock markets from developed countries performed better during the outbreak due to timely government responses that significantly reduced the impact of the outbreak, compared with emerging stock markets (Salisu et al. 2020). This aligns with our results on the efficiency of the developed stock markets that were comparatively better than the emerging stock markets.

3.3. Range of Persistance and Herding Behavior in the G20 Markets

Previous studies suggest that the Hurst exponent is an authentic measurement for examining the persistence level and herding behavior in a time series (Fernández-Martínez et al. 2017; Mnif et al. 2020; Memon et al. 2022). For the overall period, the results of the Hurst exponent at q = 2 (Table 4) nominate the six developed stock markets of the USA ( h q = 0.404 ) , Australia ( h q = 0.479 ) , Canada ( h q = 0.455 ) , France ( h q = 0.477 ) , Italy ( h q = 0.464 ) , and the UK ( h q = 0.418 ) to be negatively autocorrelated, representing an anti-persistent behavior with no trace of herding. The result can be explained as any change increase (decrease) in the former time period probably being followed by an inverse decrease (increase) in the time period afterwards. Meanwhile, the remaining two developed stock markets, i.e., Germany ( h q = 0.518 ) and Japan ( h q = 0.562 ) , show persistent evidence of moderate herding behavior. This can be interpreted as an increase (decrease) in the former time periods most likely being followed by an increase (decrease) in the later periods. From emerging stock markets, only the two stock markets of Argentina ( h q = 0.0 . 535 ) and Saudi Arabia ( h q = 0.620 ) show persistent behavior (positive autocorrelation). However, the rest of the nine emerging stock markets (such as Brazil, China, India, Indonesia, Mexico, Russia, South Africa, South Korea, and Turkey) represent negative autocorrelation with an absence of herding behavior and a bubble. While analyzing numerous emerging and developed markets, Di Matteo et al. (2003, 2005) demonstrated H > 0.5 for the emerging and H < 0.5 for the well-developed markets. However, based on our results, the developed stock markets obtained an overall average score of ( h q = 0.472 ) at q = 2 , compared with the emerging stock market average of ( h q = 0.448 ) .
The crisis periods’ results further reveal persistence behavior ( H > 0.5 ) , i.e., positive autocorrelation for two stock markets including Brazil and South Korea during the COVID-19 period, compared to the seven stock markets of Australia, Japan, UK, Brazil, India, Mexico, and Russia during the Russia–Ukraine War. These results confirm the evidence of the persistence and herding behavior of many stock markets during the crisis time of the Russia–Ukraine War. Moreover, the average Hurst exponent at q = 2 during the COVID-19 period for developed stock markets remains at ( h q = 0.3640 ) , compared with an average of ( h q = 0.4390 ) for the emerging stock markets. Meanwhile, the later period shows an average Hurst exponent value of ( h q = 0.4721 ) for the developed stock markets, compared to ( h q = 0.4437 ) for the emerging markets. The classical Hurst exponent q = 2 represents a change in the persistence behavior of G20 stock markets. To sum up, the crisis periods resulted in richer structures for the G20 stock markets that altered their efficiency and exhibited long-range correlations, along with the detection of herding during the later period of the Russia–Ukraine War.

4. Conclusions

This study evaluated the stock market efficiency and herding behavior of the G20 stock market indices through the multifractal detrended fluctuation analysis (MFDFA) method. By using the latest data (up to May 2022), we presented a thorough outlook of all the developed and emerging stock markets as classified by the MSCI for the top economies of the world. Overall, the full sample investigation shows strong evidence of multifractality in all the G20 stock markets. In addition, the results reveal a high level of multifractality and resultant low efficiency for the Italian stock market, while Germany and India demonstrate the lowest degree of multifractality. The results further show anti-persistence with no trace of herding behavior for six developed stock markets including the USA, Australia, Canada, France, Italy, and UK during the overall period of study, which means any change increase (decrease) in the return series of former time period would probably be followed by an inverse decrease (increase) in the time period afterwards. The remaining two developed stock markets of Japan and Germany show persistence with a trace of minor herding behavior, thus representing positive autocorrelation. Moreover, only the two stock markets of Argentina and Saudi Arabia confirm persistent behavior, while the rest of the nine emerging stock markets, namely Brazil, China, India, Indonesia, Mexico, Russia, South Africa, South Korea, and Turkey, represent negative autocorrelation (anti-persistent fluctuations).
Further, we asked how the global pandemic (COVID-19) and the Russia–Ukraine crises influence the complexity of the G20 stock markets. Therefore, the data are portioned into two sub-sample periods based on individual reporting of the first confirmed COVID-19 cases and the Russia–Ukraine War by every country. With regard to sub-sample results, we similarly detected the multifractality of all the G20 stock markets, contrary to the random process as proposed in the efficient market hypothesis. An immediate observation was a tremendous increase in the width of the generalized Hurst exponent h for almost all the G20 stock markets, except Italy and China. The result confirms a high level of unevenness in the local fluctuations of G20 stock markets considering the sheer magnitude and impact of the crises on the world stock markets. In addition, Russia and South Korea remain the least efficient, whereas the Mexican and Chinese stock markets appear to be more efficient markets among all G20 countries during the two crisis periods. Moreover, the results show anti-persistence and an absence of herding behavior for the majority of G20 stock markets during COVID-19, compared to the later period of the Russia–Ukraine War, which confirms the evidence of the persistence and herding behavior of many stock markets.
This study presents several implications. First, the results of this study offer opportunities for a wide range of audiences, including individual and institutional investors, portfolio managers, and practitioners, to understand the efficiency of the top 20 economies of the world, which is crucial for decision making. The G20 countries collectively account for a significant portion of global economic activity and trade. Examining the efficiency of their stock markets allows us to explore the interconnectedness and potential spillover effects between these markets. In addition, the comprehension of how shocks and market developments in one country propagate to others within the G20 can provide valuable insights into systemic risks, contagion effects, and global market dynamics. This knowledge can be critical for investors and policymakers seeking to manage risks effectively. Second, the results during the crisis periods of the Russia–Ukraine War and COVID-19 outbreak offer an opportunity to examine the presence of herding behavior to detect market bubbles and take positions accordingly. Third, the results of the crisis periods show a tremendous increase in generalized Hurst exponents, representing unevenness in the local fluctuations of G20 stock markets. This directs government agencies and policymakers to better devise sustainable policies and risk management to achieve stock market stability and growth. Forth, the results of less efficient markets offer an opportunity to those investors thriving to receive abnormal returns. Moreover, the comparative analysis of emerging and developed markets during the overall and crisis periods provides an opportunity to the authorities and regulators to consider varied stock market reactions to extreme events and design macro- and micro-prudential strategies accordingly. In addition, comparing the developed and emerging stock markets using the Hurst exponent is necessary to gain insights into market efficiency and predictability. This will allow public and private investors to understand the distinct characteristics and dynamics of different markets, facilitating more effective strategies and risk management approaches. Further research could be carried by examining the multifractality and efficiency of other countries on a time-varying scale to validate the findings achieved in this study. In addition, interesting future research could be conducted by applying the asymmetric MF-DFA method (Shahzad et al. 2020) on the G20 stock markets, especially in the pre- and post-Russia–Ukraine War period, to discuss any asymmetries with the results achieved in this study.

Author Contributions

Conceptualization, B.A.M.; methodology, B.A.M. and F.A.; software, B.A.M.; validation, B.A.M. and H.M.N.; formal analysis, B.A.M.; investigation, B.A.M. and F.A.; resources, B.A.M. and F.A.; data curation, B.A.M.; writing—original draft preparation, B.A.M.; writing—review and editing, B.A.M., P.F., F.A., H.M.N. and O.G.; supervision, P.F.; project administration, B.A.M. and F.A.; funding acquisition, P.F. All authors have read and agreed to the published version of the manuscript.

Funding

Paulo Ferreira acknowledges the financial support of Fundação para a Ciência e a Tecnologia [(grant UIDB/05064/2020)].

Informed Consent Statement

Not applicable.

Data Availability Statement

Data are available www.investing.com (accessed on 28 April 2024).

Conflicts of Interest

The authors declare no conflicts of interest.

References

  1. Alam, Nafis, Shaista Arshad, and Syed Aun R. Rizvi. 2016. Do Islamic stock indices perform better than conventional counterparts? An empirical investigation of sectoral efficiency. Review of Financial Economics 31: 108–14. [Google Scholar] [CrossRef]
  2. Ali, Sajid, Syed Jawad Hussain Shahzad, Naveed Raza, and Khamis Hamed Al-Yahyaee. 2018. Stock market efficiency: A comparative analysis of Islamic and conventional stock markets. Physica A: Statistical Mechanics and its Applications 503: 139–53. [Google Scholar] [CrossRef]
  3. Anagnostidis, P., C. Varsakelis, and C. J. Emmanouilides. 2016. Has the 2008 financial crisis affected stock market efficiency? The case of Eurozone. Physica A: Statistical Mechanics and its Applications 447: 116–28. [Google Scholar] [CrossRef]
  4. Arshad, Shaista, Syed Aun R. Rizvi, Gairuzazmi Mat Ghani, and Jarita Duasa. 2016. Investigating stock market efficiency: A look at OIC member countries. Research in International Business and Finance 36: 402–13. [Google Scholar] [CrossRef]
  5. Aslam, Faheem, Paulo Ferreira, Haider Ali, and Sumera Kauser. 2021. Herding behavior during the COVID-19 pandemic: A comparison between Asian and European stock markets based on intraday multifractality. Eurasian Economic Review (EAER). ahead of print. [Google Scholar] [CrossRef]
  6. Aslam, Faheem, Saima Latif, and Paulo Ferreira. 2020a. Investigating Long-Range Dependence of Emerging Asian Stock Markets Using Multifractal Detrended Fluctuation Analysis. Symmetry 12: 1157. [Google Scholar] [CrossRef]
  7. Aslam, Faheem, Saqib Aziz, Duc Khuong Nguyen, Khurrum S. Mughal, and Maaz Khan. 2020b. On the efficiency of foreign exchange markets in times of the COVID-19 pandemic. Technological Forecasting and Social Change 161: 120261. [Google Scholar] [CrossRef] [PubMed]
  8. Aslam, Faheem, Wahbeeah Mohti, and Paulo Ferreira. 2020c. Evidence of Intraday Multifractality in European Stock Markets during the Recent Coronavirus (COVID-19) Outbreak. International Journal of Financial Studies 8: 31. [Google Scholar] [CrossRef]
  9. Aslam, Faheem, Yasir Tariq Mohmand, Paulo Ferreira, Bilal Ahmed Memon, Maaz Khan, and Mrestyal Khan. 2020d. Network Analysis of Global Stock Markets at the beginning of the Coronavirus Disease (COVID-19) Outbreak. Borsa Istanbul Review 20: S49–S61. [Google Scholar] [CrossRef]
  10. Balasubramanian, Niranjana. 2020. An MFDFA Study to find Herd Behaviour and Information Asymmetry during Demonetization. Ushus Journal of Business Management 19: 41–59. [Google Scholar] [CrossRef]
  11. Balcilar, Mehmet, Matteo Bonato, Riza Demirer, and Rangan Gupta. 2018. Geopolitical risks and stock market dynamics of the BRICS. Economic Systems 42: 295–306. [Google Scholar] [CrossRef]
  12. Bao, Juan, Wei Chen, and Zheng-Tao Xiang. 2016. Traffic Time Series Simulation Analysis by Using MSE and MFDFA. Paper presented at the 2016 International Conference on Industrial Informatics—Computing Technology, Intelligent Technology, Industrial Information Integration (ICIICII), Wuhan, China, 3–4 December. [Google Scholar]
  13. Bloom, Nicholas. 2009. The impact of uncertainty shocks. Econometrica 77: 623–85. [Google Scholar]
  14. Butler, Kirt C., and S. Jamal Malaikah. 1992. Efficiency and inefficiency in thinly traded stock markets: Kuwait and Saudi Arabia. Journal of Banking & Finance 16: 197–210. [Google Scholar] [CrossRef]
  15. Cajueiro, Daniel O., Periklis Gogas, and Benjamin M. Tabak. 2009. Does financial market liberalization increase the degree of market efficiency? The case of the Athens stock exchange. International Review of Financial Analysis 18: 50–57. [Google Scholar] [CrossRef]
  16. Caraiani, Petre. 2012. Evidence of Multifractality from Emerging European Stock Markets. PLoS ONE 7: e40693. [Google Scholar] [CrossRef] [PubMed]
  17. Chang, Xin, Yangyang Chen, and Leon Zolotoy. 2017. Stock Liquidity and Stock Price Crash Risk. Journal of Financial and Quantitative Analysis 52: 1605–37. [Google Scholar] [CrossRef]
  18. Chari, Murali D. R., Parthiban David, Augustine Duru, and Yijiang Zhao. 2019. Bowman’s risk-return paradox: An agency theory perspective. Journal of Business Research 95: 357–75. [Google Scholar] [CrossRef]
  19. Chattopadhyay, Anirban, Mofazzal H. Khondekar, and Anup Kumar Bhattacharjee. 2018. Fractality and singularity in CME linear speed signal: Cycle 23. Chaos Solitons & Fractals 114: 542–50. [Google Scholar] [CrossRef]
  20. Choi, Sun-Yong. 2021. Analysis of stock market efficiency during crisis periods in the US stock market: Differences between the global financial crisis and COVID-19 pandemic. Physica A: Statistical Mechanics and its Applications 574: 125988. [Google Scholar] [CrossRef]
  21. Derindere Köseoğlu, Sinem, Burcu Adıgüzel Mercangöz, Khalid Khan, and Suleman Sarwar. 2024. The impact of the Russian-Ukraine war on the stock market: A causal analysis. Applied Economics 56: 2509–19. [Google Scholar] [CrossRef]
  22. Di Matteo, Tiziana, Tomaso Aste, and Michel M. Dacorogna. 2005. Long-term memories of developed and emerging markets: Using the scaling analysis to characterize their stage of development. Journal of Banking & Finance 29: 827–51. [Google Scholar] [CrossRef]
  23. Di Matteo, Tiziana, Tomaso Aste, and Michel M. Dacorogna. 2003. Scaling behaviors in differently developed markets. Physica A: Statistical Mechanics and its Applications 324: 183–88. [Google Scholar] [CrossRef]
  24. Diniz-Maganini, Natalia, Abdul A. Rasheed, and Hsia Hua Sheng. 2021. Exchange rate regimes and price efficiency: Empirical examination of the impact of financial crisis. Journal of International Financial Markets, Institutions and Money 73: 101361. [Google Scholar] [CrossRef]
  25. Fama, Eugene F. 1970. Efficient Capital Markets: A Review of Theory and Empirical Work. The Journal of Finance 25: 383–417. [Google Scholar] [CrossRef]
  26. Fama, Eugene F. 1965. The Behavior of Stock-Market Prices. The Journal of Business 38: 34–105. [Google Scholar] [CrossRef]
  27. Fernando, Ruwangi, Hua Wang, Yanchun Zhang, Mahesh Prakash, and Ashim Debnath. 2020. The effects of travel containment measures within COVID-19. Paper presented at the 2020 24th International Conference Information Visualisation (IV), Melbourne, Australia, 7–11 September. [Google Scholar]
  28. Fernández-Martínez, M., M. A. Sánchez-Granero, M. J. Muñoz Torrecillas, and Bill McKelvey. 2017. A comparison of three hurst exponent approaches to predict nascent bubbles in S&P500 stocks. Fractals 25: 1750006. [Google Scholar] [CrossRef]
  29. Figliola, Alejandra, Luciano Zunino, Eduardo Serrano, and Osvaldo Rosso. 2010. Multifractal characterization of the stock market inefficiency using the Wavelet Leaders method. Adv. Appl. Stat. Sci 2: 287–302. [Google Scholar]
  30. Gao, Xue, Yixin Ren, and Muhammad Umar. 2021. To what extent does COVID-19 drive stock market volatility? A comparison between the U.S. and China. Economic Research-Ekonomska Istraživanja, 1–21. [Google Scholar] [CrossRef]
  31. He, Qing, Junyi Liu, Sizhu Wang, and Jishuang Yu. 2020. The impact of COVID-19 on stock markets. Economic and Political Studies 8: 275–88. [Google Scholar] [CrossRef]
  32. Hudson, Robert, and Andrew Urquhart. 2022. Naval disasters, world war two and the British stock market. Research in International Business and Finance 59: 101556. [Google Scholar] [CrossRef]
  33. Ikeda, Taro. 2018. Multifractal structures for the Russian stock market. Physica A: Statistical Mechanics and Its Applications 492: 2123–28. [Google Scholar] [CrossRef]
  34. Izzeldin, Marwan, Yaz Gülnur Muradoğlu, Vasileios Pappas, Athina Petropoulou, and Sheeja Sivaprasad. 2023. The impact of the Russian-Ukrainian war on global financial markets. International Review of Financial Analysis 87: 102598. [Google Scholar] [CrossRef]
  35. Kantelhardt, Jan W., Stephan A. Zschiegner, Eva Koscielny-Bunde, Shlomo Havlin, Armin Bunde, and H. Eugene Stanley. 2002. Multifractal detrended fluctuation analysis of nonstationary time series. Physica A: Statistical Mechanics and its Applications 316: 87–114. [Google Scholar] [CrossRef]
  36. Kristoufek, Ladislav, and Miloslav Vosvrda. 2013. Measuring capital market efficiency: Global and local correlations structure. Physica A: Statistical Mechanics and its Applications 392: 184–93. [Google Scholar] [CrossRef]
  37. Lee, Chi-Chuan, Chien-Chiang Lee, and Yizhong Wu. 2021. The impact of COVID-19 pandemic on hospitality stock returns in China. International Journal of Finance & Economics 28: 1787–800. [Google Scholar] [CrossRef]
  38. Mali, Provash, and Amitabha Mukhopadhyay. 2014. Multifractal characterization of gold market: A multifractal detrended fluctuation analysis. Physica A: Statistical Mechanics and Its Applications 413: 361–72. [Google Scholar] [CrossRef]
  39. Memon, Bilal Ahmed, Faheem Aslam, Shakhnoza Asadova, and Paulo Ferreira. 2023. Are clean energy markets efficient? A multifractal scaling and herding behavior analysis of clean and renewable energy markets before and during the COVID19 pandemic. Heliyon 9: e22694. [Google Scholar] [CrossRef] [PubMed]
  40. Memon, Bilal Ahmed, Hongxing Yao, and Hafiz Muhammad Naveed. 2022. Examining the efficiency and herding behavior of commodity markets using multifractal detrended fluctuation analysis. Empirical evidence from energy, agriculture, and metal markets. Resources Policy 77: 102715. [Google Scholar] [CrossRef]
  41. Mensi, Walid, Ahmet Sensoy, Xuan Vinh Vo, and Sang Hoon Kang. 2020. Impact of COVID-19 outbreak on asymmetric multifractality of gold and oil prices. Resources Policy 69: 101829. [Google Scholar] [CrossRef]
  42. Miloş, Laura Raisa, Cornel Haţiegan, Marius Cristian Miloş, Flavia Mirela Barna, and Claudiu Boțoc. 2020. Multifractal Detrended Fluctuation Analysis (MF-DFA) of Stock Market Indexes. Empirical Evidence from Seven Central and Eastern European Markets. Sustainability 12: 535. [Google Scholar] [CrossRef]
  43. Mishra, Pramod Kumar. 2020. COVID-19, Black Swan events and the future of disaster risk management in India. Progress in Disaster Science 8: 100137. [Google Scholar] [CrossRef]
  44. Mnif, Emna, and Anis Jarboui. 2021. COVID-19, bitcoin market efficiency, herd behaviour. Review of Behavioral Finance 13: 69–84. [Google Scholar] [CrossRef]
  45. Mnif, Emna, Anis Jarboui, and Khaireddine Mouakhar. 2020. How the cryptocurrency market has performed during COVID 19? A multifractal analysis. Finance Research Letters 36: 101647. [Google Scholar] [CrossRef] [PubMed]
  46. Podobnik, Boris, and H. Eugene Stanley. 2008. Detrended Cross-Correlation Analysis: A New Method for Analyzing Two Nonstationary Time Series. Physical Review Letters 100: 084102. [Google Scholar] [CrossRef] [PubMed]
  47. Rizvi, Syed Aun R., and Shaista Arshad. 2017. Analysis of the efficiency–integration nexus of Japanese stock market. Physica A: Statistical Mechanics and its Applications 470: 296–308. [Google Scholar] [CrossRef]
  48. Rizvi, Syed Aun R., and Shaista Arshad. 2016. How does crisis affect efficiency? An empirical study of East Asian markets. Borsa Istanbul Review 16: 1–8. [Google Scholar] [CrossRef]
  49. Rizvi, Syed Aun R., and Shaista Arshad. 2014. Investigating the efficiency of East Asian stock markets through booms and busts. Pacific Science Review 16: 275–79. [Google Scholar] [CrossRef]
  50. Rizvi, Syed Aun R., Ginanjar Dewandaru, Obiyathulla I. Bacha, and Mansur Masih. 2014. An analysis of stock market efficiency: Developed vs. Islamic stock markets using MF-DFA. Physica A: Statistical Mechanics and its Applications 407: 86–99. [Google Scholar] [CrossRef]
  51. Saâdaoui, Foued. 2023. Skewed multifractal scaling of stock markets during the COVID-19 pandemic. Chaos, Solitons & Fractals 170: 113372. [Google Scholar]
  52. Salisu, Afees A., Abdulsalam Abidemi Sikiru, and Xuan Vinh Vo. 2020. Pandemics and the emerging stock markets. Borsa Istanbul Review 20: S40–S48. [Google Scholar] [CrossRef]
  53. Salisu, Afees A., and Xuan Vinh Vo. 2020. Predicting stock returns in the presence of COVID-19 pandemic: The role of health news. International Review of Financial Analysis 71: 101546. [Google Scholar] [CrossRef] [PubMed]
  54. San José Martínez, Fernando, Carlos García-Gutiérrez Báez, Francisco Javier Caniego Monreal, and Fernando Peregrina. 2021. Long-range correlations of soil water content time series under tillage and different cover crops in a semi-arid vineyard. European Journal of Soil Science 72: 623–34. [Google Scholar] [CrossRef]
  55. Schneider, Gerald, and Vera E. Troeger. 2006. War and the world economy: Stock market reactions to international conflicts. Journal of Conflict Resolution 50: 623–45. [Google Scholar] [CrossRef]
  56. Sezgin Alp, Ozge, Bilge Canbaloglu, and Gozde Gurgun. 2022. Stock liquidity, stock price crash risk, and foreign ownership. Borsa Istanbul Review 22: 477–86. [Google Scholar] [CrossRef]
  57. Shadkhoo, Shahriar, and Gholamzera Jafari. 2009. Multifractal detrended cross-correlation analysis of temporal and spatial seismic data. The European Physical Journal B 72: 679. [Google Scholar] [CrossRef]
  58. Shahzad, Syed Jawad Hussain, Elie Bouri, Ghulam Mujtaba Kayani, Rana Muhammad Nasir, and Ladislav Kristoufek. 2020. Are clean energy stocks efficient? Asymmetric multifractal scaling behaviour. Physica A: Statistical Mechanics and Its Applications 550: 124519. [Google Scholar] [CrossRef]
  59. Sornette, Didier. 2003. Why Stock Markets Crash Critical Events in Complex Financial Systems. Princeton: Princeton University Press. [Google Scholar]
  60. Sun, Limei, Meiqi Xiang, and Qing Shen. 2020. A comparative study on the volatility of EU and China’s carbon emission permits trading markets. Physica A: Statistical Mechanics and Its Applications 560: 125037. [Google Scholar] [CrossRef]
  61. Tiwari, Aviral Kumar, Goodness C. Aye, and Rangan Gupta. 2019. Stock market efficiency analysis using long spans of Data: A multifractal detrended fluctuation approach. Finance Research Letters 28: 398–411. [Google Scholar] [CrossRef]
  62. Wang, Lei, and Lutao Liu. 2020. Long-range correlation and predictability of Chinese stock prices. Physica A: Statistical Mechanics and Its Applications 549: 124384. [Google Scholar] [CrossRef]
  63. Wang, Wanting, Kecheng Liu, and Zheng Qin. 2014. Multifractal Analysis on the Return Series of Stock Markets Using MF-DFA Method. Paper presented at the 15th IFIP WG 8.1 International Conference on Informatics and Semiotics in Organisations, ICISO 2014, Shanghai, China, 23–24 May; Berlin and Heidelberg: Springer. [Google Scholar]
  64. Wang, Xiaoquan, Xinyue Wang, Zheng Zhong, and Junnan Yao. 2021. The impact of US–China trade war on Chinese firms: Evidence from stock market reactions. Applied Economics Letters 28: 579–83. [Google Scholar] [CrossRef]
  65. Wang, Yudong, Li Liu, and Rongbao Gu. 2009. Analysis of efficiency for Shenzhen stock market based on multifractal detrended fluctuation analysis. International Review of Financial Analysis 18: 271–76. [Google Scholar] [CrossRef]
  66. Wu, Wenmin, Chien-Chiang Lee, Wenwu Xing, and Shan-Ju Ho. 2021. The impact of the COVID-19 outbreak on Chinese-listed tourism stocks. Financial Innovation 7: 22. [Google Scholar] [CrossRef] [PubMed]
  67. Xu, Nan, Songsong Li, and Xiaofeng Hui. 2021. Multifractal Analysis of COVID-19’s Impact on China’s Stock Market. Fractals 29: 2150213. [Google Scholar] [CrossRef]
  68. Yang, Haizhen, Fangfang Shi, Jie Wang, and Zhongbo Jing. 2019. Investigating the relationship between financial liberalization and capital flow waves: A panel data analysis. International Review of Economics & Finance 59: 120–36. [Google Scholar] [CrossRef]
  69. Zaremba, Adam, Nusret Cakici, Ender Demir, and Huaigang Long. 2022. When bad news is good news: Geopolitical risk and the cross-section of emerging market stock returns. Journal of Financial Stability 58: 100964. [Google Scholar] [CrossRef]
  70. Zhang, Chen, Xiaofeng Wang, Shengbing Chen, Le Zou, Xin Zhang, and Chao Tang. 2019a. A study on daily PM2.5 concentrations in Hong Kong using the EMD-based MFDFA method. Physica A: Statistical Mechanics and Its Applications 530: 121182. [Google Scholar] [CrossRef]
  71. Zhang, Qiang, Chong-Yu Xu, Yongqin David Chen, and Zuguo Yu. 2008. Multifractal detrended fluctuation analysis of streamflow series of the Yangtze River basin, China. Hydrological Processes 22: 4997–5003. [Google Scholar] [CrossRef]
  72. Zhang, Xike, Gui Zhang, Luo Qiu, Bo Zhang, Yurong Sun, Zifan Gui, and Qiuwen Zhang. 2019b. A Modified Multifractal Detrended Fluctuation Analysis (MFDFA) Approach for Multifractal Analysis of Precipitation in Dongting Lake Basin, China. Water 11: 891. [Google Scholar] [CrossRef]
  73. Zhu, Huijian, and Weiguo Zhang. 2018. Multifractal property of Chinese stock market in the CSI 800 index based on MF-DFA approach. Physica A: Statistical Mechanics and Its Applications 490: 497–503. [Google Scholar] [CrossRef]
  74. Zou, Shaohui, and Tian Zhang. 2019. Multifractal Detrended Cross-Correlation Analysis of Electricity and Carbon Markets in China. Mathematical Problems in Engineering 2019: 9350940. [Google Scholar] [CrossRef]
  75. Zunino, Luciano, Alejandra Figliola, Benjamin M. Tabak, Darío G. Pérez, Mario Garavaglia, and Osvaldo A. Rosso. 2009. Multifractal structure in Latin-American market indices. Chaos, Solitons & Fractals 41: 2331–40. [Google Scholar] [CrossRef]
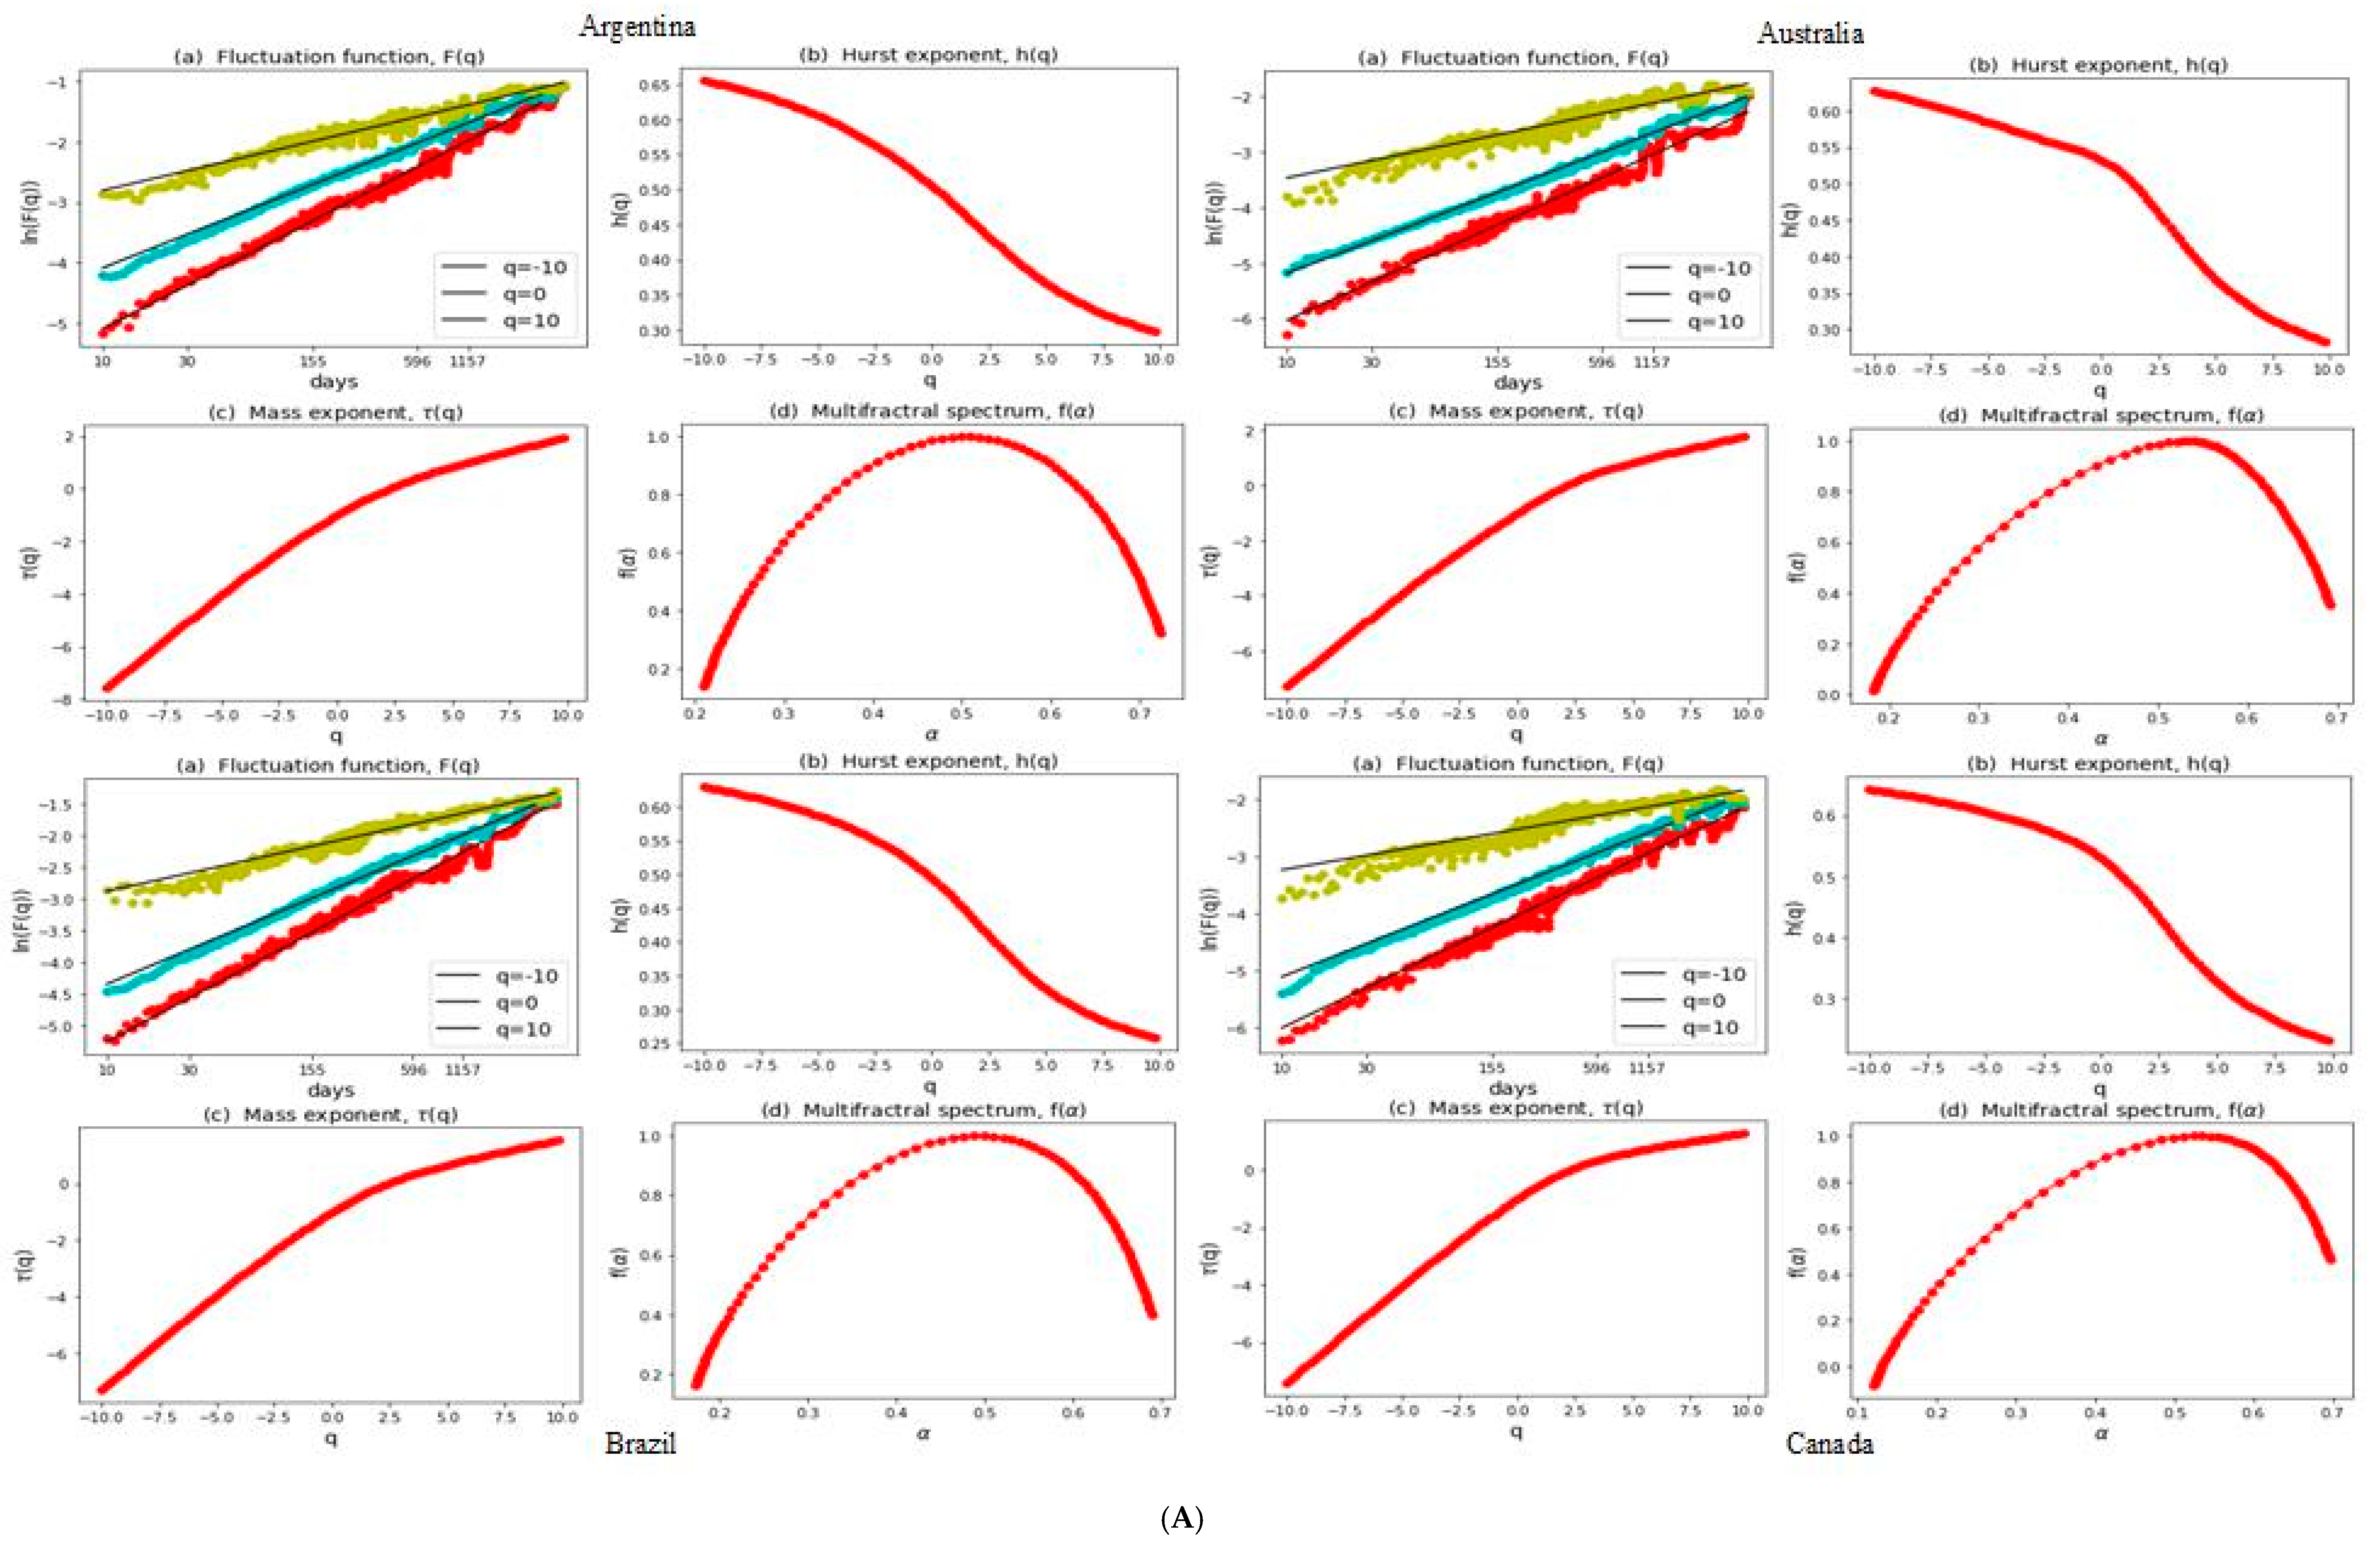
Figure 1. (A) The overall period’s MFDFA results (Argentina, Australia, Brazil, Canada) of the daily index return time series including, (a) fluctuation functions q = −10 (light green), q = 0 (light blue), q = 10 (red), (b) generalized Hurst exponent q , (c) mass exponent τ ( q ) , and (d) multifractal spectrum f ( α ) . (B) The MFDFA results of daily index return time series (China, France, Germany, India) for overall period. (C) The MFDFA results of daily index return time series (Indonesia, Italy, Japan, Mexico) for overall period. (D) The MFDFA results of daily index return time series (Russia, Saudi Arabia, South Africa, South Korea) for overall period. (E) The MFDFA results of daily index return time series (Turkey, UK, USA) for overall period.
Economies 12 00106 g001aEconomies 12 00106 g001bEconomies 12 00106 g001cEconomies 12 00106 g001dEconomies 12 00106 g001e
Figure 2. (A) The COVID-19 pandemic period’s MFDFA results (Argentina, Australia, Brazil, Canada) of the daily index return time series including, (a) fluctuation functions q = −10 (light green), q = 0 (light blue), q = 10 (red), (b) generalized Hurst exponent q , (c) mass exponent τ ( q ) , and (d) multifractal spectrum f ( α ) . (B) The MFDFA results of daily index return time series (China, France, Germany, India) during COVID-19 period. (C) The MFDFA results of daily index return time series (Indonesia, Italy, Japan, Mexico) during COVID-19 period. (D) The MFDFA results of daily index return time series (Russia, Saudi Arabia, South Africa, South Korea) during COVID-19 period. (E) The MFDFA results of daily index return time series (Turkey, UK, USA) during COVID-19 period.
Economies 12 00106 g002aEconomies 12 00106 g002bEconomies 12 00106 g002cEconomies 12 00106 g002dEconomies 12 00106 g002e
Figure 3. (A) The Russia–Ukraine war period’s MFDFA results (Argentina, Australia, Brazil, Canada) of the daily index return time series including, (a) fluctuation functions q = −10 (light green), q = 0 (light blue), q = 10 (red), (b) generalized Hurst exponent q , (c) mass exponent τ ( q ) , and (d) multifractal spectrum f ( α ) . (B) The MFDFA results of daily index return time series (China, France, Germany, India) during Russia-Ukraine War period. (C) The MFDFA results of daily index return time series (Indonesia, Italy, Japan, Mexico) during Russia-Ukraine War period. (D) The MFDFA results of daily index return time series (Russia, Saudi Arabia, South Africa, South Korea) during Russia-Ukraine War period. (E) The MFDFA results of daily index return time series (Turkey, UK, USA) during Russia-Ukraine War period.
Economies 12 00106 g003aEconomies 12 00106 g003bEconomies 12 00106 g003cEconomies 12 00106 g003dEconomies 12 00106 g003e
Table 1. List of G20 countries with the individual stock index, split by market classification considered in this paper.
S. No.CountryStock IndexMSCI ClassificationStarting DateObservations
1BrazilIBOVESPAEmerging Markets5 January 19986019
2FranceCAC 40Developed Markets5 January 19986213
3GermanyDAX PERFORMANCE-INDEXDeveloped Markets5 January 19888677
4CanadaS&P/TSX Composite indexDeveloped Markets5 January 19888638
5IndonesiaJakarta Composite IndexEmerging Markets4 January 19946912
6South KoreaKOSPIEmerging Markets6 January 19986003
7ArgentinaMERVALEmerging Markets2 January 19985954
8MexicoIPC MEXICOEmerging Markets4 January 19947107
9JapanNikkei 225Developed Markets6 January 198110,166
10ChinaSSE Composite IndexEmerging Markets3 July 19976016
11TurkeyBIST 100Emerging Markets3 January 20026207
12USADow Jones Industrial AverageDeveloped Markets7 December 19995644
13ItalyFTSE MIBDeveloped Markets14 January 20034846
14UKFTSE 100Developed Markets4 January 20015395
15RussiaMOEXEmerging Markets10 March 20092248
16South AfricaJSE Top 40Emerging Markets3 January 20075592
17IndiaS&P BSE SensexEmerging Markets4 January 20005535
18AustraliaS&P/ASX 200Developed Markets5 January 20005654
19Saudi ArabiaTASIEmerging Markets15 January 20005879
Table 2. The sub-sample division of G20 stock markets during the crisis events of COVID-19 and Russia–Ukraine War.
S. No.CountryCOVID-19Russia–Ukraine War
Observations1st CaseObservations
1Brazil48927 February 202049
2France53724 January 202050
3Germany53027 January 202050
4Canada51826 January 202052
5Indonesia4842 March 202043
6South Korea51622 January 202050
7Argentina4823 March202048
8Mexico50228 February 202050
9Japan51022 January 202048
10China51931 December 201948
11Turkey48611 March 202048
12USA52422 January 202052
13Italy52731 January 202050
14UK52431 January 202048
15Russia51931 January 202033
16South Africa4955 March 202048
17India51630 January 202048
18Australia52826 January 202050
19Saudi Arabia4932 March 202048
Table 3. Summary statistics of the G20 stock index returns categorized in accordance with MSCI classification during the overall and crisis periods of COVID-19.
Developed MarketsEmerging Markets
StatisticsAustraliaCanadaFranceGermanyItalyJapanUKUSAArgentinaBrazilChinaIndiaIndonesiaMexicoRussiaSaudi ArabiaSouth AfricaSouth KoreaTurkey
Overall Period
Mean0.000160.000220.000130.00033−0.000010.000140.000030.000200.000790.000430.000190.000430.000350.000440.000550.000290.000260.000360.00047
Maximum0.067650.112950.105950.107970.108740.132350.093840.107640.161170.288320.094010.159900.131280.121540.085270.093910.090570.112840.12128
Minimum−0.10203−0.13176−0.13098−0.14091−0.18541−0.16135−0.11512−0.13842−0.47692−0.17208−0.09256−0.14102−0.12732−0.14314−0.11419−0.10328−0.10450−0.12805−0.13336
Std. Dev.0.010240.009970.014370.014060.015150.013870.011920.011980.023670.019790.015490.014650.014750.014410.014120.013860.013400.016570.01765
Skewness−0.72252−0.99786−0.20994−0.30863−0.71438−0.31815−0.33940−0.38004−1.674870.23511−0.34561−0.38001−0.193650.00320−0.43110−0.94226−0.21059−0.19484−0.24160
Kurtosis8.4814218.955415.981656.7565611.068368.203128.3133813.1334032.4472114.647444.993529.242149.004416.952156.6757810.904415.505665.886484.82828
COVID-19 Period
Mean0.000110.000370.000270.000360.000170.00056−0.000150.000370.001870.000380.000420.000690.000310.000580.000580.001170.000700.001080.00100
Maximum0.067650.112950.080560.104140.085490.077310.086670.107640.097730.130220.055540.085950.097040.041810.074350.068310.090570.082510.05810
Minimum−0.10203−0.13176−0.13098−0.13055−0.18541−0.06274−0.11512−0.13842−0.15629−0.15993−0.08039−0.14102−0.06805−0.06638−0.08646−0.08685−0.10450−0.08767−0.10307
Std. Dev.0.016460.018180.017900.018320.019740.015140.016470.020060.030680.026070.012130.018610.015630.014400.014890.013070.017640.016370.01609
Skewness−1.21347−1.57054−1.30610−0.96209−2.878620.10497−1.09657−0.93904−0.81817−1.58969−0.87744−1.629350.04899−0.56564−0.88221−2.19058−0.62578−0.23797−1.76801
Kurtosis8.5172520.3704911.4128911.3055226.323224.2626810.1222212.781274.5473112.332006.9979713.502246.697402.407509.2119316.899749.287525.541089.31730
Russia–Ukraine War
Mean−0.00024−0.00070−0.00114−0.00089−0.00128−0.00010−0.00226−0.00052−0.00219−0.00166−0.00312−0.001030.00102−0.000920.003340.00204−0.00266−0.000910.00544
Maximum0.013090.018010.068830.076230.067140.038600.016030.027750.039610.023960.034240.024070.011640.021180.182620.019840.040830.021850.05312
Minimum−0.03031−0.03119−0.04019−0.04040−0.04288−0.02984−0.03955−0.03171−0.05054−0.02898−0.05268−0.04836−0.01488−0.02300−0.05016−0.01853−0.03882−0.02635−0.08517
Std. Dev.0.009310.010000.018980.019500.019250.015400.011860.013440.01862−0.012950.016850.014540.006360.010870.043270.007540.015320.010410.01708
Skewness−1.08036−0.708040.900731.146210.529500.29886−1.24770−0.32308−0.18390−0.13115−0.72397−0.51137−0.430710.112862.30444−0.570900.08121−0.14914−2.69559
Kurtosis1.242200.944052.826153.992062.59417−0.158741.79912−0.017330.55965−0.421261.442830.87097−0.60784−0.596407.820370.647230.64424−0.1466516.79280
Table 4. Generalized Hurst exponents for G20 stock indices for the entire period of study and their range over q [ 10 , 10 ] .
Overall PeriodDeveloped MarketsEmerging Markets
Order qAustraliaCanadaFranceGermanyItalyJapanUKUSAArgentinaBrazilChinaIndiaIndonesiaMexicoRussiaSaudi ArabiaSouth AfricaSouth KoreaTurkey
−100.6270.6420.6350.6190.7200.7370.6310.6100.7720.6300.7470.6150.7440.6540.4920.7980.6040.6610.541
−80.6130.6300.6200.6080.7020.7190.6180.5950.7550.6160.7280.5990.7260.6400.4790.7810.5900.6440.527
−60.5950.6150.6000.5950.6770.6950.5990.5750.7320.5980.7020.5770.7020.6220.4620.7590.5720.6210.509
−40.5740.5960.5760.5810.6410.6630.5750.5490.7020.5750.6660.5520.6680.5960.4390.7300.5520.5890.489
−20.5550.5710.5470.5670.5980.6260.5400.5170.6620.5420.6220.5280.6230.5570.4090.6980.5290.5380.469
00.5330.5300.5150.5490.5560.5920.4880.4730.6080.4940.5690.5090.5650.4940.3600.6680.4990.4580.442
20.4790.4550.4770.5180.4640.5620.4180.4040.5350.4280.4990.4730.4900.4210.2650.6200.4480.3660.387
40.4010.3640.4350.4800.3310.5300.3500.3290.4560.3580.4370.4220.4220.3660.1520.5640.3880.2970.326
60.3420.2980.3990.4490.2580.4970.3020.2750.3960.3090.3940.3810.3760.3290.0830.5240.3400.2530.284
80.3050.2560.3720.4260.2170.4710.2700.2390.3560.2770.3650.3540.3470.3050.0450.4970.3080.2230.256
100.2810.2300.3530.4100.1920.4520.2480.2160.3300.2570.3440.3340.3270.2870.0210.4780.2870.2040.237
∆h0.3460.4130.2820.2100.5280.2840.3830.3940.4420.3730.4030.2810.4180.3670.4710.3200.3170.4570.304
Table 5. Generalized Hurst exponents for G20 stock indices during the crisis periods of COVID-19 outbreak and Russia–Ukraine War and their range over q [ 10 , 10 ] .
Developed MarketsEmerging Markets
Order qAustraliaCanadaFranceGermanyItalyJapanUKUSAArgentinaBrazilChinaIndiaIndonesiaMexicoRussiaSaudi ArabiaSouth AfricaSouth KoreaTurkey
COVID-19
−100.65640.62930.66730.72240.54530.72400.52240.65120.67220.80530.41510.74750.71680.62340.86420.74950.65030.88000.7404
−80.64580.60930.64960.70720.52830.70360.50910.63430.65570.78510.40590.73070.70420.60780.84440.73140.63700.85950.7273
−60.63330.58080.62570.68660.50570.67530.49200.61060.63300.75760.39580.70840.68720.58730.81650.70650.61970.83070.7097
−40.62080.53910.59500.65810.47510.63730.47070.57560.60100.72090.38620.67980.66300.56040.77600.67060.59680.79000.6855
−20.61310.48030.56440.61900.43330.59230.44870.52040.55680.67450.37880.64810.62510.52580.71630.61670.56520.73480.6501
00.59700.40010.53430.55040.37300.53810.42390.42940.49570.61860.36790.60720.55320.47760.61590.53480.51190.65290.5935
20.45990.29410.42250.37950.29120.43110.33440.29920.40890.55080.33690.48660.39150.39980.44400.43010.37720.50250.5007
40.31390.19320.29670.23090.21560.30190.22860.18910.31430.48080.29490.35150.21900.30910.29070.34020.20180.34470.4028
60.24070.12610.22590.15760.16380.22190.16510.12410.24820.42780.26180.27780.12830.24300.20430.28180.10370.25570.3398
80.20100.08480.18570.11820.13000.17690.12810.08570.20810.39190.23890.23740.08040.20120.15530.24460.05130.20750.3021
100.17630.05800.16040.09390.1069 0.14910.10460.06090.18270.36740.22280.21220.05170.17390.12470.21940.02000.17840.2781
∆h0.48010.57120.50690.62850.43840.57490.41780.59030.48950.43800.19230.53530.66510.44950.73940.53000.63020.70160.4623
Russia−Ukraine War
−100.89310.88740.64770.66120.68710.88801.13850.79210.78810.95520.88330.84180.46350.84431.20290.98560.81270.59790.6826
−80.87590.87180.63530.65030.67280.86781.12480.76520.76590.93890.85710.82220.44870.83221.18800.95520.78410.58140.6611
−60.85160.84730.61920.63640.65390.84001.10570.72400.73310.91690.81660.79560.42920.81701.16440.90740.74080.55600.6329
−40.81450.80190.59690.61750.62810.80181.07570.65920.68170.88660.75000.75810.40290.79811.12090.82660.67130.51420.5959
−20.75390.70550.56280.58700.58810.75301.01740.56280.59950.84480.64040.70200.36780.77531.02750.68570.55920.44670.5492
00.66180.52840.50520.52160.50870.69710.87970.44930.48350.78940.49080.61760.32310.74920.83020.48380.41030.36440.4960
20.56790.35020.41610.39700.36530.63730.68730.35570.36490.72480.35290.50940.27180.72170.59840.31890.27370.29760.4460
40.50670.24530.32110.27200.22250.58350.57740.29490.27830.66460.26070.40680.22130.69530.46510.22810.17880.25040.4062
60.47220.19020.25020.19230.13220.54200.52200.25700.22360.61920.20420.33020.17900.67210.39780.17620.11680.21610.3763
80.45160.15860.20430.14550.07990.51170.48960.23200.18870.58780.16850.27790.14700.65300.36020.14320.07500.19060.3537
100.43790.13840.17450.11640.04760.48960.46820.21440.16500.56580.14460.24210.12380.63770.33690.12070.04570.17150.3362
∆h0.45520.74910.47320.54480.63950.39840.67030.57770.62310.38930.73870.59970.33980.20660.86590.86490.76700.42640.3464
Disclaimer/Publisher’s Note: The statements, opinions and data contained in all publications are solely those of the individual author(s) and contributor(s) and not of MDPI and/or the editor(s). MDPI and/or the editor(s) disclaim responsibility for any injury to people or property resulting from any ideas, methods, instructions or products referred to in the content.