Influence of the Russia–Ukraine War and COVID-19 Pandemic on the Efficiency and Herding Behavior of Stock Markets: Evidence from G20 Nations
Abstract
:1. Introduction
2. Methodology and Data
2.1. Data
2.2. Methodology
3. Empirical Results and Discussion
3.1. Descriptive Statistics
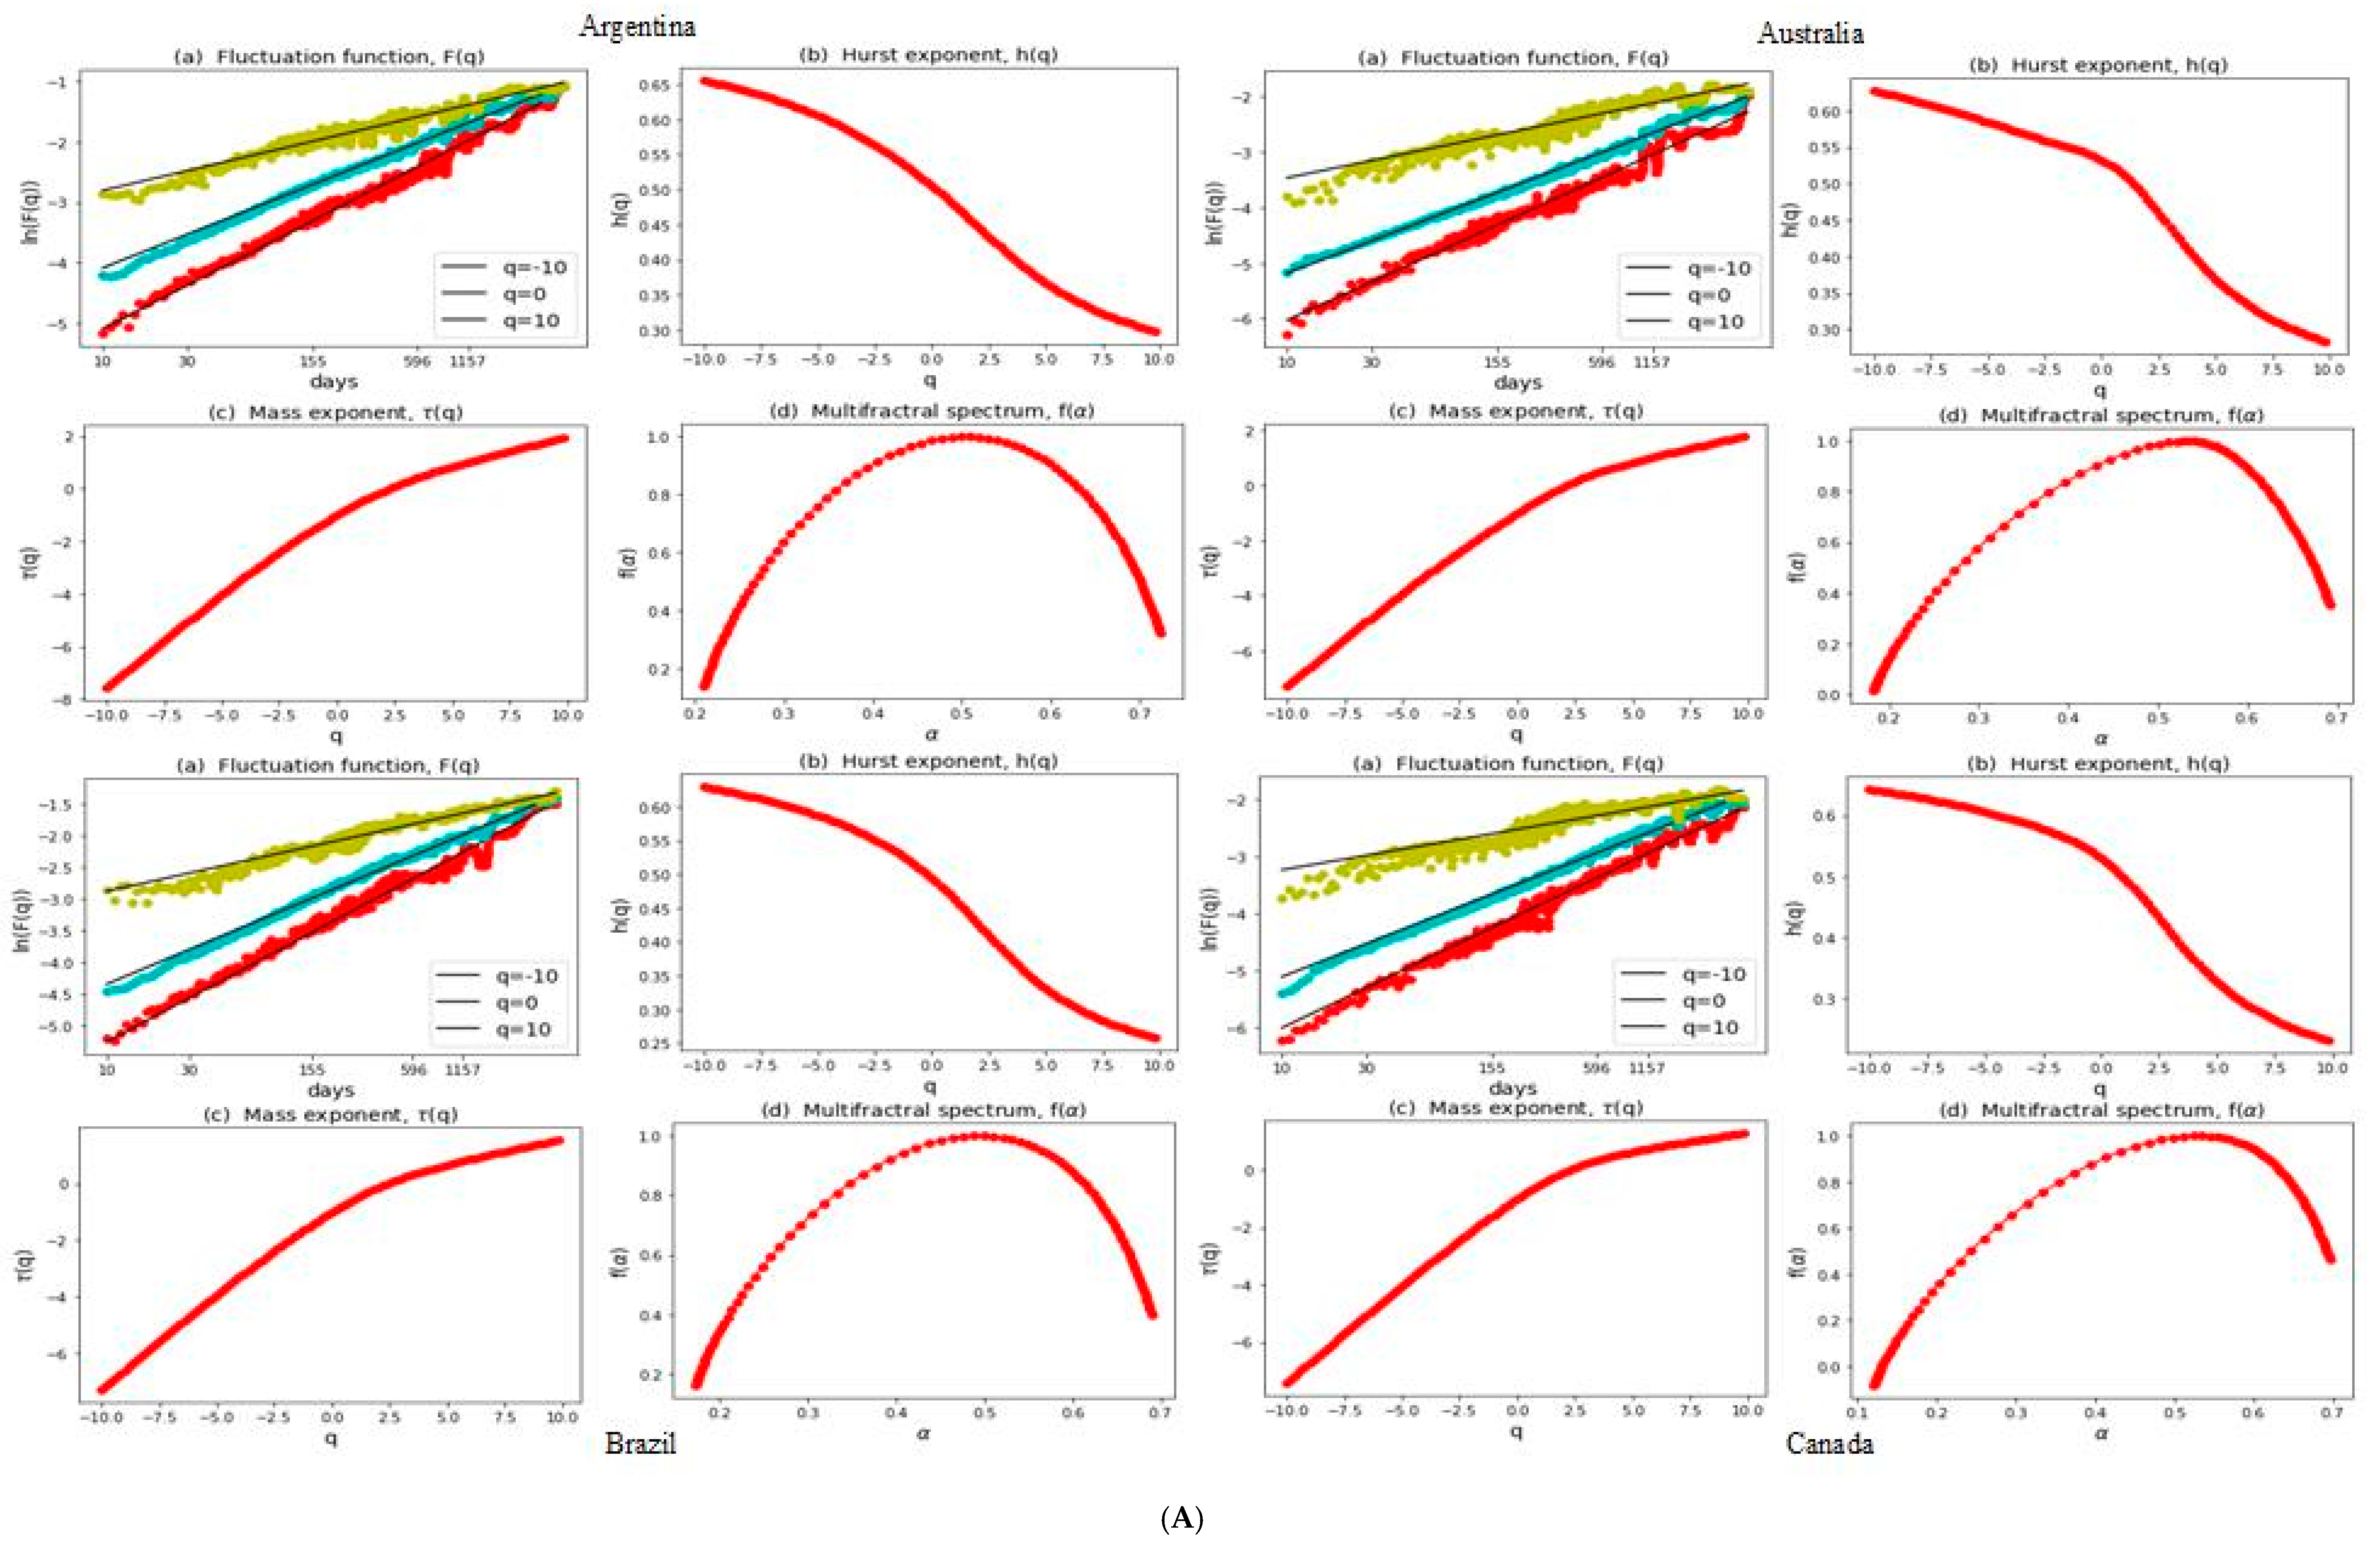
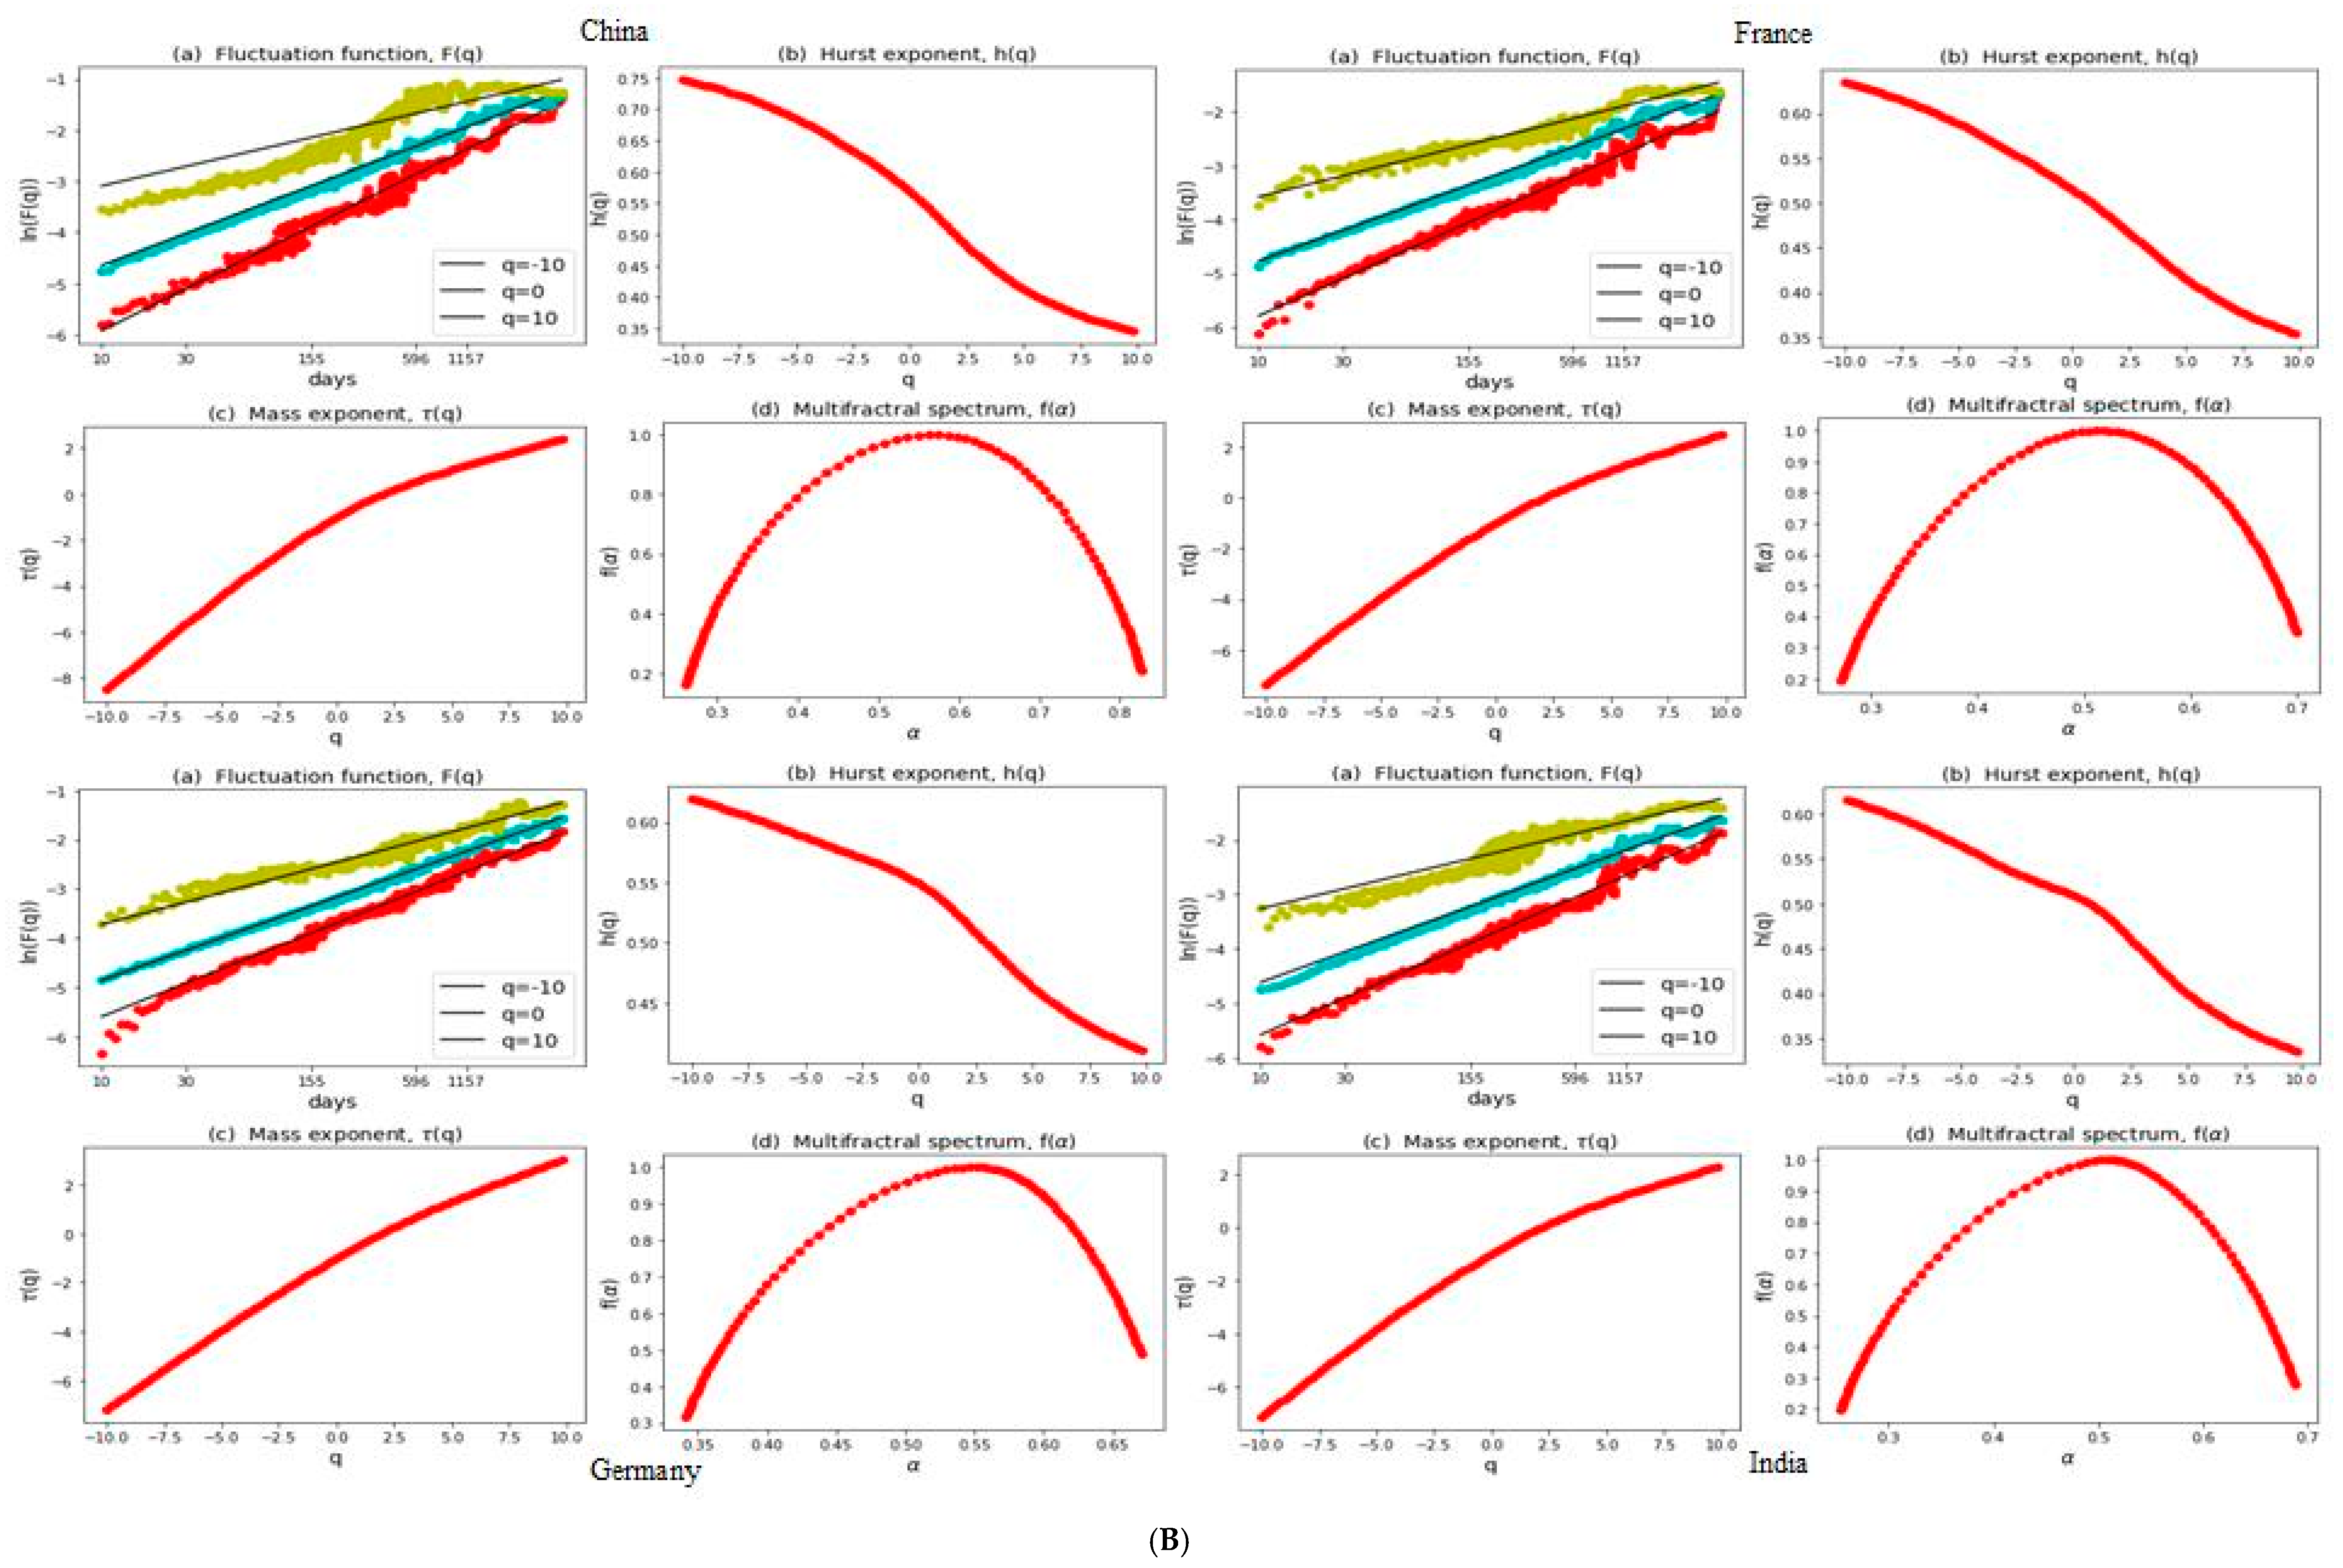
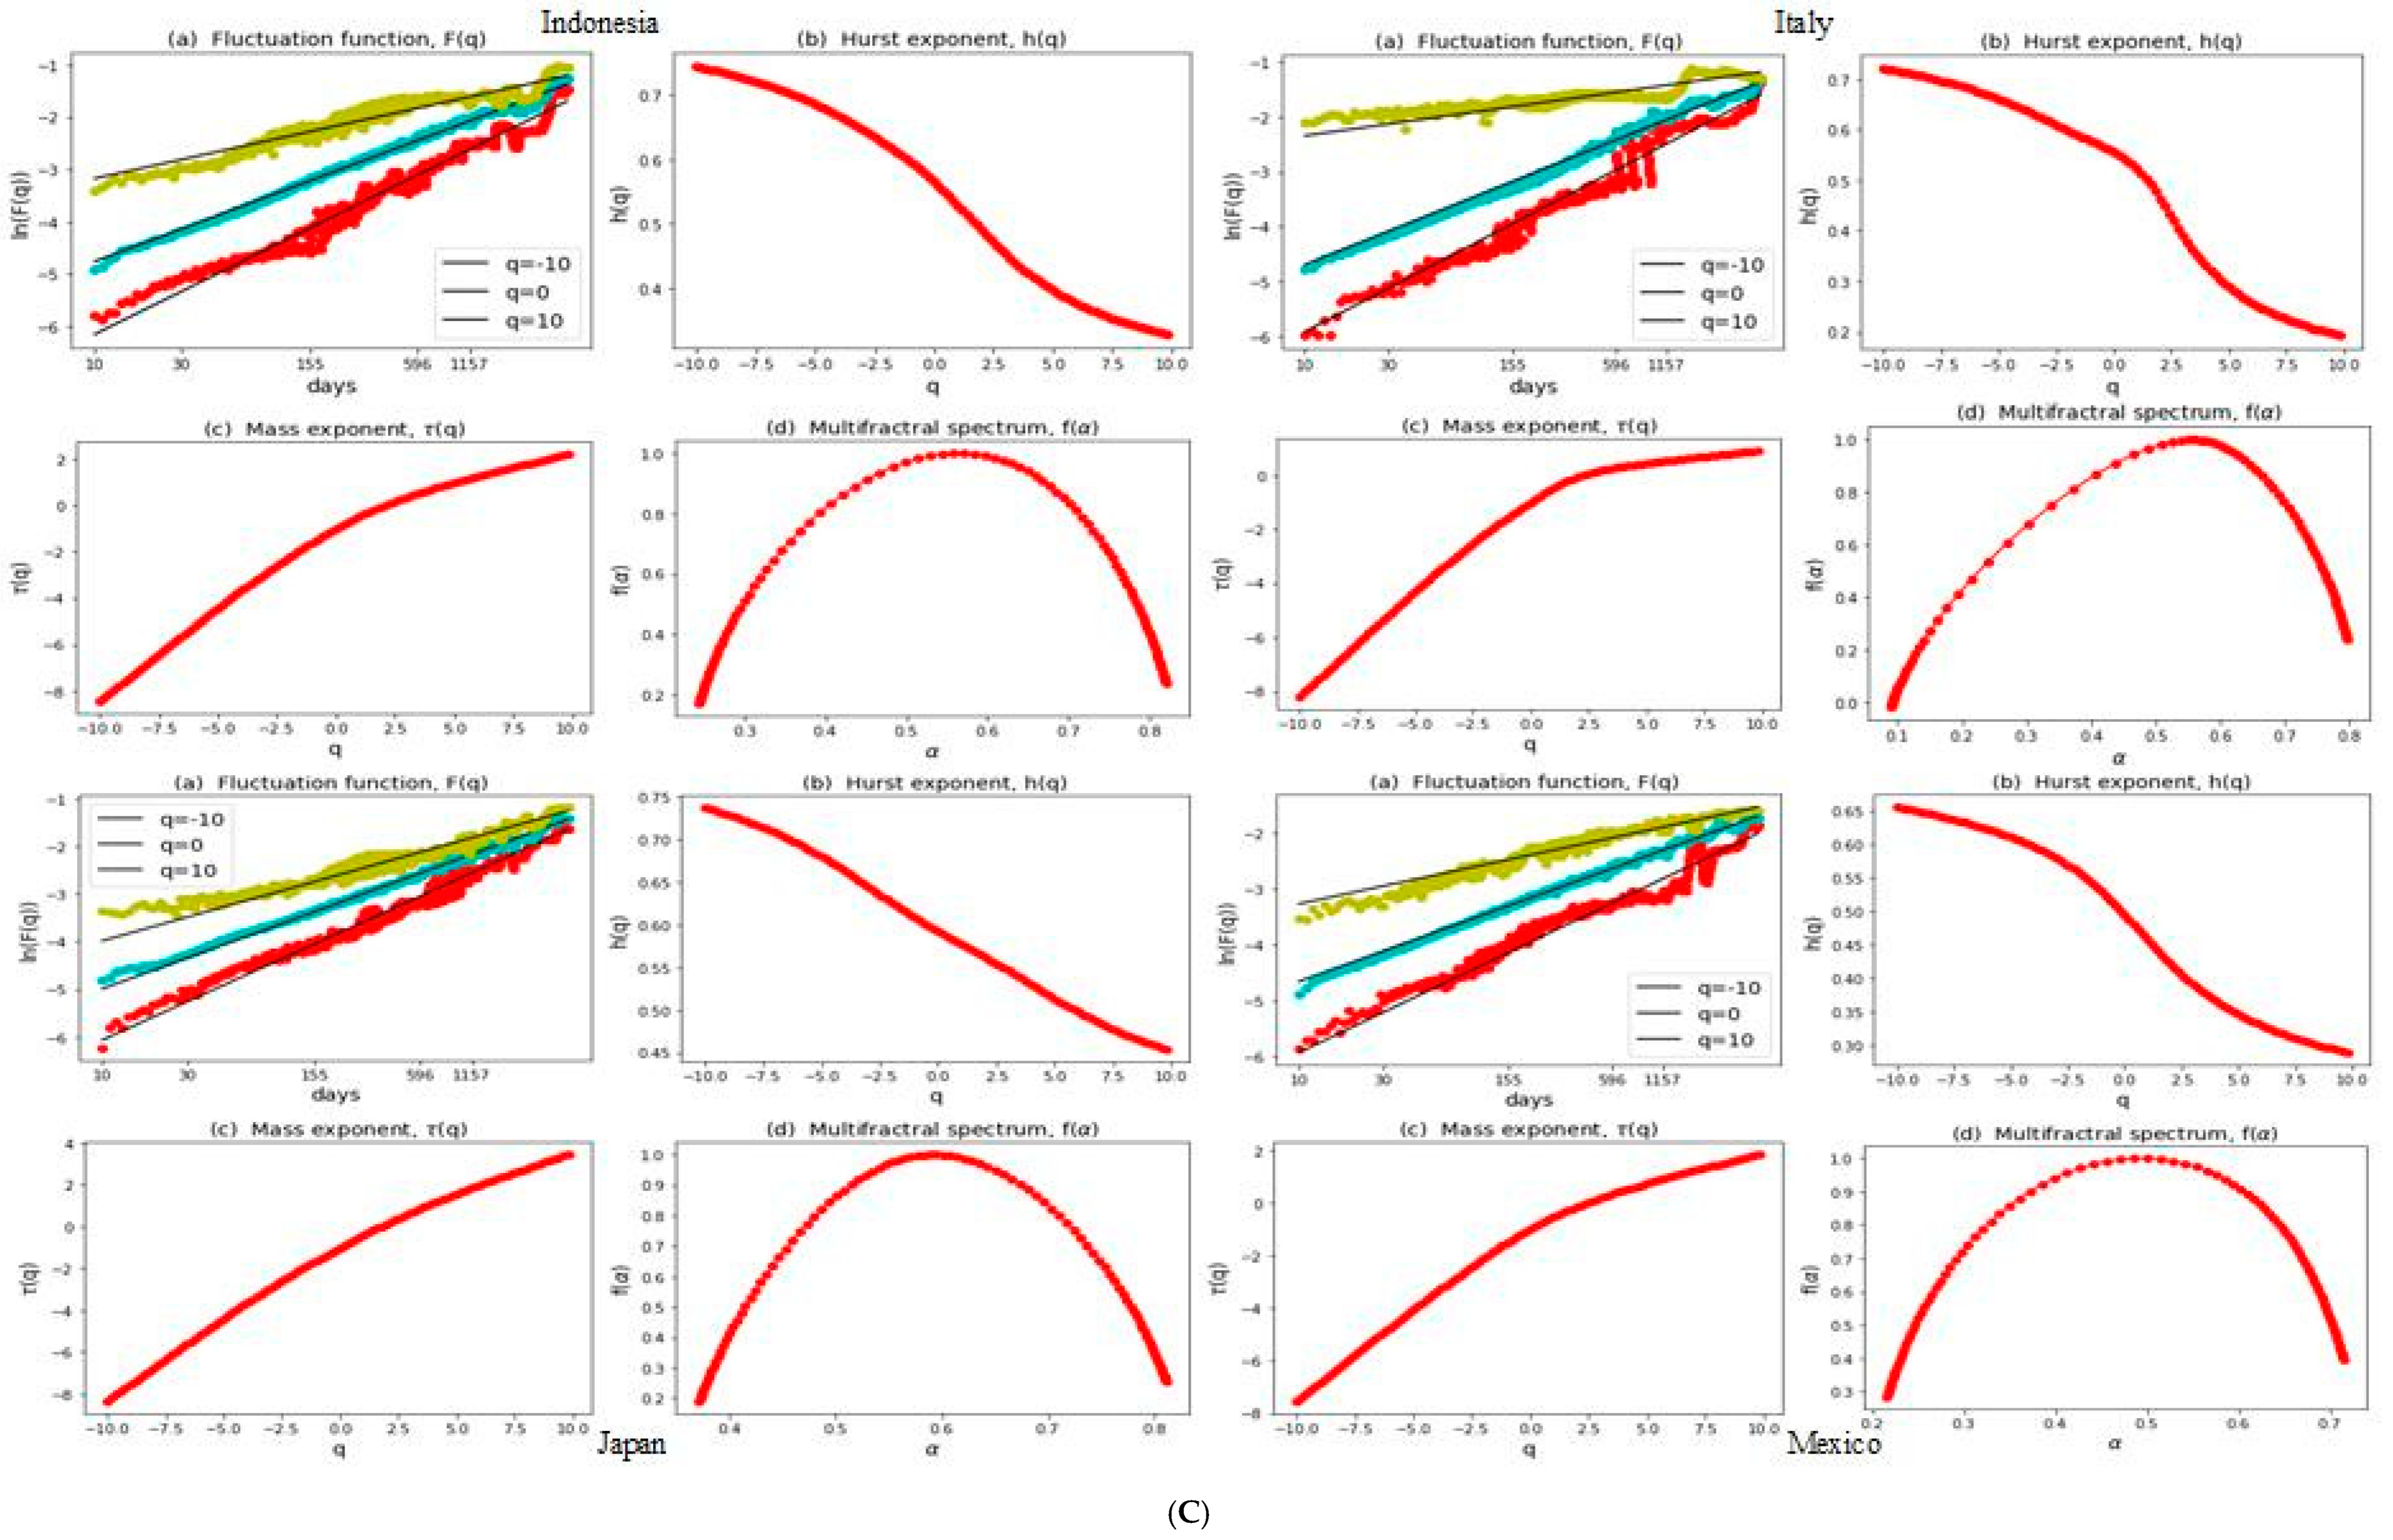
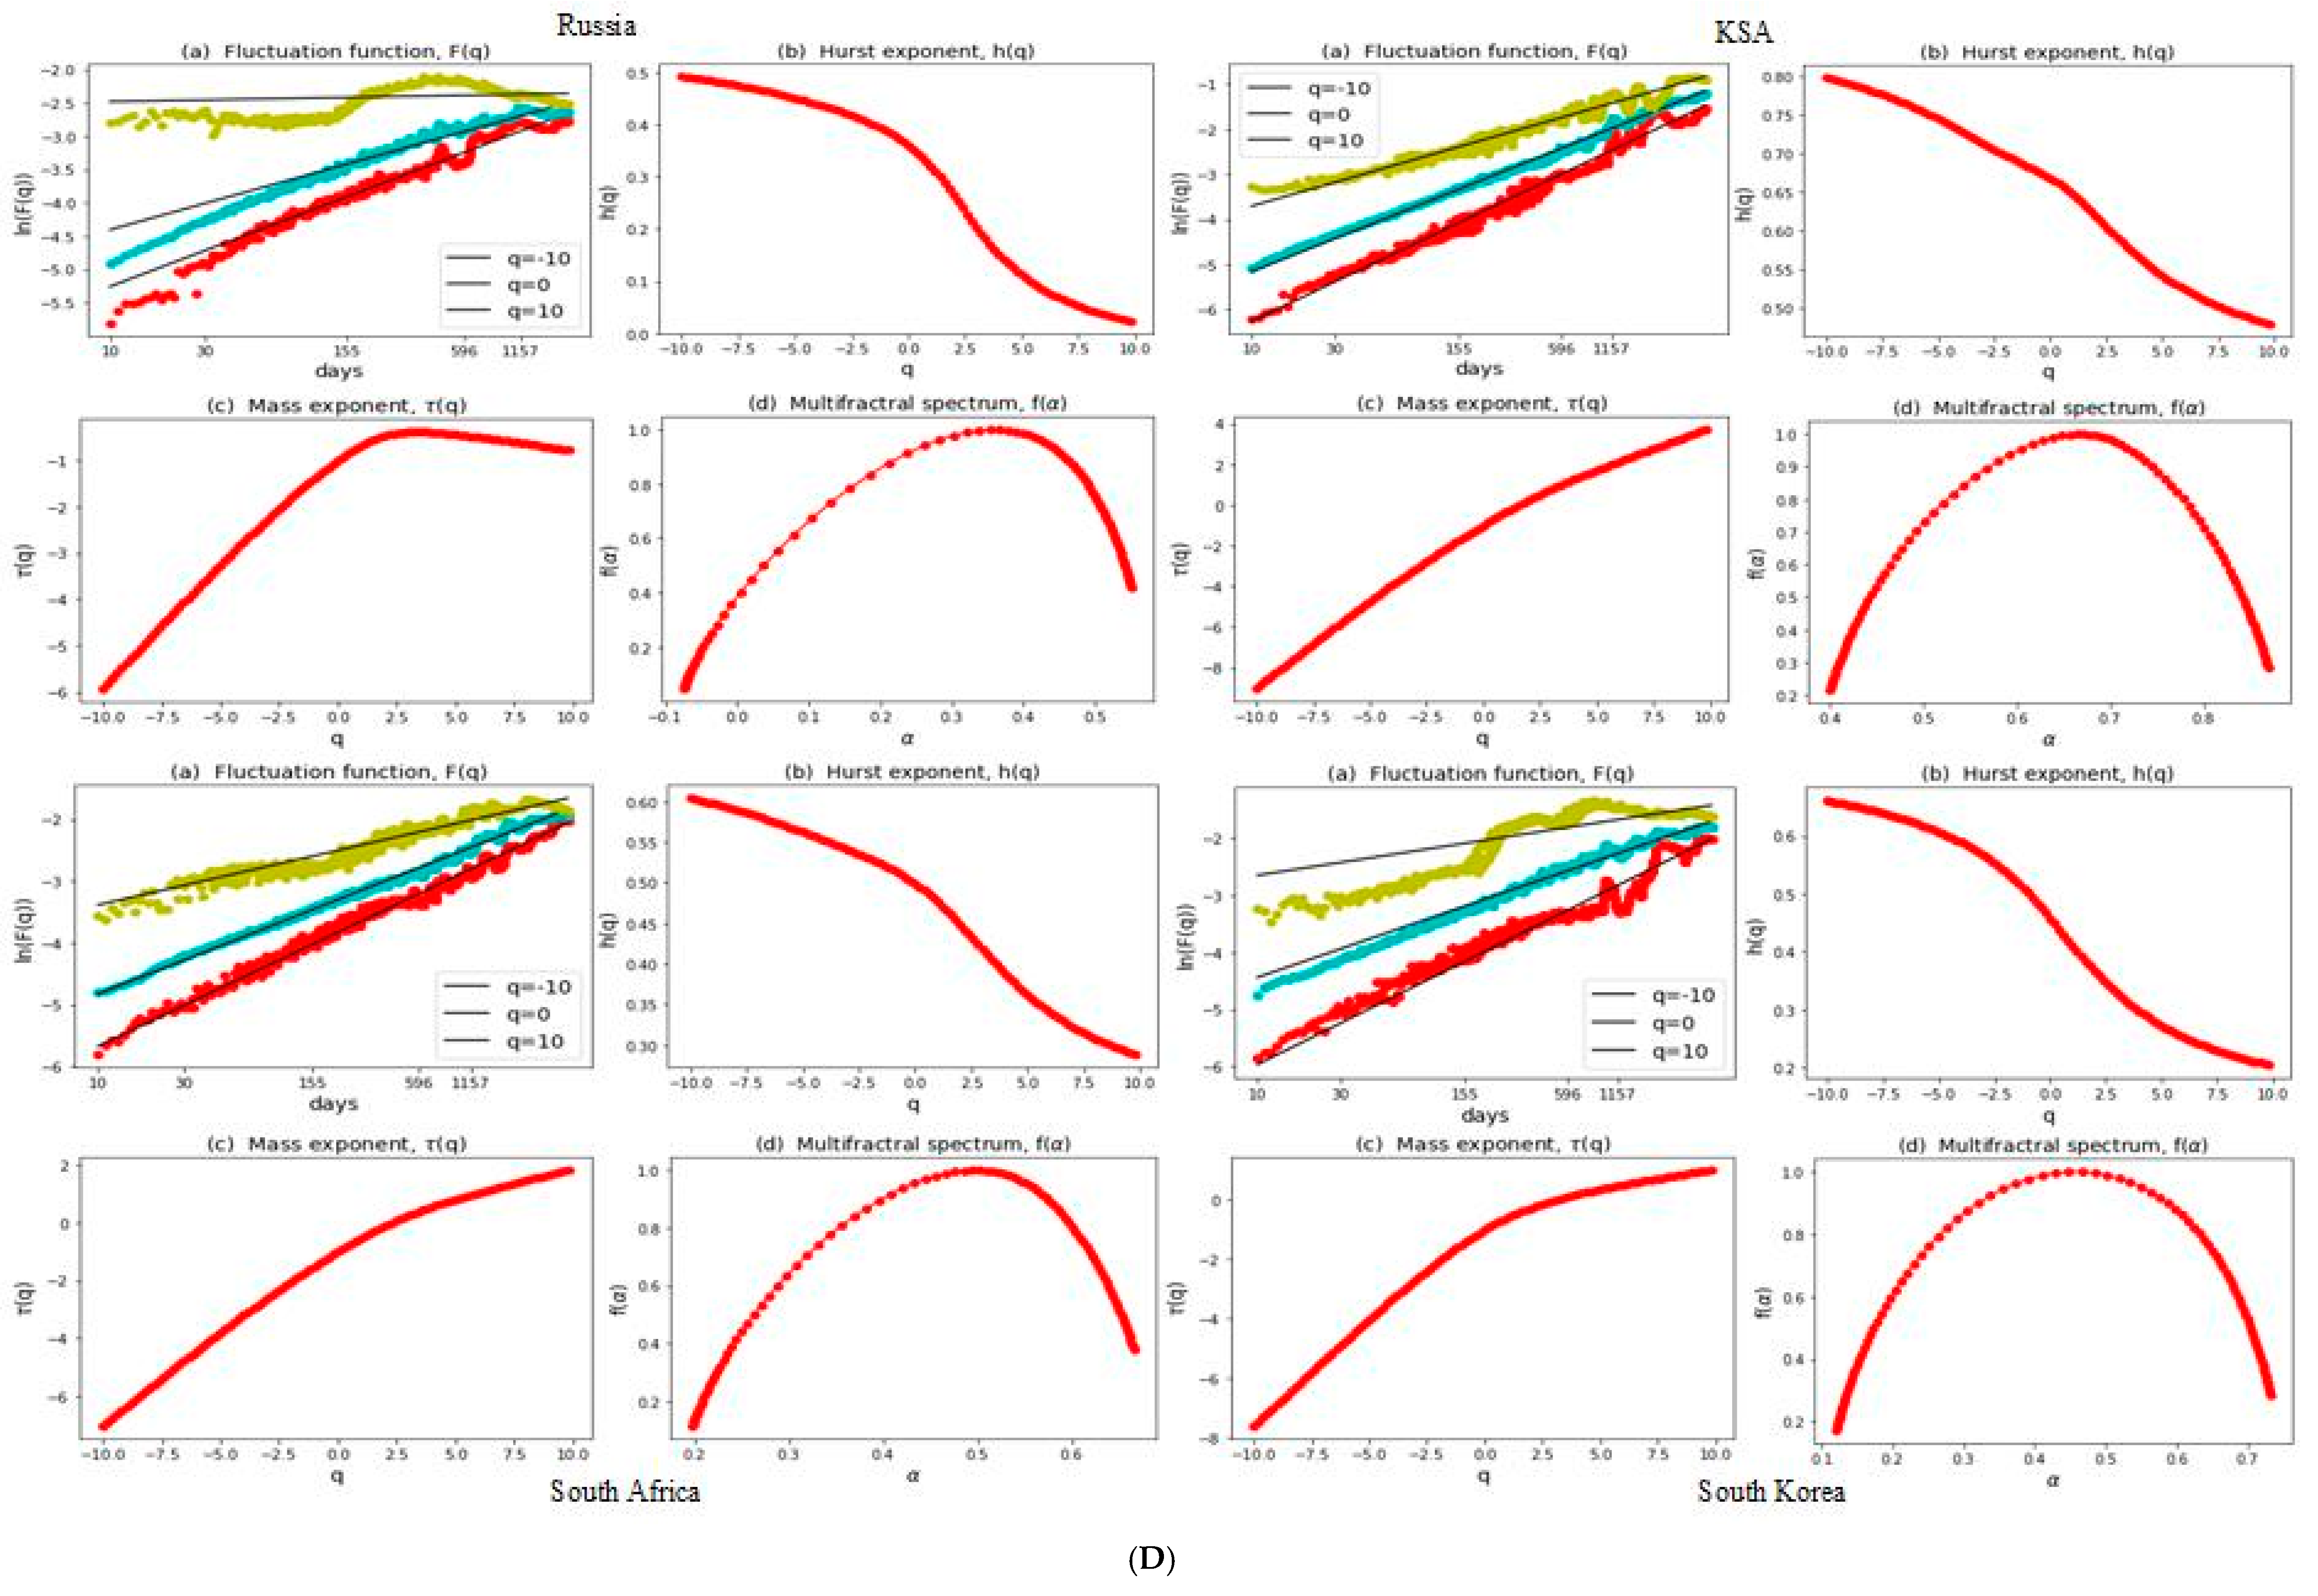
3.2. Multifractal Structures of G20 Stock Markets
3.3. Range of Persistance and Herding Behavior in the G20 Markets
4. Conclusions
Author Contributions
Funding
Informed Consent Statement
Data Availability Statement
Conflicts of Interest
References
- Alam, Nafis, Shaista Arshad, and Syed Aun R. Rizvi. 2016. Do Islamic stock indices perform better than conventional counterparts? An empirical investigation of sectoral efficiency. Review of Financial Economics 31: 108–14. [Google Scholar] [CrossRef]
- Ali, Sajid, Syed Jawad Hussain Shahzad, Naveed Raza, and Khamis Hamed Al-Yahyaee. 2018. Stock market efficiency: A comparative analysis of Islamic and conventional stock markets. Physica A: Statistical Mechanics and its Applications 503: 139–53. [Google Scholar] [CrossRef]
- Anagnostidis, P., C. Varsakelis, and C. J. Emmanouilides. 2016. Has the 2008 financial crisis affected stock market efficiency? The case of Eurozone. Physica A: Statistical Mechanics and its Applications 447: 116–28. [Google Scholar] [CrossRef]
- Arshad, Shaista, Syed Aun R. Rizvi, Gairuzazmi Mat Ghani, and Jarita Duasa. 2016. Investigating stock market efficiency: A look at OIC member countries. Research in International Business and Finance 36: 402–13. [Google Scholar] [CrossRef]
- Aslam, Faheem, Paulo Ferreira, Haider Ali, and Sumera Kauser. 2021. Herding behavior during the COVID-19 pandemic: A comparison between Asian and European stock markets based on intraday multifractality. Eurasian Economic Review (EAER). ahead of print. [Google Scholar] [CrossRef]
- Aslam, Faheem, Saima Latif, and Paulo Ferreira. 2020a. Investigating Long-Range Dependence of Emerging Asian Stock Markets Using Multifractal Detrended Fluctuation Analysis. Symmetry 12: 1157. [Google Scholar] [CrossRef]
- Aslam, Faheem, Saqib Aziz, Duc Khuong Nguyen, Khurrum S. Mughal, and Maaz Khan. 2020b. On the efficiency of foreign exchange markets in times of the COVID-19 pandemic. Technological Forecasting and Social Change 161: 120261. [Google Scholar] [CrossRef] [PubMed]
- Aslam, Faheem, Wahbeeah Mohti, and Paulo Ferreira. 2020c. Evidence of Intraday Multifractality in European Stock Markets during the Recent Coronavirus (COVID-19) Outbreak. International Journal of Financial Studies 8: 31. [Google Scholar] [CrossRef]
- Aslam, Faheem, Yasir Tariq Mohmand, Paulo Ferreira, Bilal Ahmed Memon, Maaz Khan, and Mrestyal Khan. 2020d. Network Analysis of Global Stock Markets at the beginning of the Coronavirus Disease (COVID-19) Outbreak. Borsa Istanbul Review 20: S49–S61. [Google Scholar] [CrossRef]
- Balasubramanian, Niranjana. 2020. An MFDFA Study to find Herd Behaviour and Information Asymmetry during Demonetization. Ushus Journal of Business Management 19: 41–59. [Google Scholar] [CrossRef]
- Balcilar, Mehmet, Matteo Bonato, Riza Demirer, and Rangan Gupta. 2018. Geopolitical risks and stock market dynamics of the BRICS. Economic Systems 42: 295–306. [Google Scholar] [CrossRef]
- Bao, Juan, Wei Chen, and Zheng-Tao Xiang. 2016. Traffic Time Series Simulation Analysis by Using MSE and MFDFA. Paper presented at the 2016 International Conference on Industrial Informatics—Computing Technology, Intelligent Technology, Industrial Information Integration (ICIICII), Wuhan, China, 3–4 December. [Google Scholar]
- Bloom, Nicholas. 2009. The impact of uncertainty shocks. Econometrica 77: 623–85. [Google Scholar]
- Butler, Kirt C., and S. Jamal Malaikah. 1992. Efficiency and inefficiency in thinly traded stock markets: Kuwait and Saudi Arabia. Journal of Banking & Finance 16: 197–210. [Google Scholar] [CrossRef]
- Cajueiro, Daniel O., Periklis Gogas, and Benjamin M. Tabak. 2009. Does financial market liberalization increase the degree of market efficiency? The case of the Athens stock exchange. International Review of Financial Analysis 18: 50–57. [Google Scholar] [CrossRef]
- Caraiani, Petre. 2012. Evidence of Multifractality from Emerging European Stock Markets. PLoS ONE 7: e40693. [Google Scholar] [CrossRef] [PubMed]
- Chang, Xin, Yangyang Chen, and Leon Zolotoy. 2017. Stock Liquidity and Stock Price Crash Risk. Journal of Financial and Quantitative Analysis 52: 1605–37. [Google Scholar] [CrossRef]
- Chari, Murali D. R., Parthiban David, Augustine Duru, and Yijiang Zhao. 2019. Bowman’s risk-return paradox: An agency theory perspective. Journal of Business Research 95: 357–75. [Google Scholar] [CrossRef]
- Chattopadhyay, Anirban, Mofazzal H. Khondekar, and Anup Kumar Bhattacharjee. 2018. Fractality and singularity in CME linear speed signal: Cycle 23. Chaos Solitons & Fractals 114: 542–50. [Google Scholar] [CrossRef]
- Choi, Sun-Yong. 2021. Analysis of stock market efficiency during crisis periods in the US stock market: Differences between the global financial crisis and COVID-19 pandemic. Physica A: Statistical Mechanics and its Applications 574: 125988. [Google Scholar] [CrossRef]
- Derindere Köseoğlu, Sinem, Burcu Adıgüzel Mercangöz, Khalid Khan, and Suleman Sarwar. 2024. The impact of the Russian-Ukraine war on the stock market: A causal analysis. Applied Economics 56: 2509–19. [Google Scholar] [CrossRef]
- Di Matteo, Tiziana, Tomaso Aste, and Michel M. Dacorogna. 2005. Long-term memories of developed and emerging markets: Using the scaling analysis to characterize their stage of development. Journal of Banking & Finance 29: 827–51. [Google Scholar] [CrossRef]
- Di Matteo, Tiziana, Tomaso Aste, and Michel M. Dacorogna. 2003. Scaling behaviors in differently developed markets. Physica A: Statistical Mechanics and its Applications 324: 183–88. [Google Scholar] [CrossRef]
- Diniz-Maganini, Natalia, Abdul A. Rasheed, and Hsia Hua Sheng. 2021. Exchange rate regimes and price efficiency: Empirical examination of the impact of financial crisis. Journal of International Financial Markets, Institutions and Money 73: 101361. [Google Scholar] [CrossRef]
- Fama, Eugene F. 1970. Efficient Capital Markets: A Review of Theory and Empirical Work. The Journal of Finance 25: 383–417. [Google Scholar] [CrossRef]
- Fama, Eugene F. 1965. The Behavior of Stock-Market Prices. The Journal of Business 38: 34–105. [Google Scholar] [CrossRef]
- Fernando, Ruwangi, Hua Wang, Yanchun Zhang, Mahesh Prakash, and Ashim Debnath. 2020. The effects of travel containment measures within COVID-19. Paper presented at the 2020 24th International Conference Information Visualisation (IV), Melbourne, Australia, 7–11 September. [Google Scholar]
- Fernández-Martínez, M., M. A. Sánchez-Granero, M. J. Muñoz Torrecillas, and Bill McKelvey. 2017. A comparison of three hurst exponent approaches to predict nascent bubbles in S&P500 stocks. Fractals 25: 1750006. [Google Scholar] [CrossRef]
- Figliola, Alejandra, Luciano Zunino, Eduardo Serrano, and Osvaldo Rosso. 2010. Multifractal characterization of the stock market inefficiency using the Wavelet Leaders method. Adv. Appl. Stat. Sci 2: 287–302. [Google Scholar]
- Gao, Xue, Yixin Ren, and Muhammad Umar. 2021. To what extent does COVID-19 drive stock market volatility? A comparison between the U.S. and China. Economic Research-Ekonomska Istraživanja, 1–21. [Google Scholar] [CrossRef]
- He, Qing, Junyi Liu, Sizhu Wang, and Jishuang Yu. 2020. The impact of COVID-19 on stock markets. Economic and Political Studies 8: 275–88. [Google Scholar] [CrossRef]
- Hudson, Robert, and Andrew Urquhart. 2022. Naval disasters, world war two and the British stock market. Research in International Business and Finance 59: 101556. [Google Scholar] [CrossRef]
- Ikeda, Taro. 2018. Multifractal structures for the Russian stock market. Physica A: Statistical Mechanics and Its Applications 492: 2123–28. [Google Scholar] [CrossRef]
- Izzeldin, Marwan, Yaz Gülnur Muradoğlu, Vasileios Pappas, Athina Petropoulou, and Sheeja Sivaprasad. 2023. The impact of the Russian-Ukrainian war on global financial markets. International Review of Financial Analysis 87: 102598. [Google Scholar] [CrossRef]
- Kantelhardt, Jan W., Stephan A. Zschiegner, Eva Koscielny-Bunde, Shlomo Havlin, Armin Bunde, and H. Eugene Stanley. 2002. Multifractal detrended fluctuation analysis of nonstationary time series. Physica A: Statistical Mechanics and its Applications 316: 87–114. [Google Scholar] [CrossRef]
- Kristoufek, Ladislav, and Miloslav Vosvrda. 2013. Measuring capital market efficiency: Global and local correlations structure. Physica A: Statistical Mechanics and its Applications 392: 184–93. [Google Scholar] [CrossRef]
- Lee, Chi-Chuan, Chien-Chiang Lee, and Yizhong Wu. 2021. The impact of COVID-19 pandemic on hospitality stock returns in China. International Journal of Finance & Economics 28: 1787–800. [Google Scholar] [CrossRef]
- Mali, Provash, and Amitabha Mukhopadhyay. 2014. Multifractal characterization of gold market: A multifractal detrended fluctuation analysis. Physica A: Statistical Mechanics and Its Applications 413: 361–72. [Google Scholar] [CrossRef]
- Memon, Bilal Ahmed, Faheem Aslam, Shakhnoza Asadova, and Paulo Ferreira. 2023. Are clean energy markets efficient? A multifractal scaling and herding behavior analysis of clean and renewable energy markets before and during the COVID19 pandemic. Heliyon 9: e22694. [Google Scholar] [CrossRef] [PubMed]
- Memon, Bilal Ahmed, Hongxing Yao, and Hafiz Muhammad Naveed. 2022. Examining the efficiency and herding behavior of commodity markets using multifractal detrended fluctuation analysis. Empirical evidence from energy, agriculture, and metal markets. Resources Policy 77: 102715. [Google Scholar] [CrossRef]
- Mensi, Walid, Ahmet Sensoy, Xuan Vinh Vo, and Sang Hoon Kang. 2020. Impact of COVID-19 outbreak on asymmetric multifractality of gold and oil prices. Resources Policy 69: 101829. [Google Scholar] [CrossRef]
- Miloş, Laura Raisa, Cornel Haţiegan, Marius Cristian Miloş, Flavia Mirela Barna, and Claudiu Boțoc. 2020. Multifractal Detrended Fluctuation Analysis (MF-DFA) of Stock Market Indexes. Empirical Evidence from Seven Central and Eastern European Markets. Sustainability 12: 535. [Google Scholar] [CrossRef]
- Mishra, Pramod Kumar. 2020. COVID-19, Black Swan events and the future of disaster risk management in India. Progress in Disaster Science 8: 100137. [Google Scholar] [CrossRef]
- Mnif, Emna, and Anis Jarboui. 2021. COVID-19, bitcoin market efficiency, herd behaviour. Review of Behavioral Finance 13: 69–84. [Google Scholar] [CrossRef]
- Mnif, Emna, Anis Jarboui, and Khaireddine Mouakhar. 2020. How the cryptocurrency market has performed during COVID 19? A multifractal analysis. Finance Research Letters 36: 101647. [Google Scholar] [CrossRef] [PubMed]
- Podobnik, Boris, and H. Eugene Stanley. 2008. Detrended Cross-Correlation Analysis: A New Method for Analyzing Two Nonstationary Time Series. Physical Review Letters 100: 084102. [Google Scholar] [CrossRef] [PubMed]
- Rizvi, Syed Aun R., and Shaista Arshad. 2017. Analysis of the efficiency–integration nexus of Japanese stock market. Physica A: Statistical Mechanics and its Applications 470: 296–308. [Google Scholar] [CrossRef]
- Rizvi, Syed Aun R., and Shaista Arshad. 2016. How does crisis affect efficiency? An empirical study of East Asian markets. Borsa Istanbul Review 16: 1–8. [Google Scholar] [CrossRef]
- Rizvi, Syed Aun R., and Shaista Arshad. 2014. Investigating the efficiency of East Asian stock markets through booms and busts. Pacific Science Review 16: 275–79. [Google Scholar] [CrossRef]
- Rizvi, Syed Aun R., Ginanjar Dewandaru, Obiyathulla I. Bacha, and Mansur Masih. 2014. An analysis of stock market efficiency: Developed vs. Islamic stock markets using MF-DFA. Physica A: Statistical Mechanics and its Applications 407: 86–99. [Google Scholar] [CrossRef]
- Saâdaoui, Foued. 2023. Skewed multifractal scaling of stock markets during the COVID-19 pandemic. Chaos, Solitons & Fractals 170: 113372. [Google Scholar]
- Salisu, Afees A., Abdulsalam Abidemi Sikiru, and Xuan Vinh Vo. 2020. Pandemics and the emerging stock markets. Borsa Istanbul Review 20: S40–S48. [Google Scholar] [CrossRef]
- Salisu, Afees A., and Xuan Vinh Vo. 2020. Predicting stock returns in the presence of COVID-19 pandemic: The role of health news. International Review of Financial Analysis 71: 101546. [Google Scholar] [CrossRef] [PubMed]
- San José Martínez, Fernando, Carlos García-Gutiérrez Báez, Francisco Javier Caniego Monreal, and Fernando Peregrina. 2021. Long-range correlations of soil water content time series under tillage and different cover crops in a semi-arid vineyard. European Journal of Soil Science 72: 623–34. [Google Scholar] [CrossRef]
- Schneider, Gerald, and Vera E. Troeger. 2006. War and the world economy: Stock market reactions to international conflicts. Journal of Conflict Resolution 50: 623–45. [Google Scholar] [CrossRef]
- Sezgin Alp, Ozge, Bilge Canbaloglu, and Gozde Gurgun. 2022. Stock liquidity, stock price crash risk, and foreign ownership. Borsa Istanbul Review 22: 477–86. [Google Scholar] [CrossRef]
- Shadkhoo, Shahriar, and Gholamzera Jafari. 2009. Multifractal detrended cross-correlation analysis of temporal and spatial seismic data. The European Physical Journal B 72: 679. [Google Scholar] [CrossRef]
- Shahzad, Syed Jawad Hussain, Elie Bouri, Ghulam Mujtaba Kayani, Rana Muhammad Nasir, and Ladislav Kristoufek. 2020. Are clean energy stocks efficient? Asymmetric multifractal scaling behaviour. Physica A: Statistical Mechanics and Its Applications 550: 124519. [Google Scholar] [CrossRef]
- Sornette, Didier. 2003. Why Stock Markets Crash Critical Events in Complex Financial Systems. Princeton: Princeton University Press. [Google Scholar]
- Sun, Limei, Meiqi Xiang, and Qing Shen. 2020. A comparative study on the volatility of EU and China’s carbon emission permits trading markets. Physica A: Statistical Mechanics and Its Applications 560: 125037. [Google Scholar] [CrossRef]
- Tiwari, Aviral Kumar, Goodness C. Aye, and Rangan Gupta. 2019. Stock market efficiency analysis using long spans of Data: A multifractal detrended fluctuation approach. Finance Research Letters 28: 398–411. [Google Scholar] [CrossRef]
- Wang, Lei, and Lutao Liu. 2020. Long-range correlation and predictability of Chinese stock prices. Physica A: Statistical Mechanics and Its Applications 549: 124384. [Google Scholar] [CrossRef]
- Wang, Wanting, Kecheng Liu, and Zheng Qin. 2014. Multifractal Analysis on the Return Series of Stock Markets Using MF-DFA Method. Paper presented at the 15th IFIP WG 8.1 International Conference on Informatics and Semiotics in Organisations, ICISO 2014, Shanghai, China, 23–24 May; Berlin and Heidelberg: Springer. [Google Scholar]
- Wang, Xiaoquan, Xinyue Wang, Zheng Zhong, and Junnan Yao. 2021. The impact of US–China trade war on Chinese firms: Evidence from stock market reactions. Applied Economics Letters 28: 579–83. [Google Scholar] [CrossRef]
- Wang, Yudong, Li Liu, and Rongbao Gu. 2009. Analysis of efficiency for Shenzhen stock market based on multifractal detrended fluctuation analysis. International Review of Financial Analysis 18: 271–76. [Google Scholar] [CrossRef]
- Wu, Wenmin, Chien-Chiang Lee, Wenwu Xing, and Shan-Ju Ho. 2021. The impact of the COVID-19 outbreak on Chinese-listed tourism stocks. Financial Innovation 7: 22. [Google Scholar] [CrossRef] [PubMed]
- Xu, Nan, Songsong Li, and Xiaofeng Hui. 2021. Multifractal Analysis of COVID-19’s Impact on China’s Stock Market. Fractals 29: 2150213. [Google Scholar] [CrossRef]
- Yang, Haizhen, Fangfang Shi, Jie Wang, and Zhongbo Jing. 2019. Investigating the relationship between financial liberalization and capital flow waves: A panel data analysis. International Review of Economics & Finance 59: 120–36. [Google Scholar] [CrossRef]
- Zaremba, Adam, Nusret Cakici, Ender Demir, and Huaigang Long. 2022. When bad news is good news: Geopolitical risk and the cross-section of emerging market stock returns. Journal of Financial Stability 58: 100964. [Google Scholar] [CrossRef]
- Zhang, Chen, Xiaofeng Wang, Shengbing Chen, Le Zou, Xin Zhang, and Chao Tang. 2019a. A study on daily PM2.5 concentrations in Hong Kong using the EMD-based MFDFA method. Physica A: Statistical Mechanics and Its Applications 530: 121182. [Google Scholar] [CrossRef]
- Zhang, Qiang, Chong-Yu Xu, Yongqin David Chen, and Zuguo Yu. 2008. Multifractal detrended fluctuation analysis of streamflow series of the Yangtze River basin, China. Hydrological Processes 22: 4997–5003. [Google Scholar] [CrossRef]
- Zhang, Xike, Gui Zhang, Luo Qiu, Bo Zhang, Yurong Sun, Zifan Gui, and Qiuwen Zhang. 2019b. A Modified Multifractal Detrended Fluctuation Analysis (MFDFA) Approach for Multifractal Analysis of Precipitation in Dongting Lake Basin, China. Water 11: 891. [Google Scholar] [CrossRef]
- Zhu, Huijian, and Weiguo Zhang. 2018. Multifractal property of Chinese stock market in the CSI 800 index based on MF-DFA approach. Physica A: Statistical Mechanics and Its Applications 490: 497–503. [Google Scholar] [CrossRef]
- Zou, Shaohui, and Tian Zhang. 2019. Multifractal Detrended Cross-Correlation Analysis of Electricity and Carbon Markets in China. Mathematical Problems in Engineering 2019: 9350940. [Google Scholar] [CrossRef]
- Zunino, Luciano, Alejandra Figliola, Benjamin M. Tabak, Darío G. Pérez, Mario Garavaglia, and Osvaldo A. Rosso. 2009. Multifractal structure in Latin-American market indices. Chaos, Solitons & Fractals 41: 2331–40. [Google Scholar] [CrossRef]

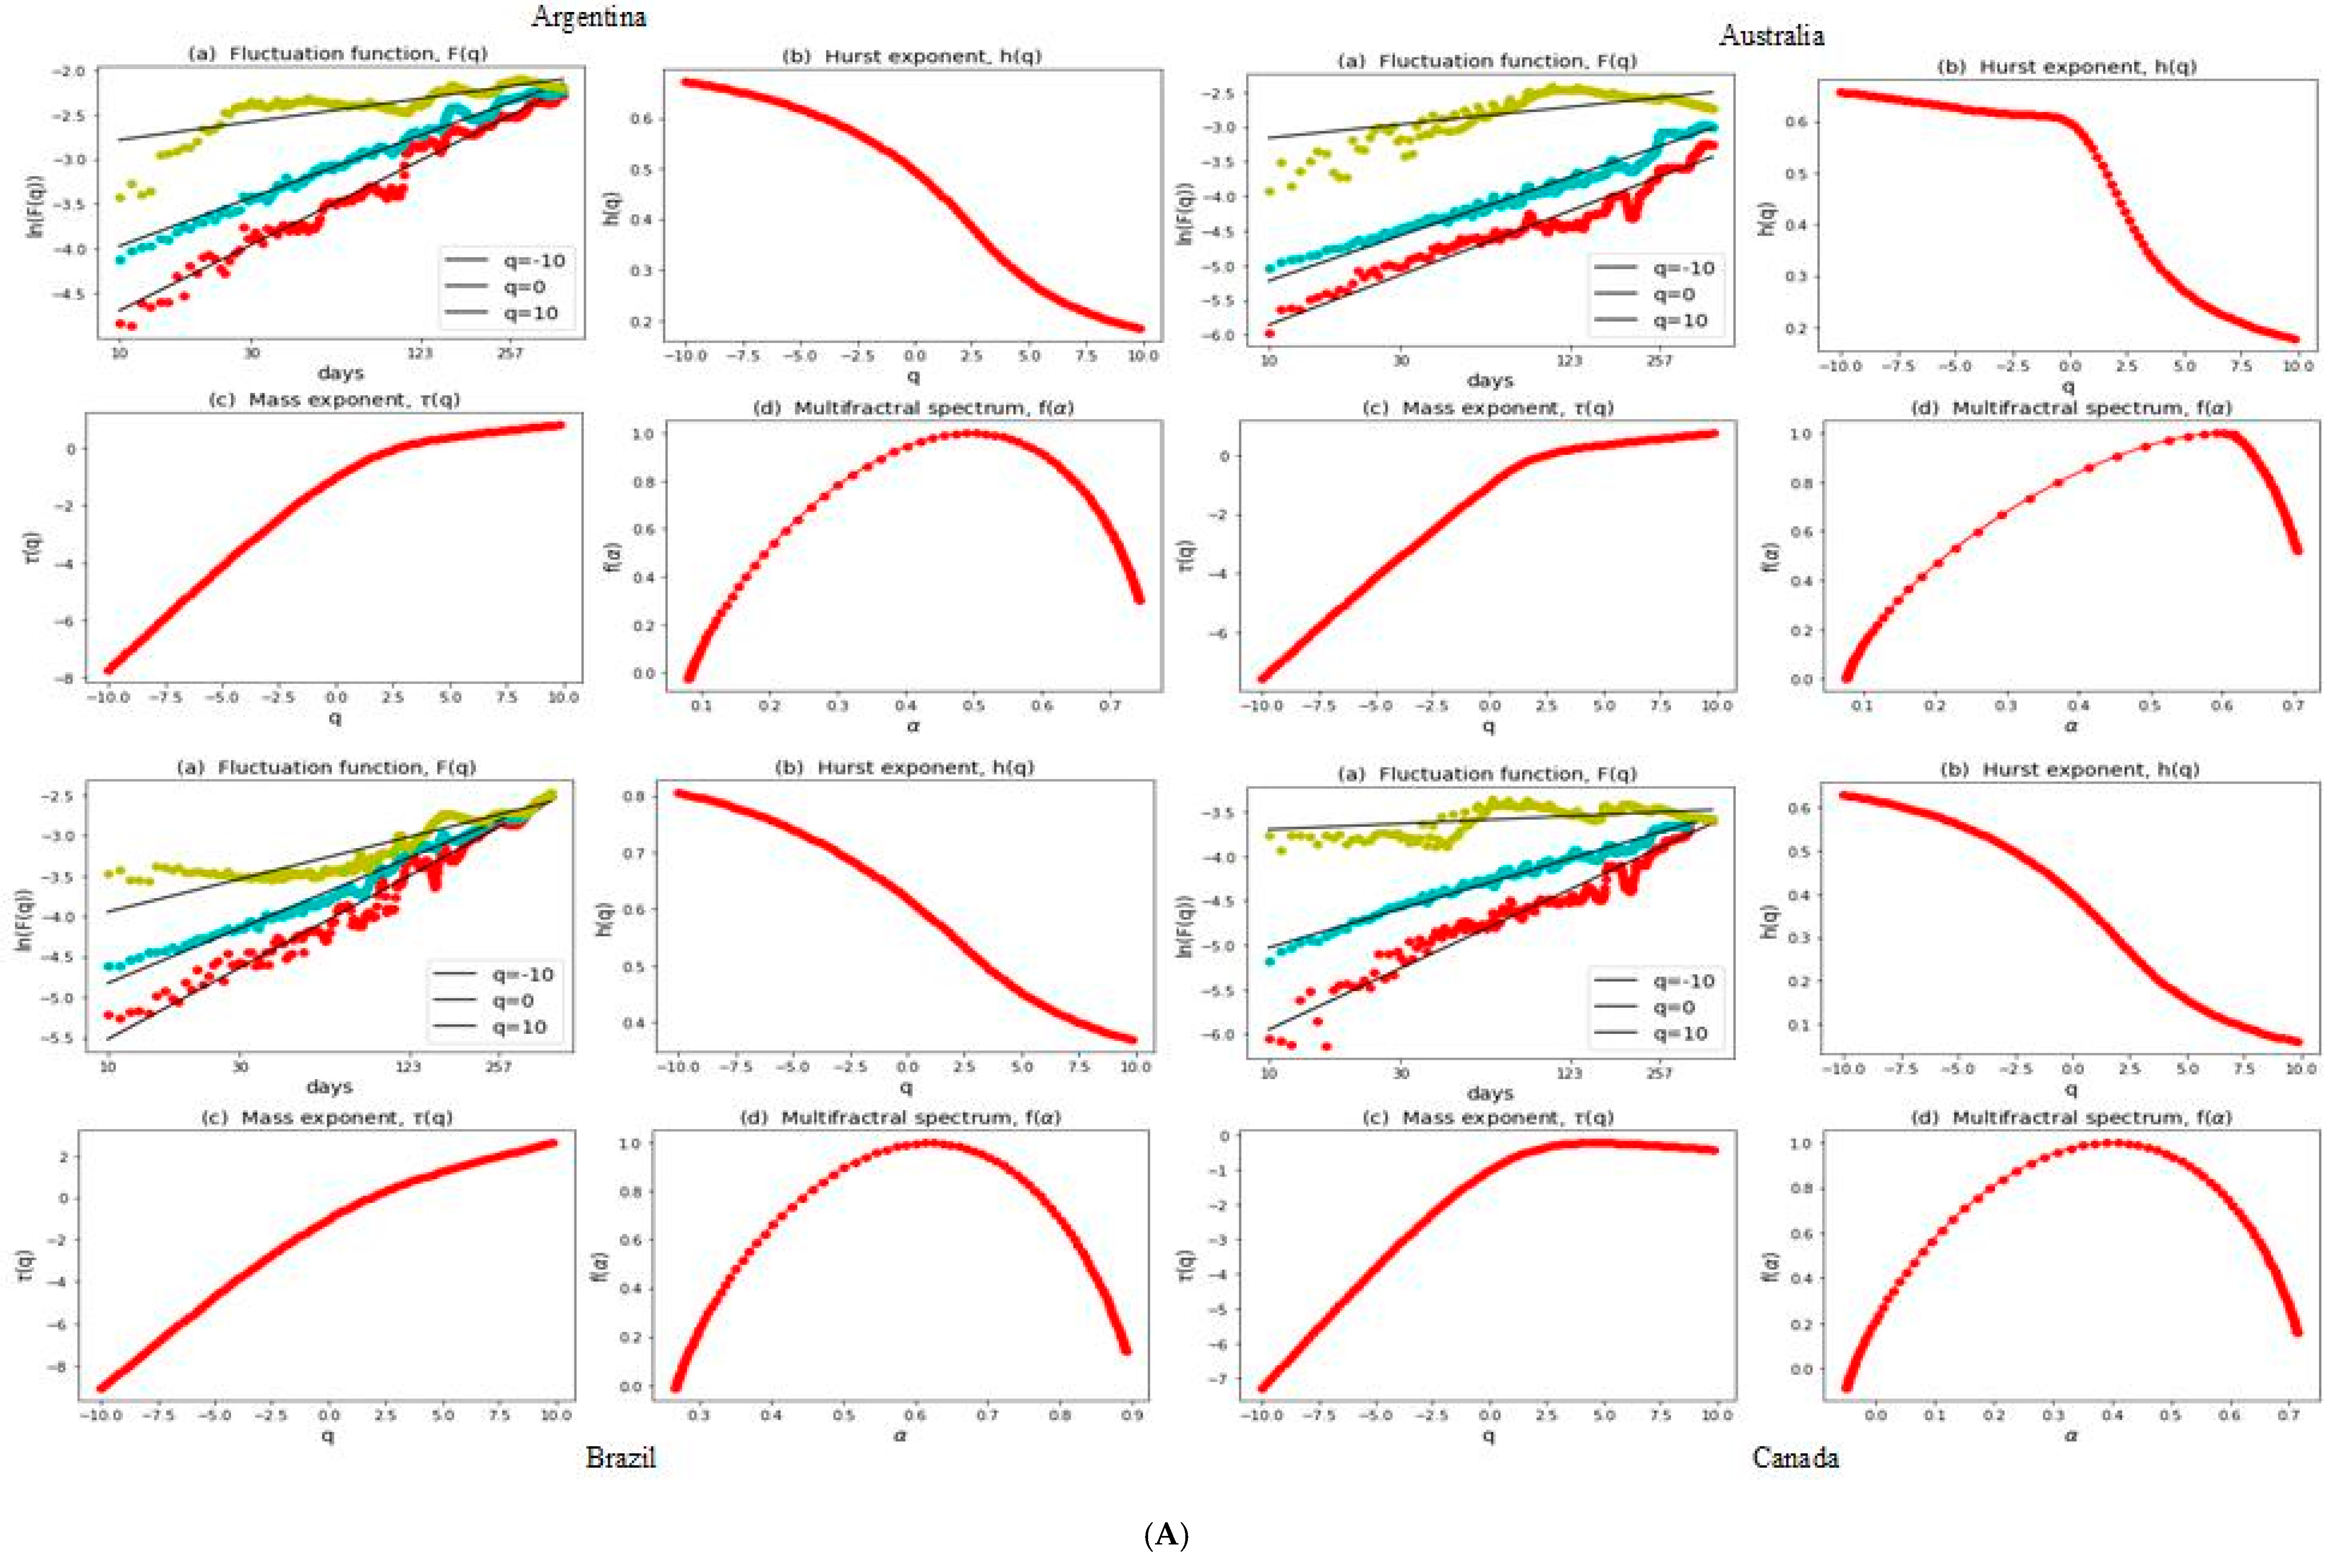
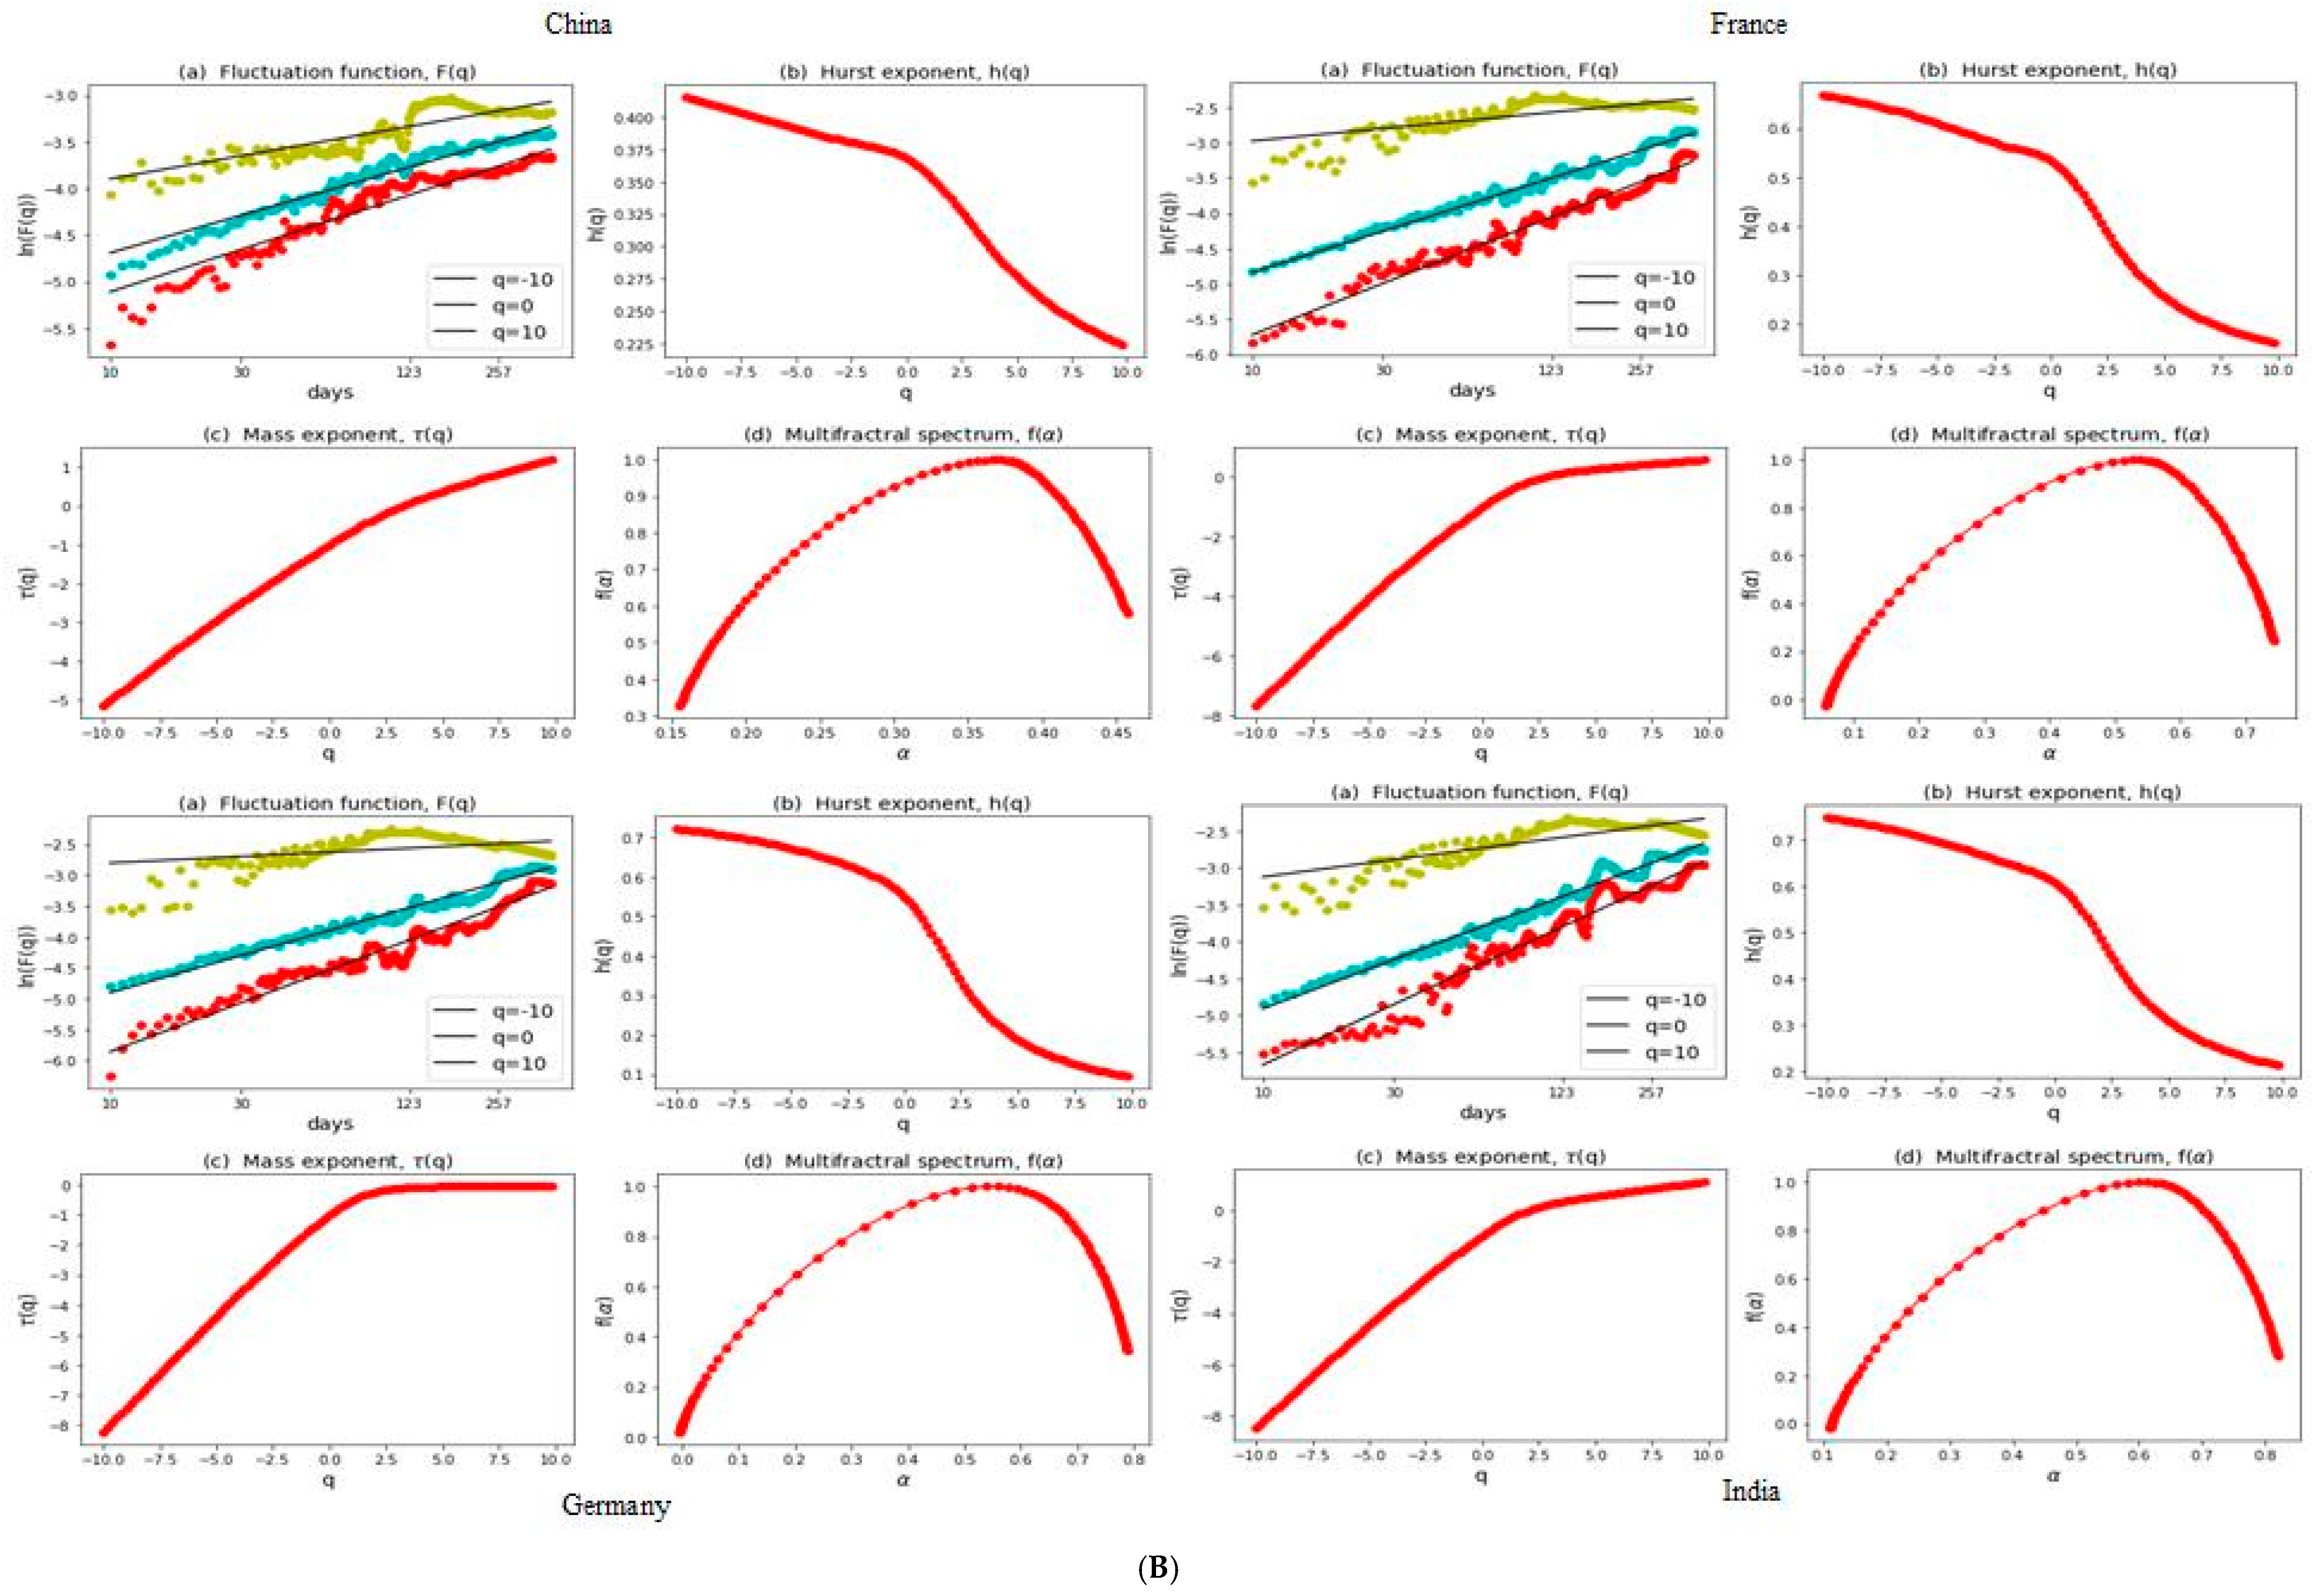

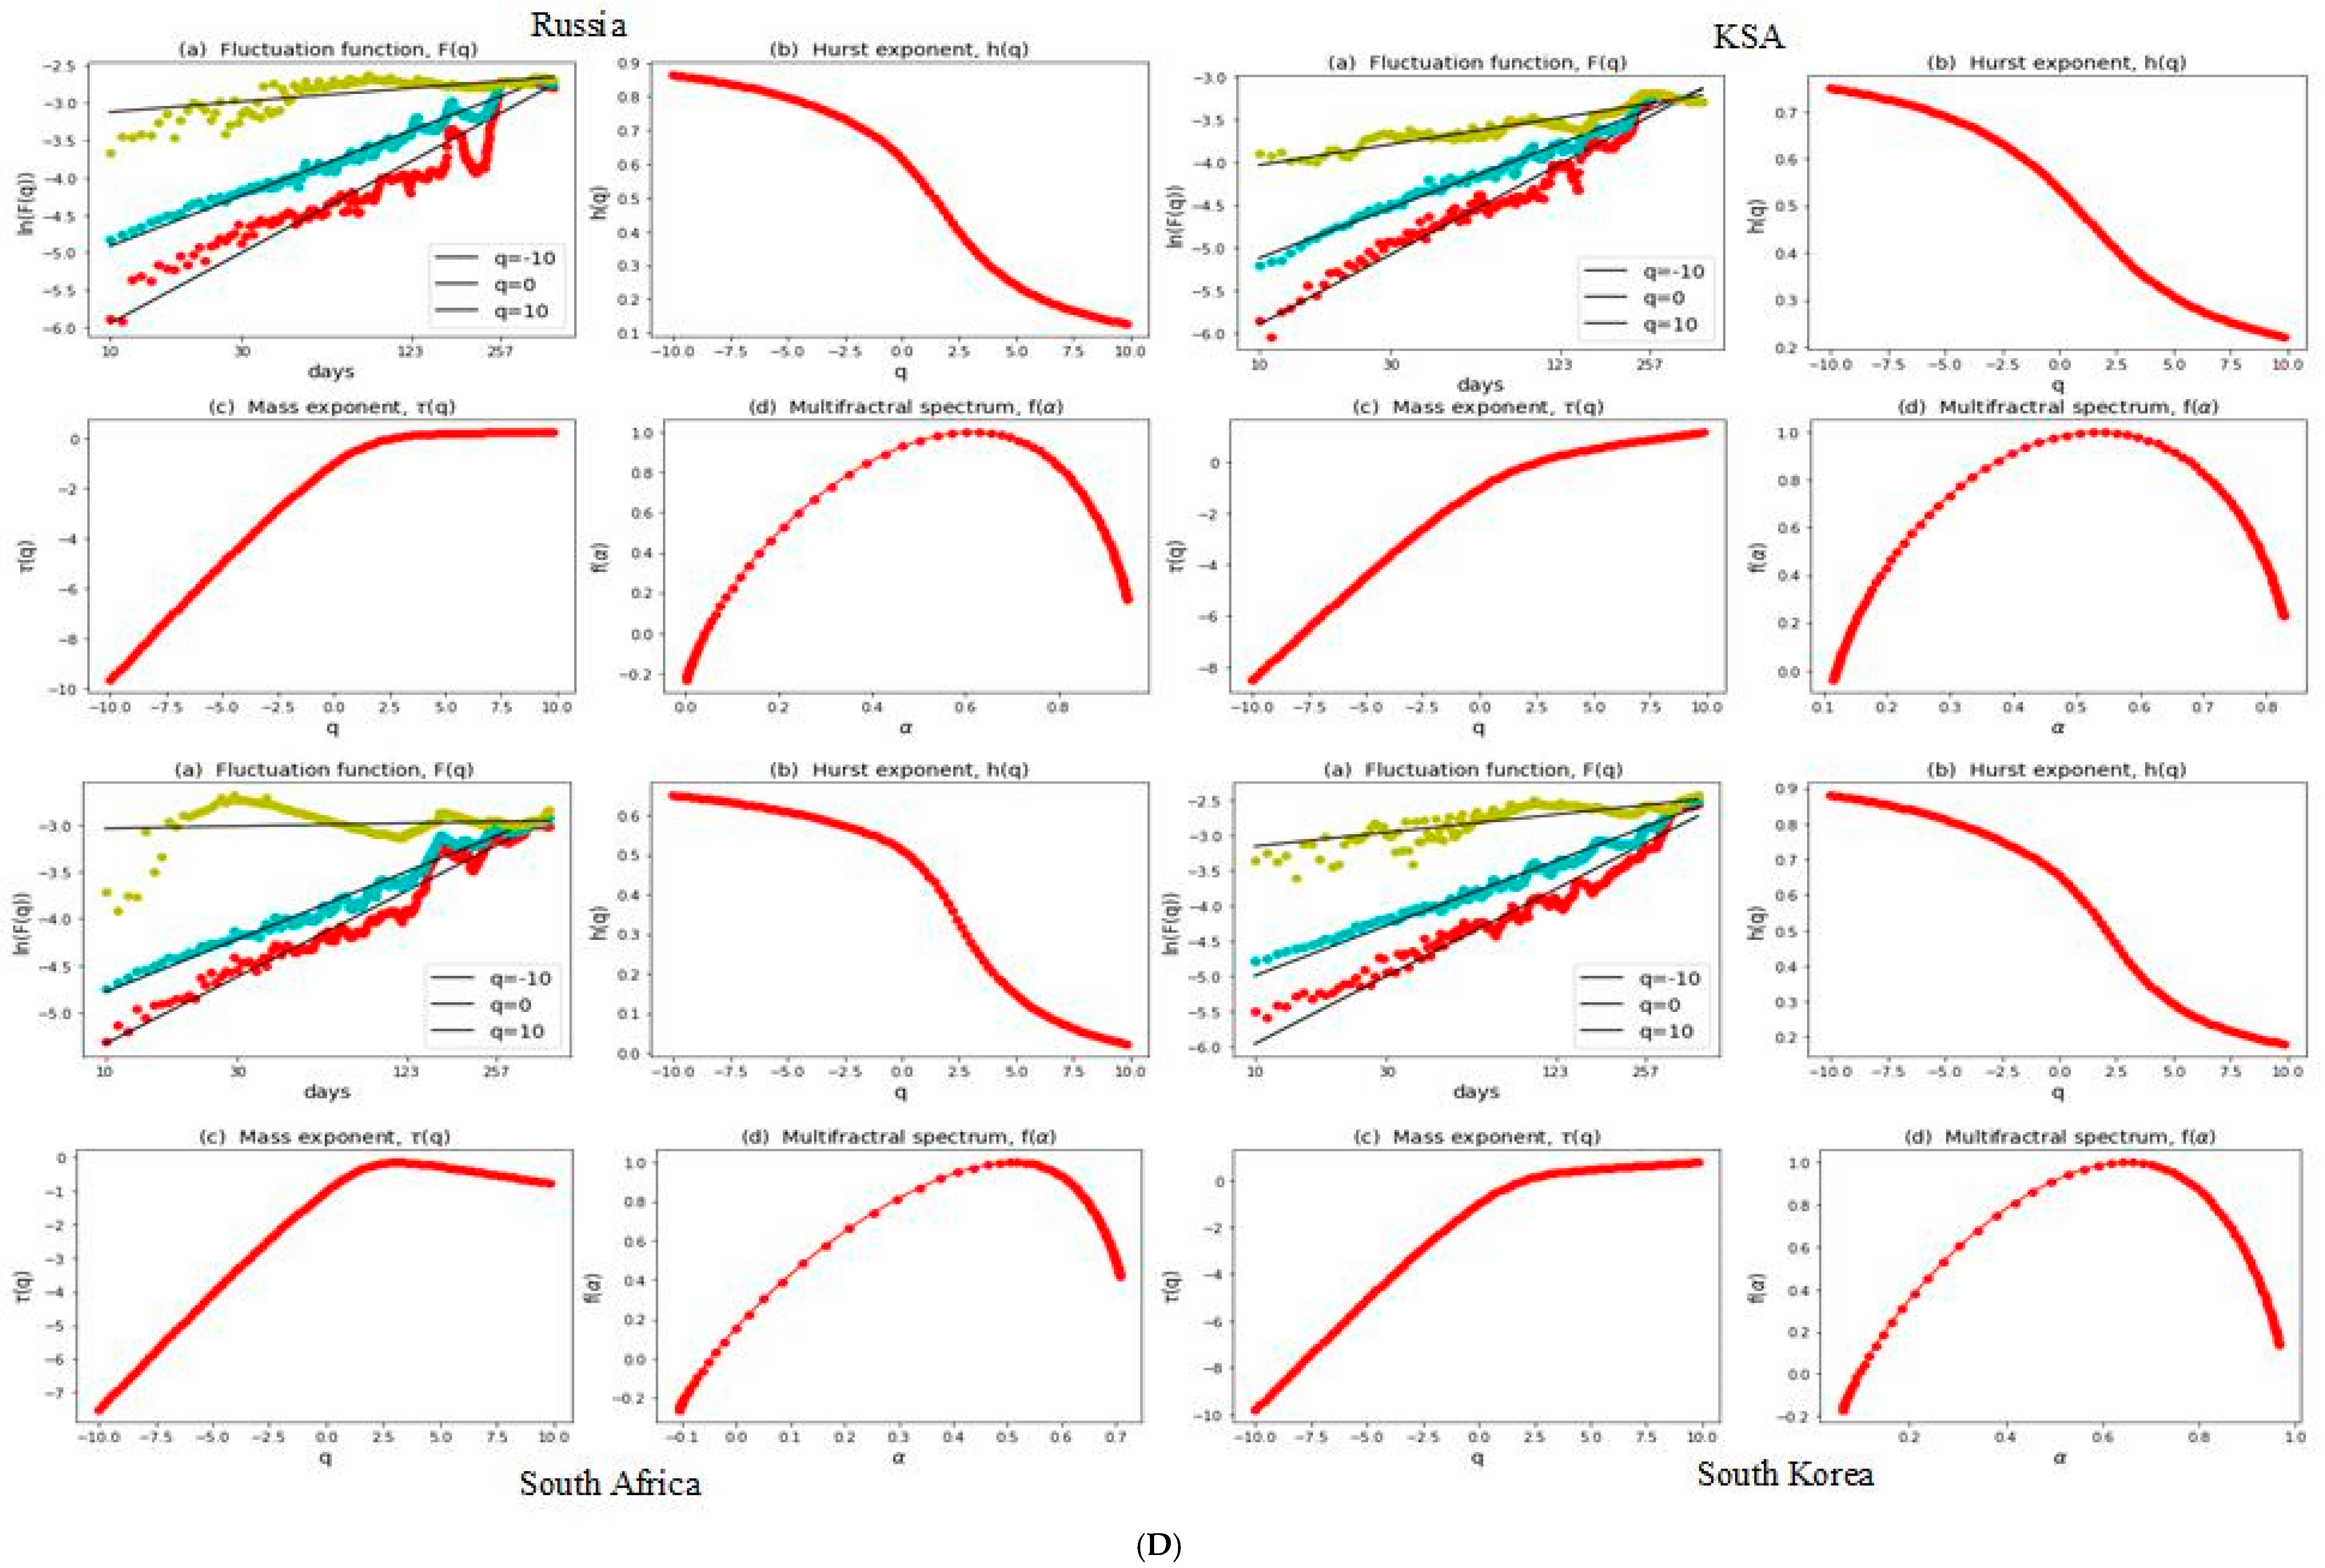
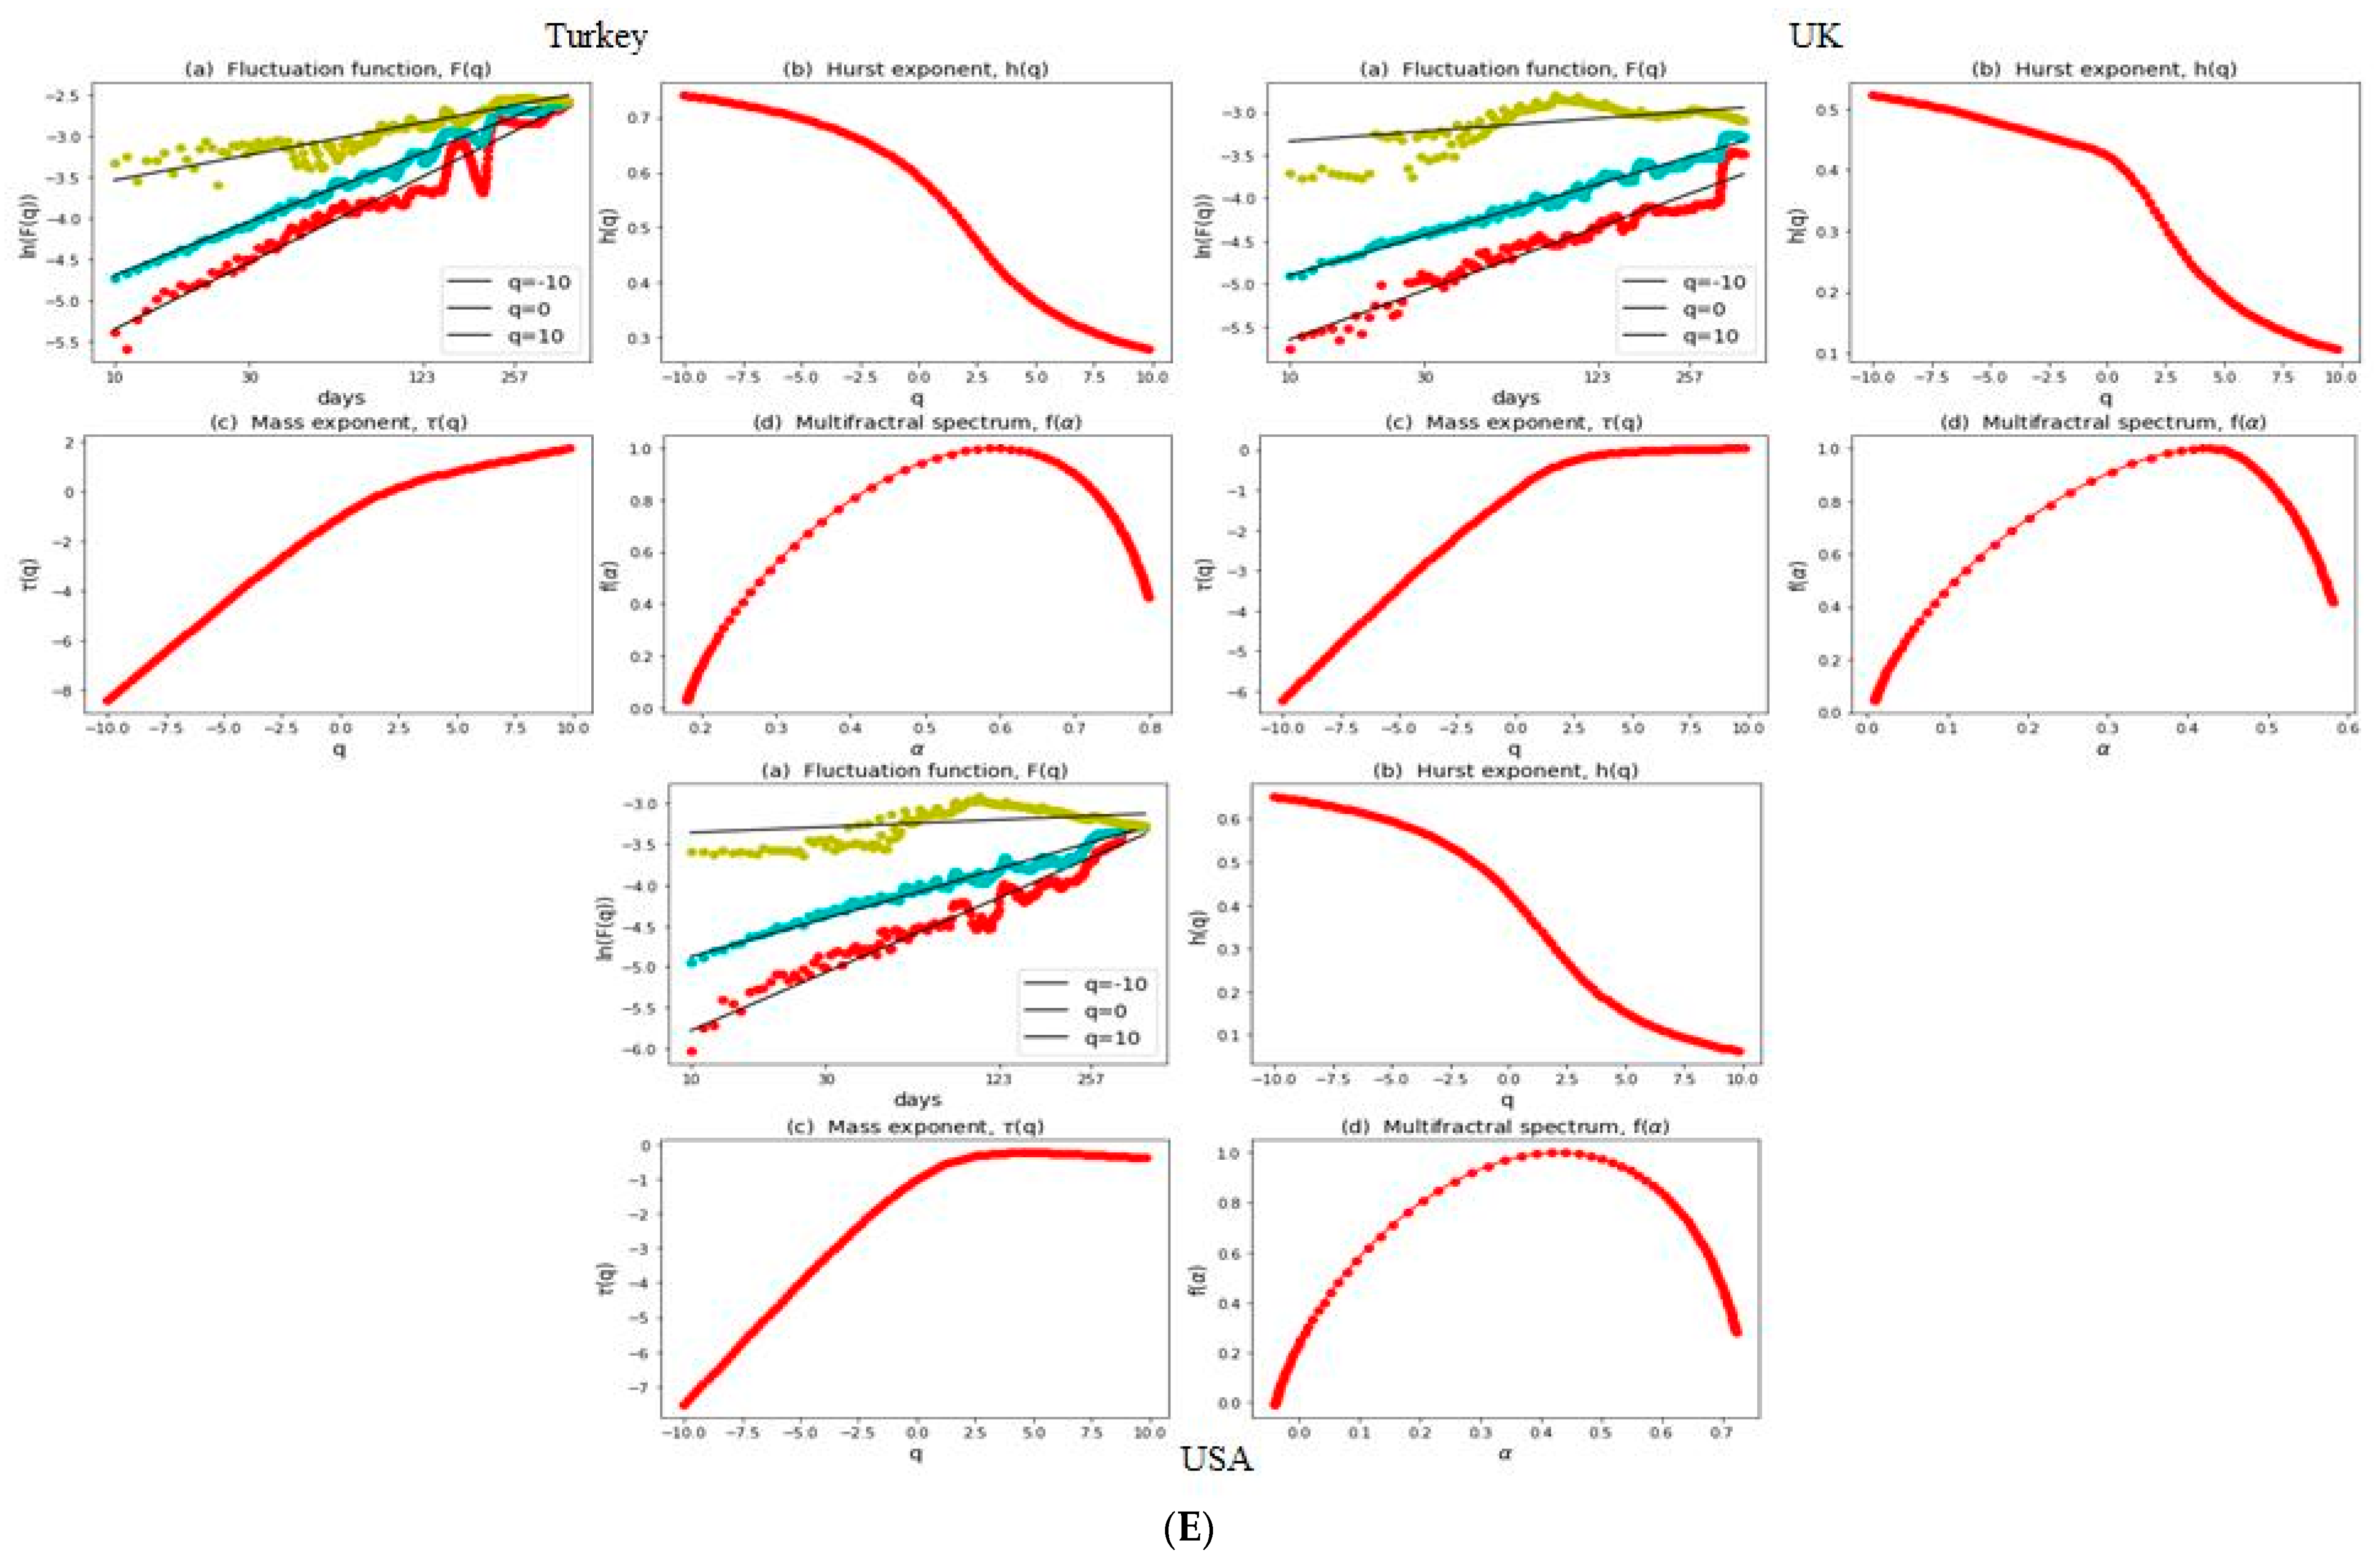


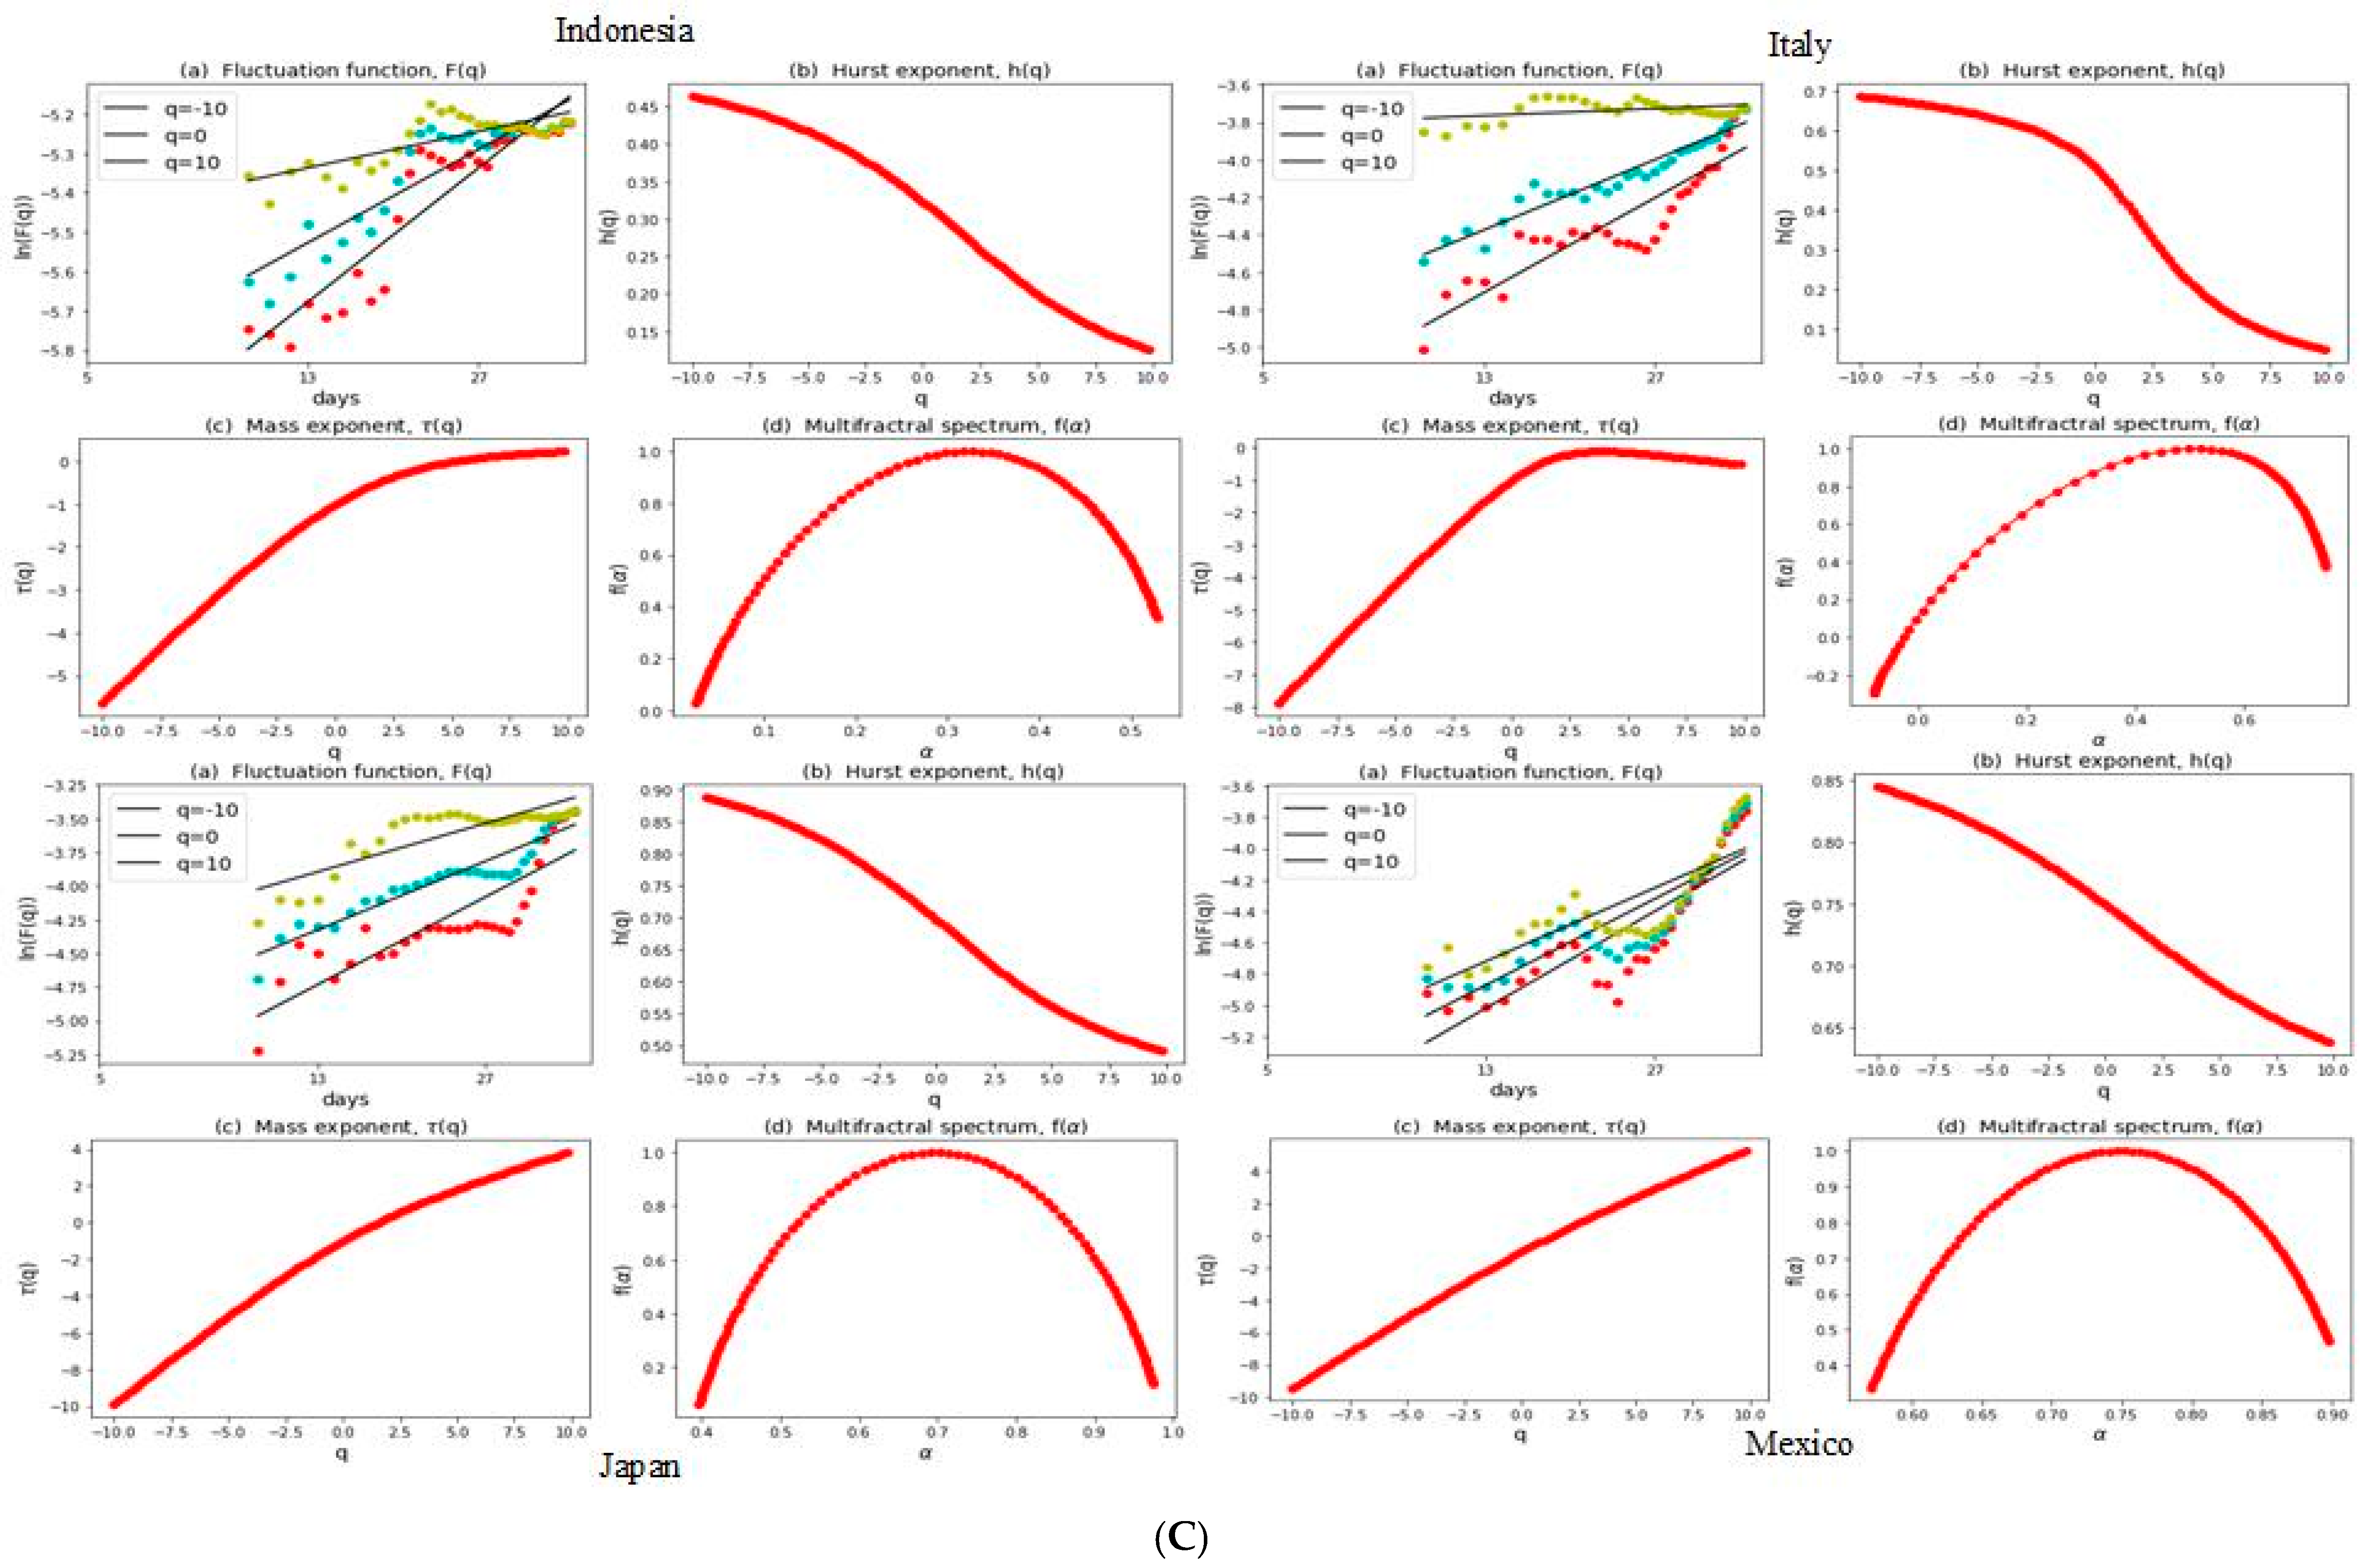
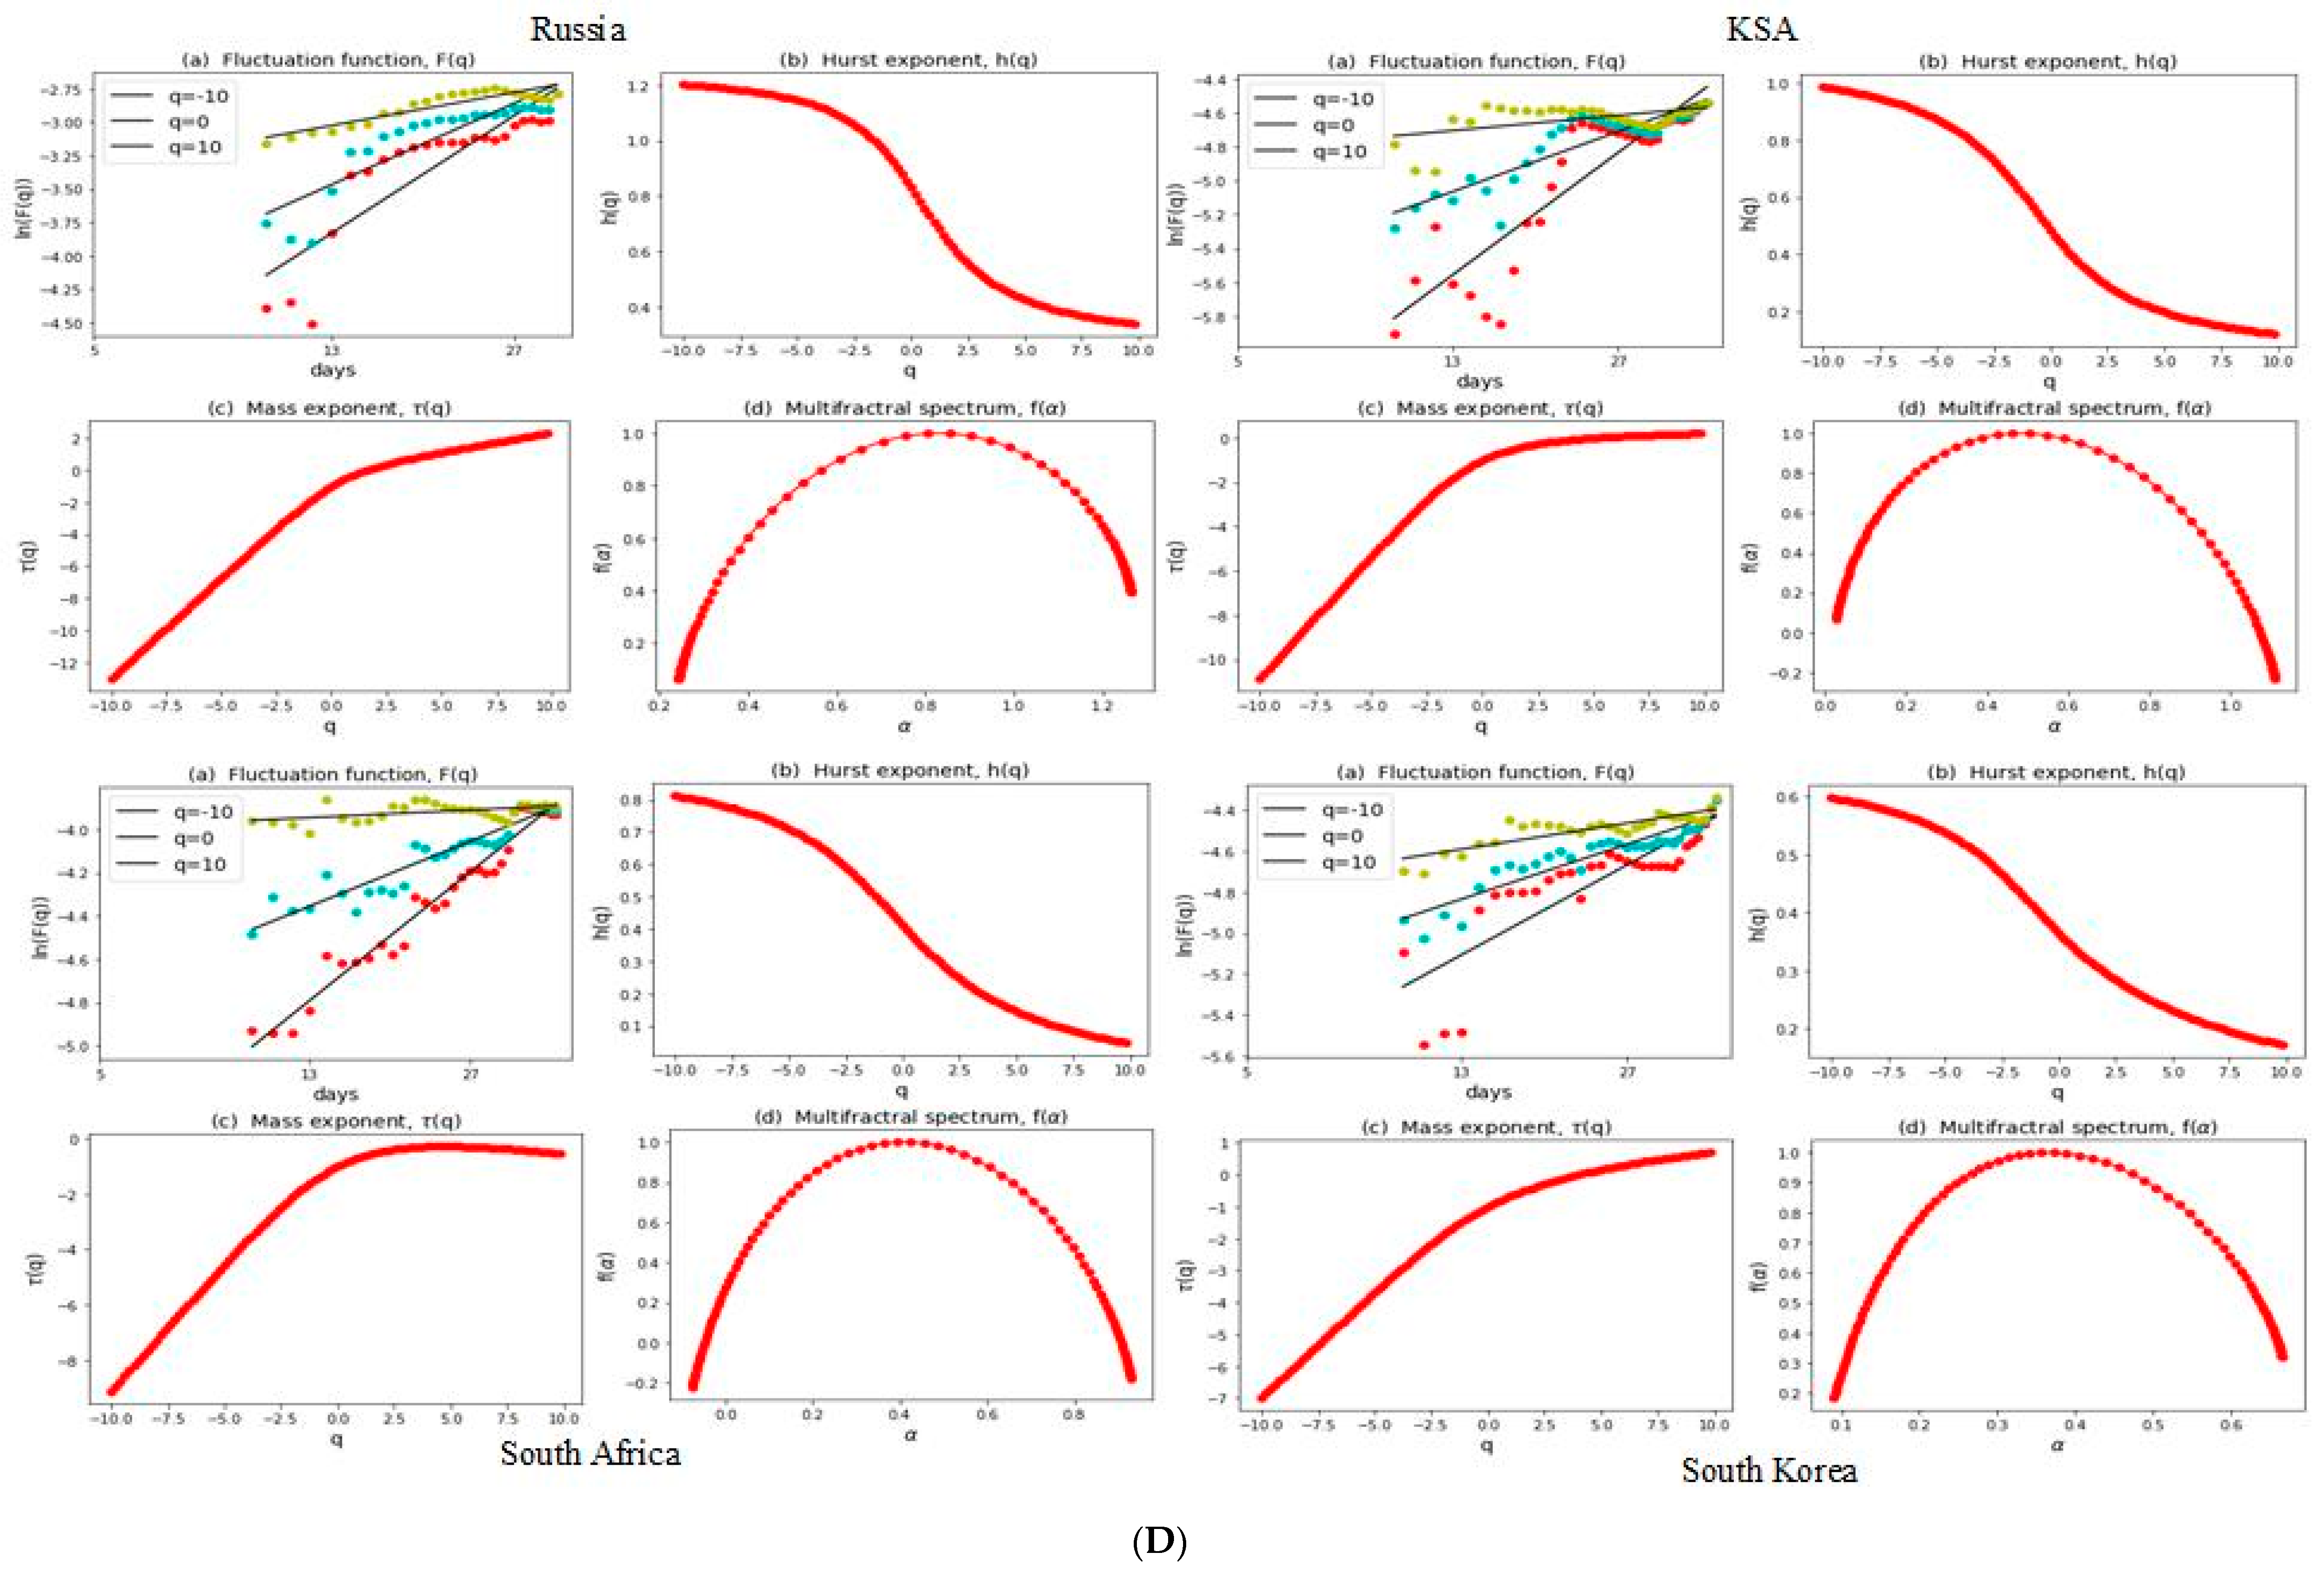
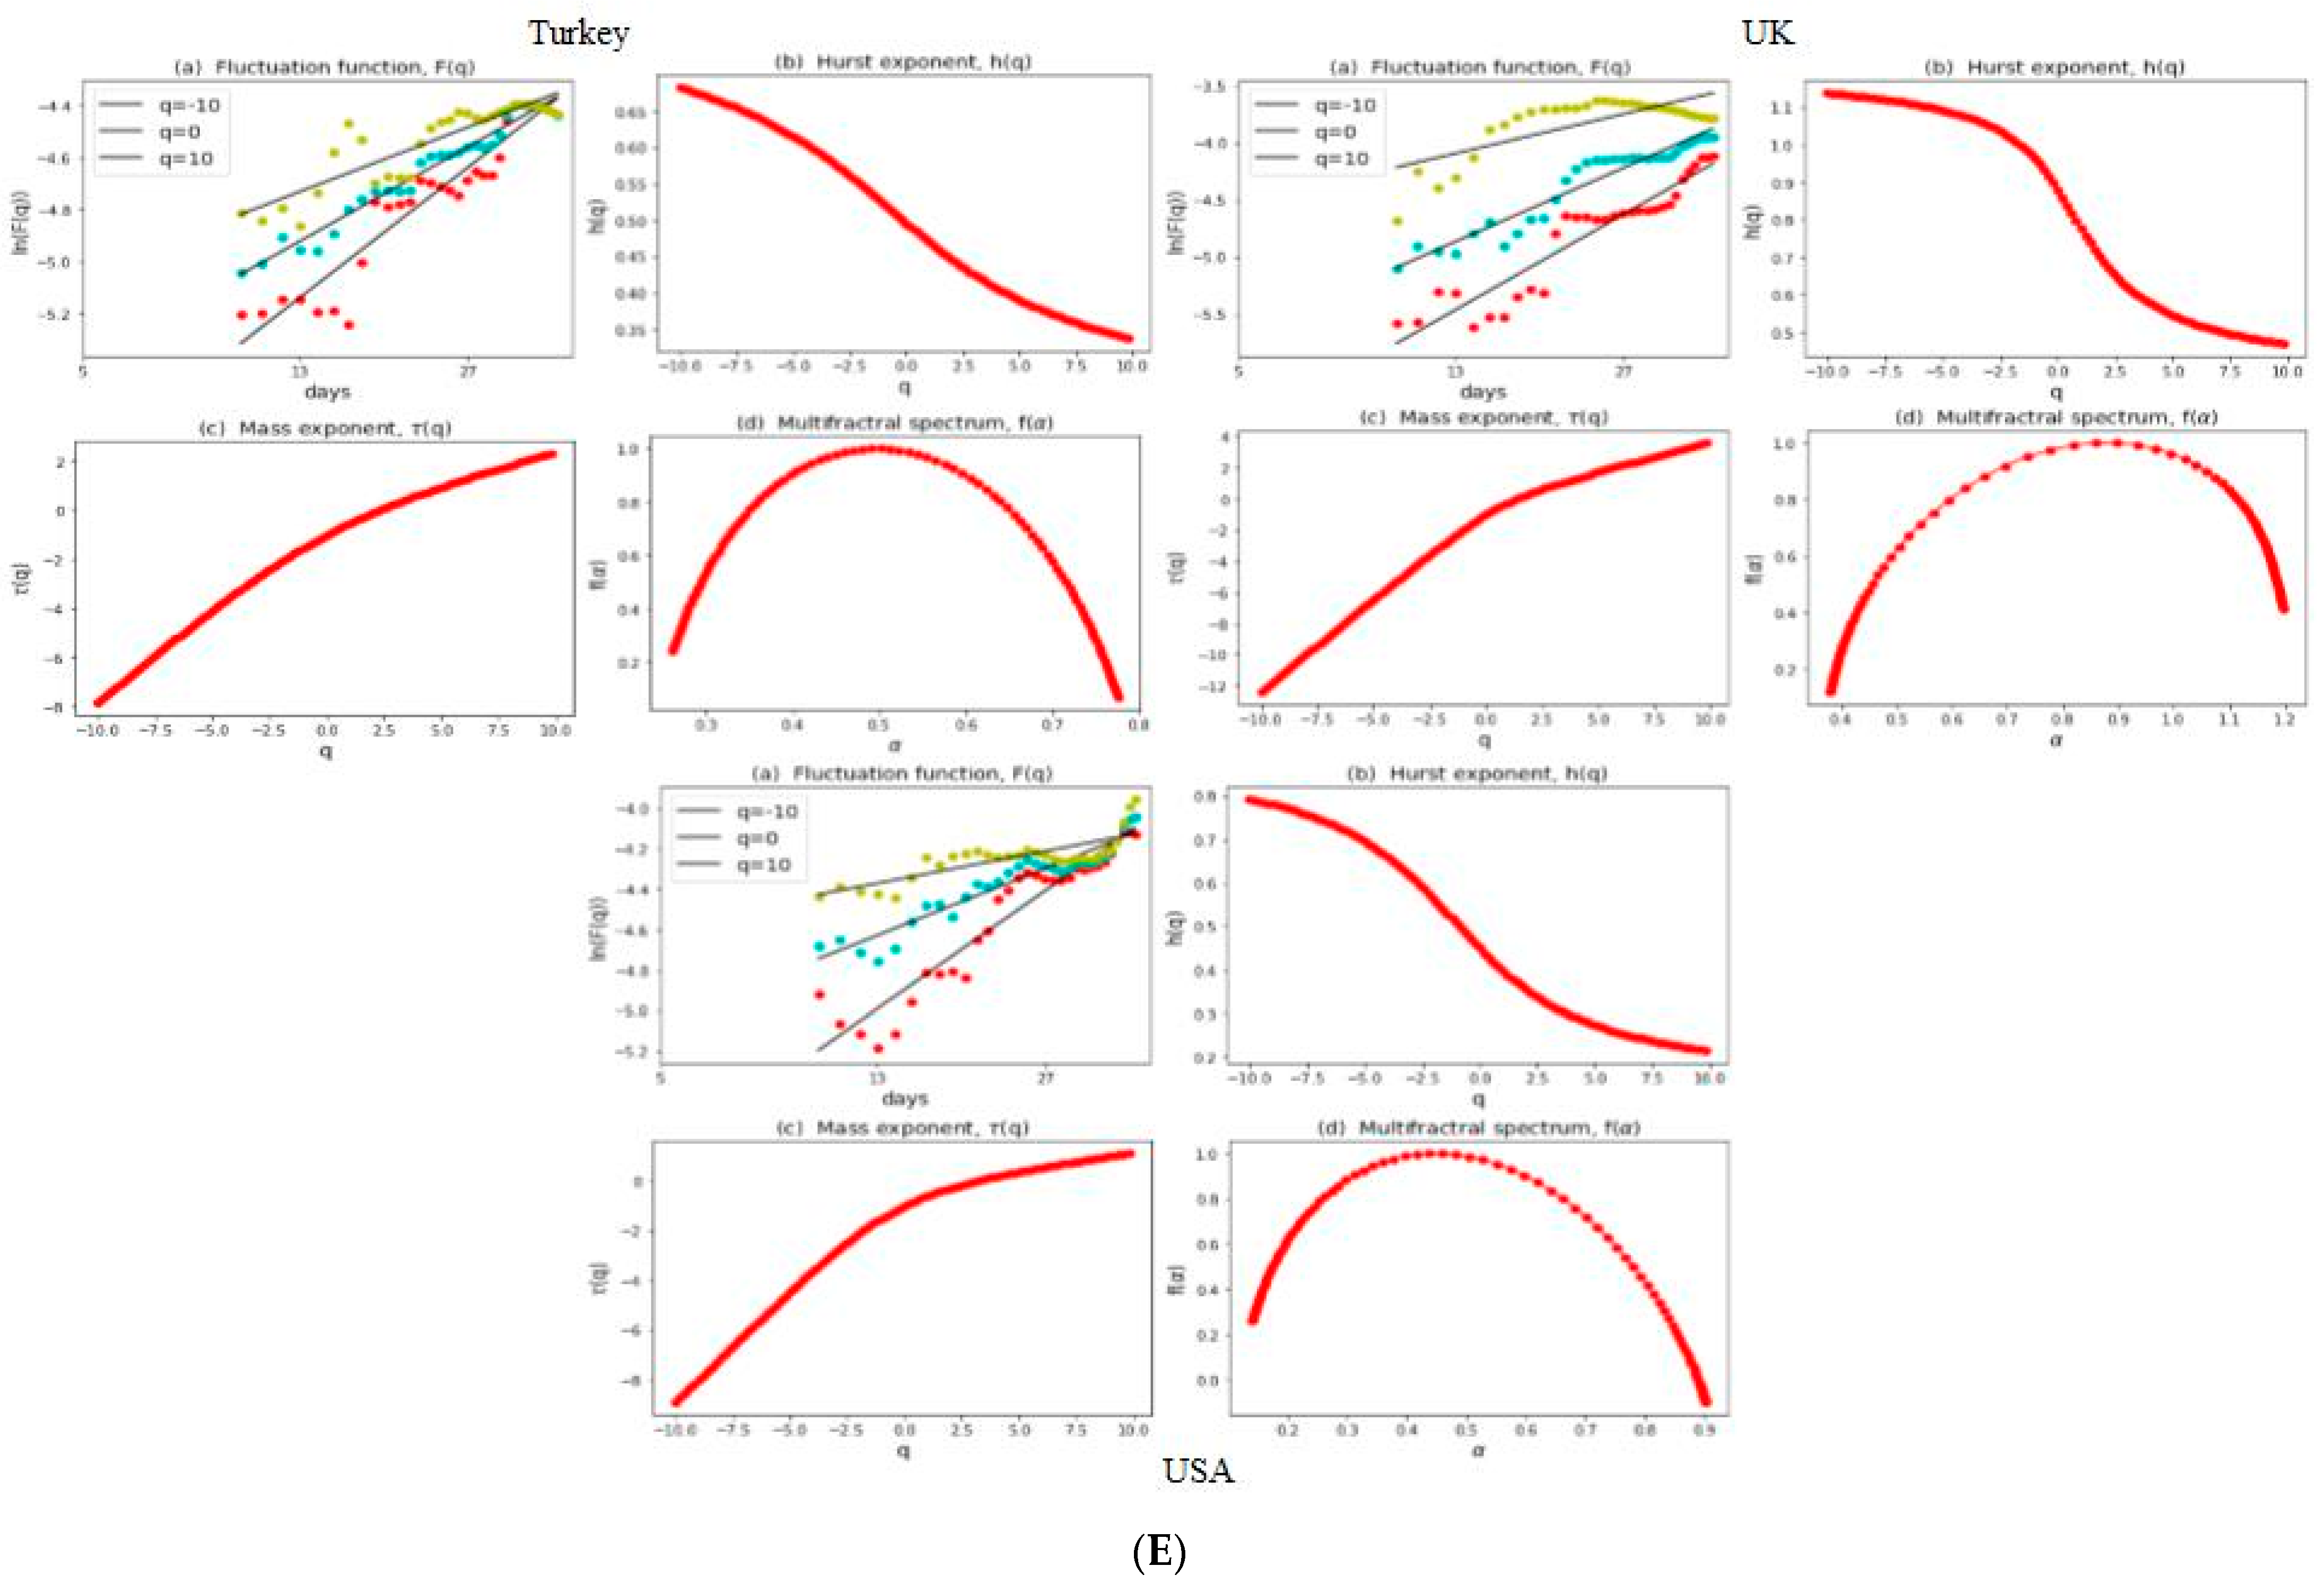
| S. No. | Country | Stock Index | MSCI Classification | Starting Date | Observations |
|---|---|---|---|---|---|
| 1 | Brazil | IBOVESPA | Emerging Markets | 5 January 1998 | 6019 |
| 2 | France | CAC 40 | Developed Markets | 5 January 1998 | 6213 |
| 3 | Germany | DAX PERFORMANCE-INDEX | Developed Markets | 5 January 1988 | 8677 |
| 4 | Canada | S&P/TSX Composite index | Developed Markets | 5 January 1988 | 8638 |
| 5 | Indonesia | Jakarta Composite Index | Emerging Markets | 4 January 1994 | 6912 |
| 6 | South Korea | KOSPI | Emerging Markets | 6 January 1998 | 6003 |
| 7 | Argentina | MERVAL | Emerging Markets | 2 January 1998 | 5954 |
| 8 | Mexico | IPC MEXICO | Emerging Markets | 4 January 1994 | 7107 |
| 9 | Japan | Nikkei 225 | Developed Markets | 6 January 1981 | 10,166 |
| 10 | China | SSE Composite Index | Emerging Markets | 3 July 1997 | 6016 |
| 11 | Turkey | BIST 100 | Emerging Markets | 3 January 2002 | 6207 |
| 12 | USA | Dow Jones Industrial Average | Developed Markets | 7 December 1999 | 5644 |
| 13 | Italy | FTSE MIB | Developed Markets | 14 January 2003 | 4846 |
| 14 | UK | FTSE 100 | Developed Markets | 4 January 2001 | 5395 |
| 15 | Russia | MOEX | Emerging Markets | 10 March 2009 | 2248 |
| 16 | South Africa | JSE Top 40 | Emerging Markets | 3 January 2007 | 5592 |
| 17 | India | S&P BSE Sensex | Emerging Markets | 4 January 2000 | 5535 |
| 18 | Australia | S&P/ASX 200 | Developed Markets | 5 January 2000 | 5654 |
| 19 | Saudi Arabia | TASI | Emerging Markets | 15 January 2000 | 5879 |
| S. No. | Country | COVID-19 | Russia–Ukraine War | |
|---|---|---|---|---|
| Observations | 1st Case | Observations | ||
| 1 | Brazil | 489 | 27 February 2020 | 49 |
| 2 | France | 537 | 24 January 2020 | 50 |
| 3 | Germany | 530 | 27 January 2020 | 50 |
| 4 | Canada | 518 | 26 January 2020 | 52 |
| 5 | Indonesia | 484 | 2 March 2020 | 43 |
| 6 | South Korea | 516 | 22 January 2020 | 50 |
| 7 | Argentina | 482 | 3 March2020 | 48 |
| 8 | Mexico | 502 | 28 February 2020 | 50 |
| 9 | Japan | 510 | 22 January 2020 | 48 |
| 10 | China | 519 | 31 December 2019 | 48 |
| 11 | Turkey | 486 | 11 March 2020 | 48 |
| 12 | USA | 524 | 22 January 2020 | 52 |
| 13 | Italy | 527 | 31 January 2020 | 50 |
| 14 | UK | 524 | 31 January 2020 | 48 |
| 15 | Russia | 519 | 31 January 2020 | 33 |
| 16 | South Africa | 495 | 5 March 2020 | 48 |
| 17 | India | 516 | 30 January 2020 | 48 |
| 18 | Australia | 528 | 26 January 2020 | 50 |
| 19 | Saudi Arabia | 493 | 2 March 2020 | 48 |
| Developed Markets | Emerging Markets | ||||||||||||||||||
|---|---|---|---|---|---|---|---|---|---|---|---|---|---|---|---|---|---|---|---|
| Statistics | Australia | Canada | France | Germany | Italy | Japan | UK | USA | Argentina | Brazil | China | India | Indonesia | Mexico | Russia | Saudi Arabia | South Africa | South Korea | Turkey |
| Overall Period | |||||||||||||||||||
| Mean | 0.00016 | 0.00022 | 0.00013 | 0.00033 | −0.00001 | 0.00014 | 0.00003 | 0.00020 | 0.00079 | 0.00043 | 0.00019 | 0.00043 | 0.00035 | 0.00044 | 0.00055 | 0.00029 | 0.00026 | 0.00036 | 0.00047 |
| Maximum | 0.06765 | 0.11295 | 0.10595 | 0.10797 | 0.10874 | 0.13235 | 0.09384 | 0.10764 | 0.16117 | 0.28832 | 0.09401 | 0.15990 | 0.13128 | 0.12154 | 0.08527 | 0.09391 | 0.09057 | 0.11284 | 0.12128 |
| Minimum | −0.10203 | −0.13176 | −0.13098 | −0.14091 | −0.18541 | −0.16135 | −0.11512 | −0.13842 | −0.47692 | −0.17208 | −0.09256 | −0.14102 | −0.12732 | −0.14314 | −0.11419 | −0.10328 | −0.10450 | −0.12805 | −0.13336 |
| Std. Dev. | 0.01024 | 0.00997 | 0.01437 | 0.01406 | 0.01515 | 0.01387 | 0.01192 | 0.01198 | 0.02367 | 0.01979 | 0.01549 | 0.01465 | 0.01475 | 0.01441 | 0.01412 | 0.01386 | 0.01340 | 0.01657 | 0.01765 |
| Skewness | −0.72252 | −0.99786 | −0.20994 | −0.30863 | −0.71438 | −0.31815 | −0.33940 | −0.38004 | −1.67487 | 0.23511 | −0.34561 | −0.38001 | −0.19365 | 0.00320 | −0.43110 | −0.94226 | −0.21059 | −0.19484 | −0.24160 |
| Kurtosis | 8.48142 | 18.95541 | 5.98165 | 6.75656 | 11.06836 | 8.20312 | 8.31338 | 13.13340 | 32.44721 | 14.64744 | 4.99352 | 9.24214 | 9.00441 | 6.95215 | 6.67578 | 10.90441 | 5.50566 | 5.88648 | 4.82828 |
| COVID-19 Period | |||||||||||||||||||
| Mean | 0.00011 | 0.00037 | 0.00027 | 0.00036 | 0.00017 | 0.00056 | −0.00015 | 0.00037 | 0.00187 | 0.00038 | 0.00042 | 0.00069 | 0.00031 | 0.00058 | 0.00058 | 0.00117 | 0.00070 | 0.00108 | 0.00100 |
| Maximum | 0.06765 | 0.11295 | 0.08056 | 0.10414 | 0.08549 | 0.07731 | 0.08667 | 0.10764 | 0.09773 | 0.13022 | 0.05554 | 0.08595 | 0.09704 | 0.04181 | 0.07435 | 0.06831 | 0.09057 | 0.08251 | 0.05810 |
| Minimum | −0.10203 | −0.13176 | −0.13098 | −0.13055 | −0.18541 | −0.06274 | −0.11512 | −0.13842 | −0.15629 | −0.15993 | −0.08039 | −0.14102 | −0.06805 | −0.06638 | −0.08646 | −0.08685 | −0.10450 | −0.08767 | −0.10307 |
| Std. Dev. | 0.01646 | 0.01818 | 0.01790 | 0.01832 | 0.01974 | 0.01514 | 0.01647 | 0.02006 | 0.03068 | 0.02607 | 0.01213 | 0.01861 | 0.01563 | 0.01440 | 0.01489 | 0.01307 | 0.01764 | 0.01637 | 0.01609 |
| Skewness | −1.21347 | −1.57054 | −1.30610 | −0.96209 | −2.87862 | 0.10497 | −1.09657 | −0.93904 | −0.81817 | −1.58969 | −0.87744 | −1.62935 | 0.04899 | −0.56564 | −0.88221 | −2.19058 | −0.62578 | −0.23797 | −1.76801 |
| Kurtosis | 8.51725 | 20.37049 | 11.41289 | 11.30552 | 26.32322 | 4.26268 | 10.12222 | 12.78127 | 4.54731 | 12.33200 | 6.99797 | 13.50224 | 6.69740 | 2.40750 | 9.21193 | 16.89974 | 9.28752 | 5.54108 | 9.31730 |
| Russia–Ukraine War | |||||||||||||||||||
| Mean | −0.00024 | −0.00070 | −0.00114 | −0.00089 | −0.00128 | −0.00010 | −0.00226 | −0.00052 | −0.00219 | −0.00166 | −0.00312 | −0.00103 | 0.00102 | −0.00092 | 0.00334 | 0.00204 | −0.00266 | −0.00091 | 0.00544 |
| Maximum | 0.01309 | 0.01801 | 0.06883 | 0.07623 | 0.06714 | 0.03860 | 0.01603 | 0.02775 | 0.03961 | 0.02396 | 0.03424 | 0.02407 | 0.01164 | 0.02118 | 0.18262 | 0.01984 | 0.04083 | 0.02185 | 0.05312 |
| Minimum | −0.03031 | −0.03119 | −0.04019 | −0.04040 | −0.04288 | −0.02984 | −0.03955 | −0.03171 | −0.05054 | −0.02898 | −0.05268 | −0.04836 | −0.01488 | −0.02300 | −0.05016 | −0.01853 | −0.03882 | −0.02635 | −0.08517 |
| Std. Dev. | 0.00931 | 0.01000 | 0.01898 | 0.01950 | 0.01925 | 0.01540 | 0.01186 | 0.01344 | 0.01862 | −0.01295 | 0.01685 | 0.01454 | 0.00636 | 0.01087 | 0.04327 | 0.00754 | 0.01532 | 0.01041 | 0.01708 |
| Skewness | −1.08036 | −0.70804 | 0.90073 | 1.14621 | 0.52950 | 0.29886 | −1.24770 | −0.32308 | −0.18390 | −0.13115 | −0.72397 | −0.51137 | −0.43071 | 0.11286 | 2.30444 | −0.57090 | 0.08121 | −0.14914 | −2.69559 |
| Kurtosis | 1.24220 | 0.94405 | 2.82615 | 3.99206 | 2.59417 | −0.15874 | 1.79912 | −0.01733 | 0.55965 | −0.42126 | 1.44283 | 0.87097 | −0.60784 | −0.59640 | 7.82037 | 0.64723 | 0.64424 | −0.14665 | 16.79280 |
| Overall Period | Developed Markets | Emerging Markets | |||||||||||||||||
|---|---|---|---|---|---|---|---|---|---|---|---|---|---|---|---|---|---|---|---|
| Order q | Australia | Canada | France | Germany | Italy | Japan | UK | USA | Argentina | Brazil | China | India | Indonesia | Mexico | Russia | Saudi Arabia | South Africa | South Korea | Turkey |
| −10 | 0.627 | 0.642 | 0.635 | 0.619 | 0.720 | 0.737 | 0.631 | 0.610 | 0.772 | 0.630 | 0.747 | 0.615 | 0.744 | 0.654 | 0.492 | 0.798 | 0.604 | 0.661 | 0.541 |
| −8 | 0.613 | 0.630 | 0.620 | 0.608 | 0.702 | 0.719 | 0.618 | 0.595 | 0.755 | 0.616 | 0.728 | 0.599 | 0.726 | 0.640 | 0.479 | 0.781 | 0.590 | 0.644 | 0.527 |
| −6 | 0.595 | 0.615 | 0.600 | 0.595 | 0.677 | 0.695 | 0.599 | 0.575 | 0.732 | 0.598 | 0.702 | 0.577 | 0.702 | 0.622 | 0.462 | 0.759 | 0.572 | 0.621 | 0.509 |
| −4 | 0.574 | 0.596 | 0.576 | 0.581 | 0.641 | 0.663 | 0.575 | 0.549 | 0.702 | 0.575 | 0.666 | 0.552 | 0.668 | 0.596 | 0.439 | 0.730 | 0.552 | 0.589 | 0.489 |
| −2 | 0.555 | 0.571 | 0.547 | 0.567 | 0.598 | 0.626 | 0.540 | 0.517 | 0.662 | 0.542 | 0.622 | 0.528 | 0.623 | 0.557 | 0.409 | 0.698 | 0.529 | 0.538 | 0.469 |
| 0 | 0.533 | 0.530 | 0.515 | 0.549 | 0.556 | 0.592 | 0.488 | 0.473 | 0.608 | 0.494 | 0.569 | 0.509 | 0.565 | 0.494 | 0.360 | 0.668 | 0.499 | 0.458 | 0.442 |
| 2 | 0.479 | 0.455 | 0.477 | 0.518 | 0.464 | 0.562 | 0.418 | 0.404 | 0.535 | 0.428 | 0.499 | 0.473 | 0.490 | 0.421 | 0.265 | 0.620 | 0.448 | 0.366 | 0.387 |
| 4 | 0.401 | 0.364 | 0.435 | 0.480 | 0.331 | 0.530 | 0.350 | 0.329 | 0.456 | 0.358 | 0.437 | 0.422 | 0.422 | 0.366 | 0.152 | 0.564 | 0.388 | 0.297 | 0.326 |
| 6 | 0.342 | 0.298 | 0.399 | 0.449 | 0.258 | 0.497 | 0.302 | 0.275 | 0.396 | 0.309 | 0.394 | 0.381 | 0.376 | 0.329 | 0.083 | 0.524 | 0.340 | 0.253 | 0.284 |
| 8 | 0.305 | 0.256 | 0.372 | 0.426 | 0.217 | 0.471 | 0.270 | 0.239 | 0.356 | 0.277 | 0.365 | 0.354 | 0.347 | 0.305 | 0.045 | 0.497 | 0.308 | 0.223 | 0.256 |
| 10 | 0.281 | 0.230 | 0.353 | 0.410 | 0.192 | 0.452 | 0.248 | 0.216 | 0.330 | 0.257 | 0.344 | 0.334 | 0.327 | 0.287 | 0.021 | 0.478 | 0.287 | 0.204 | 0.237 |
| ∆h | 0.346 | 0.413 | 0.282 | 0.210 | 0.528 | 0.284 | 0.383 | 0.394 | 0.442 | 0.373 | 0.403 | 0.281 | 0.418 | 0.367 | 0.471 | 0.320 | 0.317 | 0.457 | 0.304 |
| Developed Markets | Emerging Markets | ||||||||||||||||||
|---|---|---|---|---|---|---|---|---|---|---|---|---|---|---|---|---|---|---|---|
| Order q | Australia | Canada | France | Germany | Italy | Japan | UK | USA | Argentina | Brazil | China | India | Indonesia | Mexico | Russia | Saudi Arabia | South Africa | South Korea | Turkey |
| COVID-19 | |||||||||||||||||||
| −10 | 0.6564 | 0.6293 | 0.6673 | 0.7224 | 0.5453 | 0.7240 | 0.5224 | 0.6512 | 0.6722 | 0.8053 | 0.4151 | 0.7475 | 0.7168 | 0.6234 | 0.8642 | 0.7495 | 0.6503 | 0.8800 | 0.7404 |
| −8 | 0.6458 | 0.6093 | 0.6496 | 0.7072 | 0.5283 | 0.7036 | 0.5091 | 0.6343 | 0.6557 | 0.7851 | 0.4059 | 0.7307 | 0.7042 | 0.6078 | 0.8444 | 0.7314 | 0.6370 | 0.8595 | 0.7273 |
| −6 | 0.6333 | 0.5808 | 0.6257 | 0.6866 | 0.5057 | 0.6753 | 0.4920 | 0.6106 | 0.6330 | 0.7576 | 0.3958 | 0.7084 | 0.6872 | 0.5873 | 0.8165 | 0.7065 | 0.6197 | 0.8307 | 0.7097 |
| −4 | 0.6208 | 0.5391 | 0.5950 | 0.6581 | 0.4751 | 0.6373 | 0.4707 | 0.5756 | 0.6010 | 0.7209 | 0.3862 | 0.6798 | 0.6630 | 0.5604 | 0.7760 | 0.6706 | 0.5968 | 0.7900 | 0.6855 |
| −2 | 0.6131 | 0.4803 | 0.5644 | 0.6190 | 0.4333 | 0.5923 | 0.4487 | 0.5204 | 0.5568 | 0.6745 | 0.3788 | 0.6481 | 0.6251 | 0.5258 | 0.7163 | 0.6167 | 0.5652 | 0.7348 | 0.6501 |
| 0 | 0.5970 | 0.4001 | 0.5343 | 0.5504 | 0.3730 | 0.5381 | 0.4239 | 0.4294 | 0.4957 | 0.6186 | 0.3679 | 0.6072 | 0.5532 | 0.4776 | 0.6159 | 0.5348 | 0.5119 | 0.6529 | 0.5935 |
| 2 | 0.4599 | 0.2941 | 0.4225 | 0.3795 | 0.2912 | 0.4311 | 0.3344 | 0.2992 | 0.4089 | 0.5508 | 0.3369 | 0.4866 | 0.3915 | 0.3998 | 0.4440 | 0.4301 | 0.3772 | 0.5025 | 0.5007 |
| 4 | 0.3139 | 0.1932 | 0.2967 | 0.2309 | 0.2156 | 0.3019 | 0.2286 | 0.1891 | 0.3143 | 0.4808 | 0.2949 | 0.3515 | 0.2190 | 0.3091 | 0.2907 | 0.3402 | 0.2018 | 0.3447 | 0.4028 |
| 6 | 0.2407 | 0.1261 | 0.2259 | 0.1576 | 0.1638 | 0.2219 | 0.1651 | 0.1241 | 0.2482 | 0.4278 | 0.2618 | 0.2778 | 0.1283 | 0.2430 | 0.2043 | 0.2818 | 0.1037 | 0.2557 | 0.3398 |
| 8 | 0.2010 | 0.0848 | 0.1857 | 0.1182 | 0.1300 | 0.1769 | 0.1281 | 0.0857 | 0.2081 | 0.3919 | 0.2389 | 0.2374 | 0.0804 | 0.2012 | 0.1553 | 0.2446 | 0.0513 | 0.2075 | 0.3021 |
| 10 | 0.1763 | 0.0580 | 0.1604 | 0.0939 | 0.1069 | 0.1491 | 0.1046 | 0.0609 | 0.1827 | 0.3674 | 0.2228 | 0.2122 | 0.0517 | 0.1739 | 0.1247 | 0.2194 | 0.0200 | 0.1784 | 0.2781 |
| ∆h | 0.4801 | 0.5712 | 0.5069 | 0.6285 | 0.4384 | 0.5749 | 0.4178 | 0.5903 | 0.4895 | 0.4380 | 0.1923 | 0.5353 | 0.6651 | 0.4495 | 0.7394 | 0.5300 | 0.6302 | 0.7016 | 0.4623 |
| Russia−Ukraine War | |||||||||||||||||||
| −10 | 0.8931 | 0.8874 | 0.6477 | 0.6612 | 0.6871 | 0.8880 | 1.1385 | 0.7921 | 0.7881 | 0.9552 | 0.8833 | 0.8418 | 0.4635 | 0.8443 | 1.2029 | 0.9856 | 0.8127 | 0.5979 | 0.6826 |
| −8 | 0.8759 | 0.8718 | 0.6353 | 0.6503 | 0.6728 | 0.8678 | 1.1248 | 0.7652 | 0.7659 | 0.9389 | 0.8571 | 0.8222 | 0.4487 | 0.8322 | 1.1880 | 0.9552 | 0.7841 | 0.5814 | 0.6611 |
| −6 | 0.8516 | 0.8473 | 0.6192 | 0.6364 | 0.6539 | 0.8400 | 1.1057 | 0.7240 | 0.7331 | 0.9169 | 0.8166 | 0.7956 | 0.4292 | 0.8170 | 1.1644 | 0.9074 | 0.7408 | 0.5560 | 0.6329 |
| −4 | 0.8145 | 0.8019 | 0.5969 | 0.6175 | 0.6281 | 0.8018 | 1.0757 | 0.6592 | 0.6817 | 0.8866 | 0.7500 | 0.7581 | 0.4029 | 0.7981 | 1.1209 | 0.8266 | 0.6713 | 0.5142 | 0.5959 |
| −2 | 0.7539 | 0.7055 | 0.5628 | 0.5870 | 0.5881 | 0.7530 | 1.0174 | 0.5628 | 0.5995 | 0.8448 | 0.6404 | 0.7020 | 0.3678 | 0.7753 | 1.0275 | 0.6857 | 0.5592 | 0.4467 | 0.5492 |
| 0 | 0.6618 | 0.5284 | 0.5052 | 0.5216 | 0.5087 | 0.6971 | 0.8797 | 0.4493 | 0.4835 | 0.7894 | 0.4908 | 0.6176 | 0.3231 | 0.7492 | 0.8302 | 0.4838 | 0.4103 | 0.3644 | 0.4960 |
| 2 | 0.5679 | 0.3502 | 0.4161 | 0.3970 | 0.3653 | 0.6373 | 0.6873 | 0.3557 | 0.3649 | 0.7248 | 0.3529 | 0.5094 | 0.2718 | 0.7217 | 0.5984 | 0.3189 | 0.2737 | 0.2976 | 0.4460 |
| 4 | 0.5067 | 0.2453 | 0.3211 | 0.2720 | 0.2225 | 0.5835 | 0.5774 | 0.2949 | 0.2783 | 0.6646 | 0.2607 | 0.4068 | 0.2213 | 0.6953 | 0.4651 | 0.2281 | 0.1788 | 0.2504 | 0.4062 |
| 6 | 0.4722 | 0.1902 | 0.2502 | 0.1923 | 0.1322 | 0.5420 | 0.5220 | 0.2570 | 0.2236 | 0.6192 | 0.2042 | 0.3302 | 0.1790 | 0.6721 | 0.3978 | 0.1762 | 0.1168 | 0.2161 | 0.3763 |
| 8 | 0.4516 | 0.1586 | 0.2043 | 0.1455 | 0.0799 | 0.5117 | 0.4896 | 0.2320 | 0.1887 | 0.5878 | 0.1685 | 0.2779 | 0.1470 | 0.6530 | 0.3602 | 0.1432 | 0.0750 | 0.1906 | 0.3537 |
| 10 | 0.4379 | 0.1384 | 0.1745 | 0.1164 | 0.0476 | 0.4896 | 0.4682 | 0.2144 | 0.1650 | 0.5658 | 0.1446 | 0.2421 | 0.1238 | 0.6377 | 0.3369 | 0.1207 | 0.0457 | 0.1715 | 0.3362 |
| ∆h | 0.4552 | 0.7491 | 0.4732 | 0.5448 | 0.6395 | 0.3984 | 0.6703 | 0.5777 | 0.6231 | 0.3893 | 0.7387 | 0.5997 | 0.3398 | 0.2066 | 0.8659 | 0.8649 | 0.7670 | 0.4264 | 0.3464 |
Disclaimer/Publisher’s Note: The statements, opinions and data contained in all publications are solely those of the individual author(s) and contributor(s) and not of MDPI and/or the editor(s). MDPI and/or the editor(s) disclaim responsibility for any injury to people or property resulting from any ideas, methods, instructions or products referred to in the content. |
© 2024 by the authors. Licensee MDPI, Basel, Switzerland. This article is an open access article distributed under the terms and conditions of the Creative Commons Attribution (CC BY) license (https://creativecommons.org/licenses/by/4.0/).
Share and Cite
Ahmed Memon, B.; Aslam, F.; Naveed, H.M.; Ferreira, P.; Ganiev, O. Influence of the Russia–Ukraine War and COVID-19 Pandemic on the Efficiency and Herding Behavior of Stock Markets: Evidence from G20 Nations. Economies 2024, 12, 106. https://doi.org/10.3390/economies12050106
Ahmed Memon B, Aslam F, Naveed HM, Ferreira P, Ganiev O. Influence of the Russia–Ukraine War and COVID-19 Pandemic on the Efficiency and Herding Behavior of Stock Markets: Evidence from G20 Nations. Economies. 2024; 12(5):106. https://doi.org/10.3390/economies12050106
Chicago/Turabian StyleAhmed Memon, Bilal, Faheem Aslam, Hafiz Muhammad Naveed, Paulo Ferreira, and Omonjon Ganiev. 2024. "Influence of the Russia–Ukraine War and COVID-19 Pandemic on the Efficiency and Herding Behavior of Stock Markets: Evidence from G20 Nations" Economies 12, no. 5: 106. https://doi.org/10.3390/economies12050106
APA StyleAhmed Memon, B., Aslam, F., Naveed, H. M., Ferreira, P., & Ganiev, O. (2024). Influence of the Russia–Ukraine War and COVID-19 Pandemic on the Efficiency and Herding Behavior of Stock Markets: Evidence from G20 Nations. Economies, 12(5), 106. https://doi.org/10.3390/economies12050106


