
Greece’s Economic Odyssey: Persistent Challenges and Pathways Forward


Abstract
:1. Introduction
2. The Magnitude of the Greek Economic Crisis
3. The Effects of the Crisis on Disposable Income
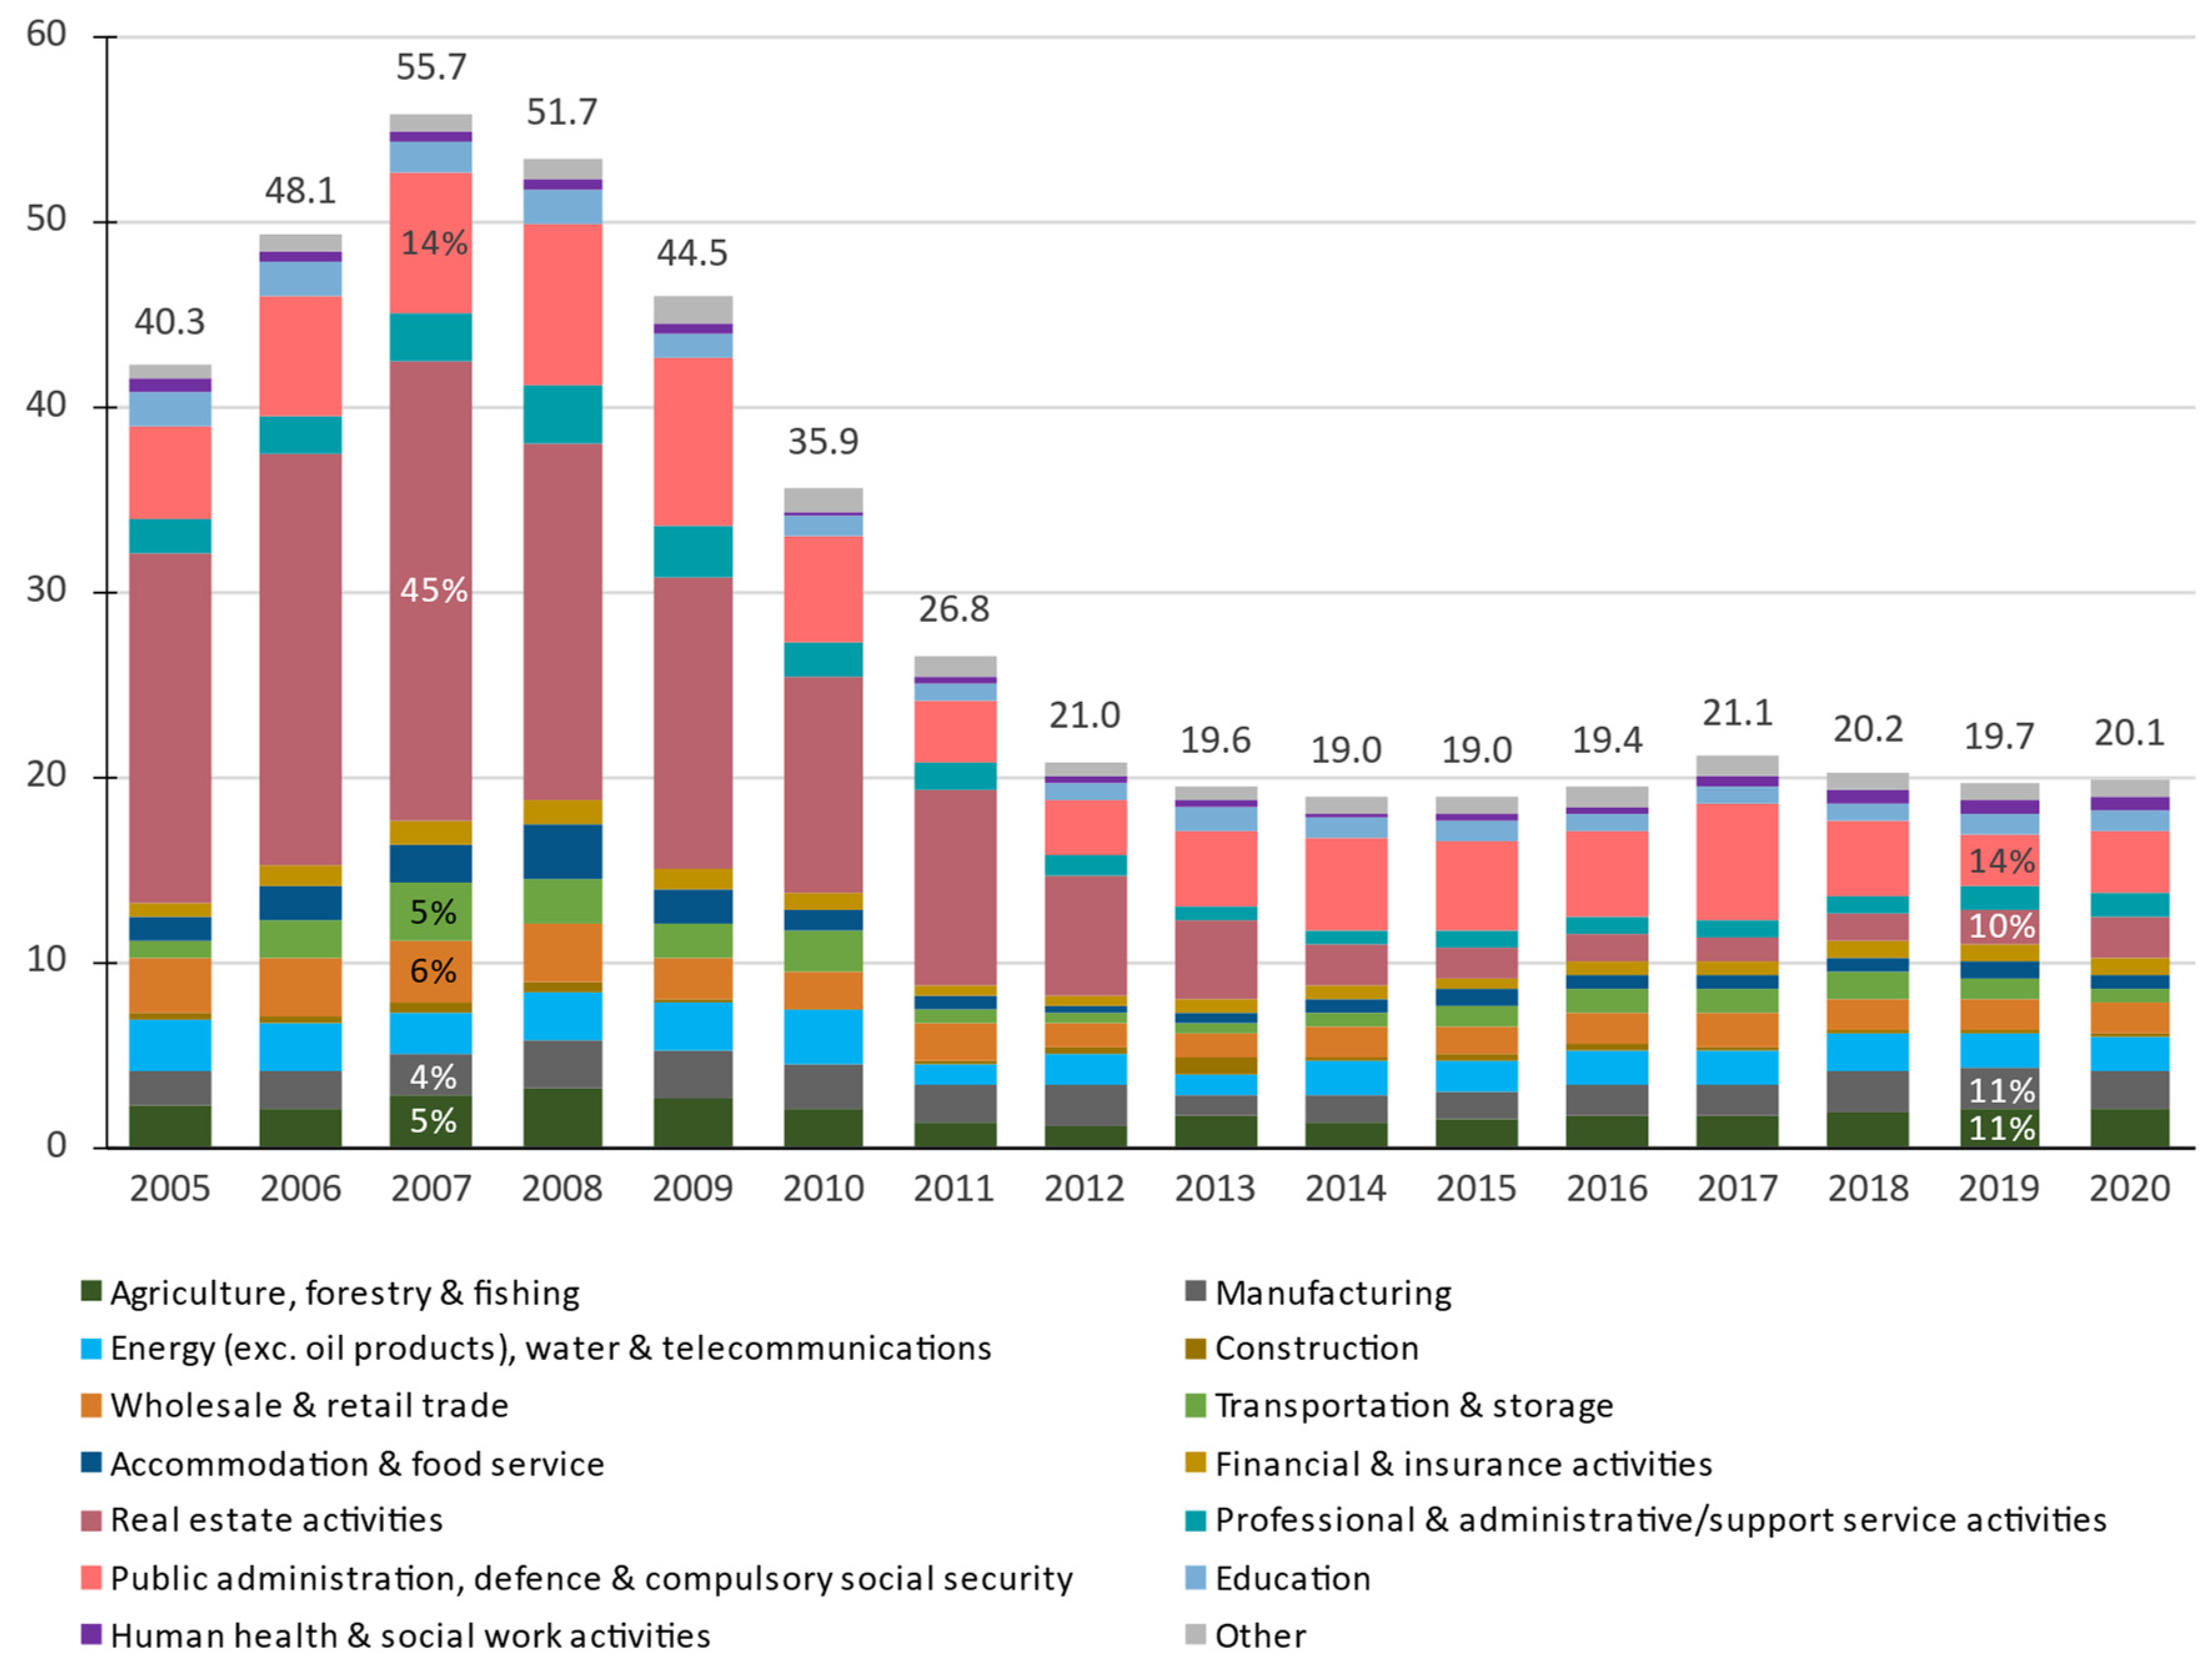
4. The Production Structure of the Greek Economy
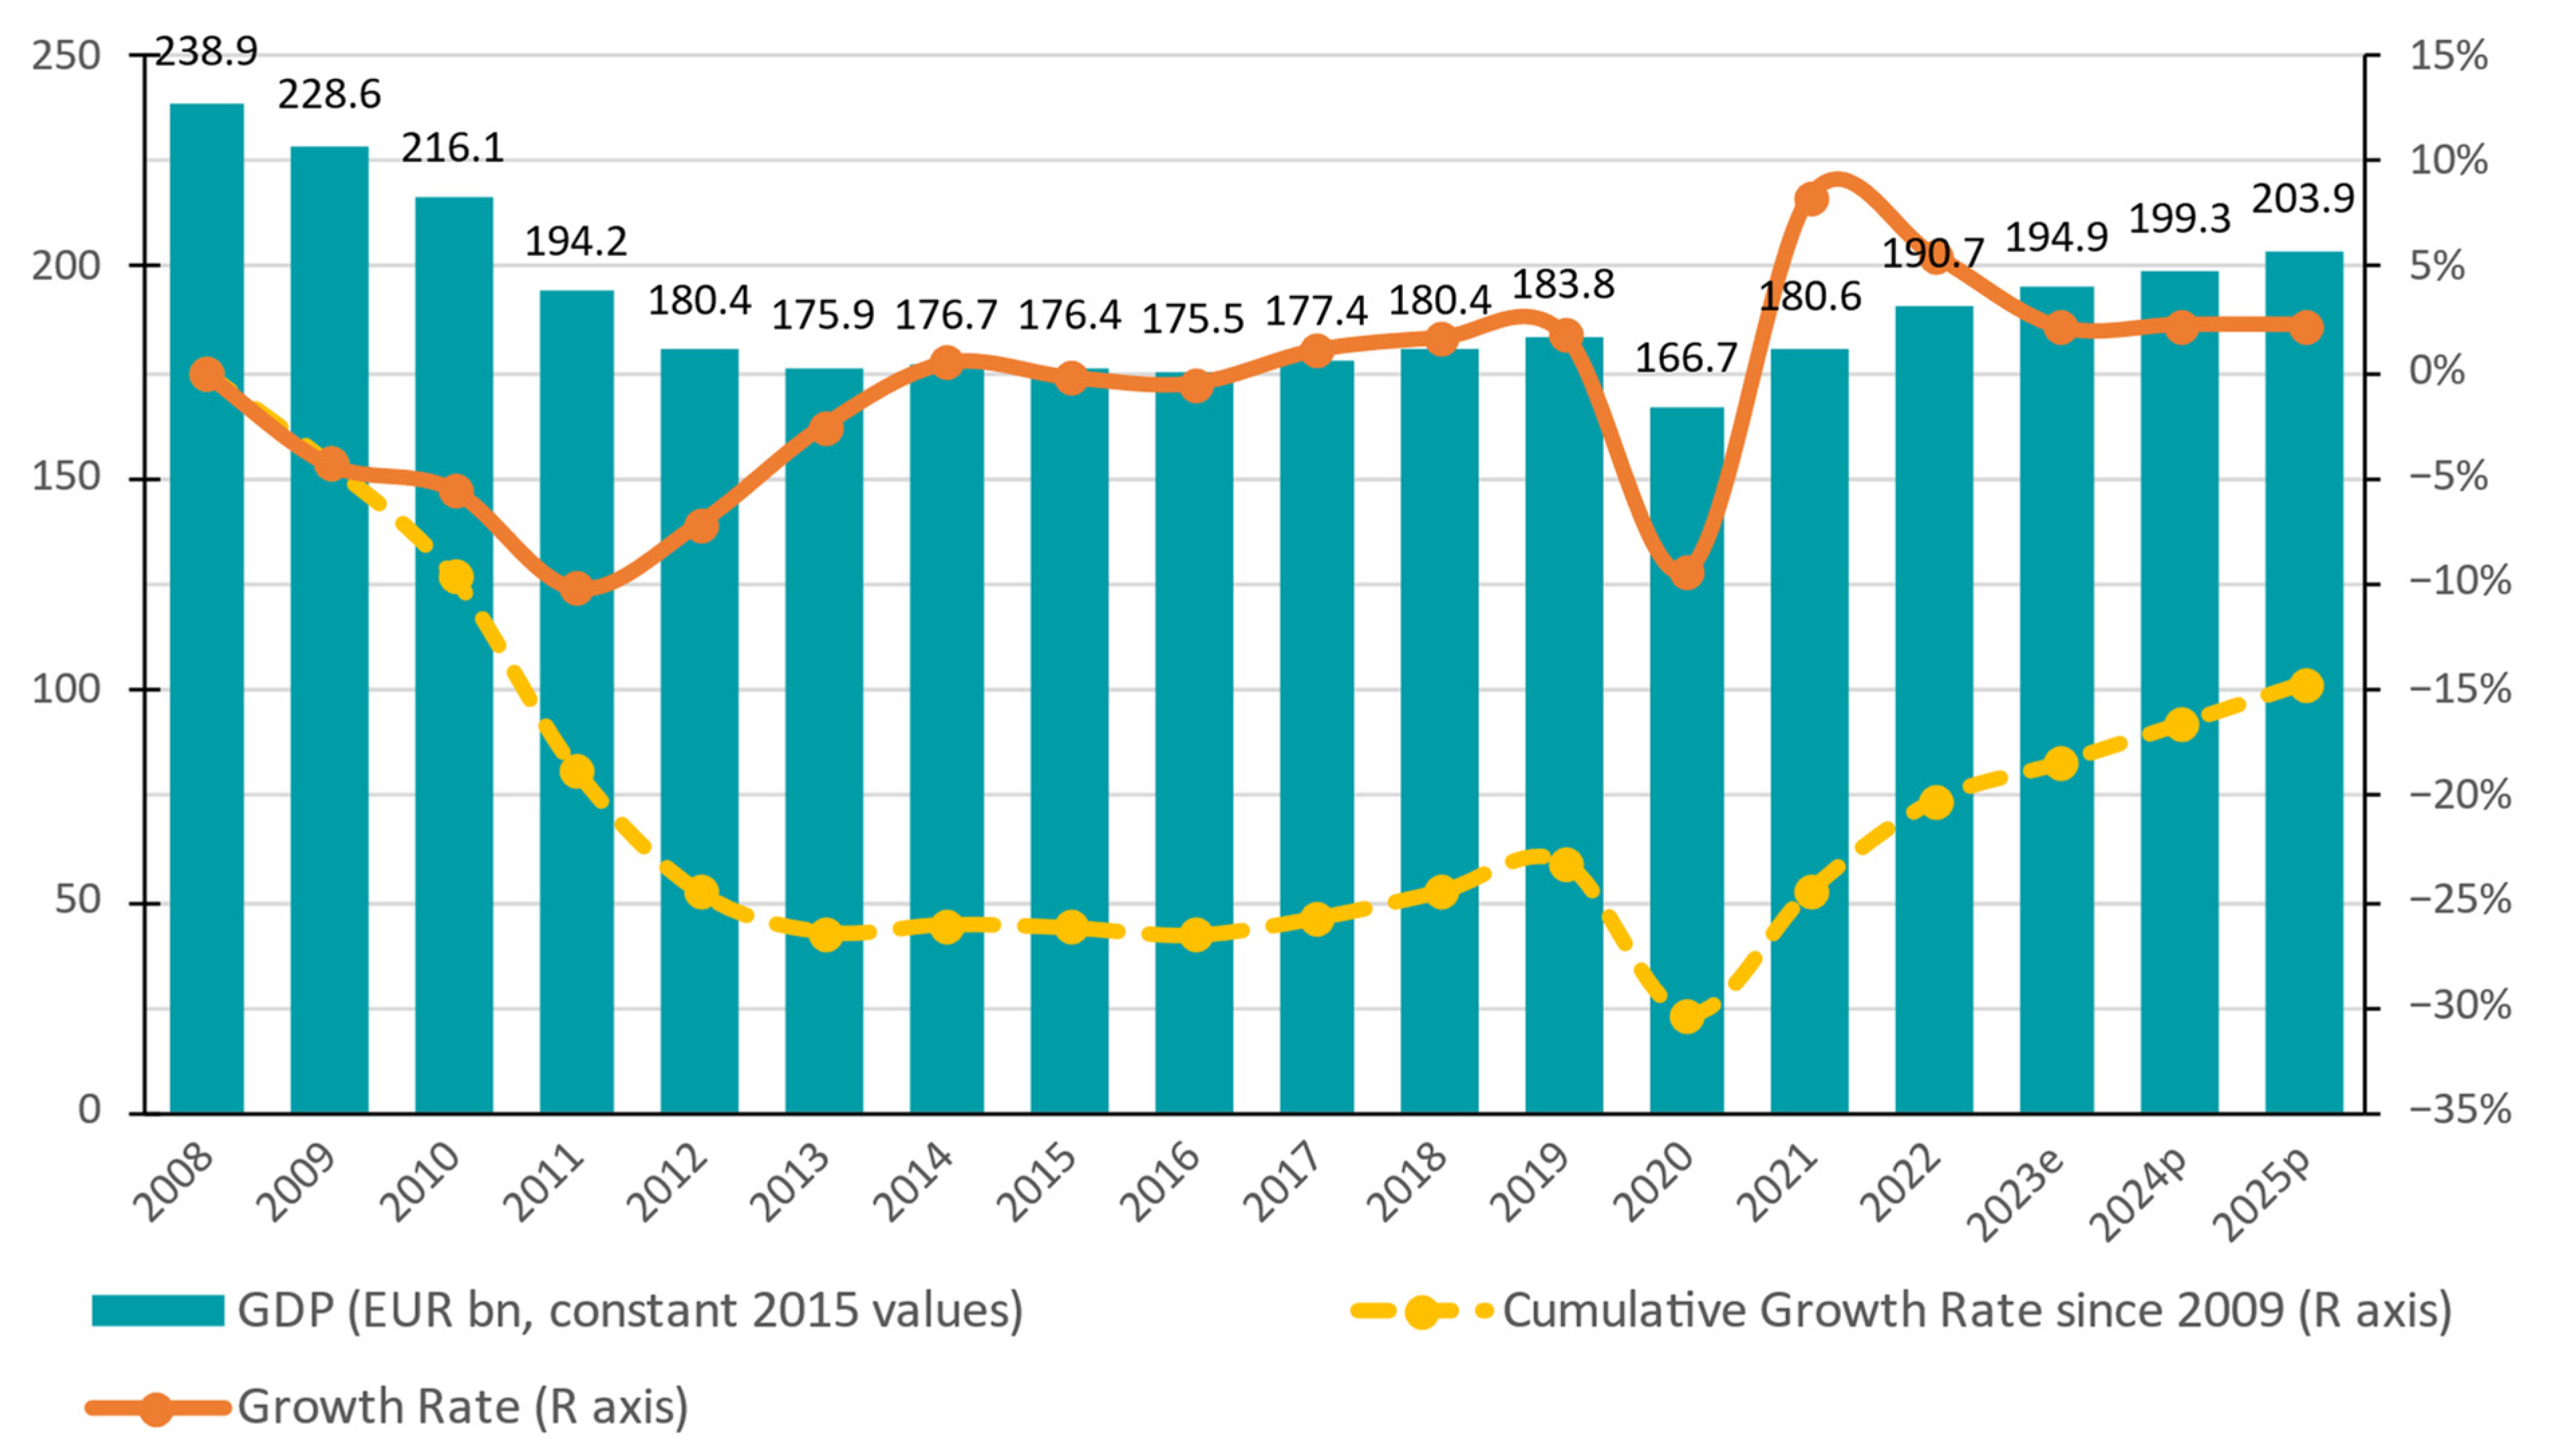
4.1. The Asymmetric Effects of the Pandemic
4.2. The Current Production Structure
5. Competitiveness and External Balance of the Greek Economy
5.1. The Current Account Deficit and the External Imbalance
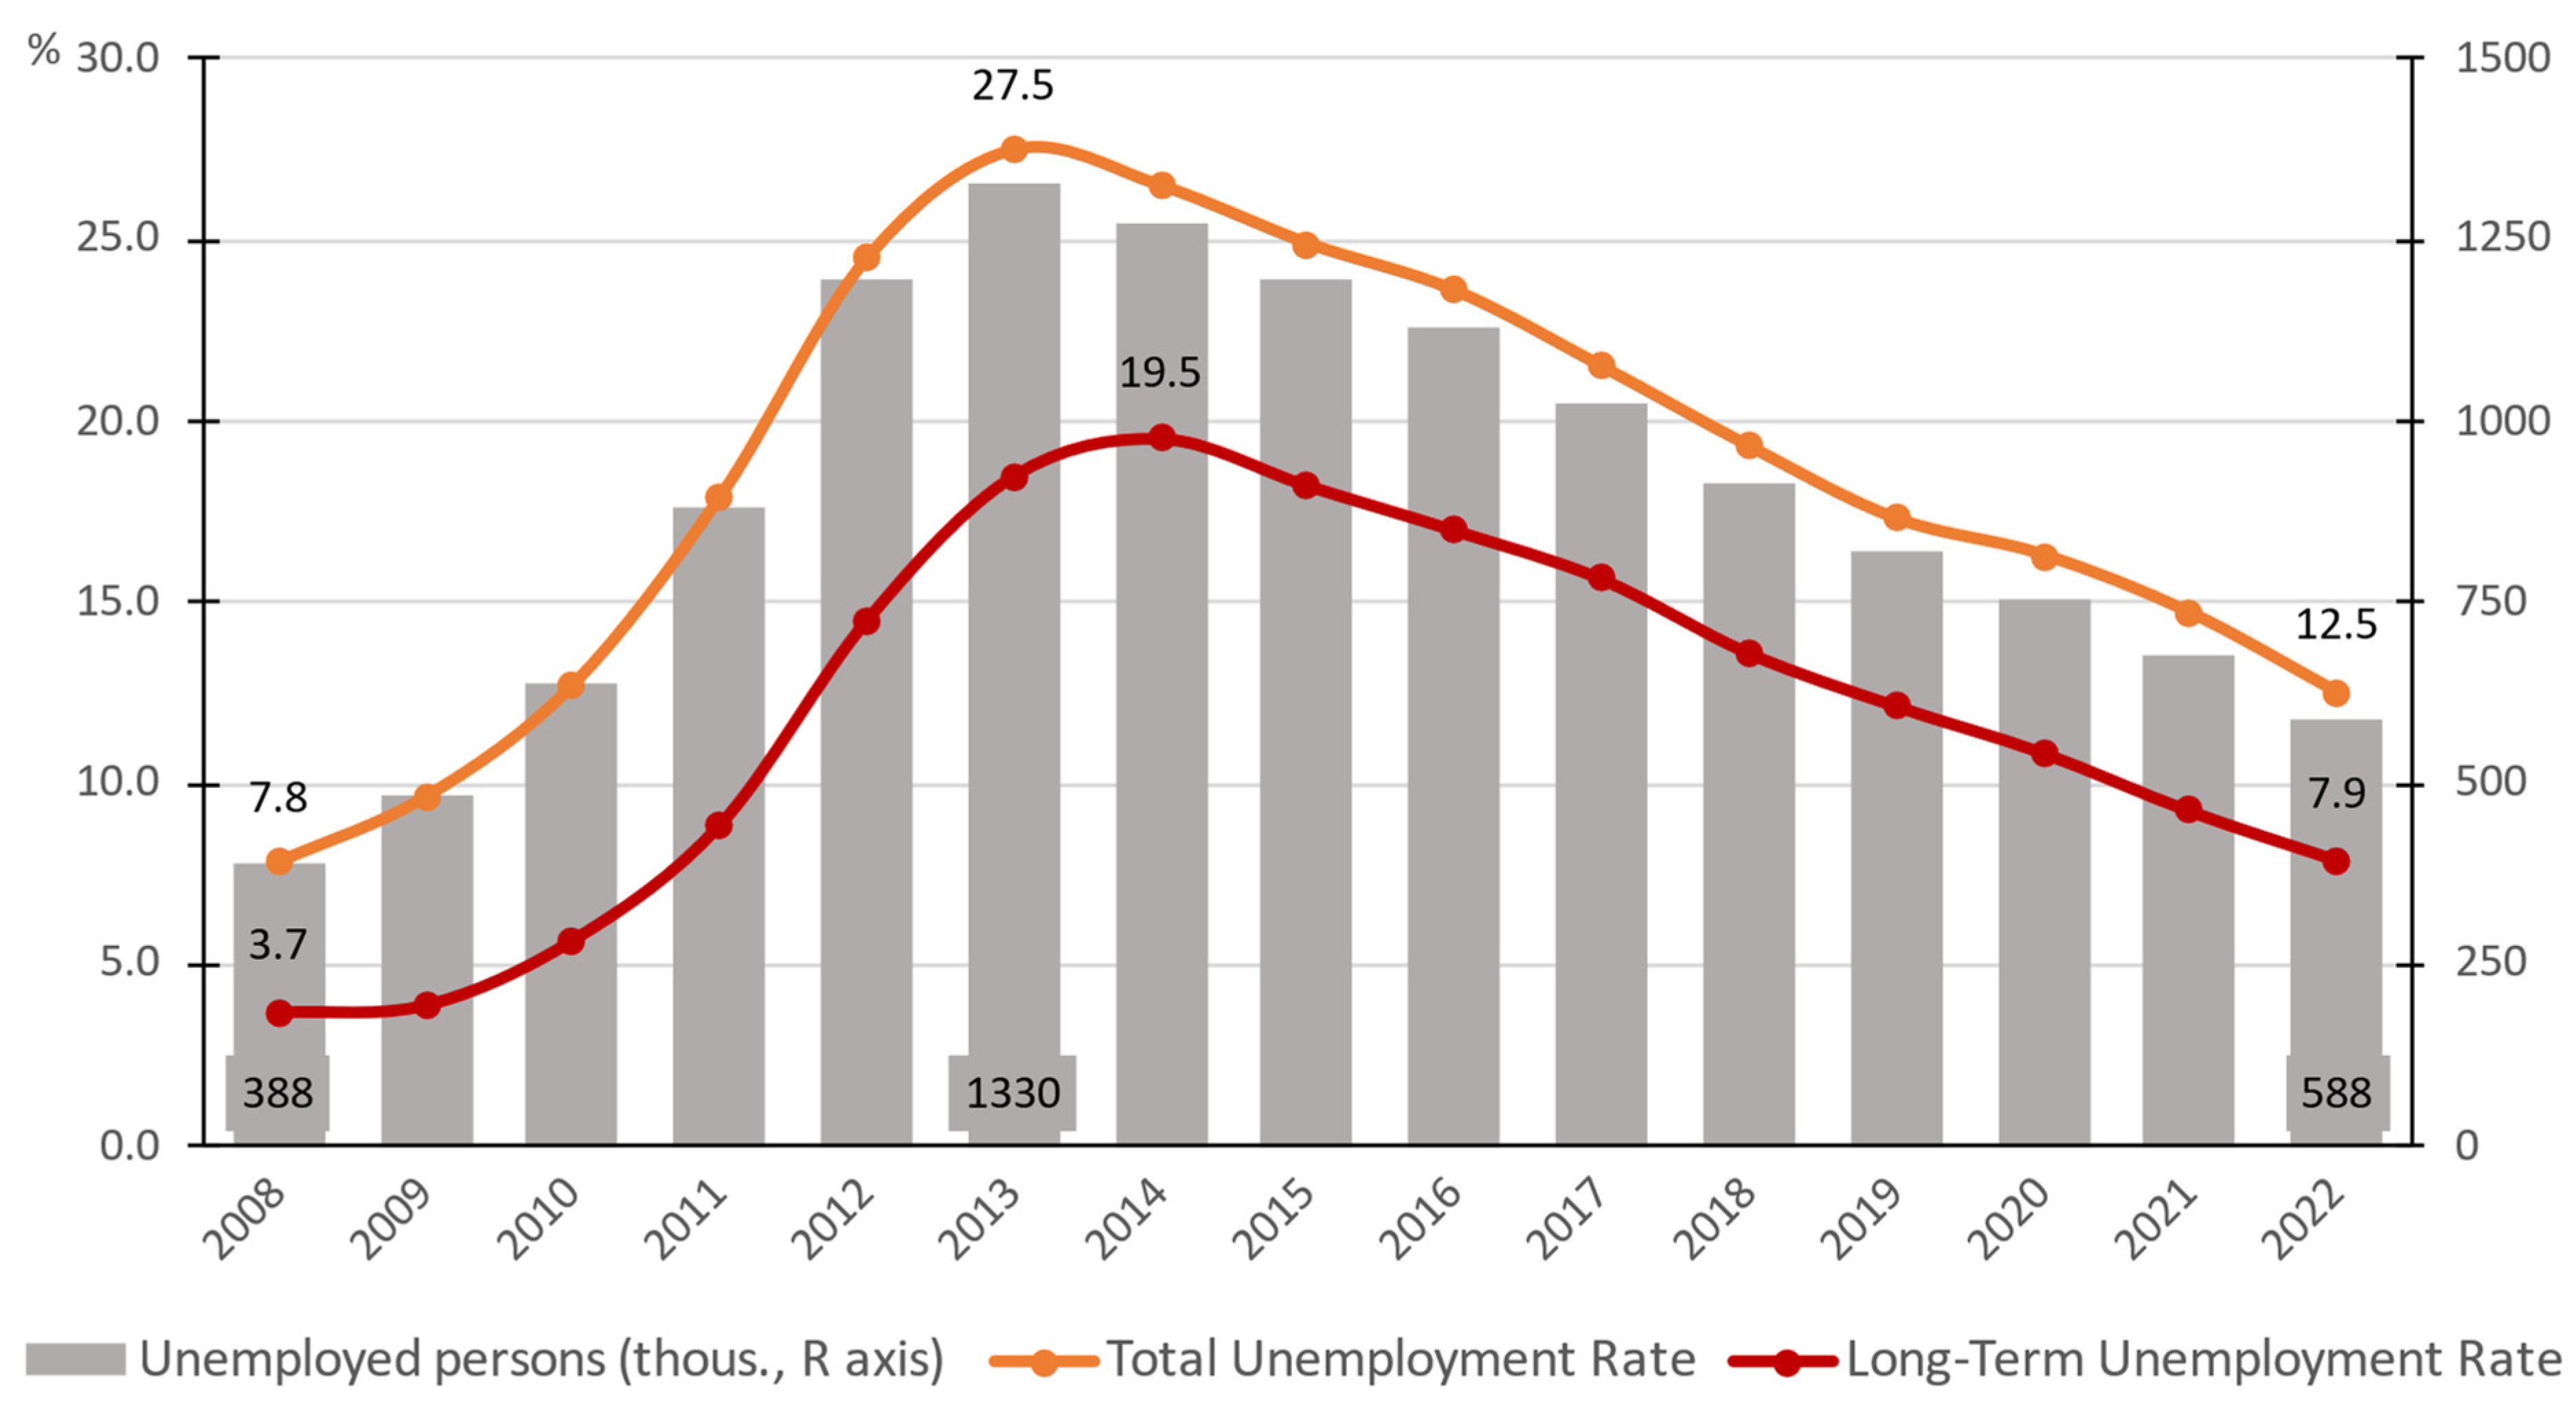
5.2. International Trade in Goods
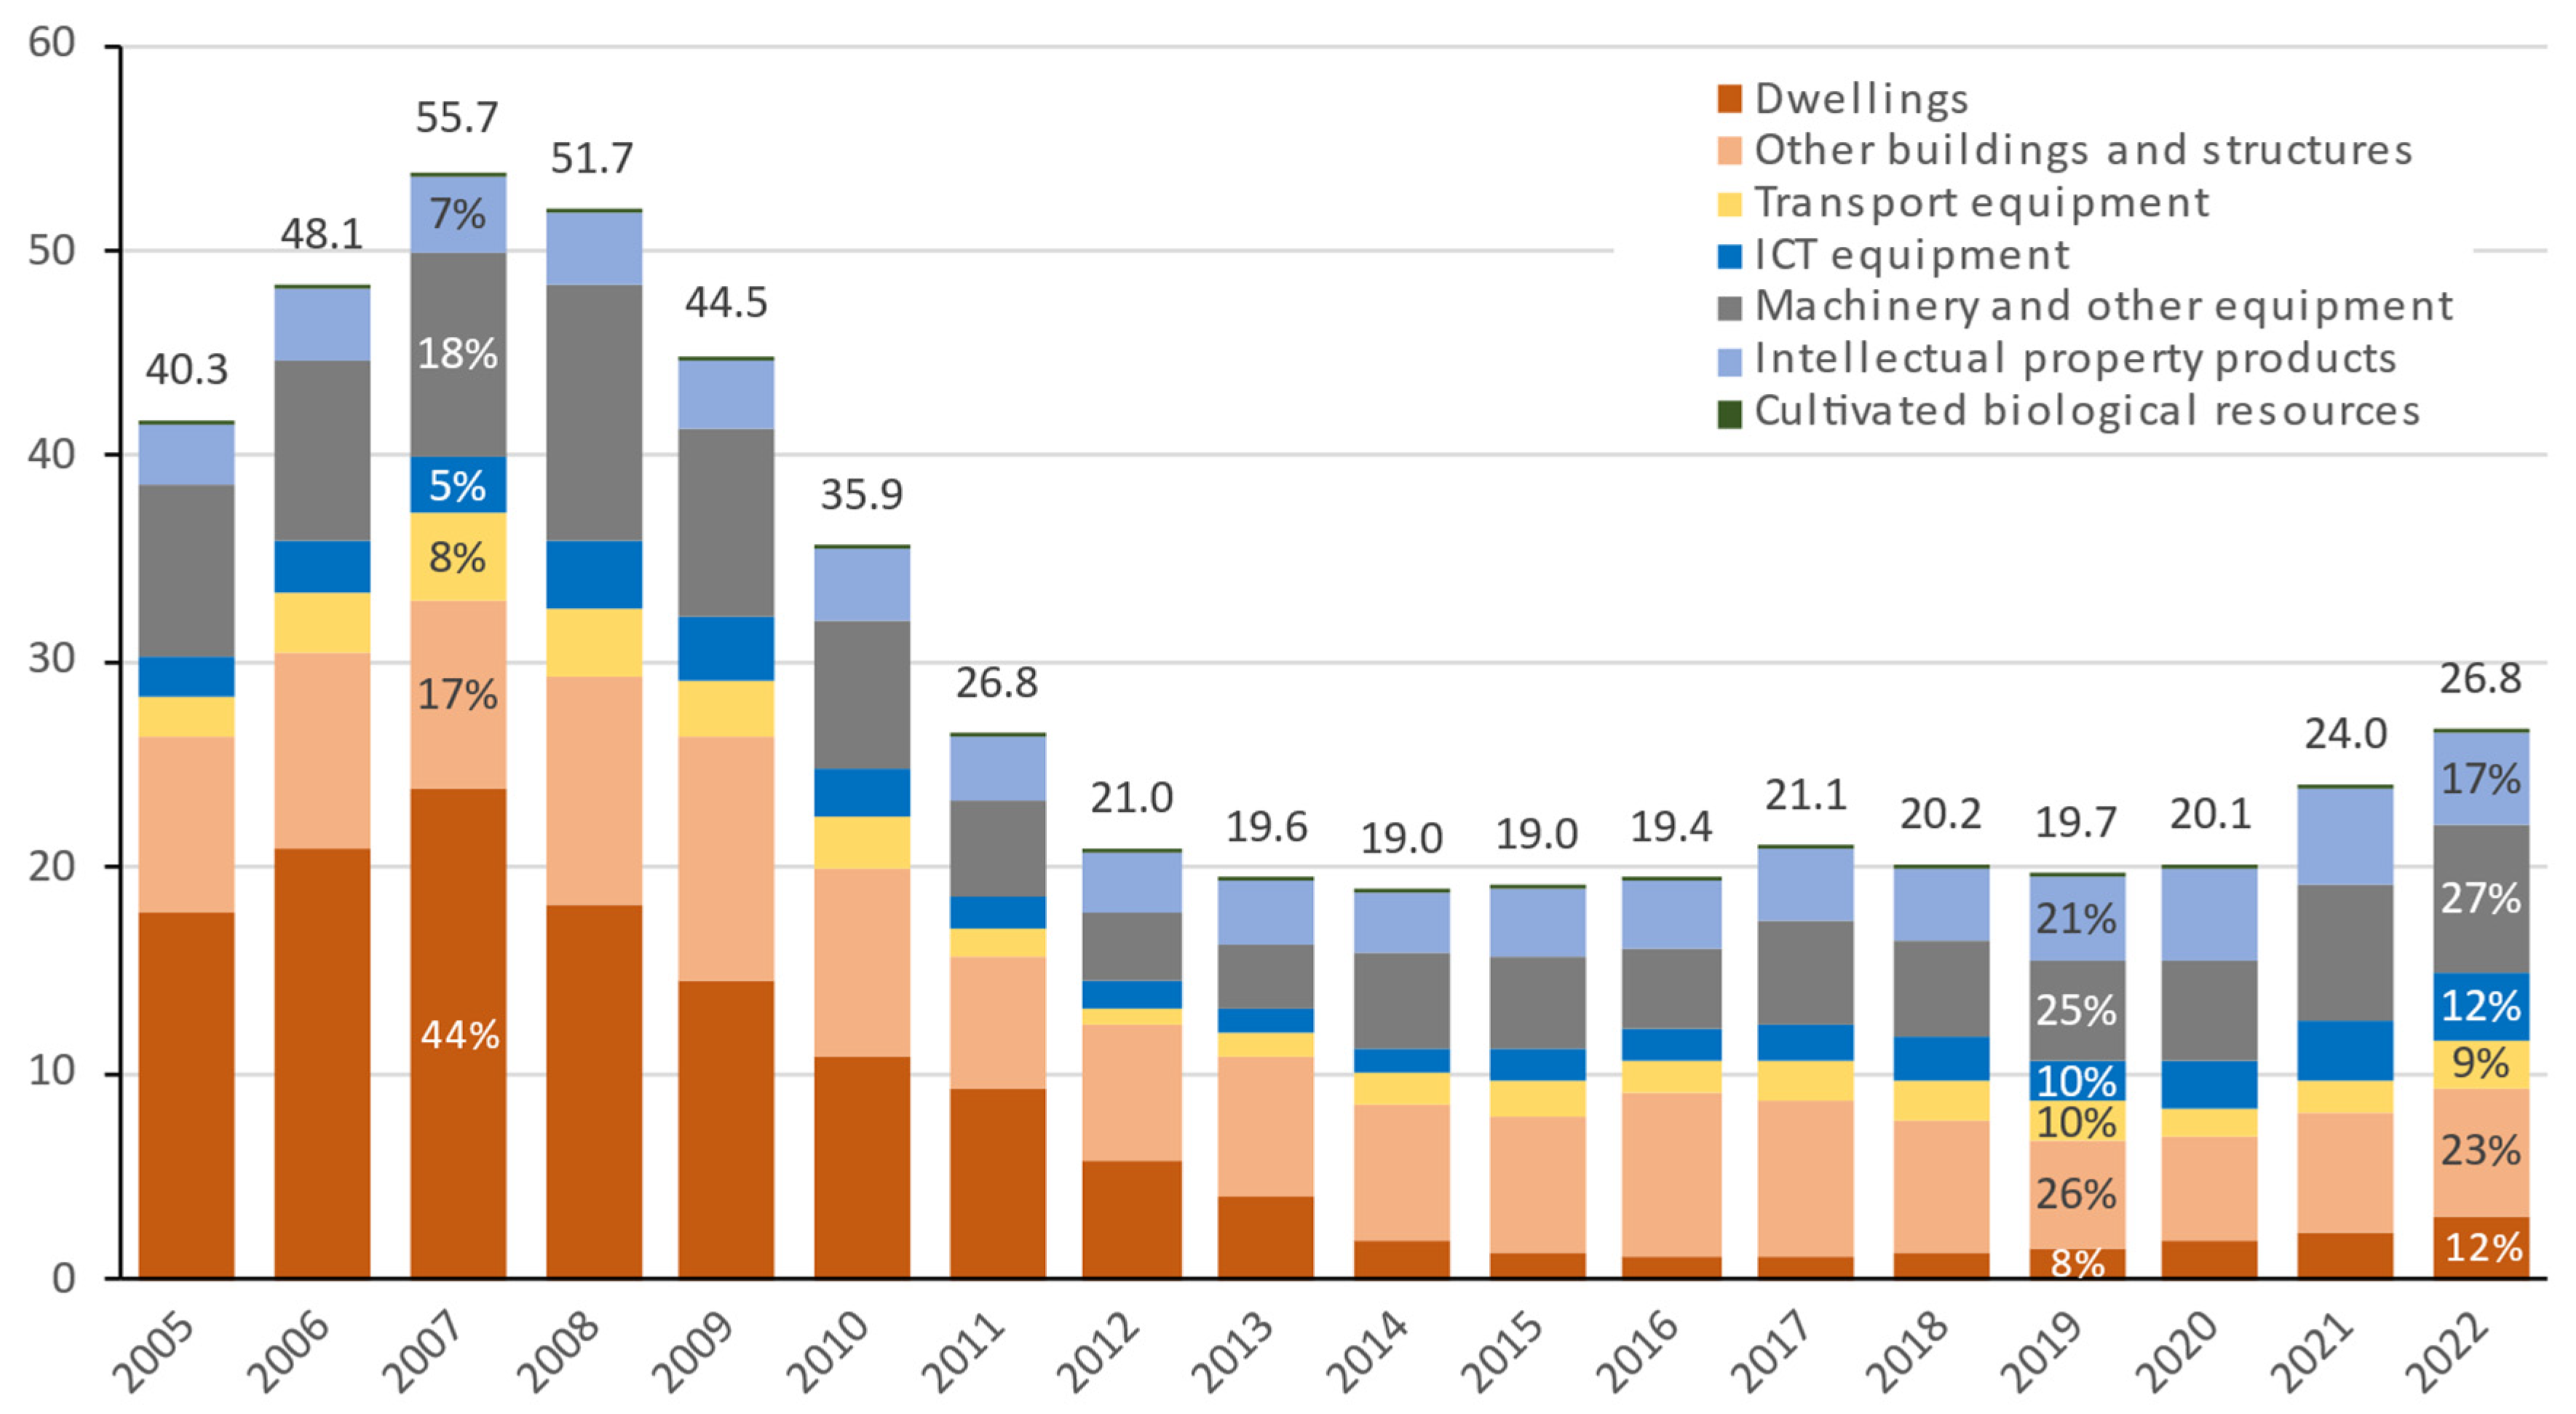
6. The Problem of Investment in the Greek Economy
6.1. The Investment Gap
6.2. The Critical Factor of Banking Sector Robustness
6.3. The Investment Model of the Greek Economy
6.4. The Need for a Strategic Focusing of Investments
6.4.1. Priority to Investments in Labor-Intensive Sectors
6.4.2. Priority to Investments That Enhance the Competitiveness and Openness of the Economy
7. Challenges and Risk Factors for the Future
7.1. The Global Inflation Wave
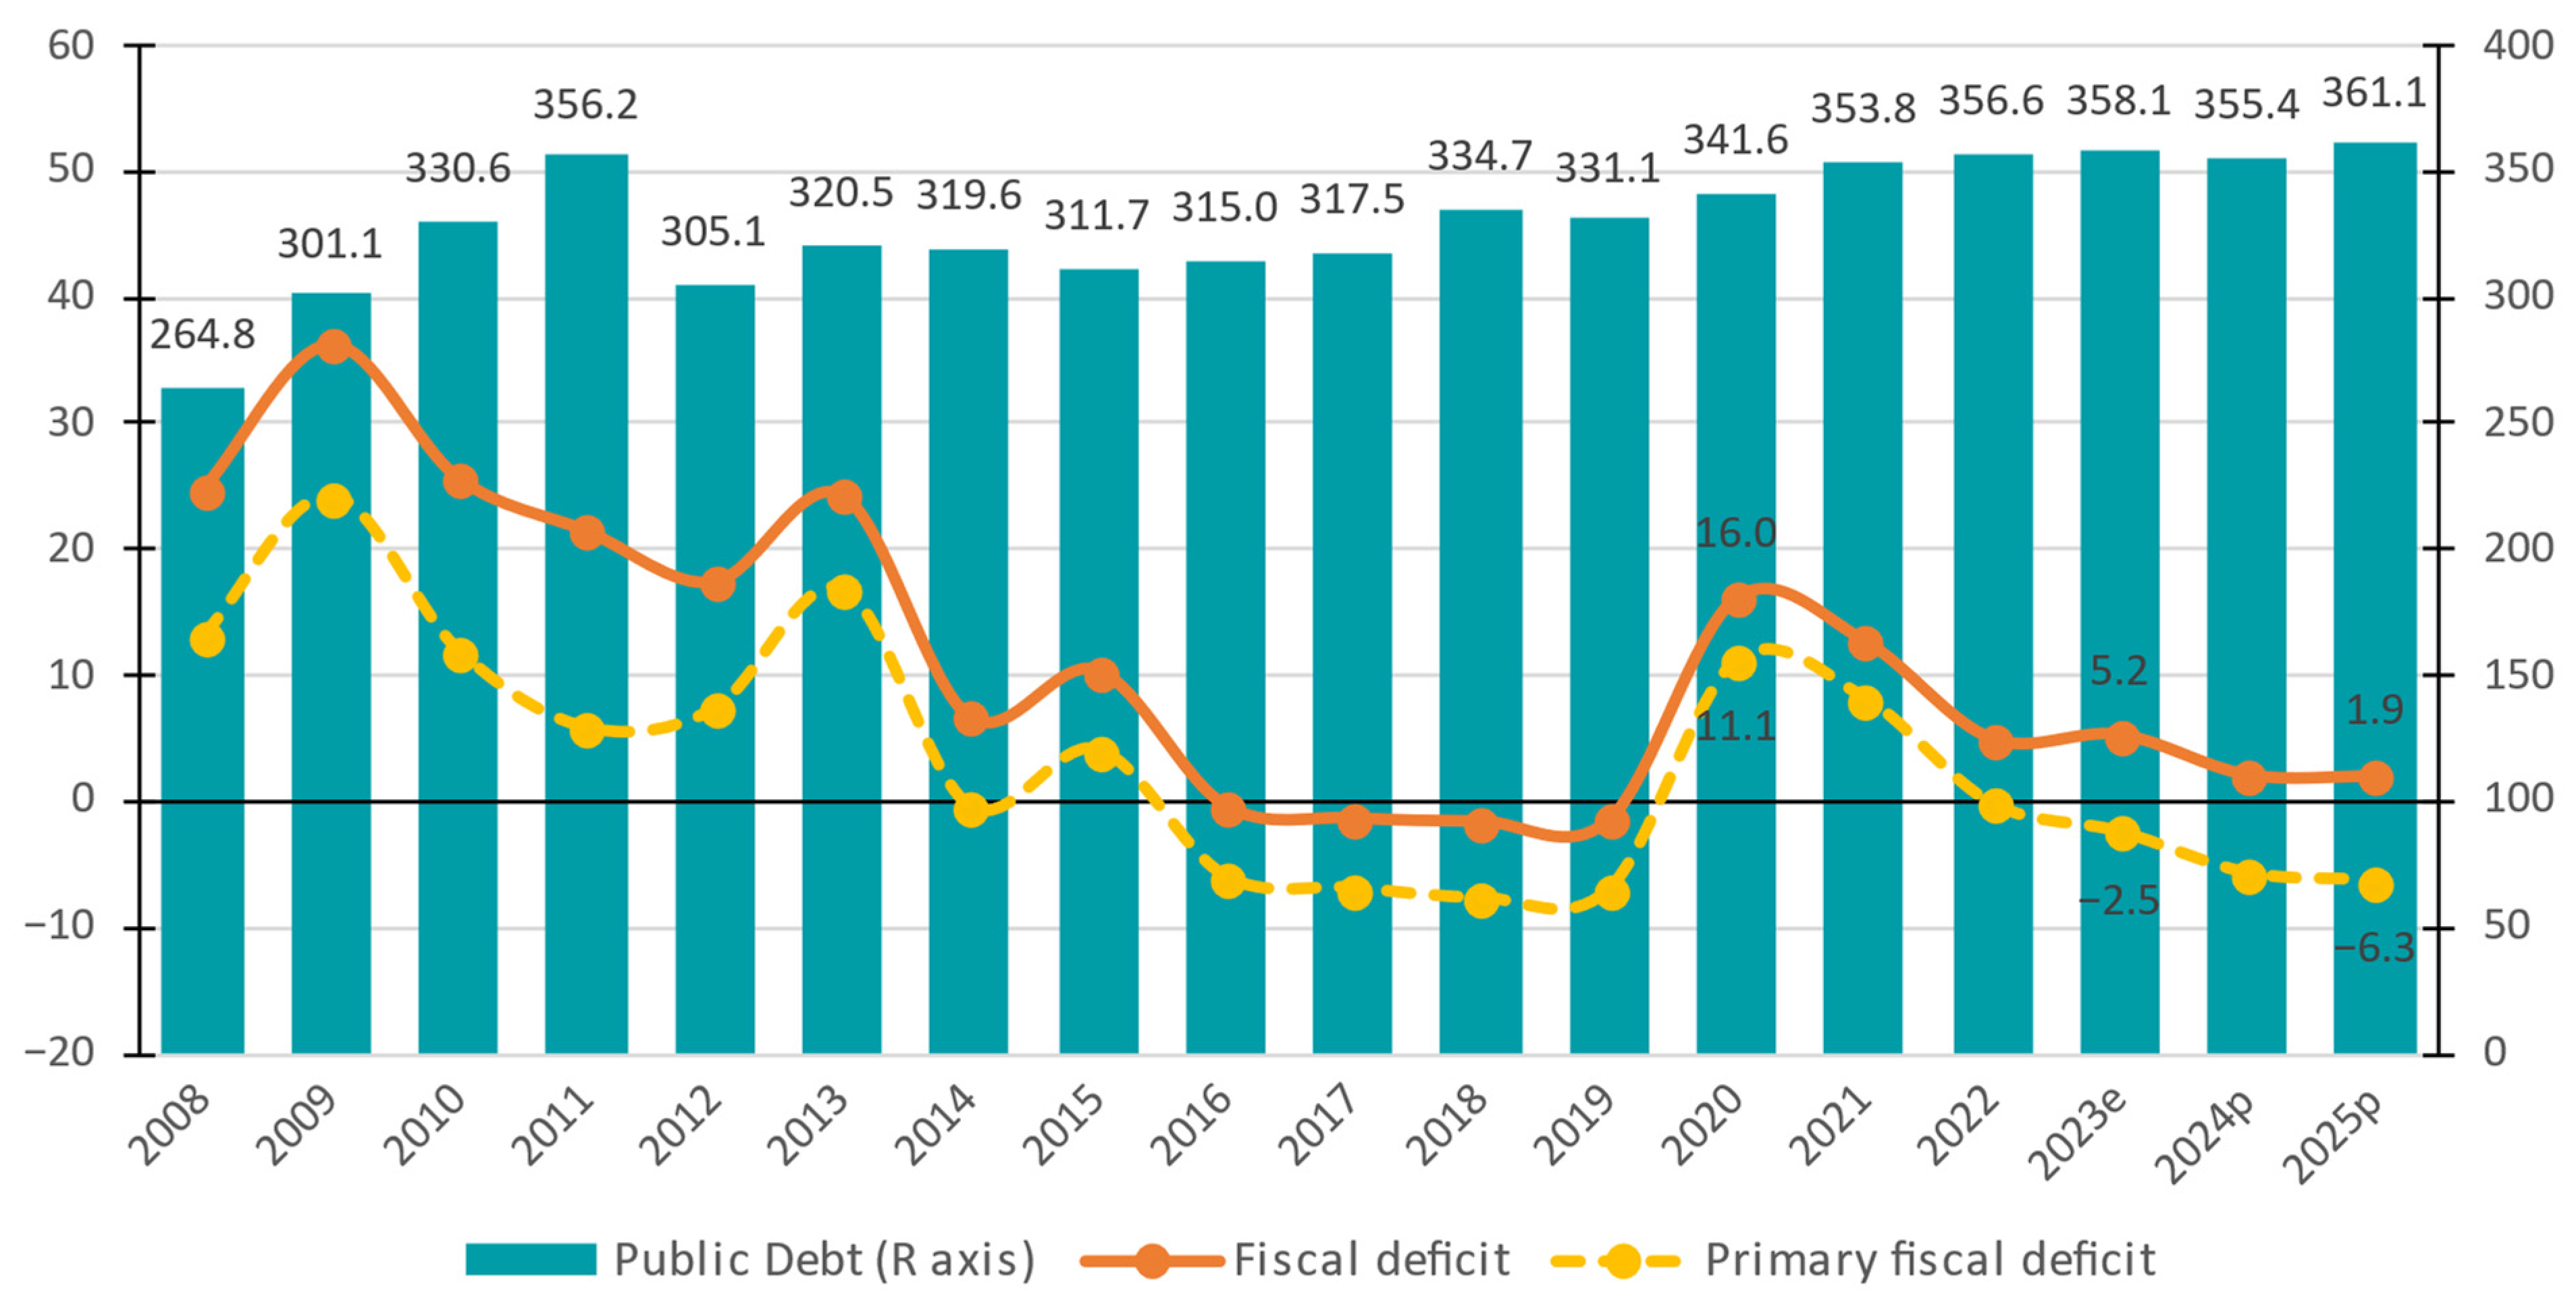
7.2. The Excessive Level of Public Debt
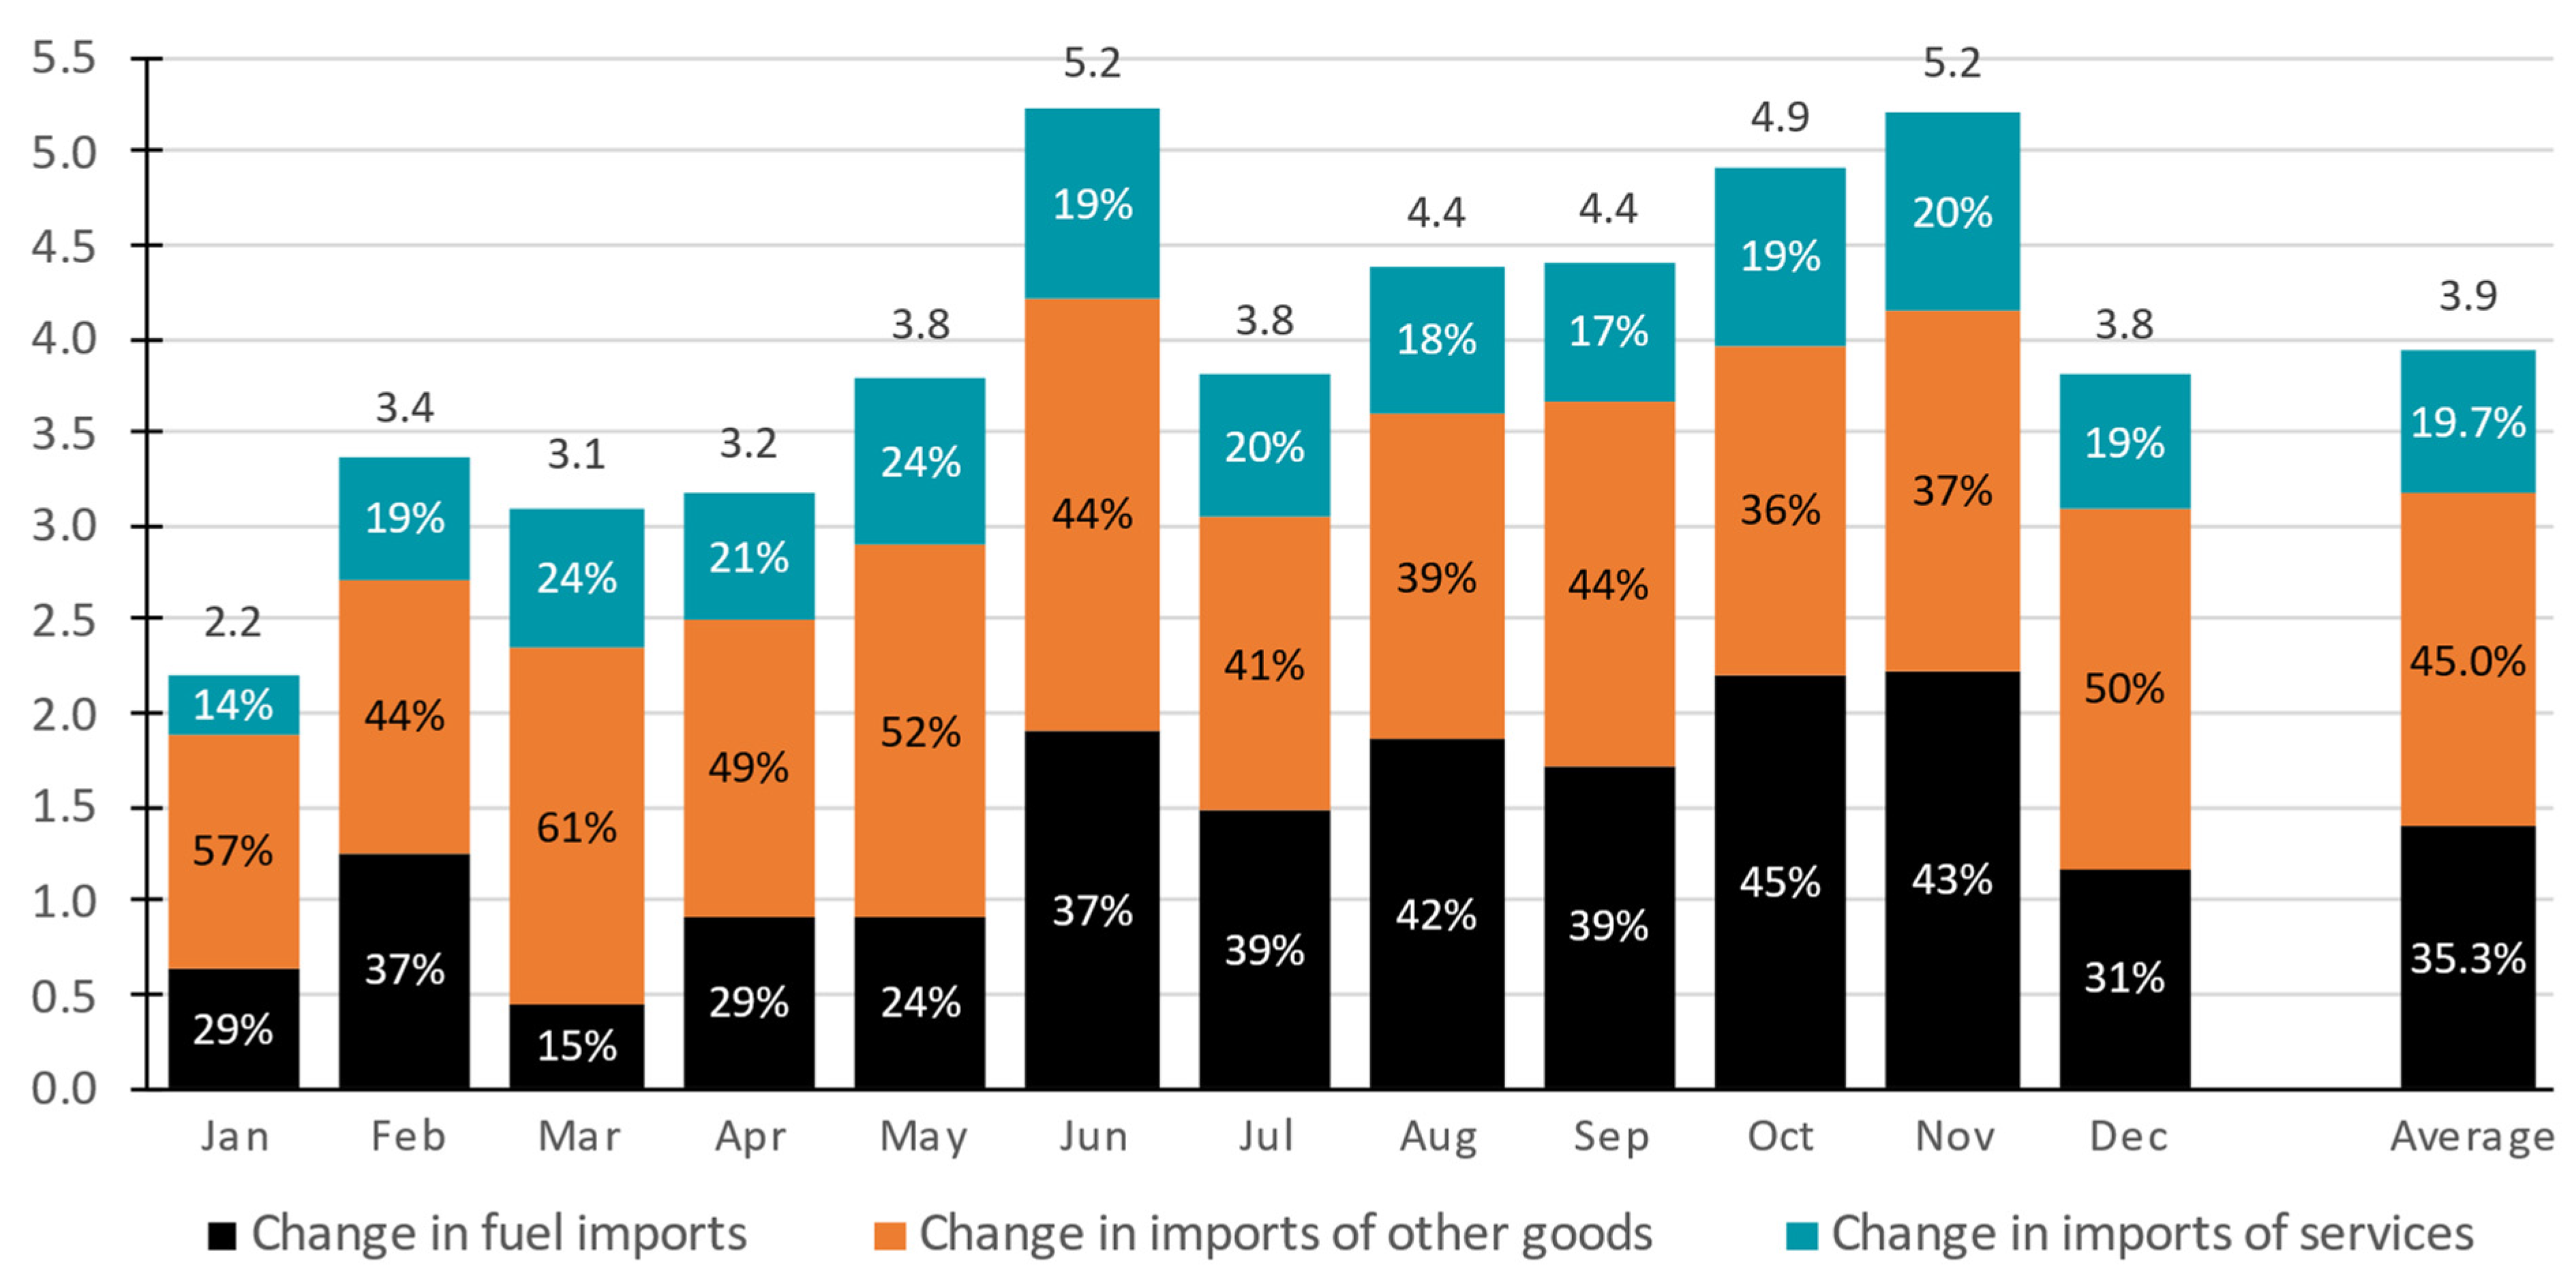
8. Conclusions
Author Contributions
Funding
Conflicts of Interest
| 1 | The entire analysis contained in this paper is based on open data from as late as 15 February 2024. |
| 2 | Throughout this paper, we use estimates and predictions by the European Commission, available in the AMECO database. There are a multitude of other estimates/forecasts, using macroeconomic models specific to Greece, from domestic institutions, e.g., the Bank of Greece, the systemic banks, the Centre of Planning and Economic Research (KEPE) and academic research groups. AMECO was selected on the basis of the open access of all estimated variables and indicators necessary for the present analysis. |
| 3 | It should be noted that these three bailout programs were not undertaken for the benefit of Greece alone. The official default of a Eurozone member state would set a very negative precedent for the edifice of the monetary union, with obvious implications in terms of trust in the common currency and the EU and would expose other member states with high debt/GDP ratios or significant external imbalances to similar risks. A destabilization of the euro area could also have repercussions for the global economy as a whole. For these reasons, Greece should have been rescued, but at the same time, Greece should also have set an example to be avoided. These factors led to “bitter” bailout programs, combined with very strict fiscal austerity that inevitably resulted in a deepening of the economic recession. |
| 4 | For a general overview of the current assessment of the Greek economy by international organizations, see European Commission and Directorate-General for Economic and Financial Affairs (2023a, 2023c), and OECD (2023). |
| 5 | Regarding the other three periods of great recession of the UK’s in modern history, its recession during the period of the “Great Depression” did not exceed 5.4% cumulatively and had been overcome by 1934; during the war and post-war period of 1944–1951, it did not exceed 12.2% cumulatively and lasted 7 years; and during the financial crisis of 2007–2008, it did not exceed 4.9% cumulatively and lasted 5 years. |
| 6 | According to the latest data by ELSTAT (the Hellenic Statistical Authority) and Eurostat, Greek GDP in the third quarter of 2023, with a calendar and seasonal correction and in 2015 values, was EUR 48.7 billion. This amount is equivalent to an annual GDP of EUR 194.8 billion in 2015 values, which is approximately equal to 81.5% of 2008 GDP in 2015 values. |
| 7 | For a more detailed analysis of the Ireland case, see the relevant case study by diaNEOsis: Mitsos and Linardatou (2019). |
| 8 | |
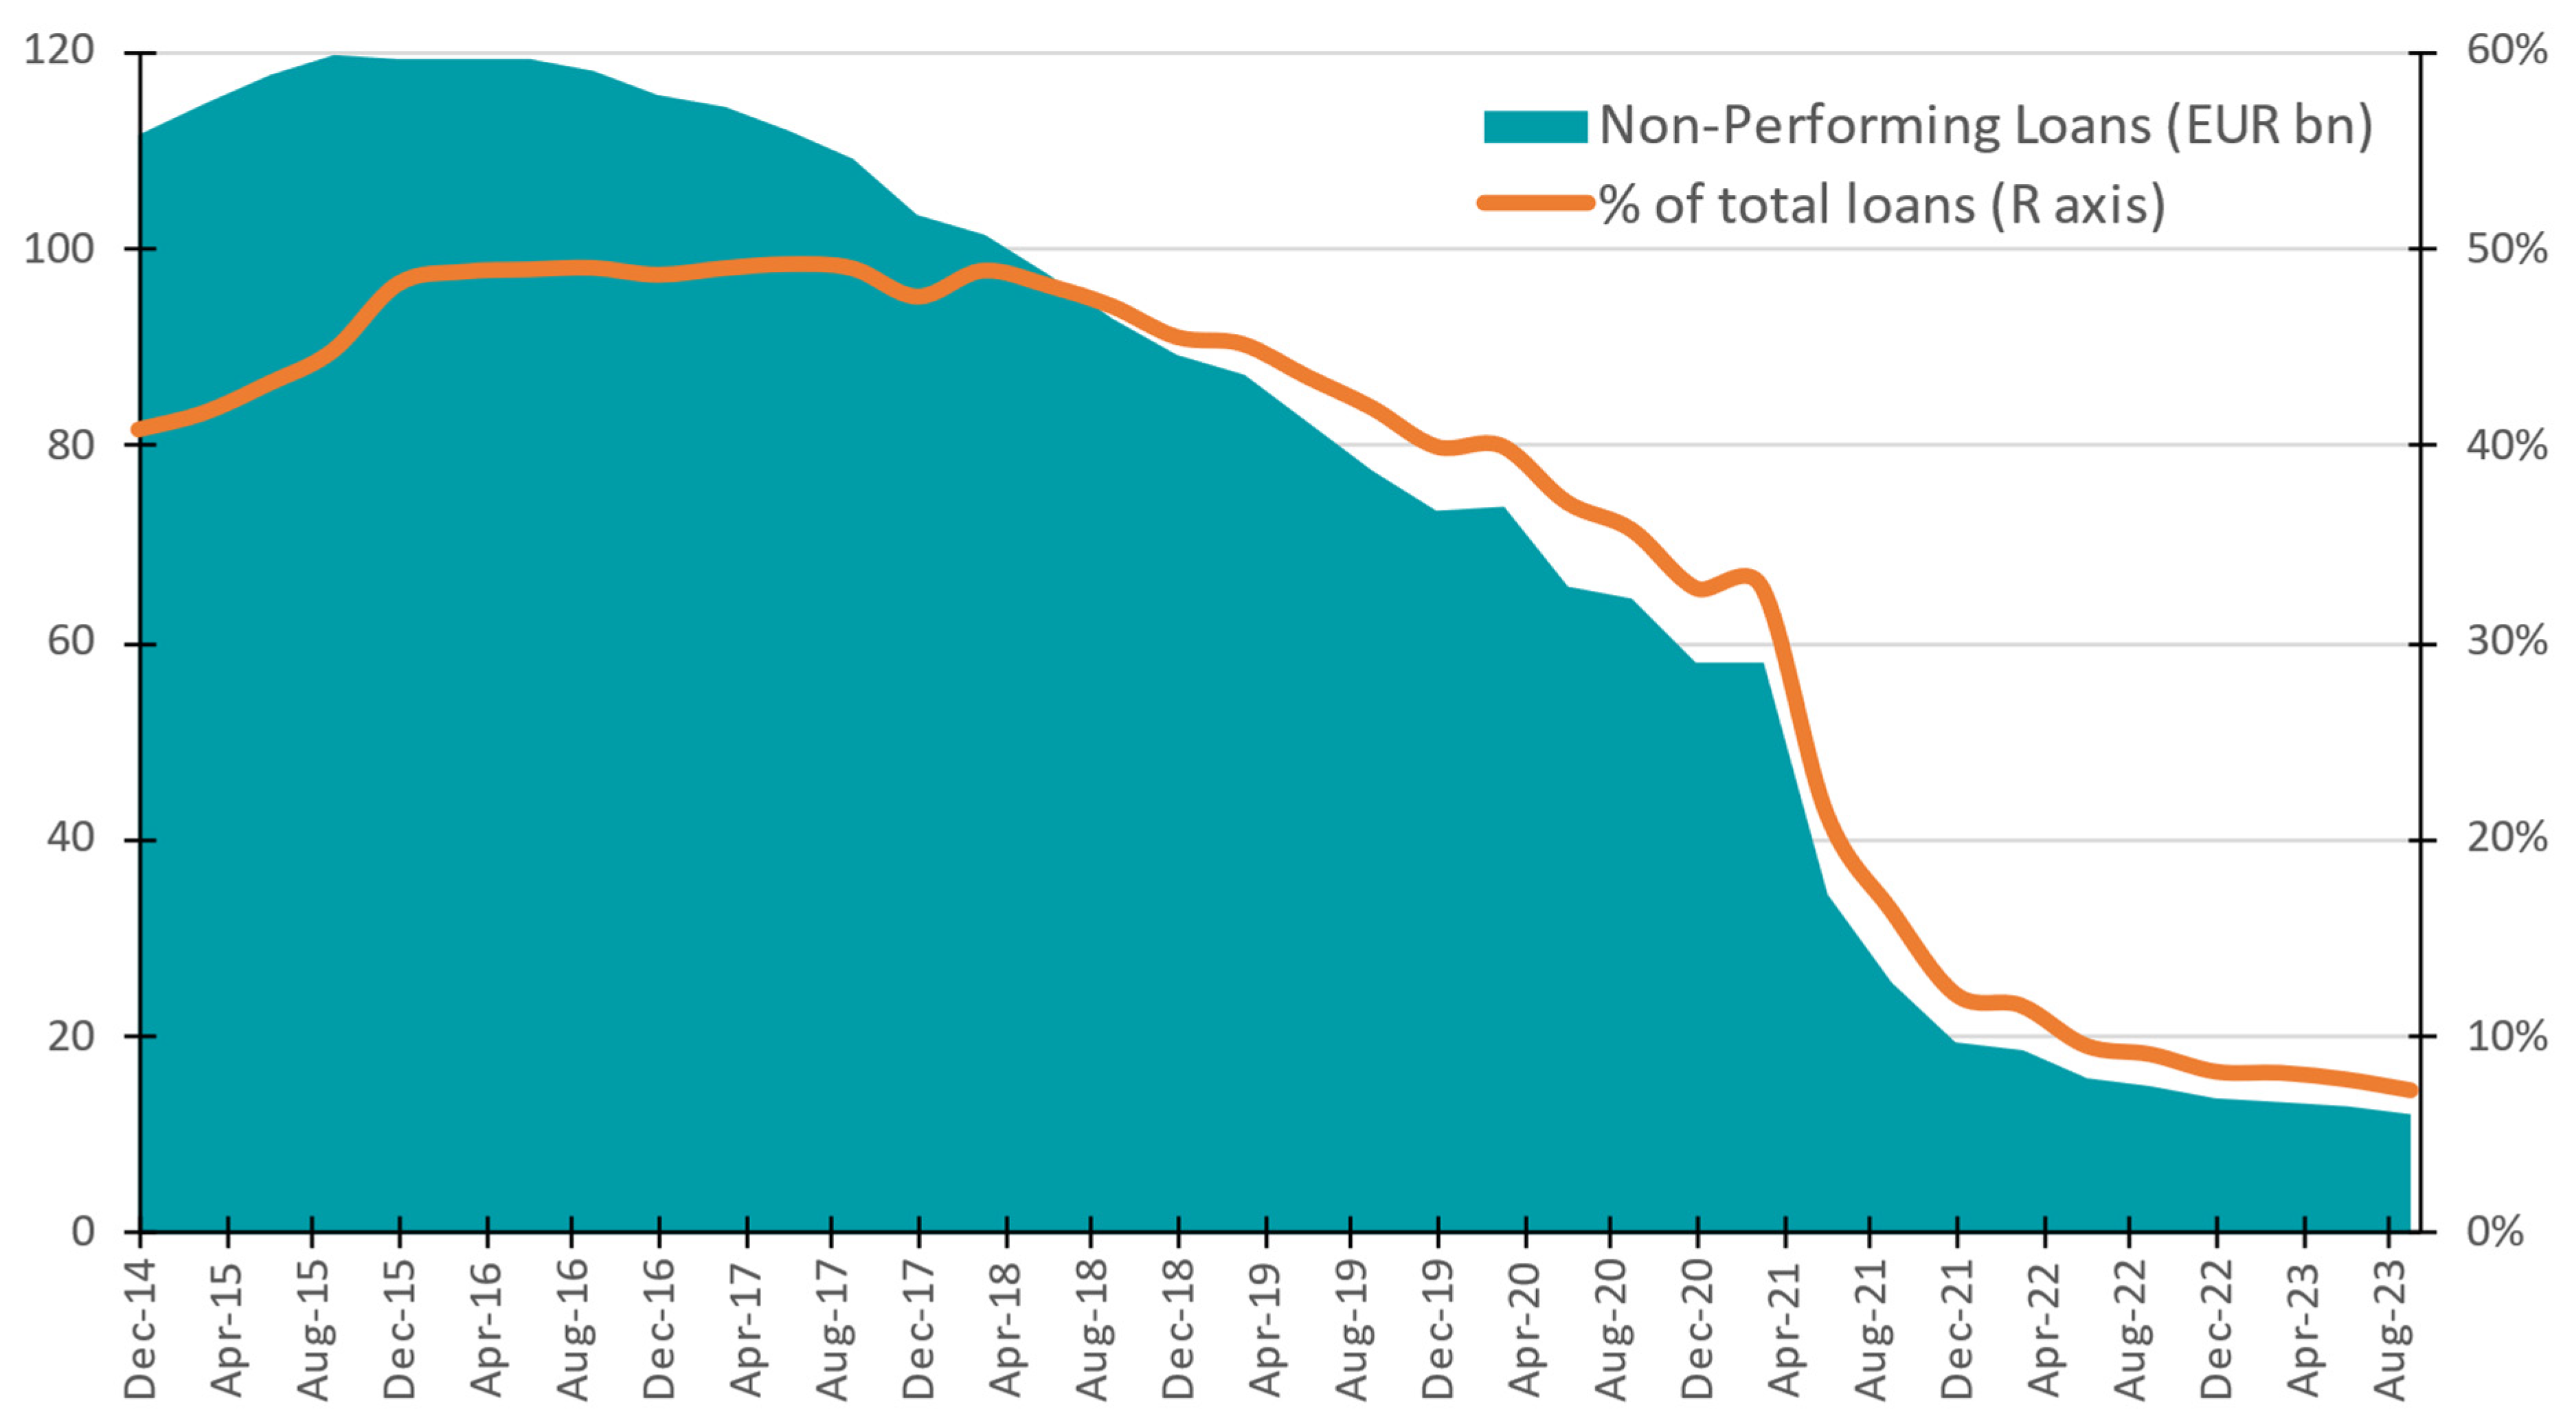
| 9 | This reference focuses only on the depreciation due to the underemployment and/or the preservation in an inactive state. The constant and usual depreciation and decrease in physical and human capital is not included here. |
| 10 | As an indicative example regarding employment, according to the annual data of the Labor Force Survey of ELSTAT, in 2019, the labor force of the country was smaller by approximately 311 thousand people in comparison with the 2009 level, an alteration of 6.2%. |
| 11 | Data from the diaNEOsis research: Matsagganis et al. (2018). |
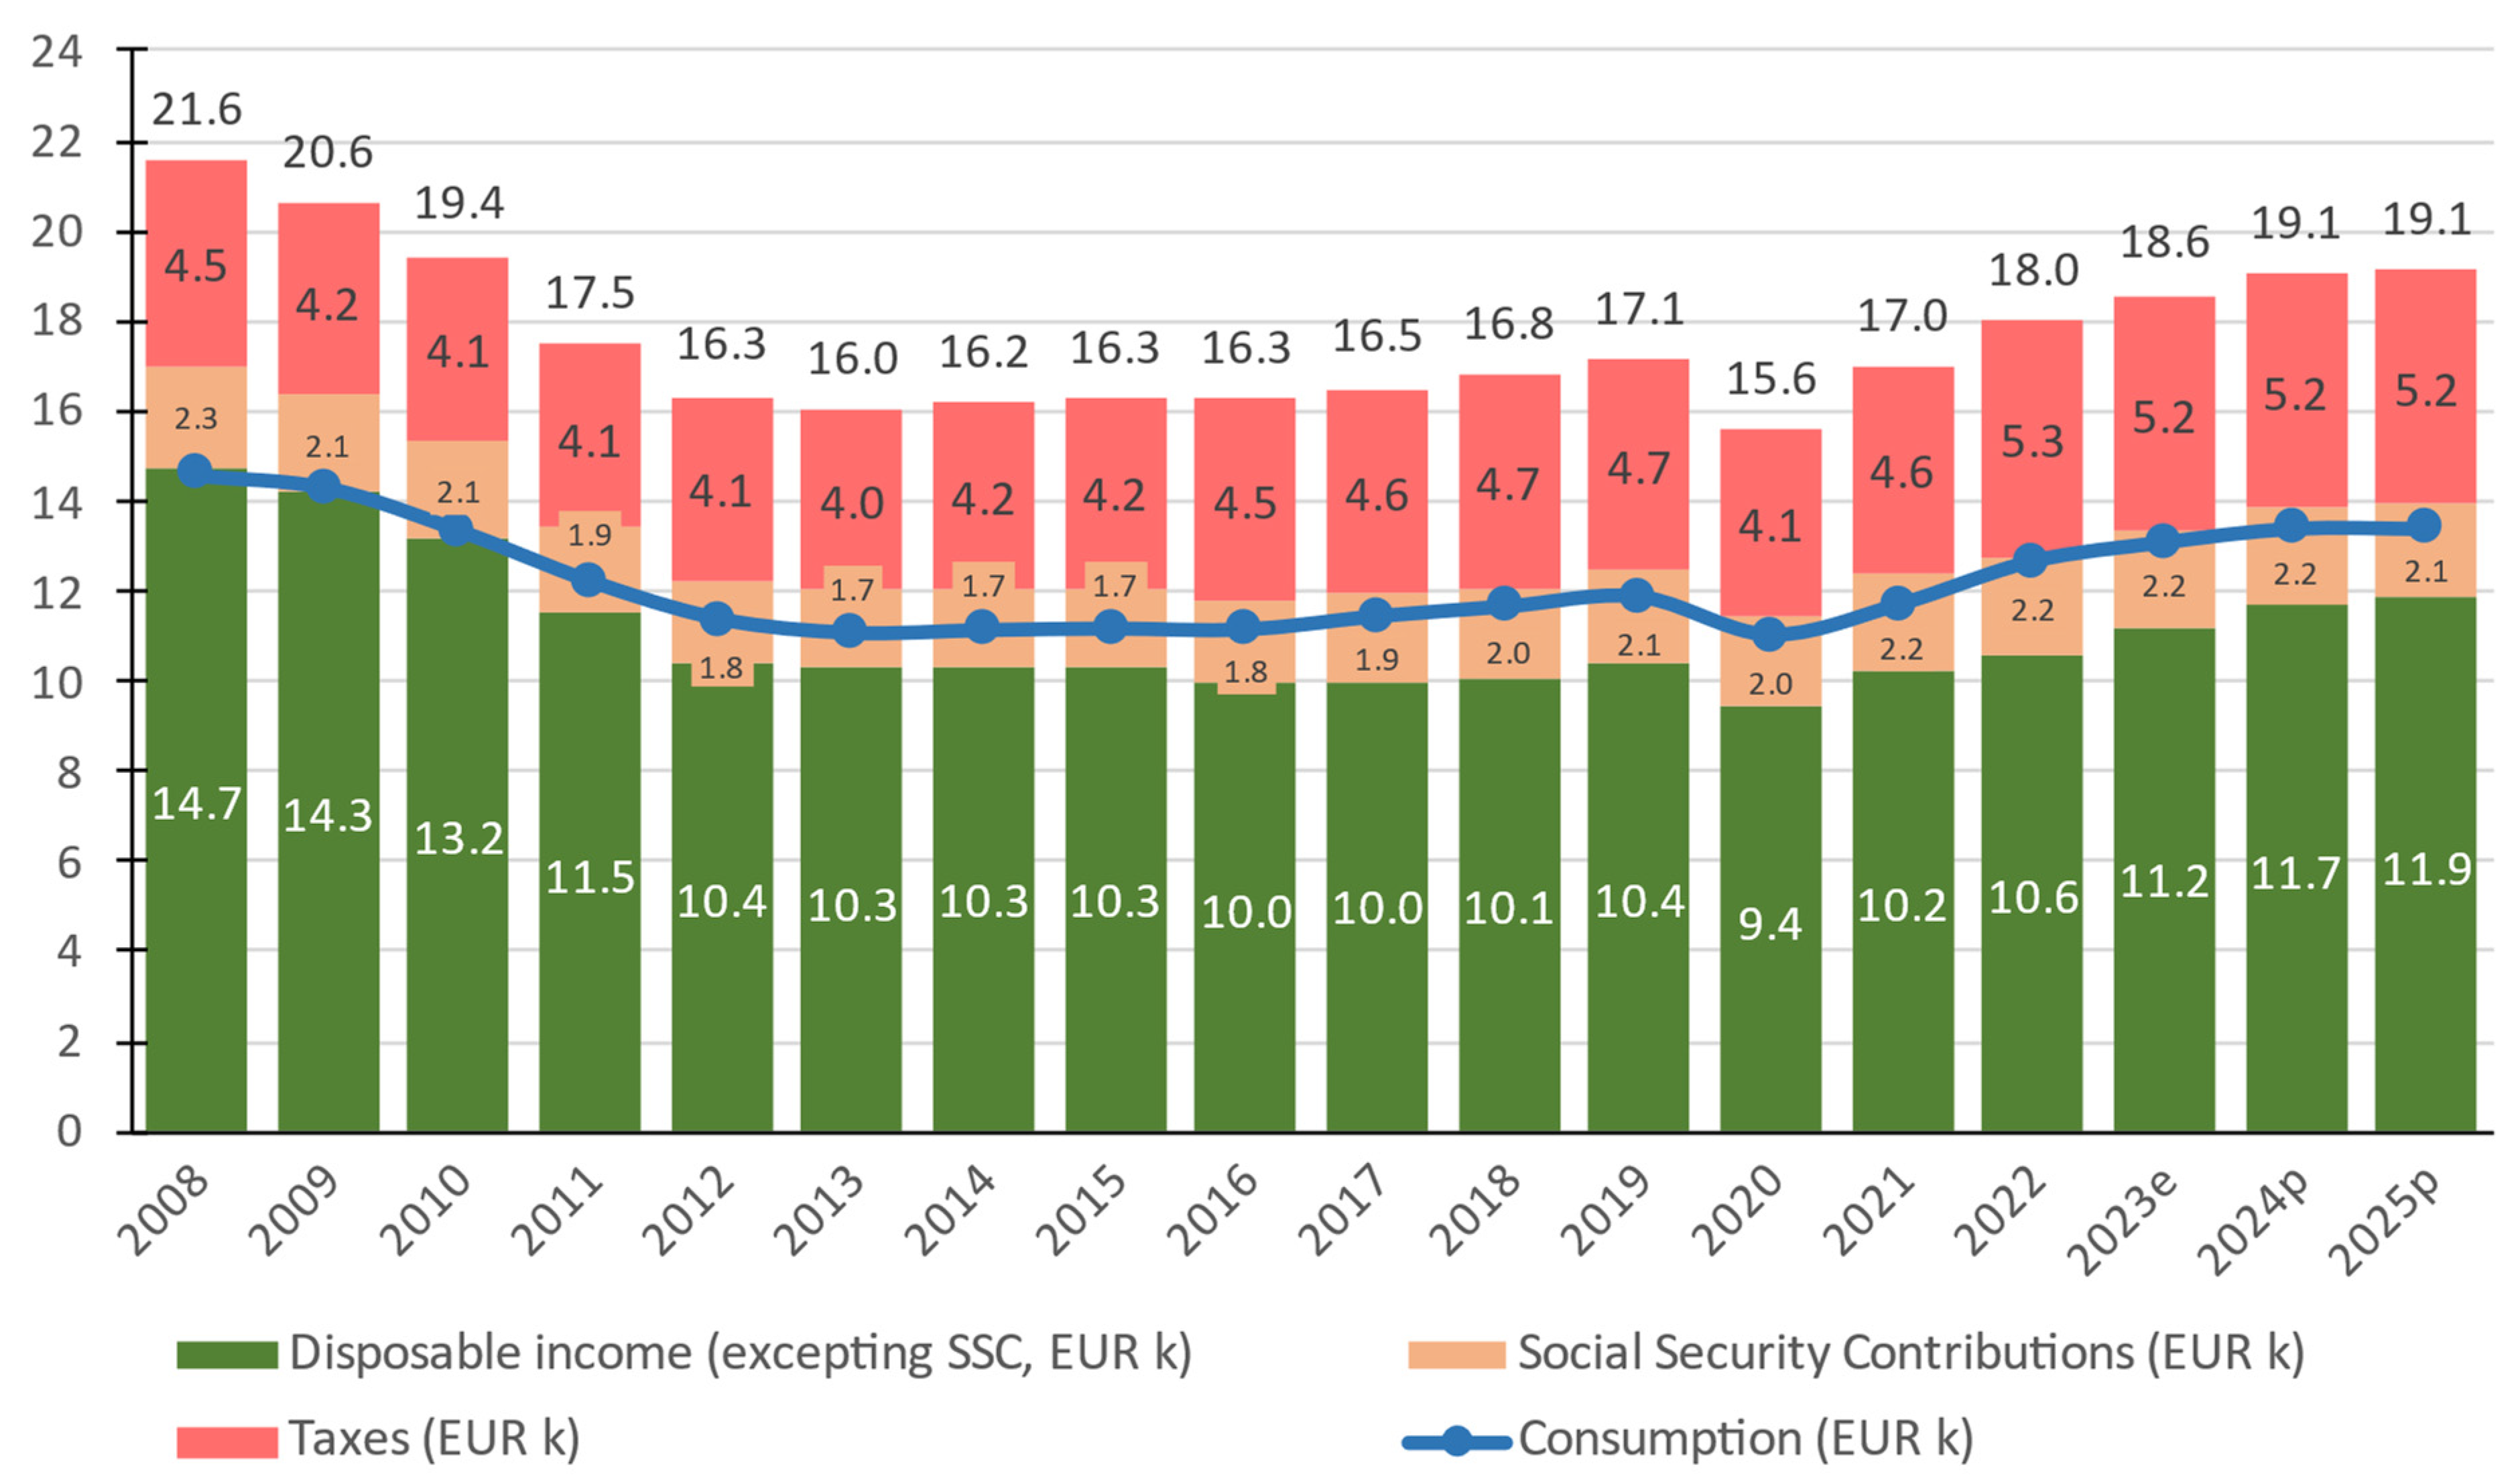
| 12 | As this analysis seeks a diachronic comparison of the consumption expenditure with the disposable income, we have chosen to ignore—and therefore, not to exclude—the share of social security contributions that is not returned to the private economy as pensioners’ income. The reason is that it would significantly increase the complexity of the analysis, without any real benefit. The same applies to the inclusion of urgent state aid to the insurance funds, which is of course a net flow from taxes to pensions. These calculations are therefore only of value in a diachronic comparison and not as absolute amounts. |
| 13 | In fact, in 2022, the share of per capita consumption in per capita disposable income (with contributions) reached an all-time high of 99% and the remaining per capita savings reached an all-time low of EUR 127. |
| 14 | These 14 categories correspond to the NACE rev.2 classification as follows ([group]: [NACE rev.2 codes]): agriculture, forestry and fishing: A; manufacturing: C; energy (excluding oil products), water and telecommunications: D, E and J61; construction: F; wholesale and retail trade: G; transportation and storage: H; accommodation and food service: I; financial and insurance activities (excluding social security): K; real estate activities: L; professional and administrative/support service activities: M and N; public administration, defense and compulsory social security: O; education: P; human health and social work activities: Q; other: B, J58-J60, J62, J63, R, S, T and U. |
| 15 | This analysis as a whole has been conducted at constant prices (2015) and is therefore about real changes. |
| 16 | The entire air transport sector—including freight transport—which depends on tourism to a higher degree, has a GVA that does not exceed EUR 771 million or 0.48% of total GVA (the highest achieved in 2018). |
| 17 | See Figure 13 in the next section. |
| 18 | We exclude from this phrase the trade policy instruments that have been used over time for CAB improvement, such as import duties and export subsidies, as their use is not free in member countries of customs or economic unions, as is the case of Greece. |
| 19 | According to the balance of payment statistics (BOP) methodology by the Bank of Greece. This does not apply on a national accounting basis. |
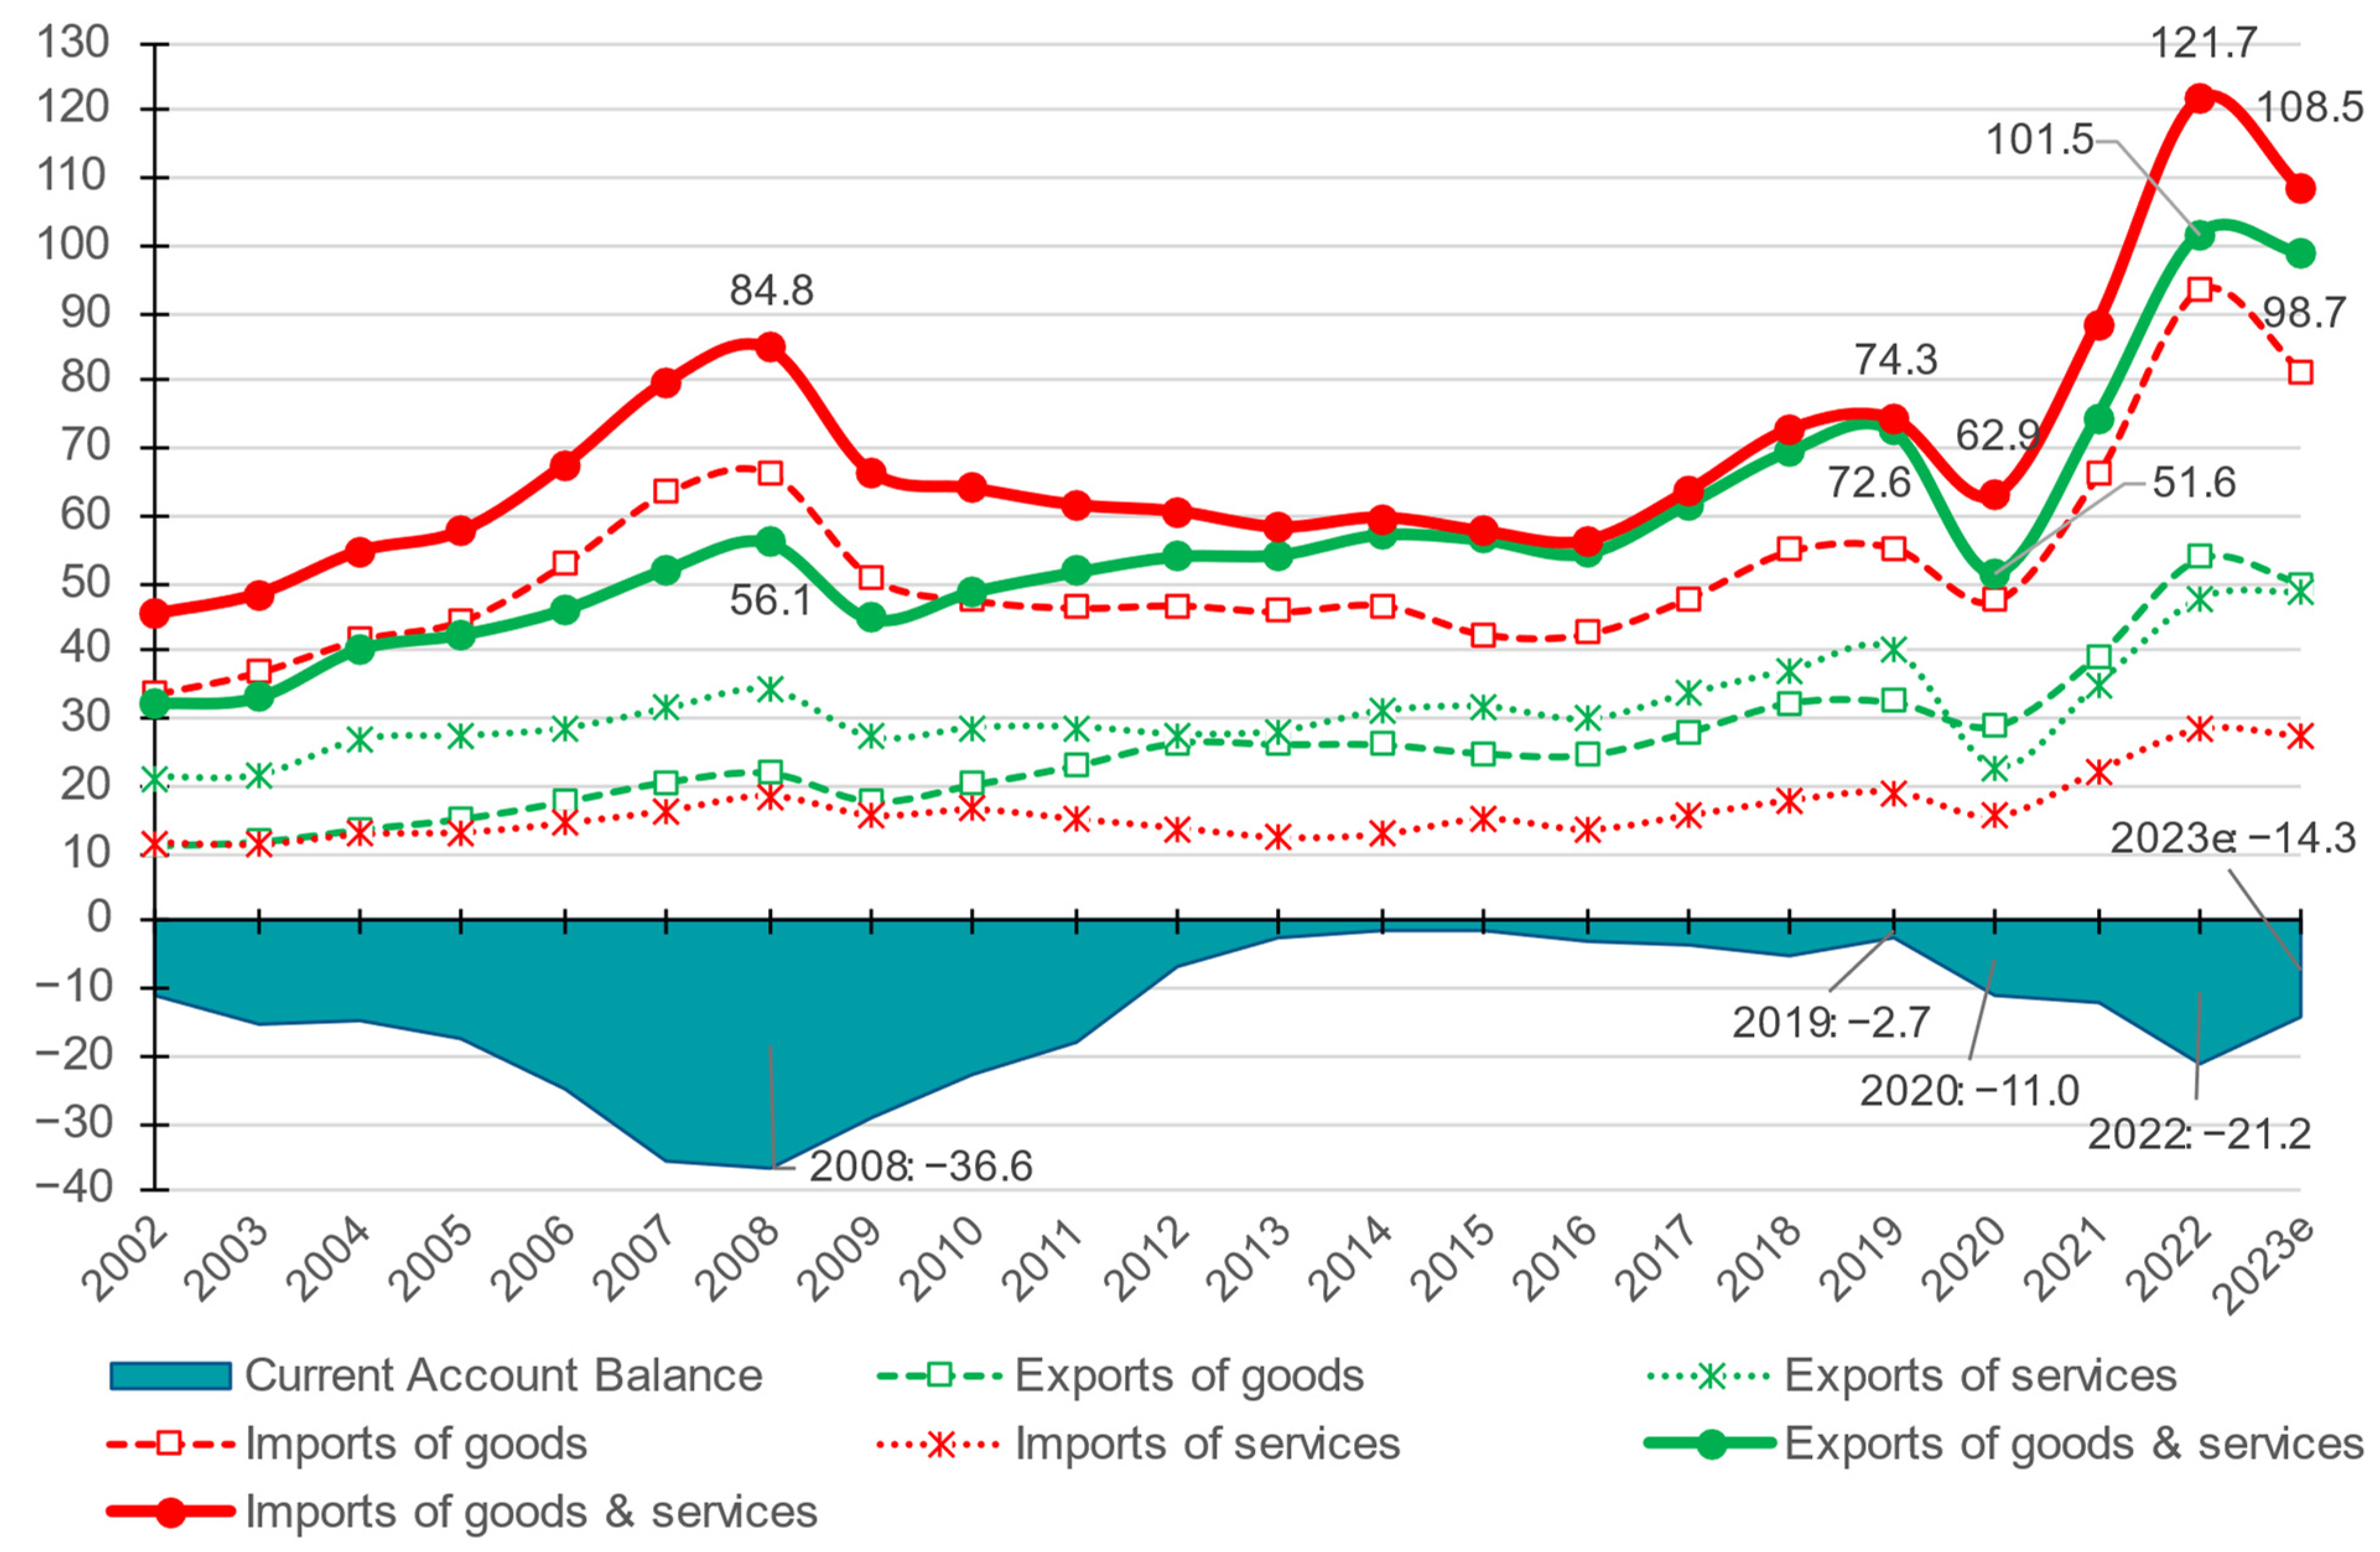
| 20 | In all election years of this specific period, that is, 1981, 1985, 1989, 1990, 1996 and 2000, except for the year 1993, the CAB deteriorated significantly. |
| 21 | From travel collections from abroad alone, there was a loss of EUR 13.9 billion compared to 2019 (−76%). Of course, travel payments to foreign countries also decreased by around EUR 2 billion (−71%). Therefore, the travel balance showed a loss of almost EUR 12 billion in 2020 compared to 2019 (−77%). |
| 22 | Exports of goods decreased by EUR 3.5 billion compared to 2019 (−10.9%), whereas imports of goods decreased by EUR 7.8 billion (−14.2%). |
| 23 | Examples of such factors can be the recent pandemic and previous, less severe pandemics (e.g., SARS in 2004, the bird flu in 2007), various international developments (such as wars or turmoil in nearby or competitive—from a tourism point of view—countries, and financial difficulties in countries of origin), international or domestic terrorism, migration crises, etc. |
| 24 | For a more detailed analysis of this issue and relevant proposals, see relevant studies by diaNEOsis: diaNEOsis and ISPM (2019) and Vaggelas et al. (2021). |
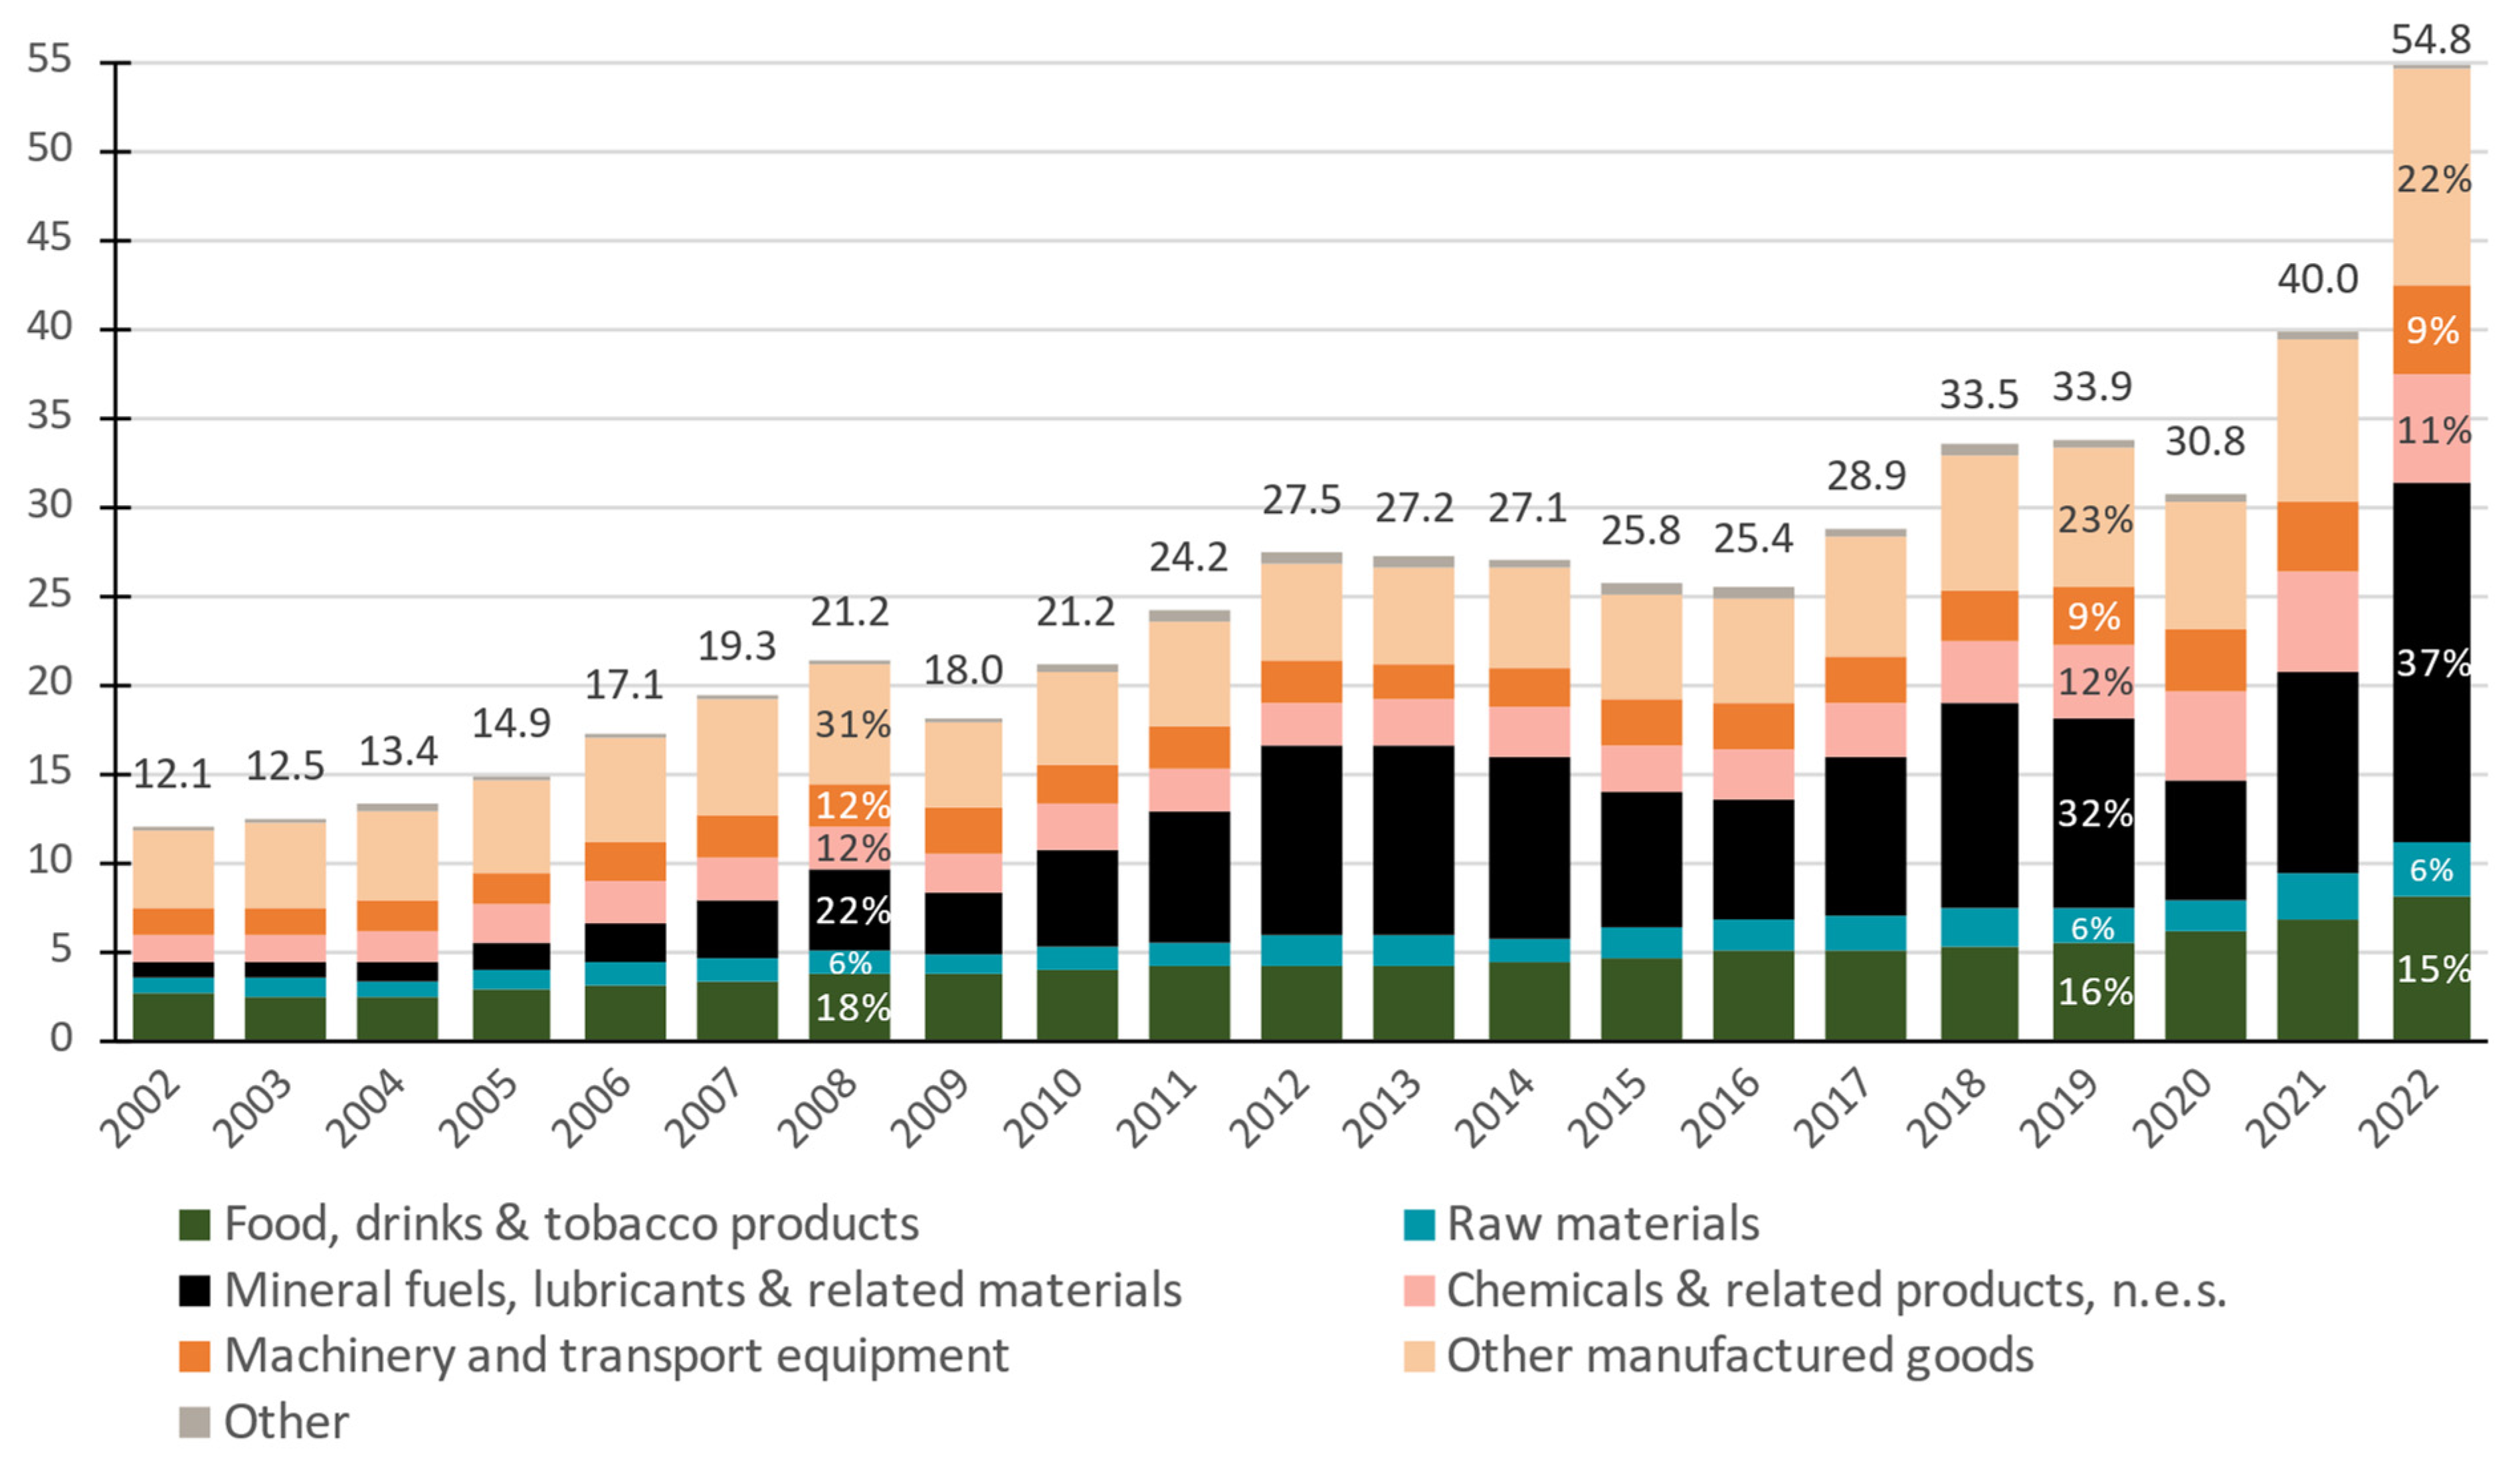
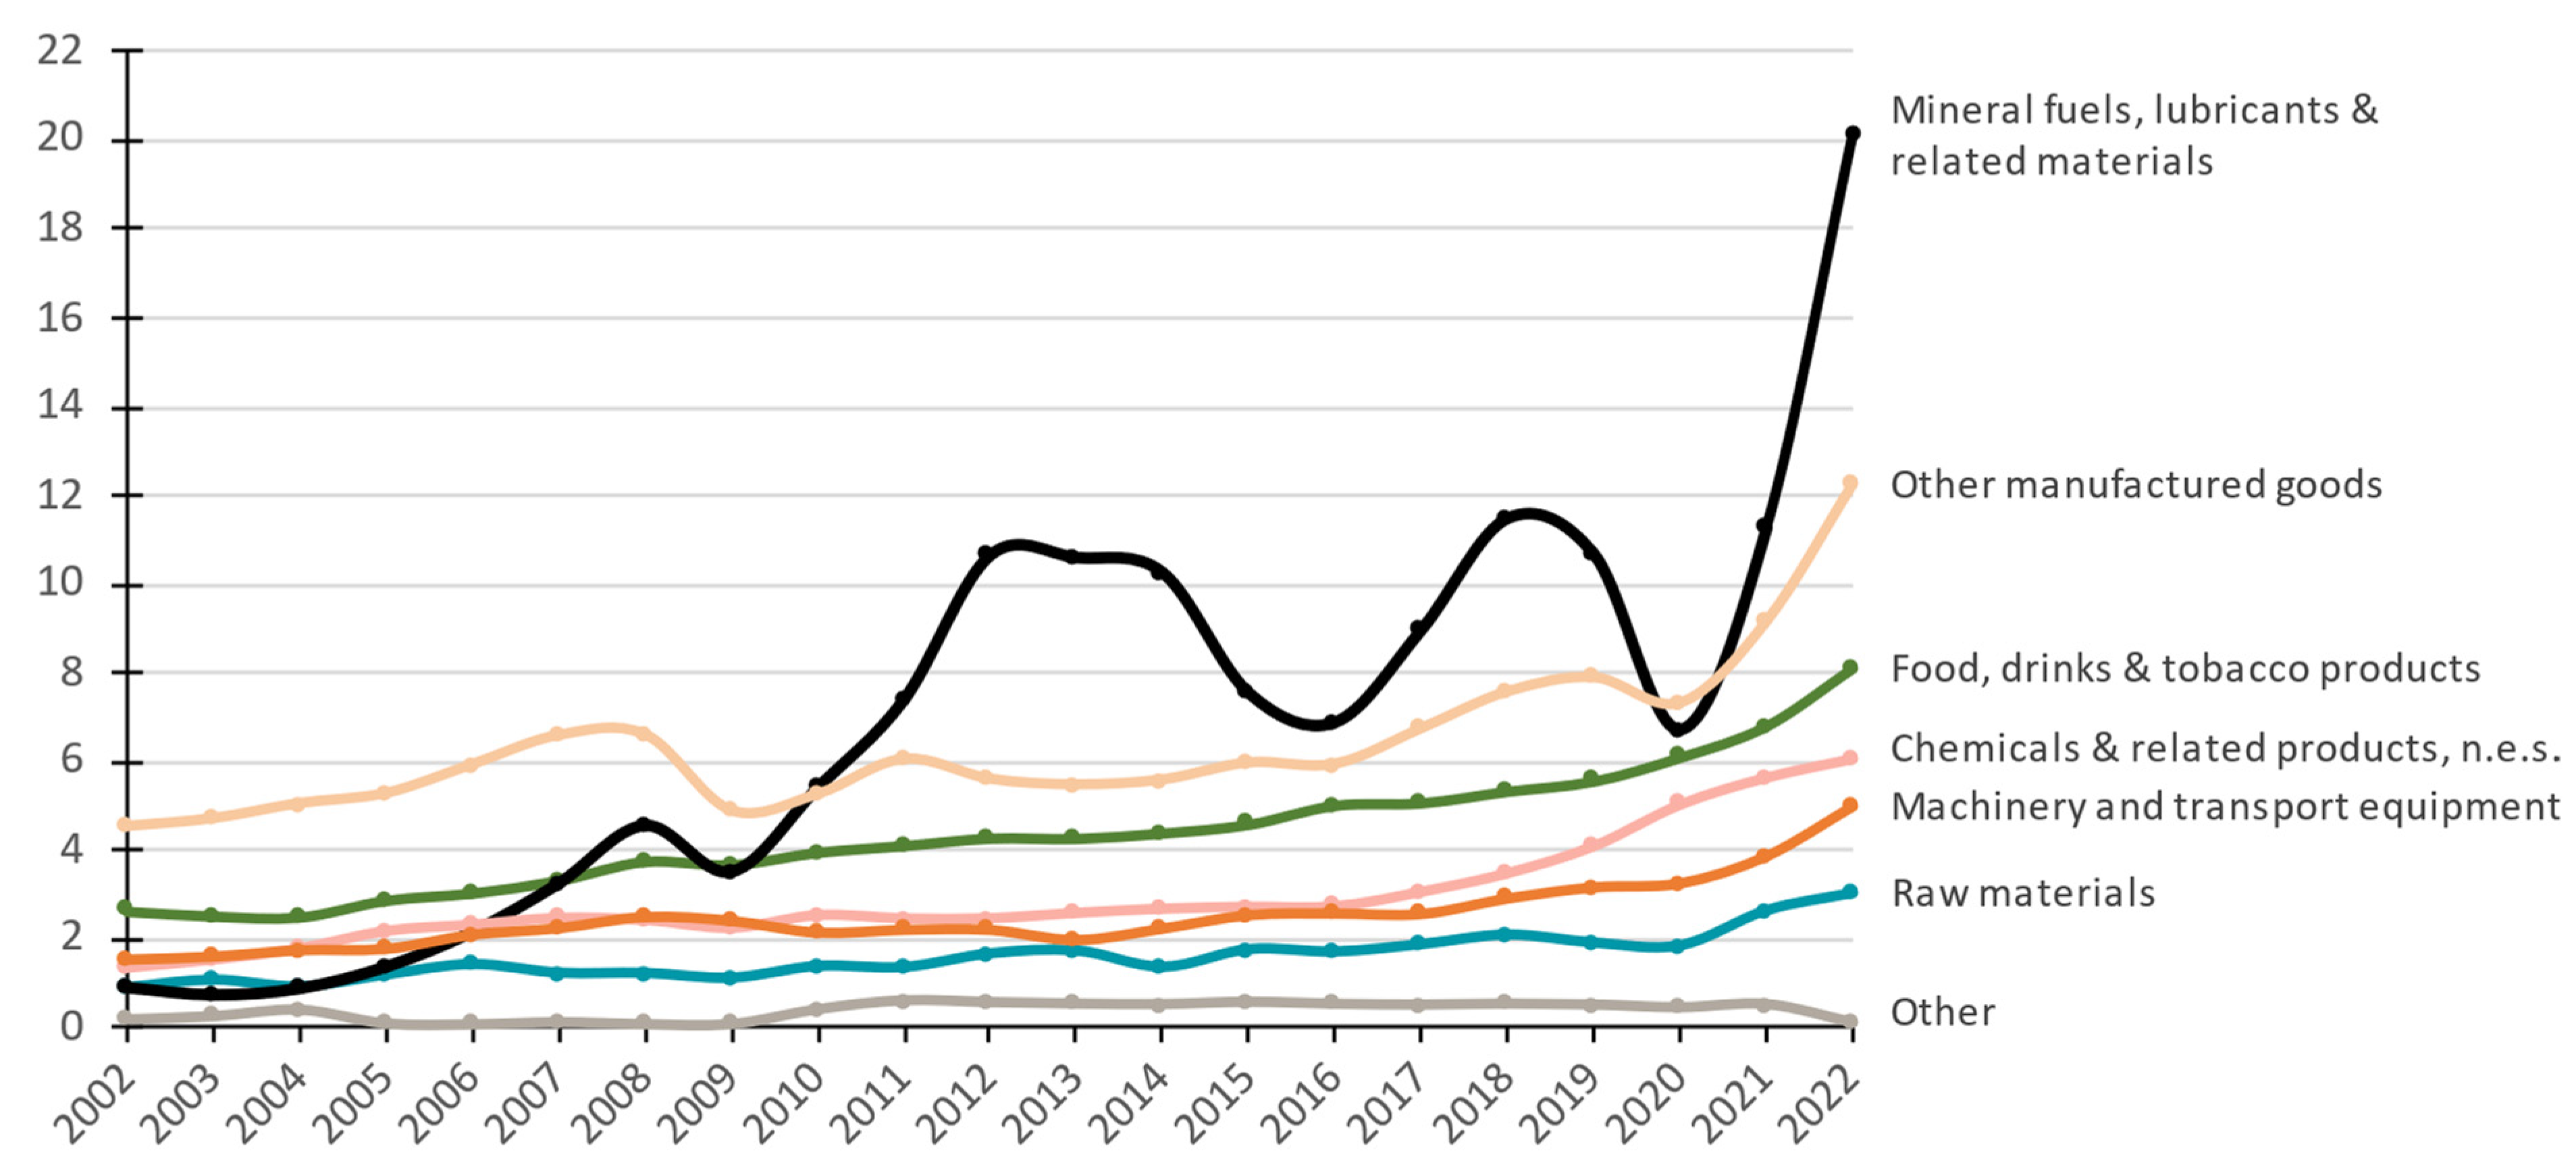
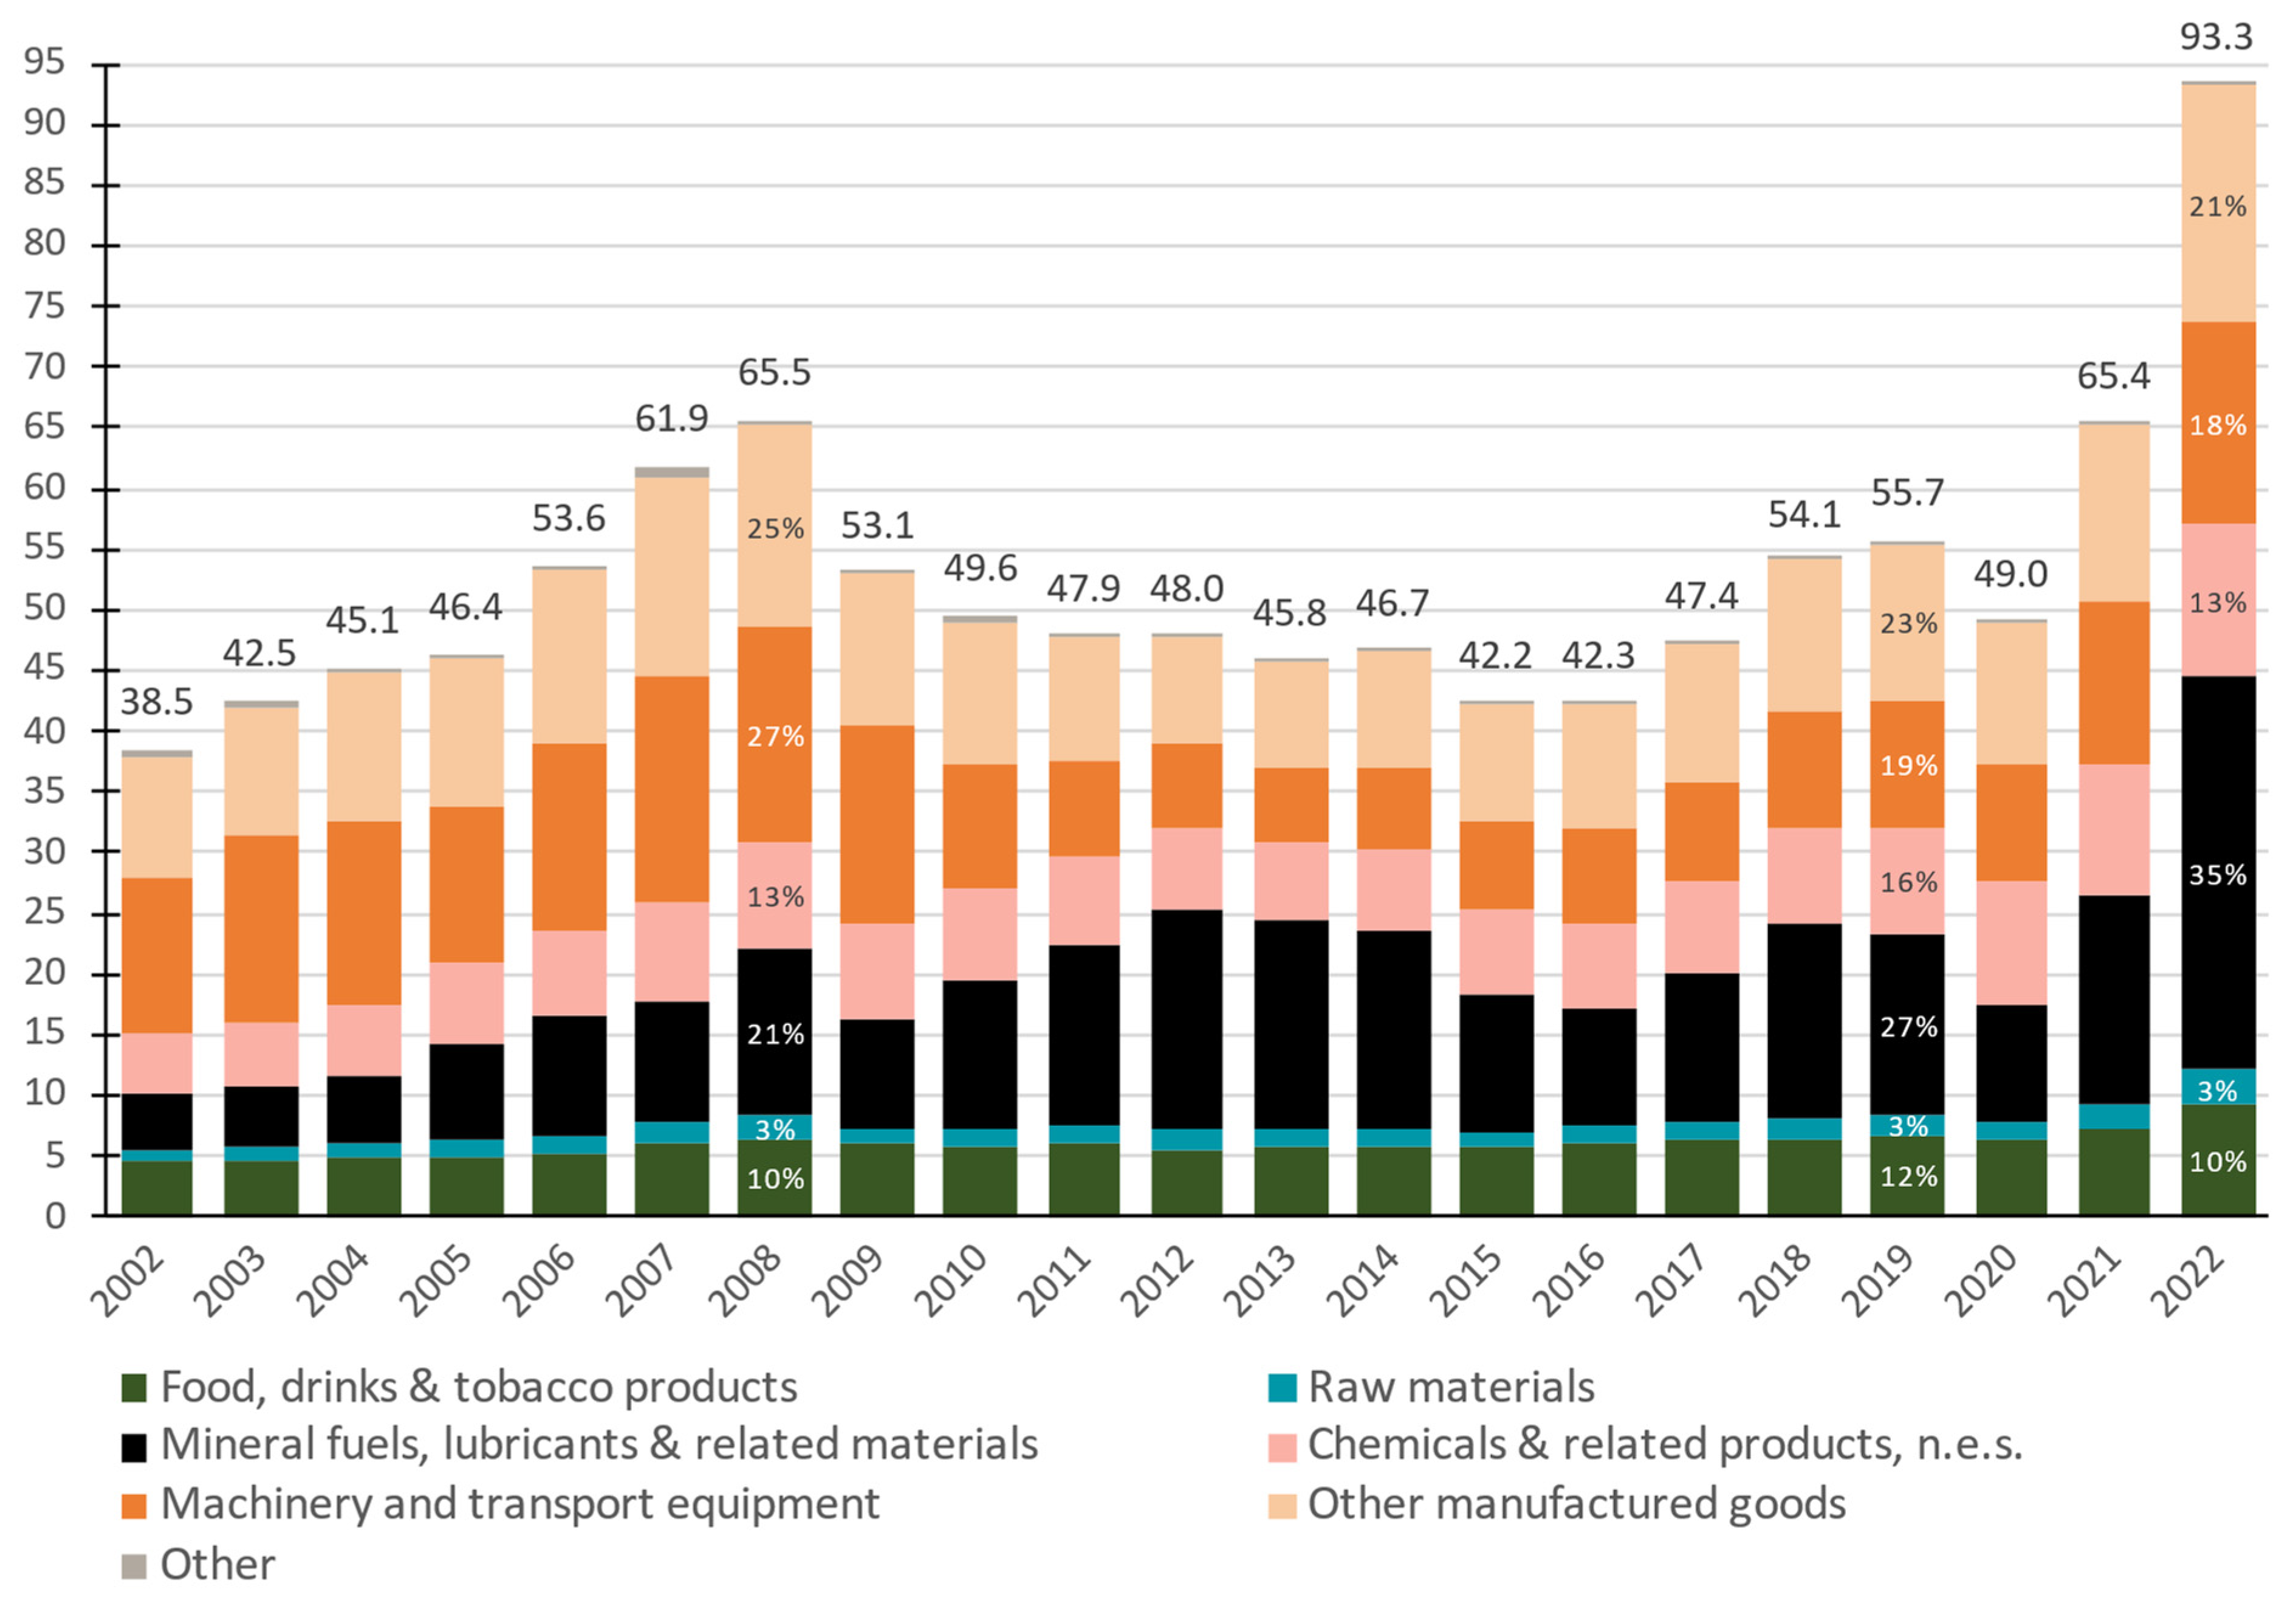
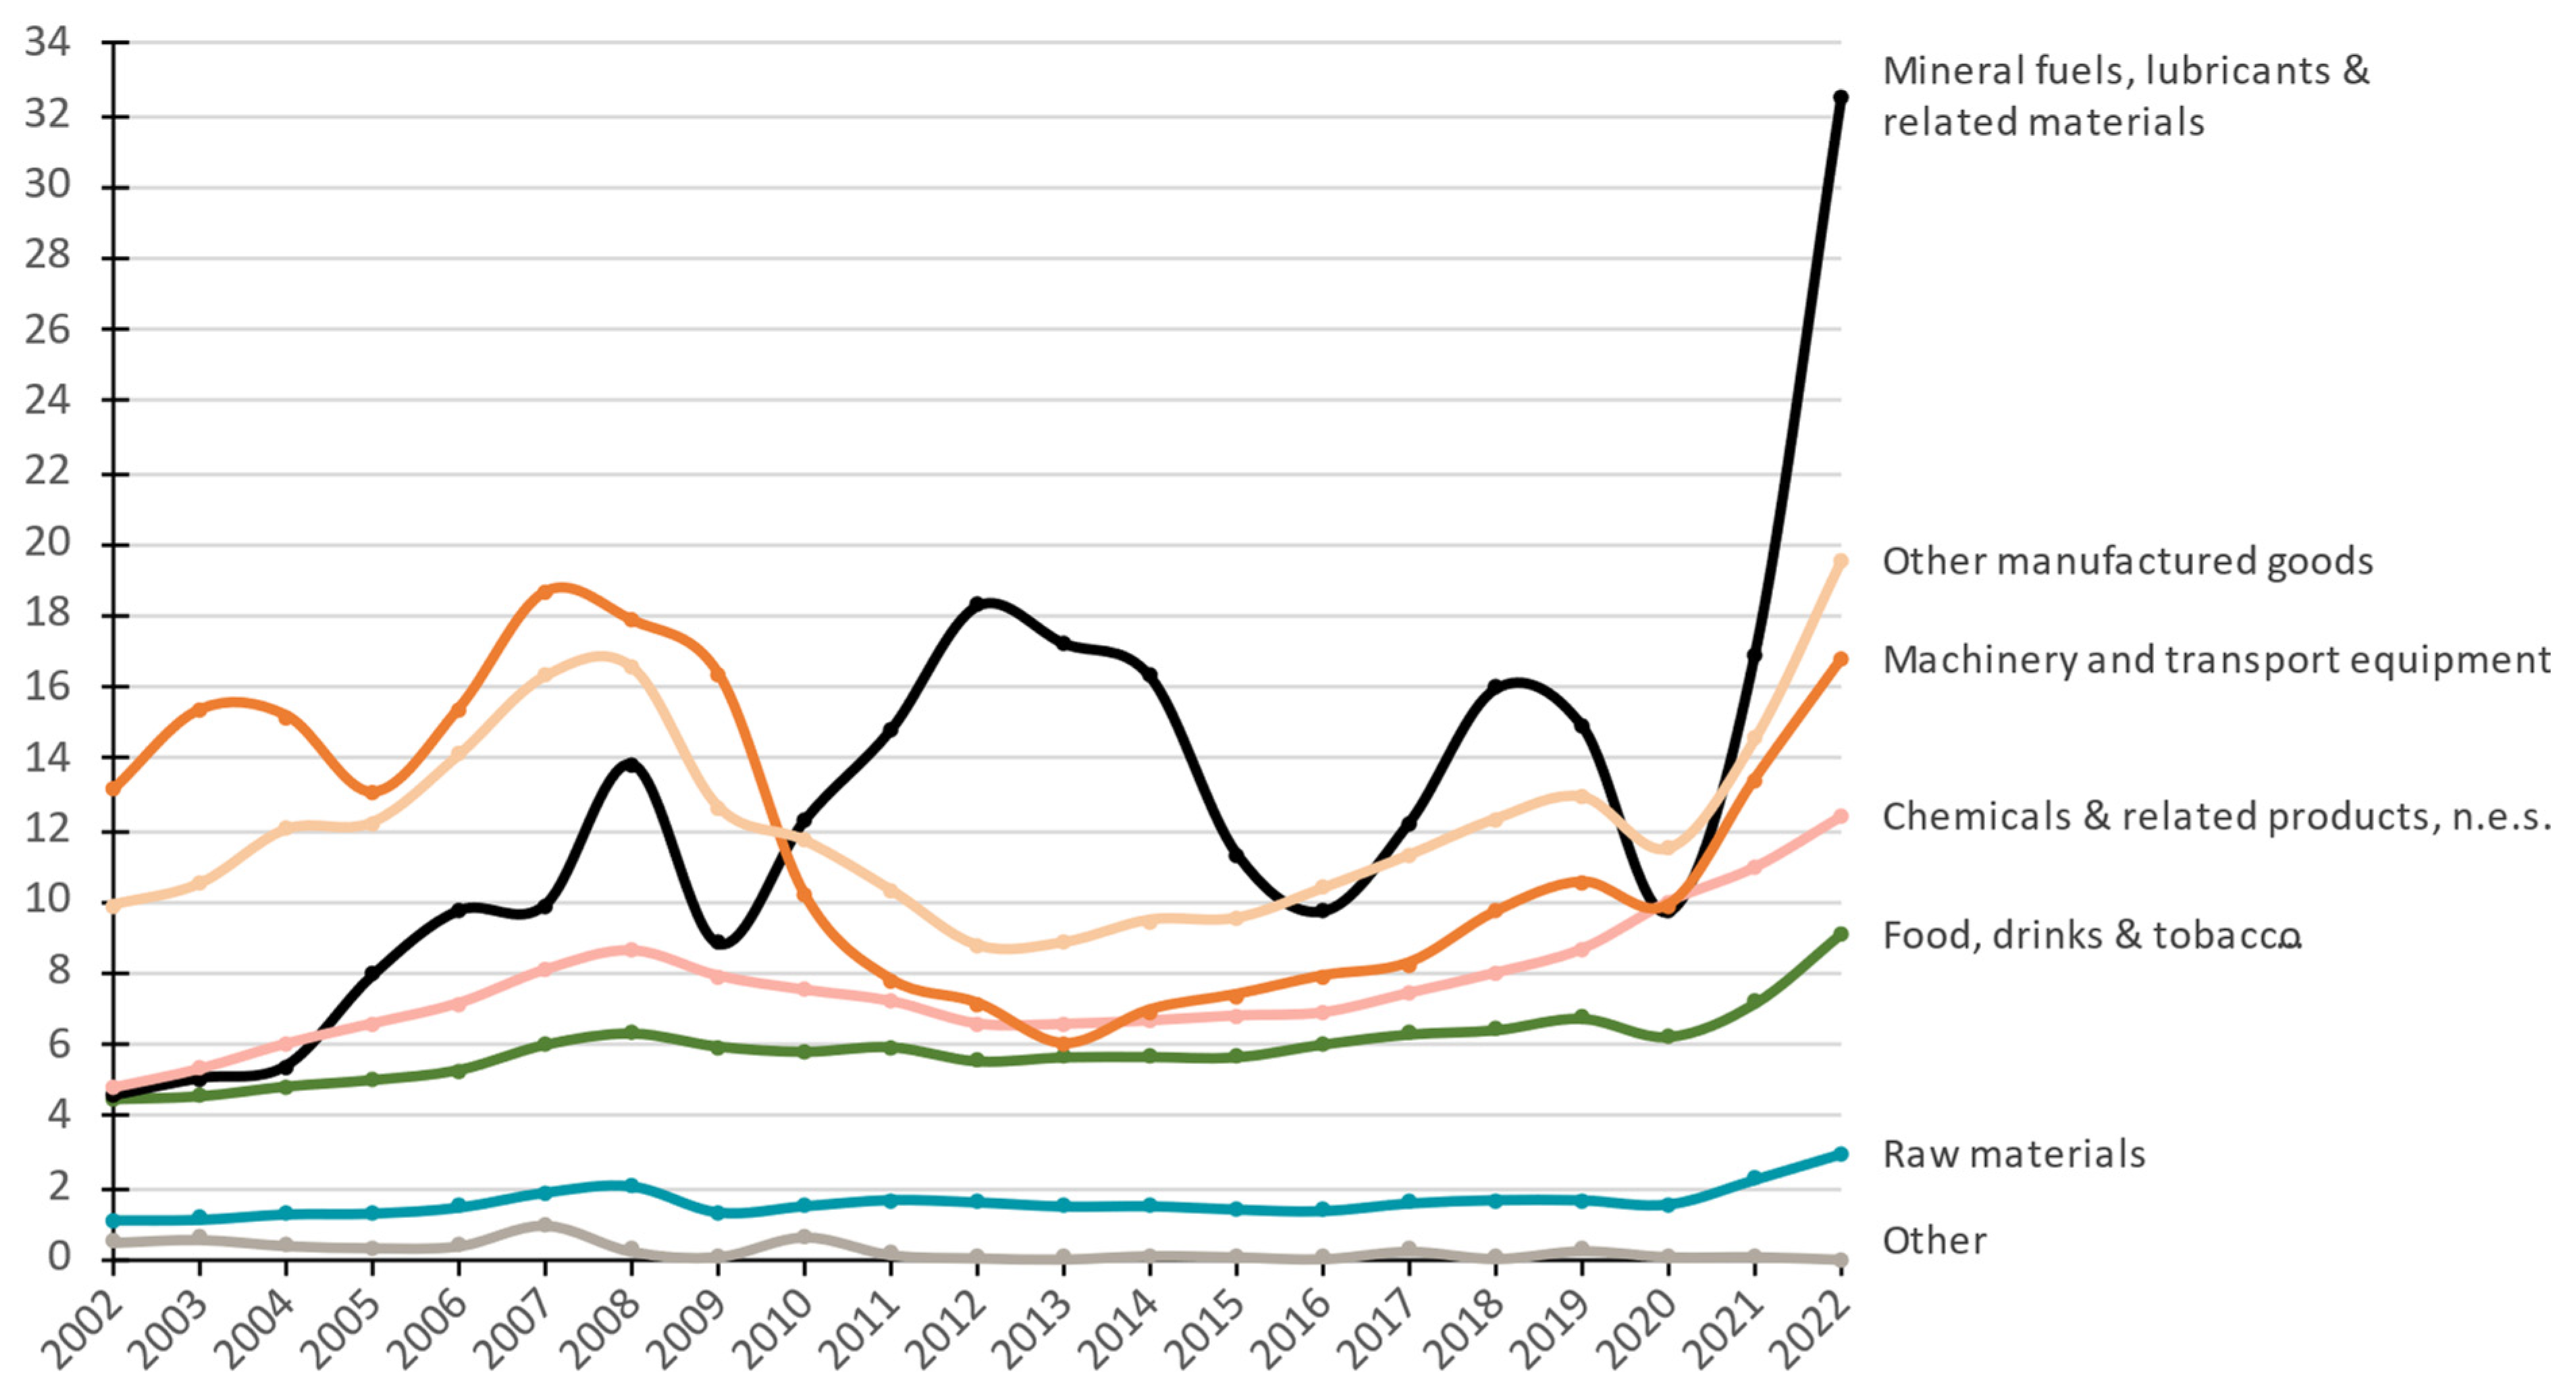
| 25 | Specifically, “food, drinks and tobacco products”: SITC0 and SITC1; “raw materials”: SITC2 and SITC4; “mineral fuels, lubricants and related materials”: SITC3; “chemicals and related products, n.e.s.”: SITC5; “machinery and transfer equipment”: SITC7; “other manufactured goods”: SITC6 and SITC8; and “other”: SITC9. |
| 26 | Specifically on the issue of R&D and innovation in the Greek economy, see the relevant study by diaNEOsis: Kalogirou et al. (2021). |
| 27 | For a detailed mapping of the current situation in the Greek startup ecosystem, see a relevant study by diaNEOsis: Pepelasis et al. (2022). |
| 28 | The average of the three-year period of 2006–2008. We avoid counting the years until 2004, as investment expenditure was increased due to an exogenous need, the preparation of the Olympic Games. We also avoid counting the year 2005, as the reduced investment in this year is partly caused by investment “fatigue”, after a long period of exogenously increased investment, and cautiousness about the course of the Greek economy in the post-Olympic Games era. |
| 29 | Of the total NGEU resources (EUR 750 billion in 2018 constant values), Greece was allocated EUR 29.1 billion from the recovery and resilience facility (RRF—EUR 16.5 billion in grants and EUR 12.6 billion in loans), as well an additional amount of EUR 3 billion from the other NGEU funds. |
| 30 | For the benefits that a well-designed and targeted FDI attraction policy can have, see the case study on Ireland as a role model for Greece, by diaNEOsis: Mitsos and Linardatou (2019). |
| 31 | The first round of recapitalizations was completed in 2013, as a result of private sector involvement (PSI), with EUR 25.5 billion from the Hellenic Financial Stability Fund (HFSF) and EUR 3 billion from private investors. The second round took place in 2014, with EUR 8.3 billion from private investors. The third round took place in late 2015, in the shadow of the referendum, with EUR 5.4 billion from the HFSF and EUR 9 billion from private investors. |
| 32 | The value of the equity capital of the banks was zeroed out twice: in February 2012 and November 2015. |
| 33 | For a better understanding of this level, we indicatively note that the corresponding share at the end of 2008 was 5.7%. |
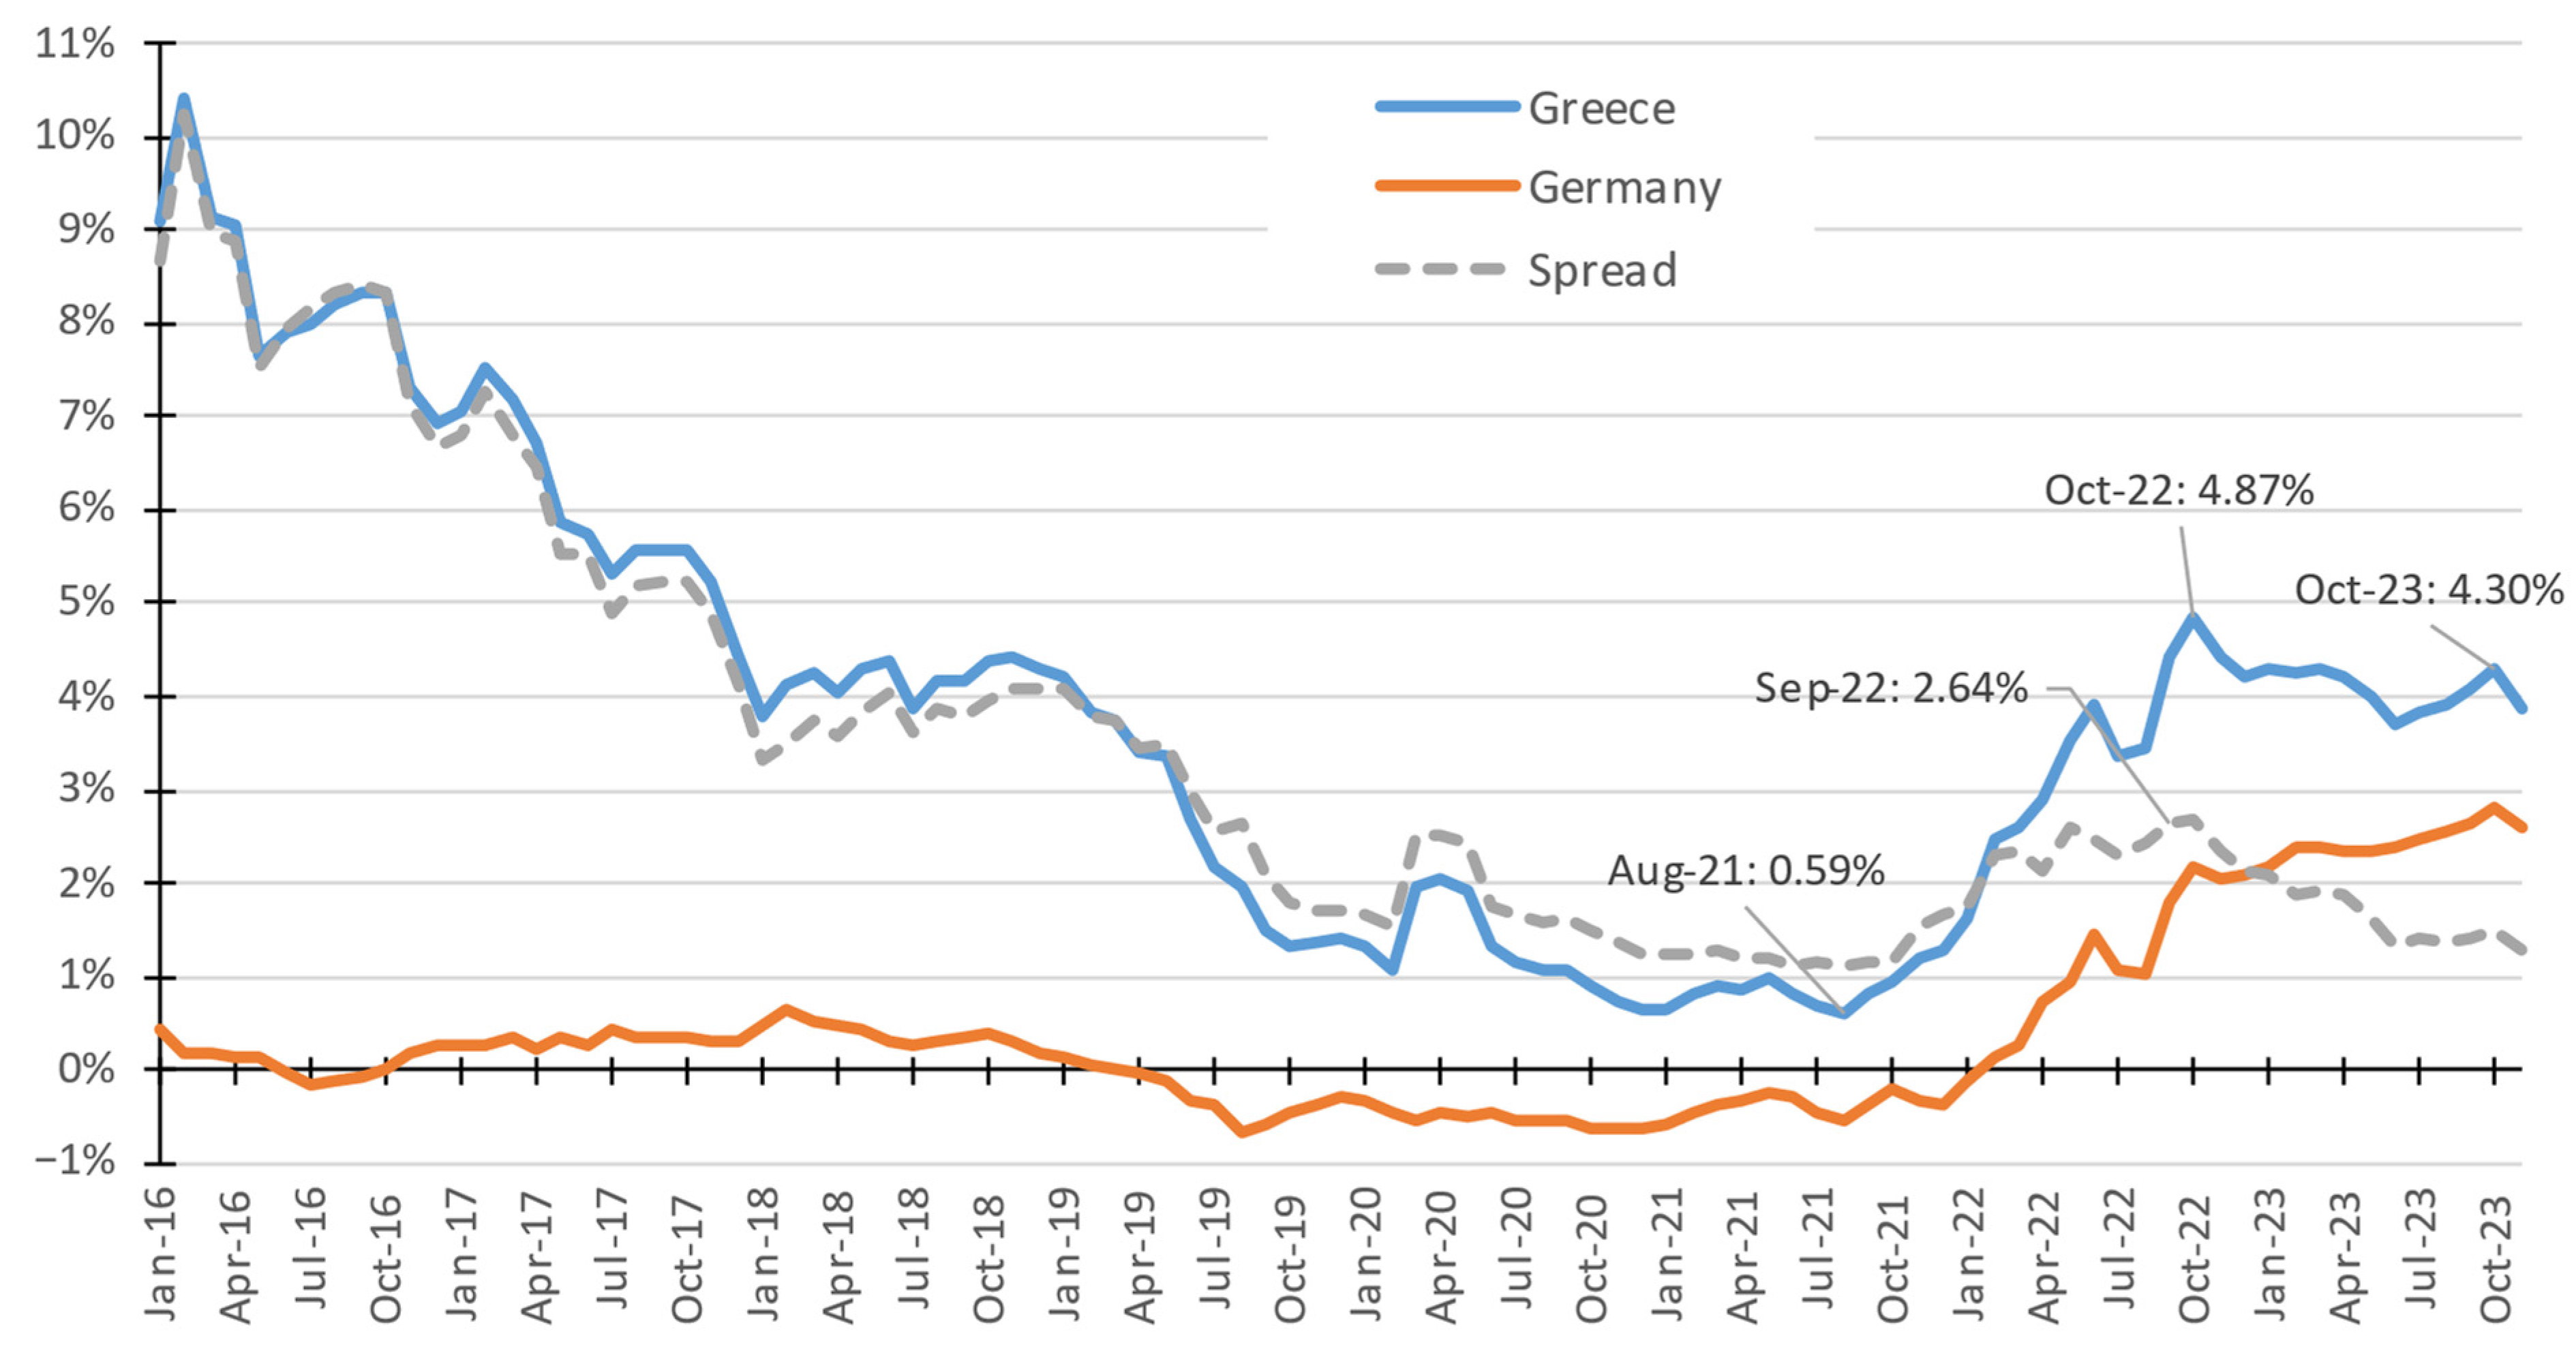
| 34 | For a more detailed analysis of this, see Hardouvelis (2021). |
| 35 | The “Hercules” scheme provided for the creation of a special-purpose vehicle (SPV), which would purchase the non-performing exposures with resources derived from the issuance of securities of three quality grades. The low-rated securities would be transferred to an investor for a fee and the high-rated securities would be retained by the bank and guaranteed by the Greek public sector for a royalty. |
| 36 | This reference focuses on intellectual property products that constitute a fixed capital and are therefore used in the production process. |
| 37 | AMECO database, accessed on: 24 January 2024. The capital stock in this database is estimated by using historical fixed capital flows (GFCF and FCC) with an initial level defined as three times the GDP in 1960. |
| 38 | As there are no significant differentiations from the rest of the world in terms of relative changes in production technology and productivity of individual sectors during the same period. |
| 39 | European Commission et al. (2023). Annual report on European SMEs 2022/2023 and its accompanying documents: “2023 SME Country Fact Sheet. Greece” and “2023 SME Country Fact Sheet. EU27”. |
| 40 | The non-financial business sector includes industry, construction, trade and services (NACE rev. 2, divisions B to J, L, M and N), but excludes agriculture, forestry and fishing as well as services that do not participate in the market to a high degree, such as education and health. |
| 41 | See the relevant information in the study by diaNEOsis: Kalogirou et al. (2021). |
| 42 | The fifth highest VAT coefficient in the EU, after Hungary (27%), Denmark, Croatia and Slovenia (25% for all three of them), whereas Finland also has a 24% coefficient. |
| 43 | |
| 44 | For a detailed inventory of the issues faced by Greek export businesses, see Kalyvitis et al. (2018). |
| 45 | diaNEOsis and IOBE (2021). This analysis focused on electricity and NG, as the prices of these energy sources determine the competitiveness of the energy-intensive industry to a significant degree. |
| 46 | See the crisis at the Evros border in March 2020, within the framework of asymmetrical operations by Turkey. |
| 47 | One of the main raw materials for the production of fertilizers is NG (70–90% methane), which is used to mass-produce the ammonia contained in fertilizers. In addition, Russia is one of the main producers of fertilizers internationally, and together with its partner Belarus, they have a significant share in the global production of another important raw material for fertilizers: potassium. |
| 48 | Conventionally, unless otherwise stated, the calculation basis of the reported item will be the national consumer price index (CPI). |
| 49 | Based on the HICP, on the basis of which the interstate comparison should be made. |
| 50 | See the relevant ECB study: Koester et al. (2021). |
| 51 | In order to avoid a loss of competitiveness in the Greek economy vis-à-vis its main trading partners. It also implies the additional assumption that the monetary policy will be such that it will not allow for a loss of competitiveness vis-à-vis the rest of the world. |
| 52 | Since the Greek public sector had not had time to be rated by at least one rating agency (out of the four main agencies recognized by the ECB) with an investment grade. |
| 53 | While, in general, the eligibility requirements for eligible debt instruments set out in the APP were maintained, an exemption was granted specifically regarding securities issued by the Greek public sector. The total amount of the Greek debt purchased by the ECB under the PEPP exceeds EUR 39.2 billion. |
| 54 | See the relevant paper: Gatsios and Ioannou (2022). |
| 55 | S&P: BBB (20 October 2023, Standard & Poor’s (2023)); Fitch Ratings: BBB (1 December 2023, Fitch Ratings (2023)); and DBRS: BBB (low) (8 September 2023, DBRS Ratings (2023)); whereas only Moody’s rates Greek state bonds at one step below its lower investment grade (Baa3): Ba1 (15 September 2023, Moody’s (2023)). |
| 56 | According to Eurostat figures (as of January 2024) and EC estimates (November 2023). |
| 57 | |
| 58 | On the condition that government bond yields remain below the sum of GDP growth and inflation. |
| 59 | See Alogoskoufis (2021) for a more detailed analysis of these available options and the arguments in favor of the third of them. |
| 60 | For a comprehensive analysis of Greece’s demographic problem, see the relevant study by diaNEOsis: Balourdos et al. (2019). |
References
- Alogoskoufis, George. 2021. Το χρέος και η αντιμετώπισή του μετά την πανδημία [Debt and How to Deal with It after the Pandemic]. Oικονομικός Ταχυδρόμος. June 6. Available online: https://www.ot.gr/2021/06/06/academia/hellenic-observatory-lse/to-xreos-kai-i-antimetopisi-tou-meta-tin-pandimia (accessed on 15 February 2024).
- Balourdos, Dionyssis, Nicolas Demertzis, George Pierrakos, and Elias Kikilias. 2019. H χαμηλή γονιμότητα στην Ελλάδα, δημογραφική κρίση και πολιτικές ενίσχυσης της οικογένειας [Low Fertility in Greece, Demographic Crisis and Family Support Policies]. Athens: diaNEOsis. Available online: https://www.dianeosis.org/research/demography (accessed on 15 February 2024).
- Calvo, Guillermo Antonio. 1988. Servicing the Public Debt: The Role of Expectations. American Economic Review 78: 647–61. [Google Scholar]
- Christodoulakis, Nikos, Miltiadis Nektarios, Helias Valentis, and Christos Axioglou. 2020. H Επανεκκίνηση Της Ελληνικής Oικονομίας. Ταμείο Aνάκαμψης Kαι Δημοσιονομικές Προοπτικές [The Restart of the Greek Economy. RRF and Fiscal Outlook]. Athens: diaNEOsis. Available online: https://www.dianeosis.org/research/epanekkinisi-ellinikis-oikonomias (accessed on 15 February 2024).
- Dallara, Charles. H. 2024. Euroshock: How the Largest Debt Restructuring in History Helped Save Greece and Preserve the Eurozone. New York: Rodin Books. [Google Scholar]
- DBRS Ratings. 2023. DBRS Morningstar Upgrades the Hellenic Republic to BBB (Low), Stable Trend. September 8. Available online: https://dbrs.morningstar.com/research/420362/dbrs-morningstar-upgrades-the-hellenic-republic-to-bbb-low-stable-trend (accessed on 15 February 2024).
- diaNEOsis, and IOBE [Foundation for Economic & Industrial Research]. 2018. H Φορολογία Εισοδήματος Στην Ελλάδα [Income Tax in Greece]. Athens: diaNEOsis. Available online: https://www.dianeosis.org/research/i-forologia-eisodimatos-stin-ellada (accessed on 15 February 2024).
- diaNEOsis, and IOBE [Foundation for Economic & Industrial Research]. 2021. O Τομέας Ενέργειας Στην Ελλάδα: Τάσεις, Προοπτικές και Προκλήσεις [The Energy Sector in Greece: Trends, Prospects and Challenges]. Athens: diaNEOsis. Available online: https://www.dianeosis.org/research/i-energeia-stin-ellada (accessed on 15 February 2024).
- diaNEOsis, and ISPM [Institute of Social & Preventive Medicine]. 2019. H Aνάπτυξη Του Τουρισμού Τρίτης Hλικίας Στην Ελλάδα Και H Συμβολή Του Τουρισμού Υγείας [The Development of Third Age Tourism in Greece and the Contribution of Health Tourism]. Athens: diaNEOsis. Available online: https://www.dianeosis.org/research/tourismos-tritis-ilikias (accessed on 15 February 2024).
- European Central Bank. n.d.a. Asset Purchase Programmes. Retrieved 30 January 2023. Available online: https://www.ecb.europa.eu/mopo/implement/app/html/index.en.html (accessed on 30 January 2023).
- European Central Bank. n.d.b. Key ECB Interest Rates. Retrieved 30 January 2023. Available online: https://www.ecb.europa.eu/stats/policy_and_exchange_rates/key_ecb_interest_rates/html/index.en.html (accessed on 30 January 2023).
- European Central Bank. n.d.c. Pandemic Emergency Purchase Programme (PEPP). Retrieved 30 January 2023. Available online: https://www.ecb.europa.eu/mopo/implement/pepp/html/index.en.html (accessed on 30 January 2023).
- European Commission, and Directorate-General for Economic and Financial Affairs. 2023a. 2023 Country Report–Greece. June 14. Available online: https://www.data.europa.eu/doi/10.2765/450492 (accessed on 15 February 2024).
- European Commission, and Directorate-General for Economic and Financial Affairs. 2023b. European Economic Forecast: Autumn 2023. Luxembourg: Publications Office of the European Union. Available online: https://data.europa.eu/doi/10.2765/325116 (accessed on 15 February 2024).
- European Commission, and Directorate-General for Economic and Financial Affairs. 2023c. Post-Programme Surveillance Report: Greece, Autumn 2023. Luxembourg: Publications Office of the European Union. Available online: https://data.europa.eu/doi/10.2765/900936 (accessed on 15 February 2024).
- European Commission, and Directorate-General for Economic and Financial Affairs. 2024. European Economic Forecast: Winter 2024 (Interim). Luxembourg: Publications Office of the European Union. Available online: https://data.europa.eu/doi/10.2765/01964 (accessed on 15 February 2024).
- European Commission, Directorate-General for Internal Market, Industry, Entrepreneurship and SMEs, Joint Research Centre, Laura Di Bella, Anastasis Katsinis, and Jaime Lagüera-González. 2023. Annual Report on European SMEs 2022/2023: SME Performance Review 2022/2023. Luxembourg: Publications Office of the European Union. Available online: https://data.europa.eu/doi/10.2760/028705 (accessed on 15 February 2024).
- Fitch Ratings. 2023. Fitch Upgrades Greece to ‘BBB-’; Outlook Stable. December 1. Available online: https://www.fitchratings.com/research/sovereigns/fitch-upgrades-greece-to-bbb-outlook-stable-01-12-2023 (accessed on 15 February 2024).
- Gatsios, Konstantine, and Dimitris A. Ioannou. 2022. O πληθωρισμός ως ευκαιρία βελτίωσης της ανταγωνιστικότητας της ελληνικής οικονομίας [Inflation As an Opportunity to Improve the Competitiveness of the Greek Economy]. Το Βήμα της Κυριακής. February 13. Available online: https://www.tovima.gr/printed_post/o-plithorismos-os-eykairia-veltiosis-crtis-antagonistikotitas-crtis-ellinikis-oikonomias (accessed on 15 February 2024).
- Hardouvelis, Gikas A. 2021. Κρίση και χρηματοπιστωτικά ανοίγματα στην Ελλάδα [Crisis and financial exposures in Greece]. In Υποχρεώσεις Χρηματοπιστωτικών Φορέων [Obligations of Financial Institutions]. Edited by Association of Greek Commercialists. Athens: Νομική Βιβλιοθήκη, pp. 245–97. Available online: https://hardouvelis.gr/el/gikas-hardouvelis-quot-krisi-kai-chrimatopistotika-anoigmata-stin-ellada-quot-meleti-gia-to-mellon-ton-trapezon (accessed on 15 February 2024).
- Hellenic Republic, and PDMA (Public Debt Management Agency). 2019. Funding Strategy for 2020. December. Available online: https://www.pdma.gr/en/?view=article&id=5901:funding-strategy-for-2020 (accessed on 15 February 2024).
- Hellenic Republic, and PDMA (Public Debt Management Agency). 2023. Funding Strategy for 2024. December 21. Available online: https://www.pdma.gr/en/?view=article&id=5901:funding-strategy-for-2024 (accessed on 15 February 2024).
- IEA. 2021. Global Energy Review 2021. Paris: IEA. Available online: https://www.iea.org/reports/global-energy-review-2021 (accessed on 15 February 2024).
- Kalogirou, Giannis, Aggelos Tsakanikas, Aimilia Protogerou, Panagiotis Panagiotopoulos, Evangelos Siokas, Georgios Siokas, and Dimitrios Stamatopoulos. 2021. H Ελλάδα που Μαθαίνει, Ερευνά, Καινοτομεί και Επιχειρεί [Greece That Learns, Researches, Innovates and Does Business]. Athens: diaNEOsis. Available online: https://www.dianeosis.org/research/research_policy (accessed on 15 February 2024).
- Kalyvitis, Sarantis, Margarita Katsimi, and Thomas Moutos. 2018. Εξαγωγές και Εξαγωγικές Επιχειρήσεις στην Ελλάδα [Exports and Export Businesses in Greece]. Athens: diaNEOsis. Available online: https://www.dianeosis.org/2018/12/eksagoges-kai-eksagogikes-epixeiriseis-stin-ellada (accessed on 15 February 2024).
- Koester, Gerrit, Frank Smets, and Chiara Osbat. 2021. Understanding Low Inflation in the Euro Area from 2013 to 2019: Cyclical and Structural Drivers. Frankfurt: European Central Bank. Available online: https://data.europa.eu/doi/10.2866/869984 (accessed on 15 February 2024).
- Kostis, Kostas. 2018. History’s Spoiled Children: The Story of Modern Greece. Oxford: Oxford University Press. [Google Scholar]
- Makantasi, Evmorfia (Fay), and Helias Valentis. 2020. ΕΣΠA-Ένα Εν Μέρει Aνεκμετάλλευτο Aναπτυξιακό Κοινοτικό Εργαλείο [NSRF-A Partly Unutilized EU Development Instrument]. Athens: diaNEOsis. Available online: https://www.dianeosis.org/2020/07/espa-ena-anekmetaleyto-anaptyksiako-ergaleio (accessed on 15 February 2024).
- Makantasi, Evmorfia (Fay), and Helias Valentis. 2021. H “Χρηματοδότηση Βάσει Aποτελεσμάτων” Ως Εργαλείο Κοινωνικής Πολιτικής [Results-Based Funding as a Social Policy Tool]. Athens: diaNEOsis. Available online: https://www.dianeosis.org/2021/02/i-xrimatodotisi-vasei-apotelesmatwn (accessed on 15 February 2024).
- Matsaganis, Manos, Andrea Parma, and Alexandros Karakitsios. 2018. Όψεις Κοινωνικής Κινητικότητας στην Ελλάδα της Κρίσης [Aspects of Social Mobility in Crisis Greece]. Athens: diaNEOsis. Available online: https://www.dianeosis.org/2018/11/oi-epiptoseis-tis-krisis-sta-eisodimata-twn-ellinwn (accessed on 15 February 2024).
- Mitsos, Μichalis, and Odin Linardatou. 2019. Ξένες Επενδύσεις, Παιδεία και Εξωστρέφεια: Πώς Σώθηκε H Ιρλανδία [Foreign Investment, Education and Openness: How Ireland Was Saved]. Athens: diaNEOsis. Available online: https://www.dianeosis.org/research/ameses-ksenes-ependyseis (accessed on 15 February 2024).
- Moody’s. 2023. Government of Greece-Ba1 Stable: Annual Credit Analysis. October 11. Available online: https://www.moodys.com/research/Government-of-Greece-Ba1-stable-Annual-credit-analysis-Issuer-In-Depth--PBC_1376383 (accessed on 15 February 2024).
- OECD. 2020. OECD Tourism Trends and Policies 2020. Paris: OECD Publishing. [Google Scholar] [CrossRef]
- OECD. 2023. OECD Economic Outlook, Volume 2023 Issue 2. Paris: OECD Publishing. [Google Scholar] [CrossRef]
- Pepelasis, Ioanna Sapfo, Ioannis Spyropoulos, Georgios Kokkotas, Dimitris Zisis, and Ioannis Besis. 2022. Χαρτογράφηση Ελληνικού Oικοσυστήματος Νεοφυών Επιχειρήσεων [Mapping the Greek Start-up Business Ecosystem]. Athens: diaNEOsis. Available online: https://www.dianeosis.org/2022/01/oi-neofyeis-epixeiriseis-stin-ellada (accessed on 15 February 2024).
- Pissarides, Christopher A., Dimitri Vayanos, Nikolaos Vettas, and Costas Meghir. 2020. Σχέδιο Aνάπτυξης για την Ελληνική Oικονομία [A Growth Strategy for the Greek Economy]. Available online: https://www.government.gov.gr/schedio-anaptixis-gia-tin-elliniki-ikonomia (accessed on 15 February 2024).
- Sharma, Ruchir. 2016. The Rise and Fall of Nations: Forces of Change in the Post-Crisis World. New York: W. W. Norton & Company. [Google Scholar]
- Standard & Poor’s. 2023. Greece Upgraded To ‘BBB-/A-3′ On An Improved Budgetary Position; Outlook Stable. October 20. Available online: https://www.disclosure.spglobal.com/ratings/en/regulatory/article/-/view/type/HTML/id/3074450 (accessed on 15 February 2024).
- Vaggelas, George. K., Athanasios Pallis, Christina Kontaxi, Giannis Soultanis, Vicky Loizou, Zoe Rimpa, Marios Nakas, and Panagiotis Markantonatos. 2021. Διαμόρφωση Στρατηγικής Aνάπτυξης Τουριστικών Λιμένων [Formulation of a Strategy for the Development of Tourist Ports]. Athens: diaNEOsis. Available online: https://www.dianeosis.org/research/cruise_industry_in_greece (accessed on 15 February 2024).


| Businesses | Persons Employed | Value Added | |||||||
|---|---|---|---|---|---|---|---|---|---|
| Greece | EU-27 | Greece | EU-27 | Greece | EU-27 | ||||
| # | Share | Share | # | Share | Share | EUR Billion | Share | Share | |
| SMEs (0–249 persons employed) | 731,829 | 99.9% | 99.8% | 2,180,534 | 83.5% | 64.4% | 34.8 | 57.0% | 51.8% |
| Large businesses (250+ persons employed) | 471 | 0.1% | 0.2% | 429,679 | 16.5% | 35.6% | 26.2 | 43.0% | 48.2% |
Disclaimer/Publisher’s Note: The statements, opinions and data contained in all publications are solely those of the individual author(s) and contributor(s) and not of MDPI and/or the editor(s). MDPI and/or the editor(s) disclaim responsibility for any injury to people or property resulting from any ideas, methods, instructions or products referred to in the content. |
© 2024 by the authors. Licensee MDPI, Basel, Switzerland. This article is an open access article distributed under the terms and conditions of the Creative Commons Attribution (CC BY) license (https://creativecommons.org/licenses/by/4.0/).
Share and Cite
Makantasi, E.; Valentis, H. Greece’s Economic Odyssey: Persistent Challenges and Pathways Forward. Economies 2024, 12, 139. https://doi.org/10.3390/economies12060139
Makantasi E, Valentis H. Greece’s Economic Odyssey: Persistent Challenges and Pathways Forward. Economies. 2024; 12(6):139. https://doi.org/10.3390/economies12060139
Chicago/Turabian StyleMakantasi, Evmorfia (Fay), and Helias Valentis. 2024. "Greece’s Economic Odyssey: Persistent Challenges and Pathways Forward" Economies 12, no. 6: 139. https://doi.org/10.3390/economies12060139
APA StyleMakantasi, E., & Valentis, H. (2024). Greece’s Economic Odyssey: Persistent Challenges and Pathways Forward. Economies, 12(6), 139. https://doi.org/10.3390/economies12060139