Abstract
The U.S. is currently the country with the highest number of COVID-19 deaths. By the second week of October 2021, over 700,000 people in the U.S. had died after contracting the virus. When estimating the cost and benefit of a COVID-19 prevention measure, the value of a statistical life (VSL) has been widely used as an approximation for the value of a lost life. However, VSL arguably overstates the costs of deaths caused by COVID-19 because VSL captures the private individual’s benefit, and it is the same for everyone regardless of where they live, their productivity, their age, and their gender. In this study, rather than looking at the cost of life loss due to COVID-19, we focus on the opportunity costs of COVID-19 deaths to society. The opportunity cost of COVID-19 deaths is defined as the combination of direct medical costs and the costs of lost potential lifetime earnings. Our analysis focuses on the period from March 2020 to October 2021. We then quantify the average opportunity cost of COVID-19 deaths across the U.S. and by state level.
1. Introduction
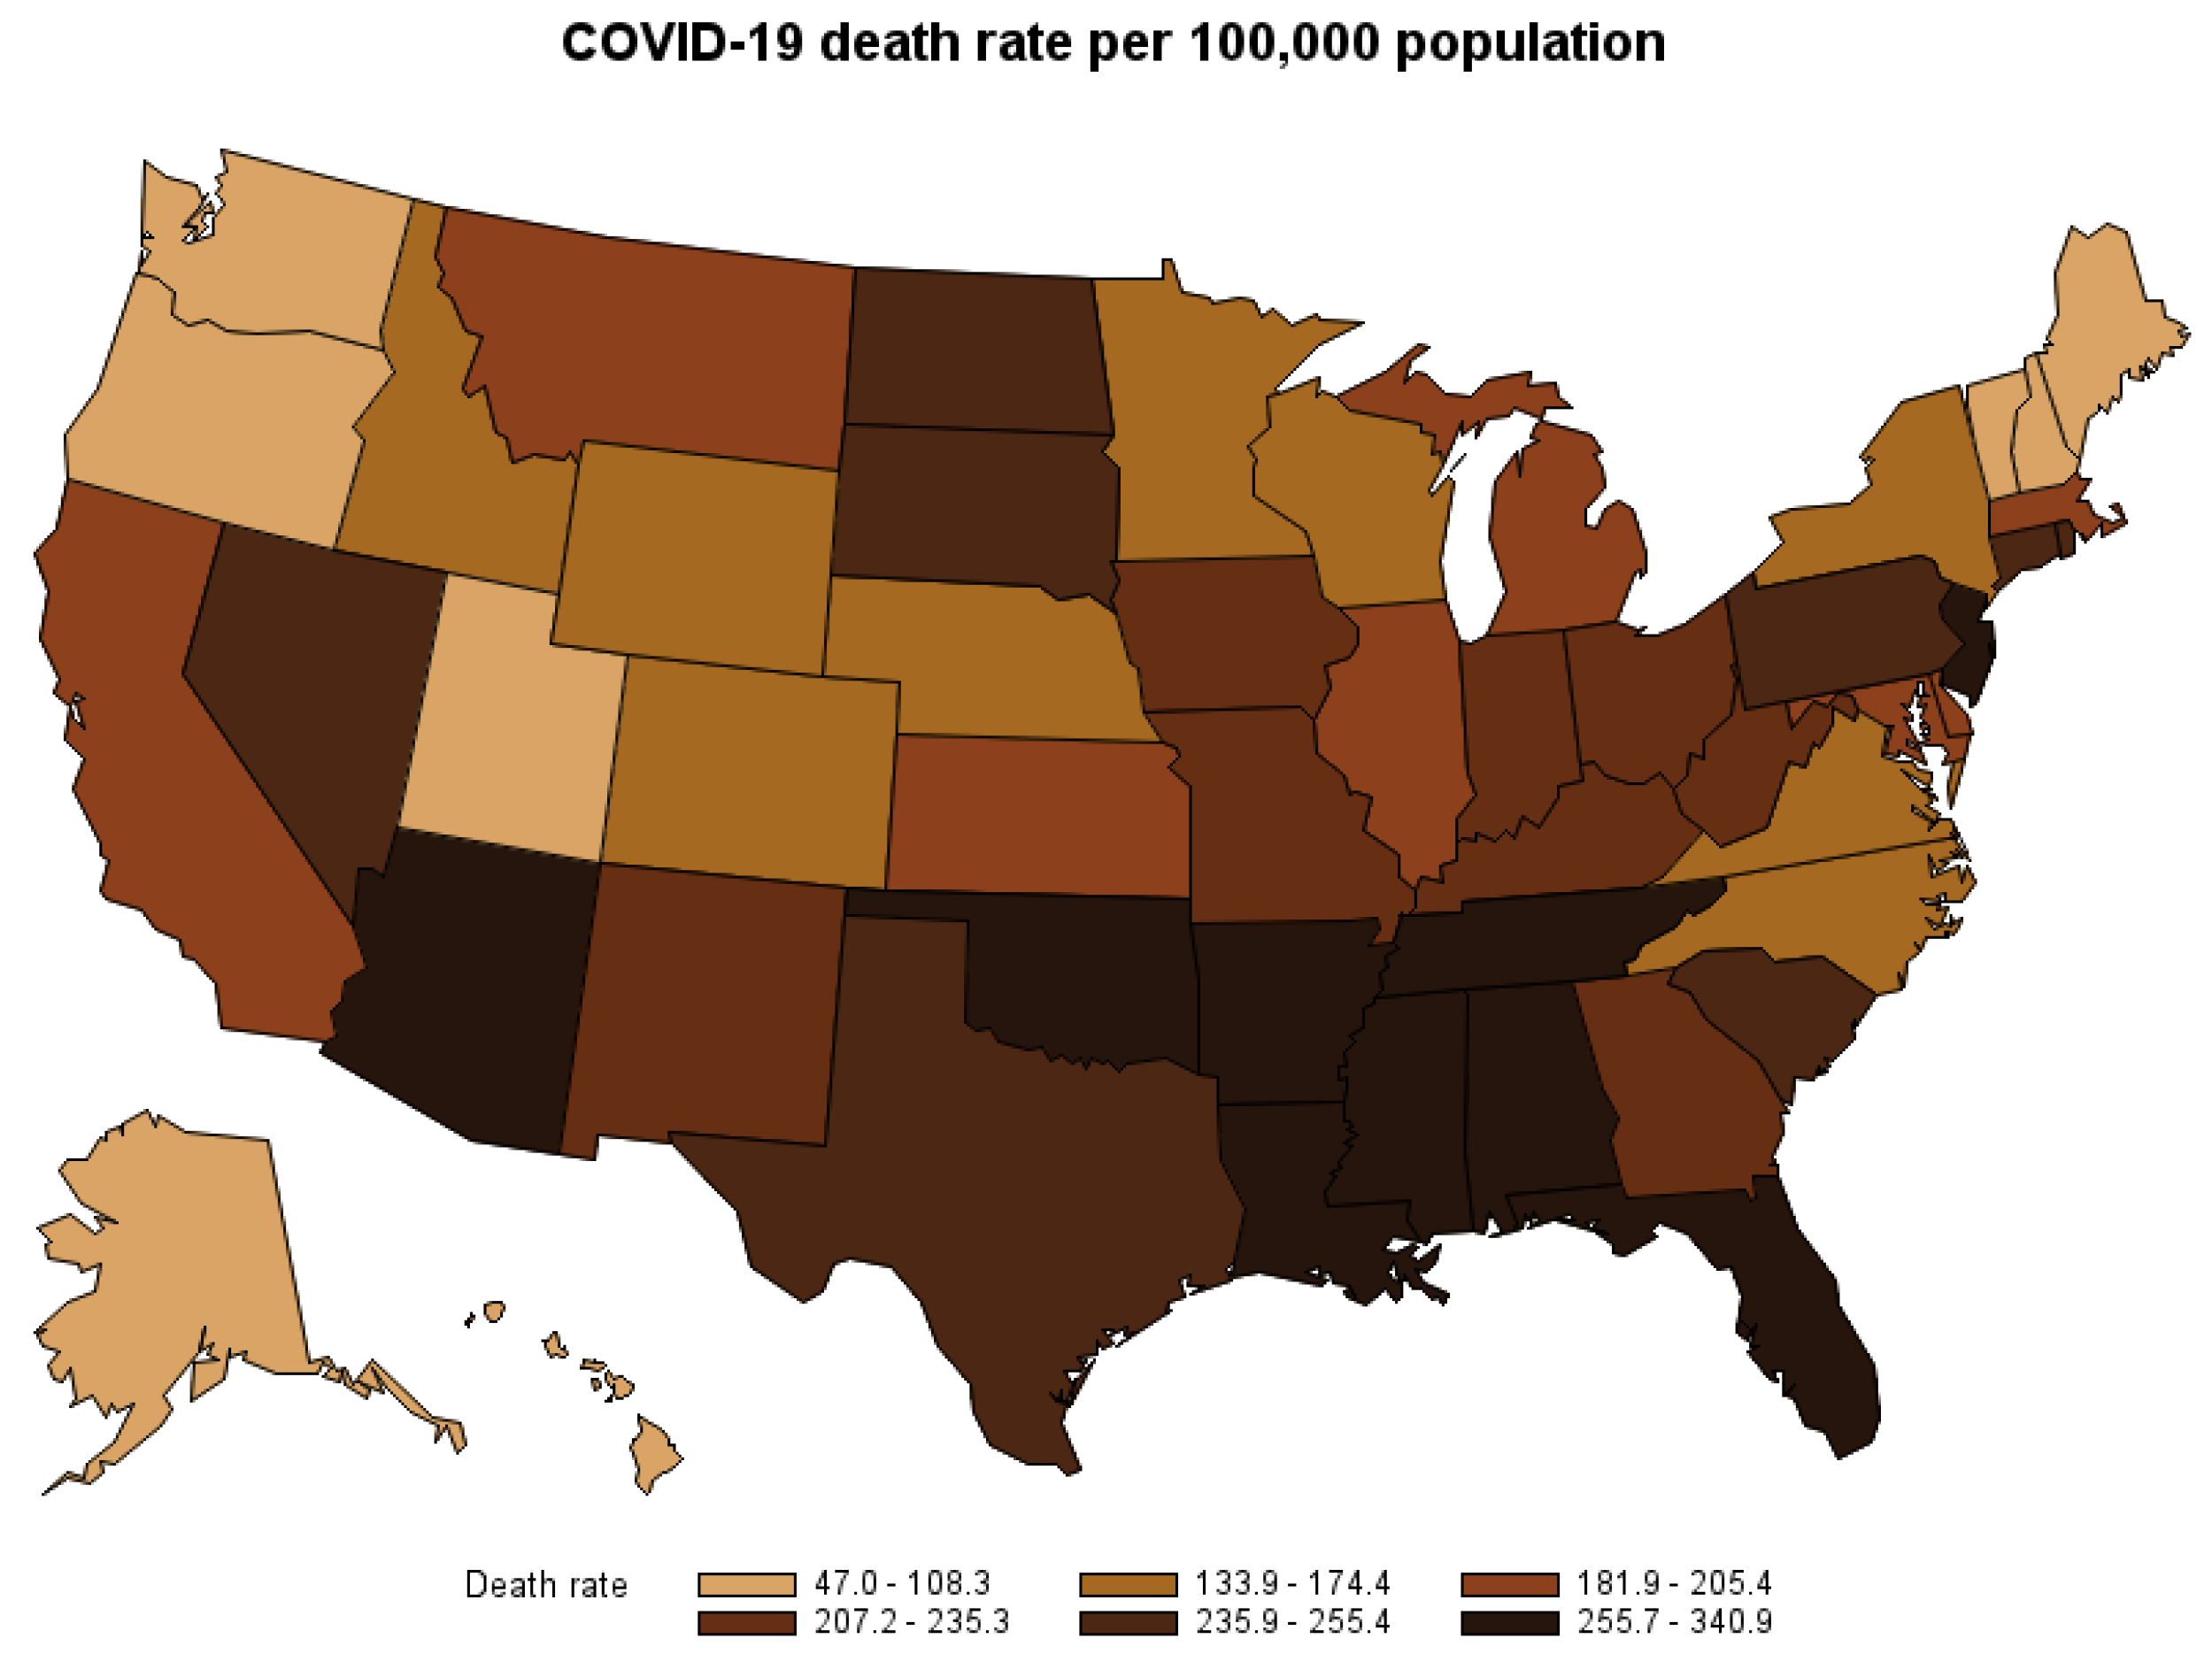
By the second week of October 2021, the Coronavirus disease (COVID-19) outbreak had spread to six continents and had contributed to over 4.9 million deaths worldwide. The United States (U.S.) had the highest number of COVID-19 deaths at the time. From March 2020 to October 2021, over 700,000 people in the U.S. have died after contracting the virus. Figure 1 shows the COVID-19 death rate per 100,000 population by state. The disease not only puts a high cost on the U.S. healthcare system but also causes economic loss to society by causing premature deaths. This study estimates the opportunity cost of premature deaths caused by COVID-19 nationwide and by the state from the start of the pandemic to October 2021, when vaccines against COVID-19 were widely available and the vaccination rate in the U.S. reached its steady level of over 40 percent1. The estimate might be used to assess the cost–benefit of COVID-19 mitigation strategies.
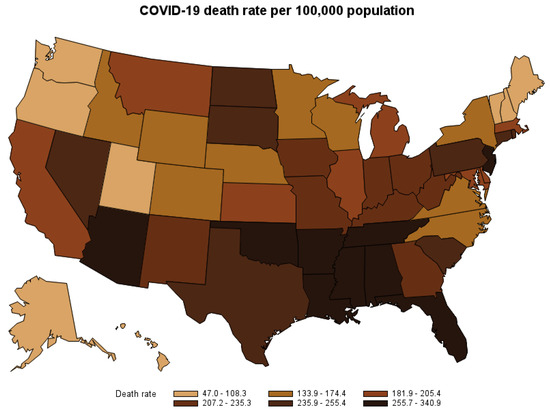
Figure 1.
COVID-19 death rate by state, March 2020–October 2021.
2. Data and Method
Although it is impossible to put a value on human life, economists have used the Value of a Statistical Life (VSL) to monetize the trade-off between life and mortality risk when it comes to analyzing the cost and benefit of a safety measure. However, using VSL as a tool to analyze the cost and benefit of COVID-19 measures might be inaccurate (Adler 2020; Adler et al. 2021; Colmer 2020; Sweis 2022). The value of a Statistical Life is not the value of a life itself. VSL actually approximates how much people are willing to pay to save an additional life. For instance, if we consider a village with a population of 1000 individuals, and these residents face an annual mortality risk of 0.1% due to flood, then, on average, one person from that village will succumb to the flood yearly. Suppose all residents in the village are willing to contribute USD 100 annually to build and maintain a floodwall to eliminate the mortality risk. In that case, collectively, they would be willing to spend USD 100,000 to save one “statistical life”. In this case, the value of a statistical life is USD 100,000.
Despite its popularity, VSL is also criticized as an uncertain tool for analyzing the cost and benefit of public policies and mitigation for various reasons. The main criticism of VSL approximates private individuals’ willingness to pay for a small reduction in fatality risk (Adler 2020; Allen 2020); however, willingness to pay for risk reduction links to the nature of the risk and how risk-averse people are toward that risk (Colmer 2020; Viscusi 2010). Hence, VSL varies depending on the type of risks. For example, the U.S. Department of Transportation (DOT) recommends a VSL of USD 11.6 million per life (2020 dollar), while the U.S. Environmental Protection Agency (EPA) recommends a VSL of USD 9.3 million per life (2020 dollar)2.
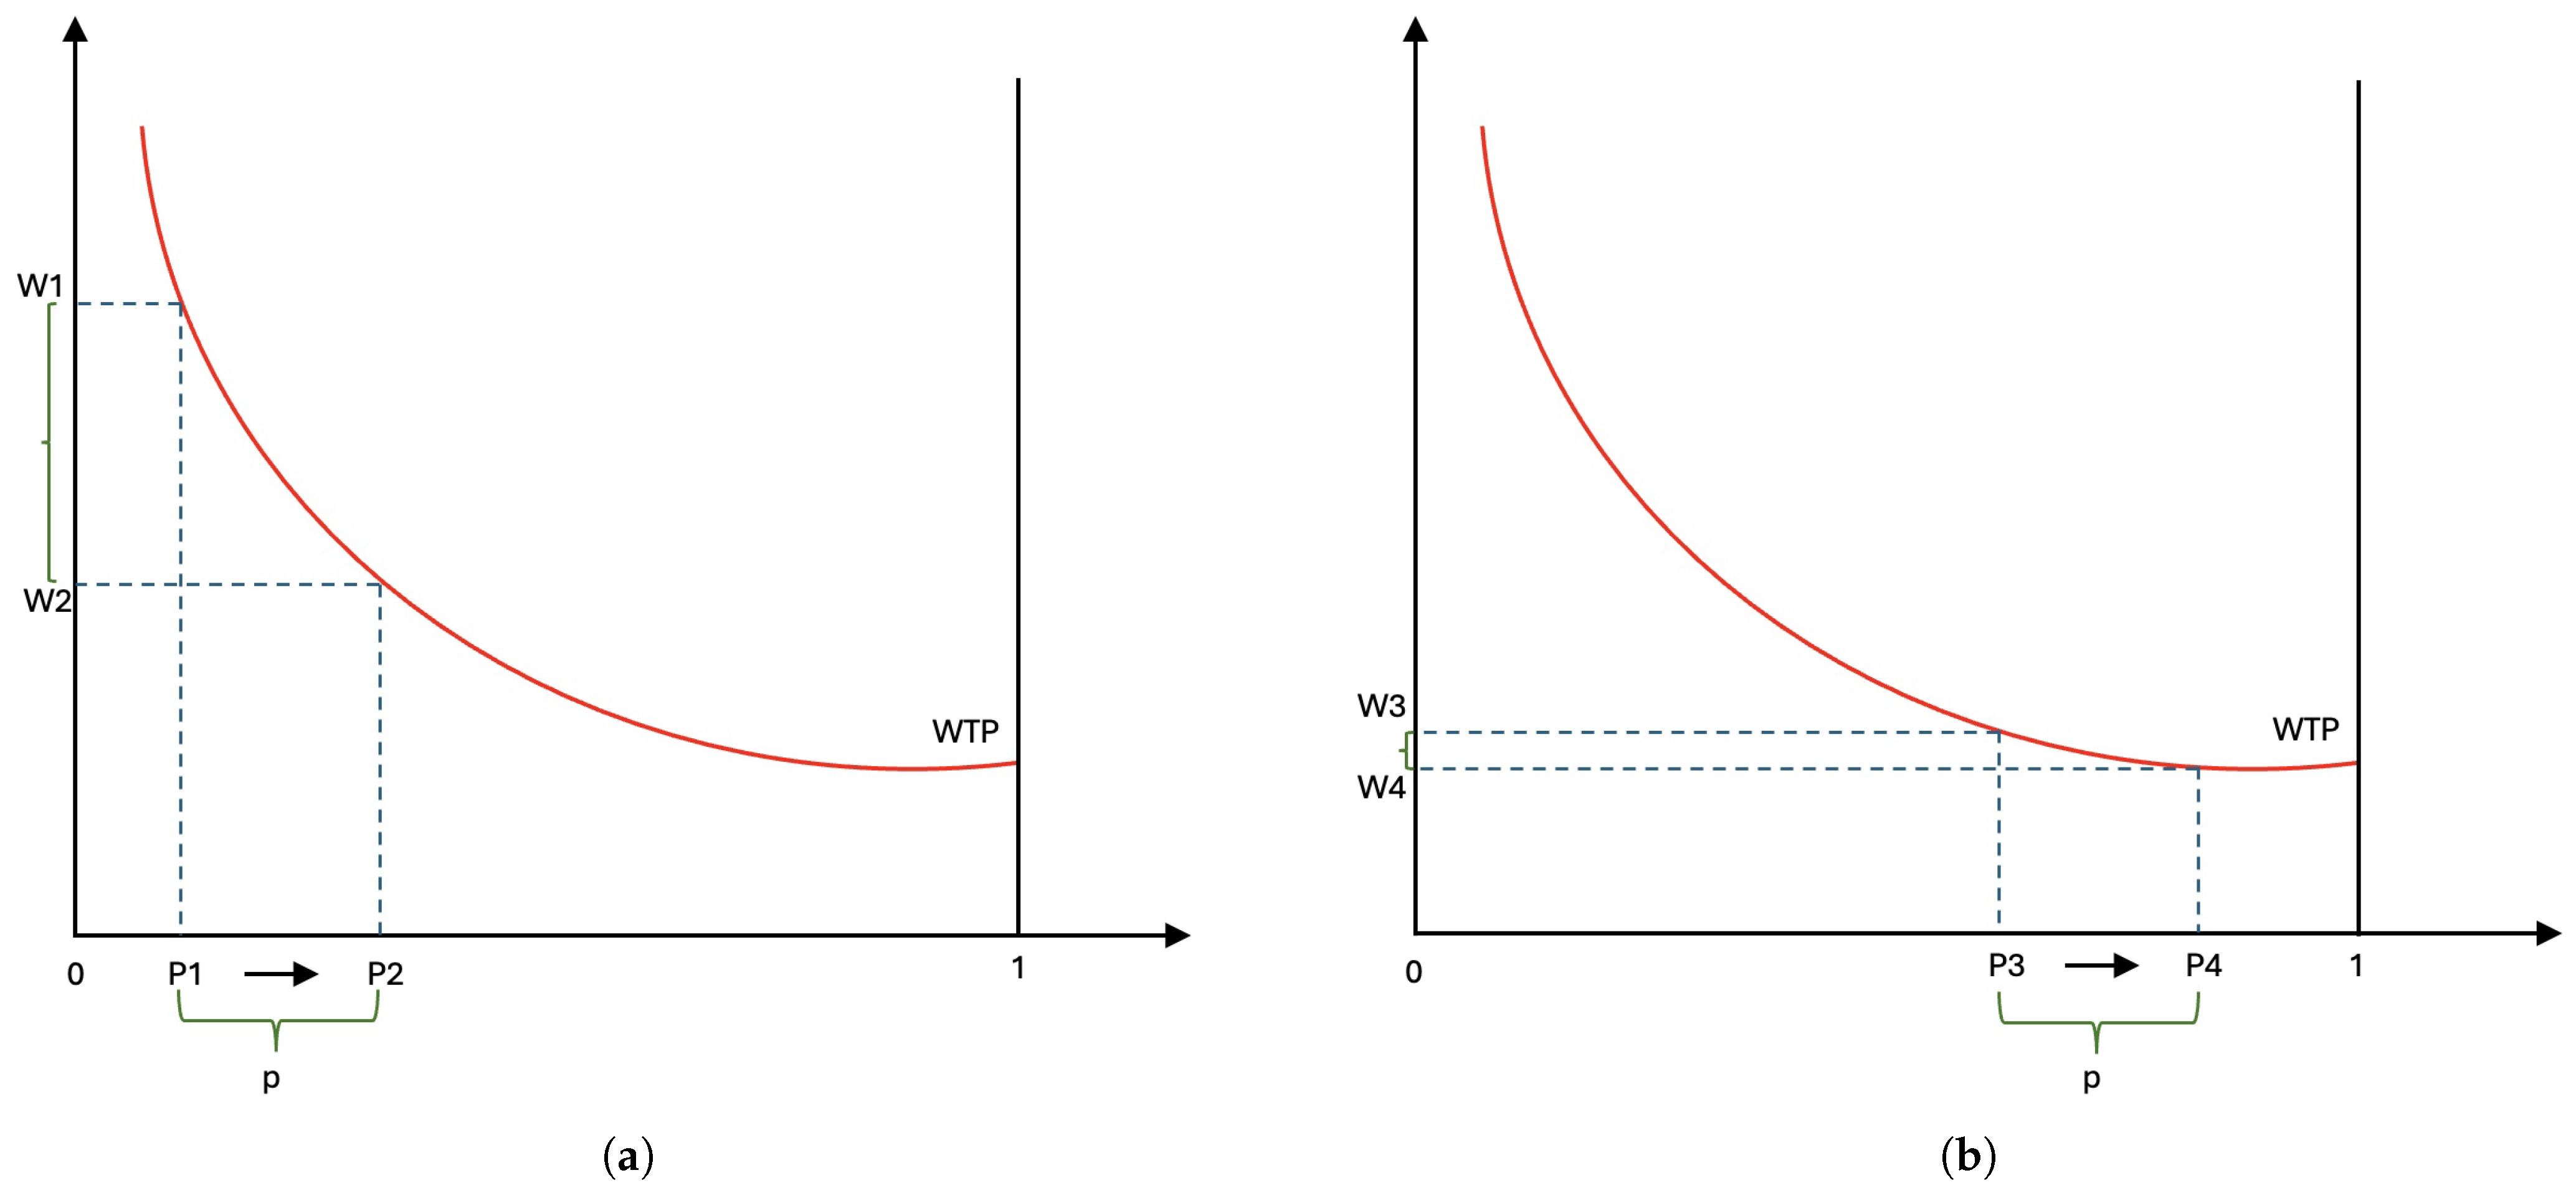
Willingness to pay for risk reduction also varies depending on different factors such as age differences (Herrera-Araujo and Rochaix 2020; Viscusi 2010), and baseline health (Herrera-Araujo and Rochaix 2020). Consider the example illustrated in Figure 2, in which the horizontal axis represents the survival rate, ranging from 0 (death) to 1 (survive), and the vertical axis represents the monetary trade-off. Note that people who have low survival rates face higher mortality risk. Figure 2a,b illustrate the trade-offs to increase survival rate (decrease risk) by the same amount p for people with high mortality risk and low mortality risk, respectively. Figure 2 shows that people with high mortality risk are willing to spend more to reduce the same amount of risk compared to people with low risk, [] > [].

Figure 2.
Willingness to pay to reduce fatality risk for high-risk group (a) and low-risk group (b).
COVID-19’s magnitude of risk is different than other risks researchers have used to estimate VSL (Colmer 2020). For example, the level of risk aversion toward COVID-19 might be very different with age since most COVID-19 deaths occur at age 65 or older. Therefore, the use of a single VSL for people of different ages, genders, and health baselines is uncertain.
In this study, rather than examining the cost of lives caused by COVID-19, we monetize the economic costs (opportunity costs) to society due to lives lost to COVID-19 through direct medical expenses (direct cost) and the loss of future earnings (indirect cost). The direct costs of COVID-19 deaths are the consumption of medical resources spent on decedents, which can be funded through government (Medicare, Medicaid), health insurance providers, or individual finance. The indirect opportunity cost of COVID-19 deaths is the decedents’ potential loss of lifetime earnings. These direct and indirect costs are considered a loss to society.
2.1. Data
In this study, we employ 3 data sets to estimate the economic costs of COVID-19 deaths, i.e., Provisional COVID-19 Deaths by Place of Death (National Center for Health Statistics 2021a), Provisional COVID-19 Deaths by Sex and Age (National Center for Health Statistics 2021b), and the 2021 Micro Census data IPUMS (Ruggles et al. 2021). Our paper did not include the collection of any data that is not publicly available, nor did we engage any live participants in this study. It is an analysis of secondary, publicly available data.
The Provisional COVID-19 Deaths by Places of Death data provide the numbers of COVID-19 deaths by state and place of death, including healthcare settings and non-healthcare setting locations such as hospitals, hospice facilities, nursing homes, emergency rooms, dead on arrival, or at-home. The Provisional COVID-19 Deaths by Sex and Age data provide the numbers of COVID-19 deaths by state, gender, and age group. The 2021 Micro Census data are employed to calculate the average earnings by the state of residency, age, and gender.
2.2. Direct Medical Cost
The medical cost of death by COVID-19 varies by location of death, including but not limited to at home, in a healthcare setting such as an emergency room, a hospital after inpatient admission, a nursing home, or a hospice facility.
Since there are no publicly available data on the cost of treating COVID-19 at the national or state level, we rely on recent research on individual-based models that estimate the cost of COVID-19 and pneumonia treatments for different severity levels. According to current research, the medical cost of treating one single case of symptomatic COVID-19 is USD 3045 (Bartsch et al. 2020). However, the medical costs of treating COVID-19 patients with severe symptoms who seek medical care from healthcare settings are higher. Medical costs of COVID-19 treatments in healthcare settings are applied based on three health states: medically attended, hospitalized, and ventilated (Chen et al. 2020). Death can occur in any of the three states. The average medical cost of treating pneumonia without complication is USD 10,065 (Chen et al. 2020; Rae et al. 2020)3, the cost of treating pneumonia with severe symptoms and complications is ranging from USD 20,9204 to USD 63,0605 (Rae et al. 2020).
For deaths that occurred at home or other unspecified locations, we assume the decedents had symptomatic infection with SARS-CoV-2 but were not admitted to a hospital. Therefore, we assign the medical cost to treat symptomatic COVID-19 infection, USD 3045, as the only medical cost associated with these deaths (Bartsch et al. 2020).
For deaths that occurred upon arrival, the medical cost associated with the death is USD 3552, which combines the cost of treating symptomatic infection (USD 3045) and the cost of one ambulance trip (USD 5076).
For deaths that occurred at an emergency room or outpatient, we assume the decedents received some medical treatment for pneumonia without complication; hence, they were not admitted to a hospital. Therefore, we assign USD 10,065 as the cost associated with the death that occurred at an emergency room.
For inpatients with more severe symptoms and complications who need to be admitted to a hospital, the cost of inpatient treatment is estimated at USD 20,920 (Rae et al. 2020). However, around 10% of COVID-19 inpatients might require more intensive care (Oliveira et al. 2021), which costs USD 63,060 (Rae et al. 2020) on average. Therefore, the weighted average cost of inpatient treatment is 0.9 × USD 20,920 + 0.1 × 63,060 = USD 25,134. We then assign this weighted average cost of inpatient treatment as the medical cost associated with deaths occurring in a hospital, a nursing home, or a hospice facility.
Table 1 presents the medical costs of COVID-19 deaths by place of death. According to the National Center for Health Statistics (2021a), 86.87% of all COVID-19 deaths in the U.S. occurred at a hospital, a nursing home, or a hospice facility, 3.34% of the deaths occurred at a hospital’s emergency room, 7.66% of the deaths occurred at decedents’ homes, 0.09% of the deaths occurred in an ambulance upon arrival, 2.4% of the deaths’ locations are not specified (Table 2). The total medical cost associated with COVID-19 death by October 2021 was over USD 16 billion (Table 2).

Table 1.
Direct medical cost of COVID-19 death by place of death.
Table 2.
The counts and medical cost of COVID-19 deaths in the U.S. by place of deaths, March 2020–October 2021.
Using the numbers of COVID-19 deaths by place of death at the state level from The Provisional COVID-19 Deaths by Places of Death data (National Center for Health Statistics 2021a), we calculated the total medical cost and the average medical cost per death related to COVID-19 deaths for each state (Table 3). The average direct medical cost for each state ranges from USD 20,367 to USD 23,929, depending on the state’s distribution of places of death.
Table 3.
The total and average medical costs of COVID-19 deaths by state, March 2020–October 2021.
2.3. Cost of Loss Lifetime Production (Indirect Cost)
Cost of loss lifetime production is defined as the loss of potential lifetime earnings from premature death. The loss of lifetime earnings is estimated as the discounted sum of expected annual income over the individual’s remaining potential working time from the age of death to the official retirement age (67 years old). We apply the commonly used method to estimate the loss of lifetime earnings from the existing literature, including Finkelstein et al. (2006), O’Dea and Tucker (2005), Doran et al. (2015), and Lawrence and Miller (2014) with a discount rate of 3% and the historical rate of increase in productivity of 1.4%. Lifetime earnings for someone whose gender is b, died at age a, in state s is estimated as:
where denotes the probability that someone of age a and gender b will survive until age i; denotes the average annual market income for someone of age i and gender b in state s in 2020; g denotes the rate of increase in productivity, which is 1.4%; r denotes the 3% discount rate.
Since the loss of lifetime earnings is calculated as the discounted sum of expected annual income over an individual’s remaining potential working years from the age of death to the official retirement age, individuals who pass away at younger ages experience a greater loss of potential lifetime earnings compared to those who pass away at older ages. For instance, a woman who passes away at age 20 is projected to lose an average of USD 1.52 million in lifetime earnings, while a woman who passes away at age 45 is expected to lose USD 1.06 million in lifetime earnings7.
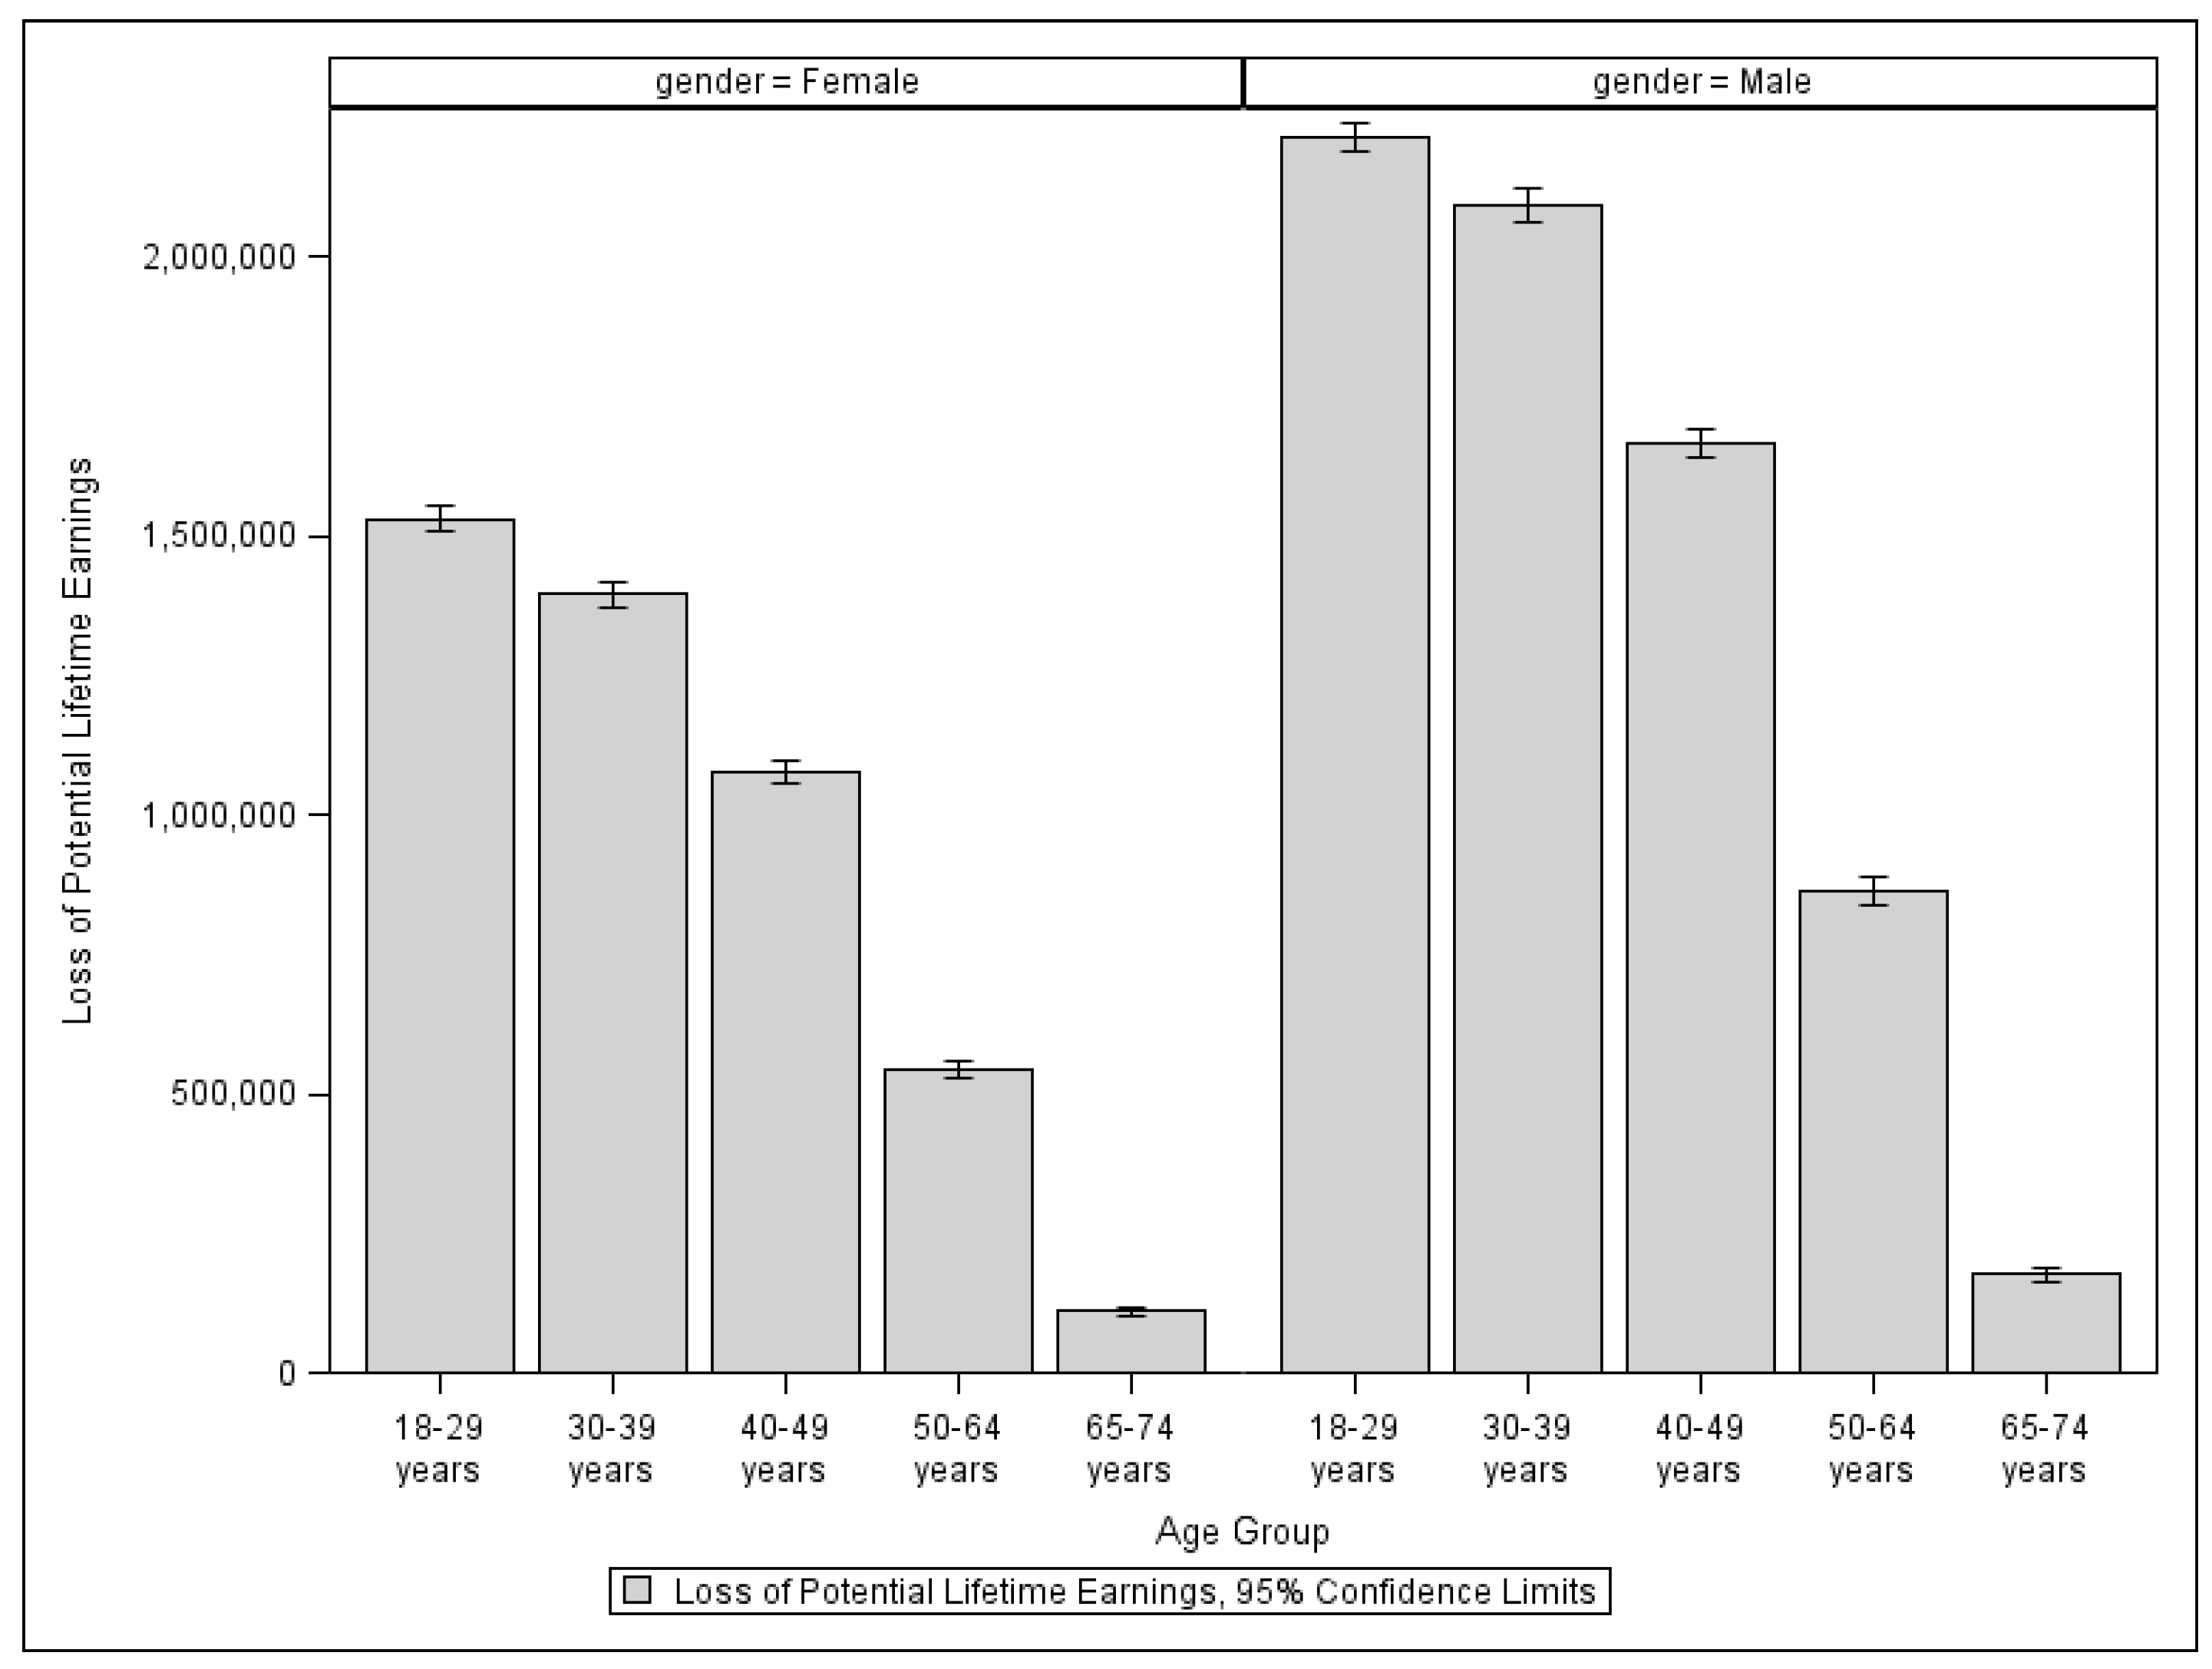
Although it would be ideal to calculate an individual’s loss of lifetime earnings using the individual’s age at death, gender, and state of residency, we do not have access to fatality data at the individual level. Instead, we employ the Provisional COVID-19 Deaths by Sex and Age data, which is publicly available. The data provides the numbers of COVID-19 deaths by state, gender, and eight different age groups. Therefore, for each age group of a specific gender and state of residency, we must use the group’s average potential loss of lifetime earnings. In Figure 3, we show the average loss of potential lifetime earnings in the U.S. by age group. Overall, women’s potential lifetime earnings are less than men’s for all ages. Since people who die at age 75 or older are no longer in their working age, their potential loss of lifetime earnings is zero.
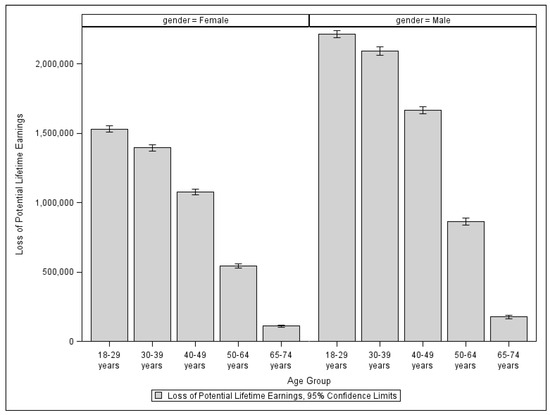
Figure 3.
Loss of potential lifetime earnings in the U.S. by age group and gender.
Table 4 presents the counts and share of COVID-19 deaths in the U.S. by age group. 76.2% of all COVID-19 deaths in the U.S. occurred in people aged 65 or older, and 0.62% of the deaths occurred in the group of people aged under 30.
Table 4.
The counts and shares COVID-19 deaths in the U.S. by age group, March 2020–October 2021.
Using the numbers of COVID-19 deaths by sex and age at the state level from The Provisional COVID-19 Deaths by Sex and Age data (National Center for Health Statistics 2021b), we calculated the total indirect cost of COVID-19 deaths (Table 5) and the average indirect cost per COVID-19 death for each state (Table 6).
Table 5.
The total indirect cost of COVID-19 deaths by state, March 2020–October 2021.
Table 6.
The average indirect costs of COVID-19 deaths by state, March 2020–October 2021.
Since the indirect cost of COVID-19 deaths is defined as the loss of potential lifetime earnings, different states with different economic prosperity and per capita income levels will face different indirect costs. The average indirect cost of COVID-19 deaths for each state ranges from USD 73,104 (Vermont) to USD 587,831 (District of Columbia), depending on the state’s age distribution of COVID-19 deaths and the state’s economic prosperity (Table 6). The total indirect cost of COVID-19 deaths for each state ranges from USD 20.5 million (Vermont) to USD 27.1 billion (California), depending on the state’s number of deaths, the state’s age distribution of COVID-19 deaths, and the state’s economic prosperity (Table 5).
2.4. Total Economic Costs of COVID-19 Deaths
The state-level total opportunity cost of COVID-19 deaths is the combination of the state’s total direct medical cost and total loss of production due to COVID-19 deaths. The total economic costs of COVID-19 deaths by state in Table 7 are the summation of state-level total direct costs (from Table 3) and indirect costs (from Table 5).
Table 7.
The total costs of COVID-19 deaths by state, March 2020–October 2021.
3. Results
By October 2021, COVID-19 has contributed to 712,943 deaths in the U.S. The total economic cost of all the COVID-19 deaths is estimated at USD 197.9 billion. Of the total cost, 8.1%, or USD 16.02 billion, are direct medical costs, and 91.9% of the total cost, or USD 181.9 billion, comes from the decedents’ loss of potential lifetime earnings (Table 8).
Table 8.
Economic cost of COVID-19 deaths, March 2020–October 2021.
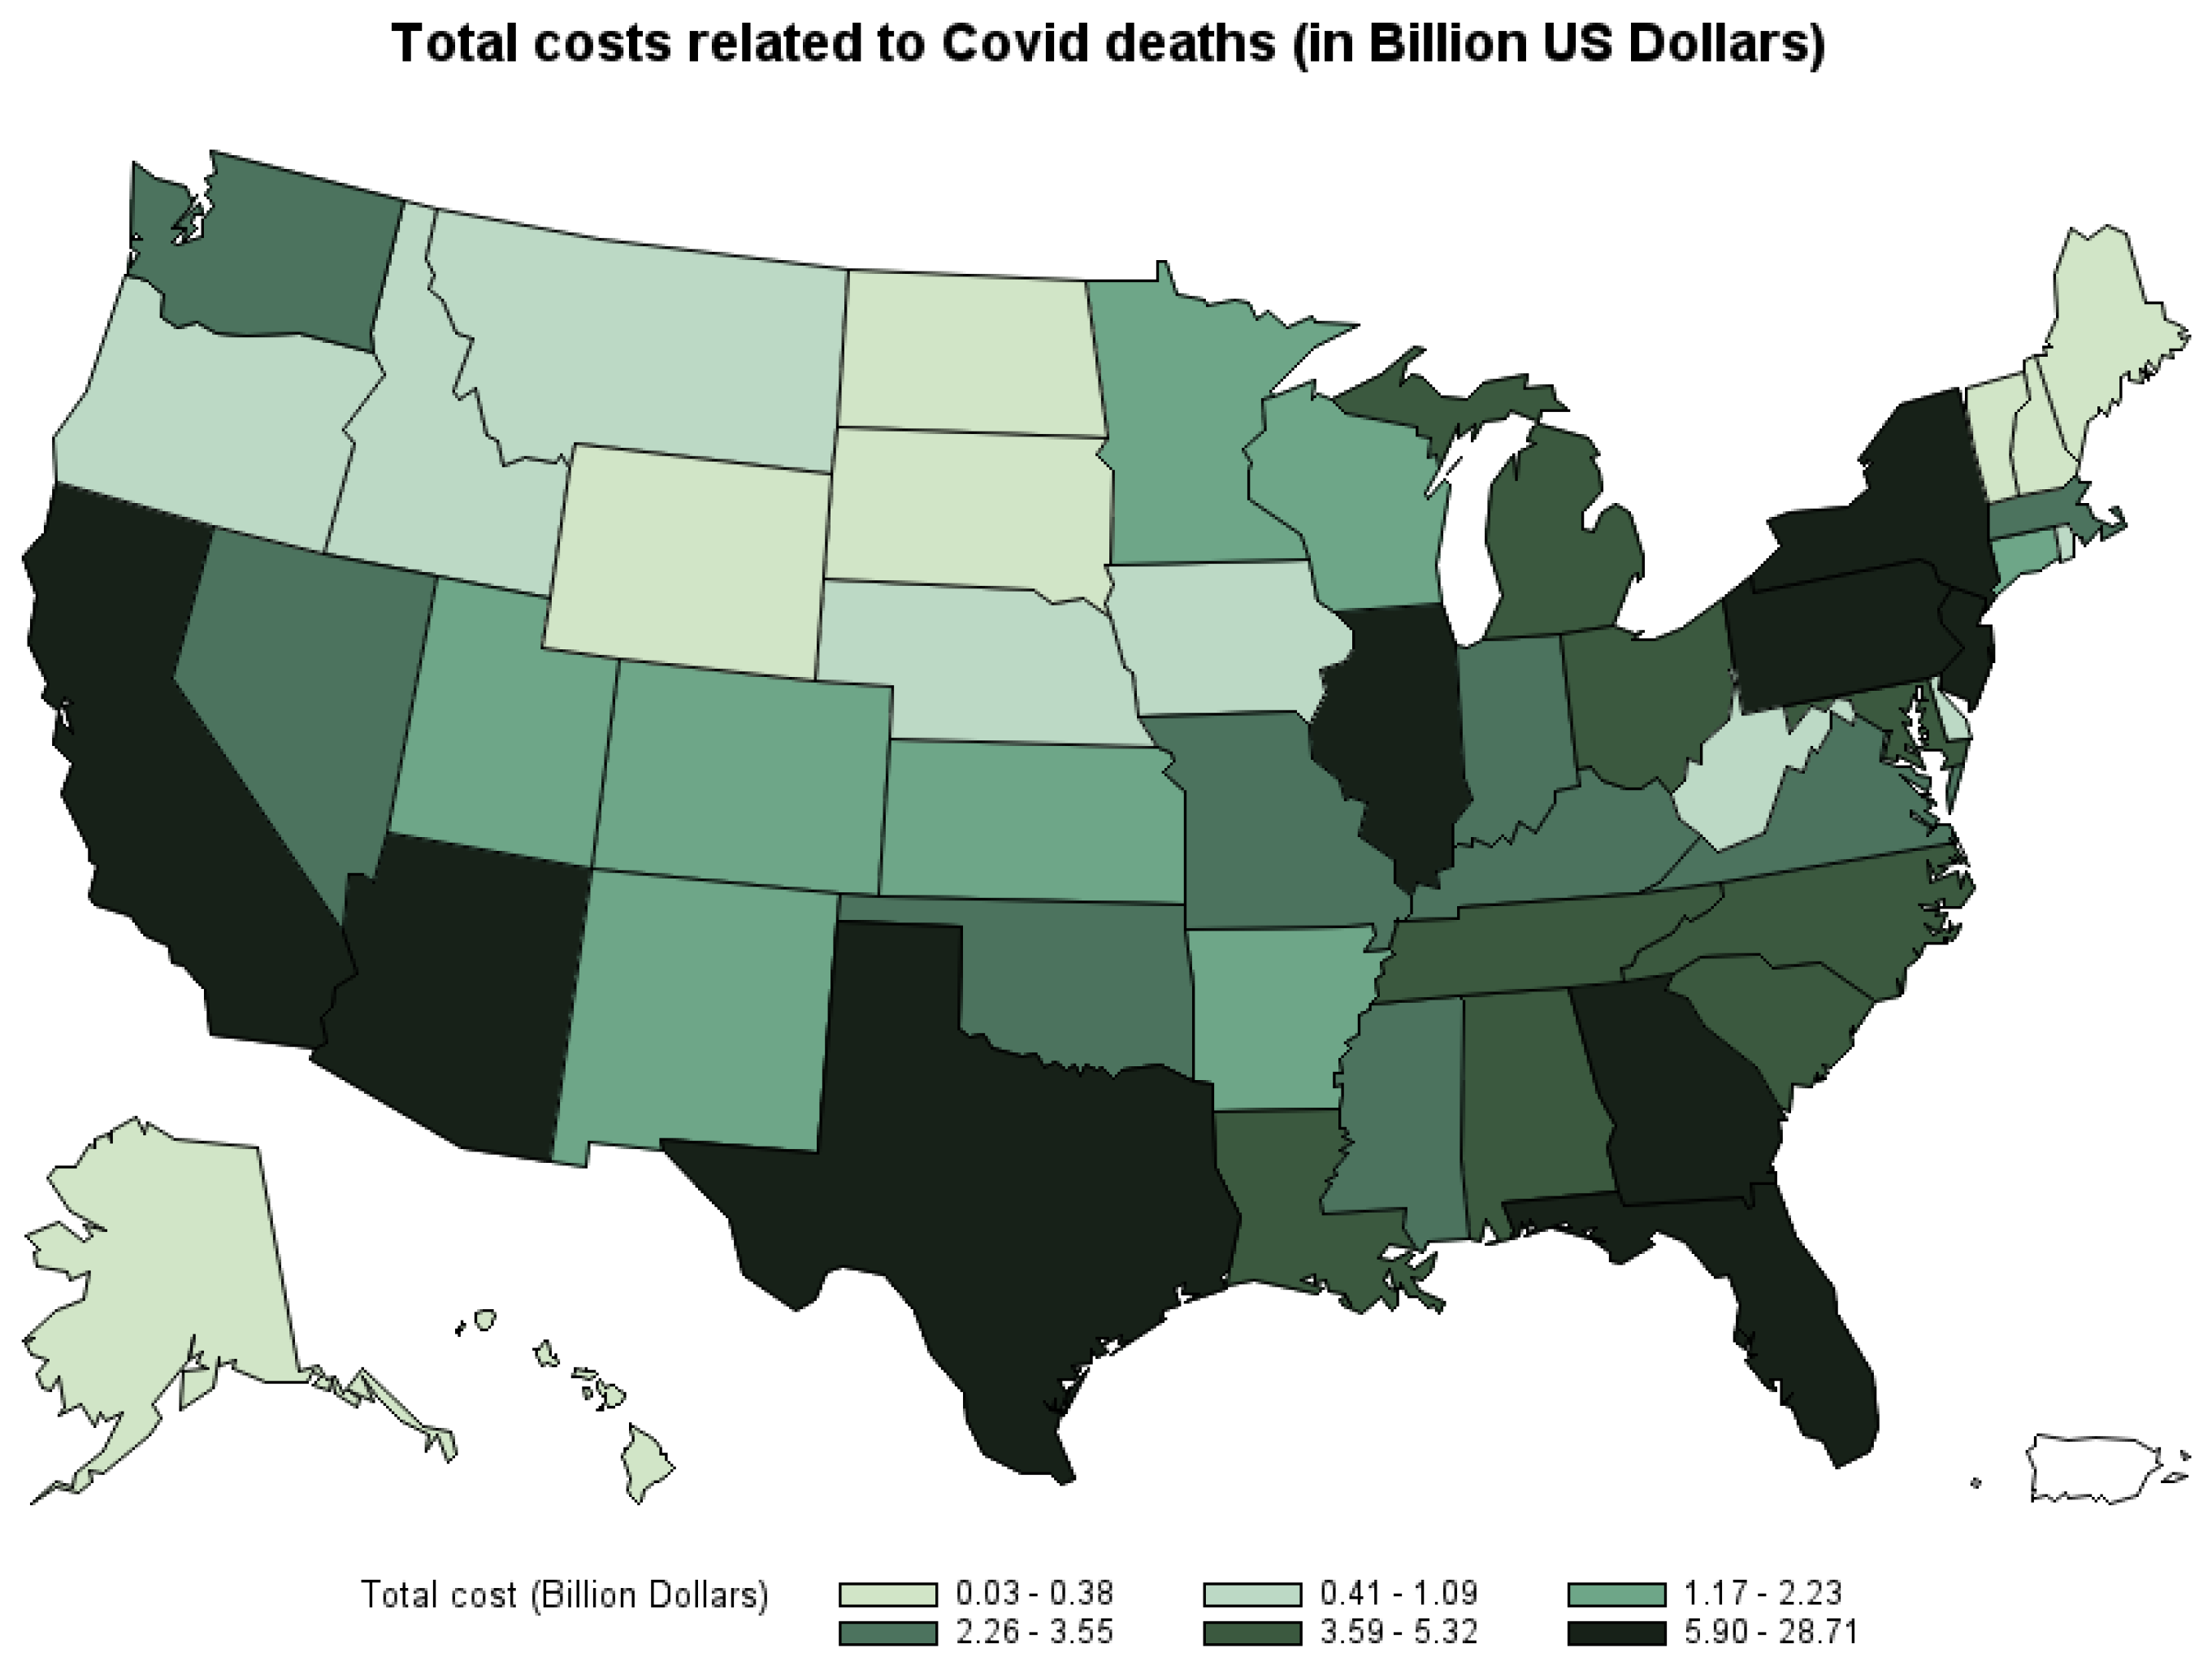
Figure 4 shows the total economic costs of COVID-19 deaths by state. The three states that suffer the highest cost of COVID-19 deaths are California (USD 28.7 billion), Texas (USD 28.02 billion), and Florida (USD 16.3 billion). The three states that have the lowest cost of COVID-19 deaths are Vermont (USD 26.8 million), New Hampshire (USD 173.5 million), and Maine (USD 181.5 million).8
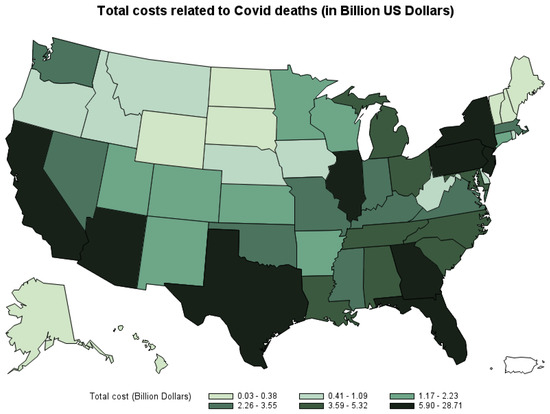
Figure 4.
Total economic cost of COVID-19 deaths by state, March 2020–October 2021.
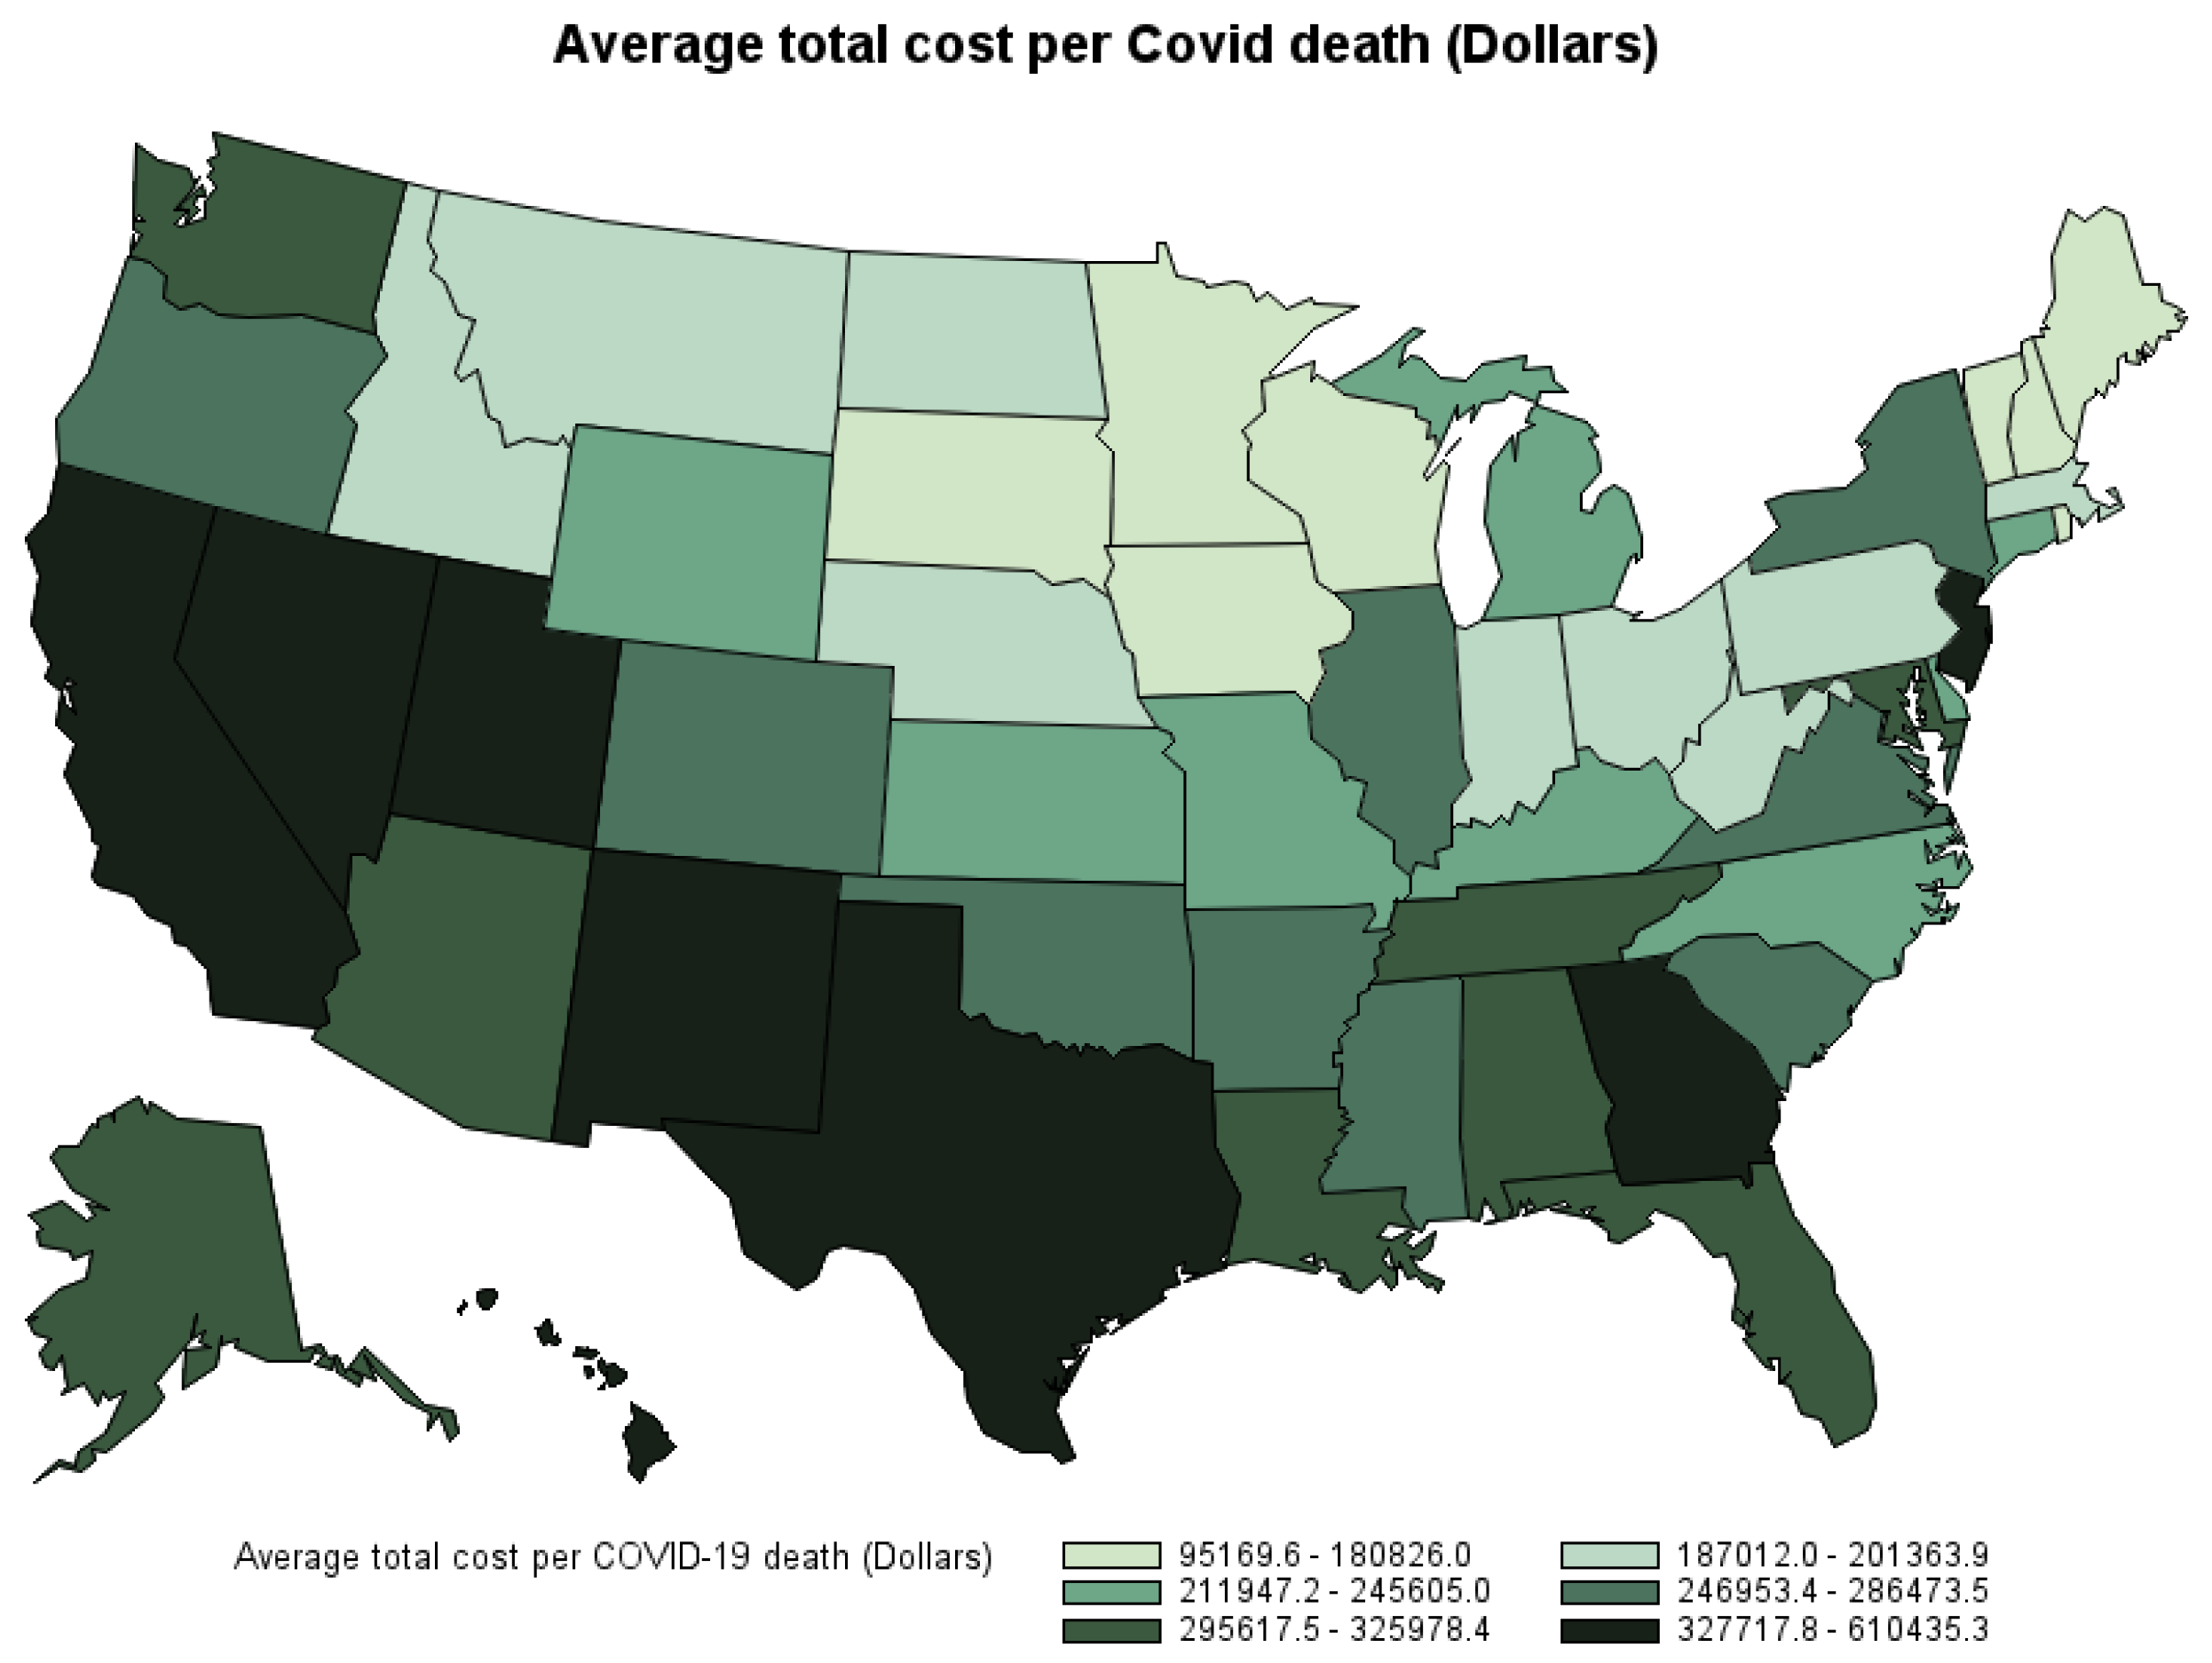
The average economic cost of COVID-19 death in the U.S. by the second week of October 2021 is estimated at USD 277,587 per death (Table 9). However, the state-level average economic cost per death varies depending on each state’s count of COVID-19 deaths by place of death, age, gender, and economic prosperity. Figure 5 shows the average economic cost per death by state. Hawaii, California, and Texas are the states with the highest average economic cost per COVID-19 death. Vermont, New Hampshire, and Maine are the states with the lowest average economic cost per COVID-19 death9.
Table 9.
Average economic cost per COVID-19 death, March 2020–October 2021.
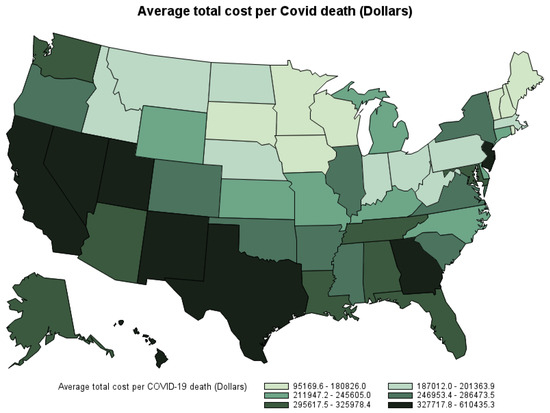
Figure 5.
Average economic cost per COVID-19 death by state by the second week of October 2021.
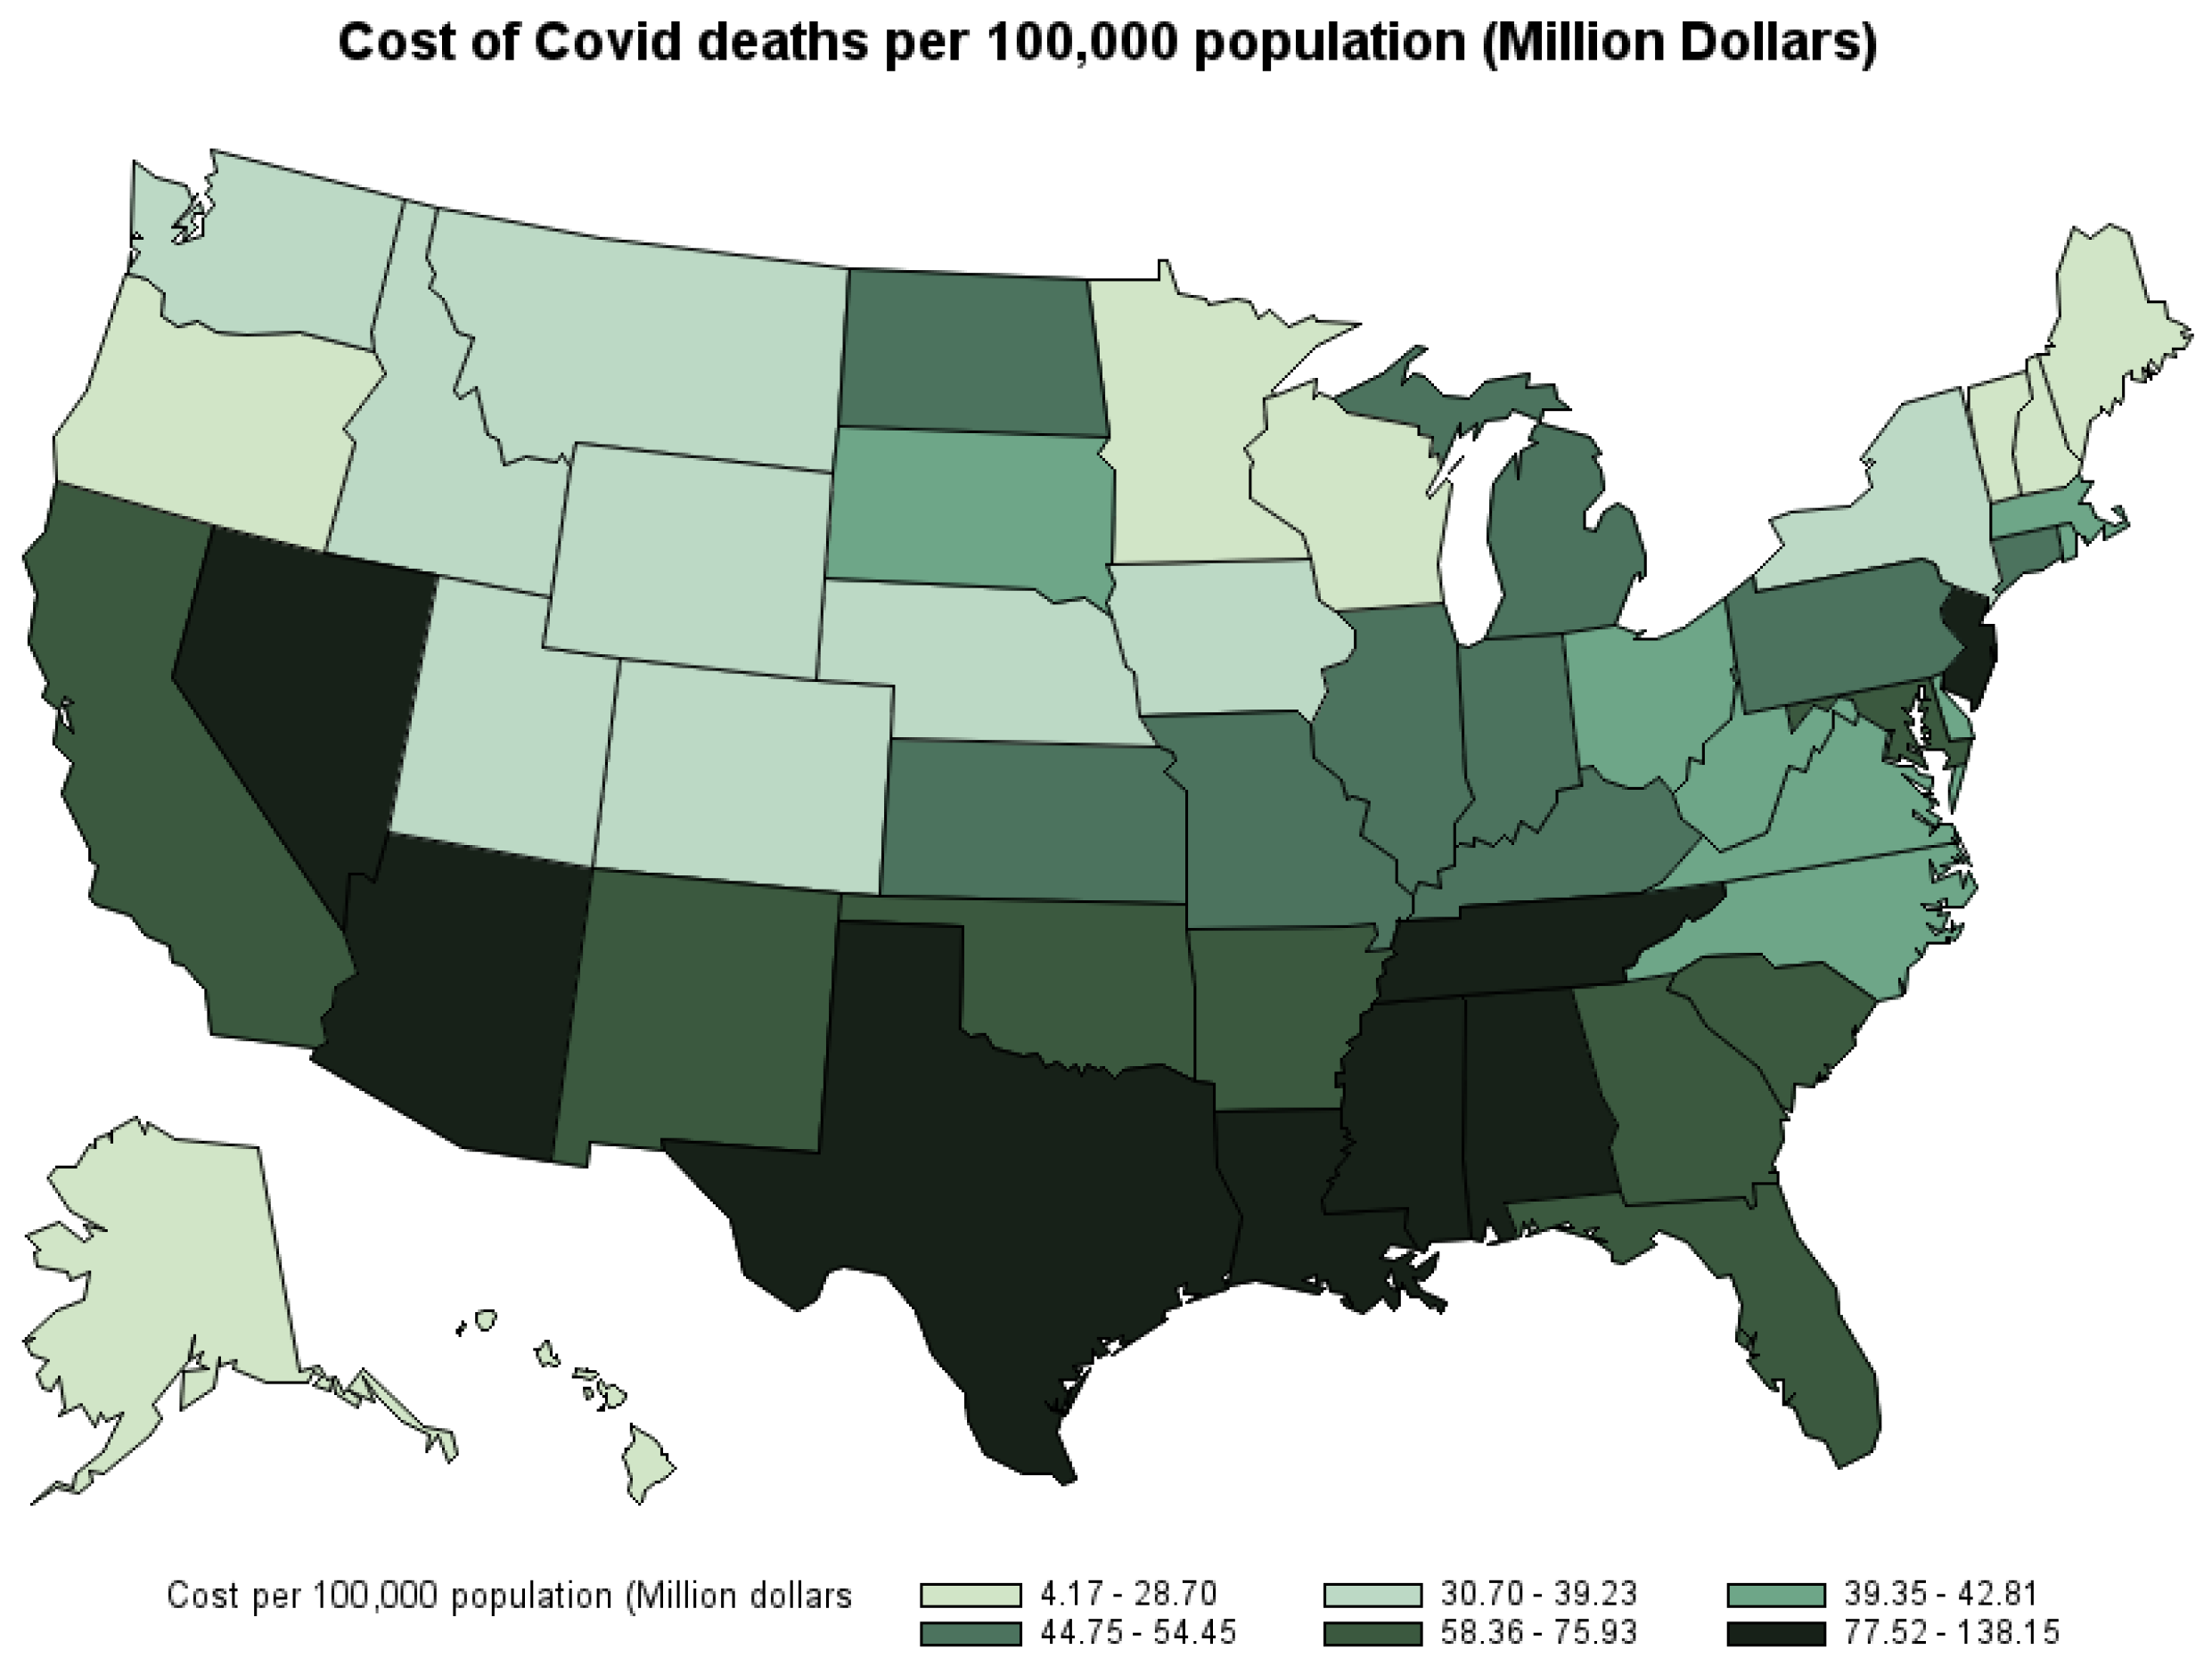
Figure 6 shows the economic cost of COVID-19 deaths per 100,000 population by state—that is, the share of the cost state’s residents have to shoulder. The three states with the highest cost per 100,000 population are Mississippi (USD 97.63 million), Texas (USD 96.64 million), and New Jersey (USD 91.19 million). The three states with the lowest per capita cost are Vermont (USD 4.17 million), New Hampshire (USD 12.6 million), and Maine (USD 13.32 million). 10
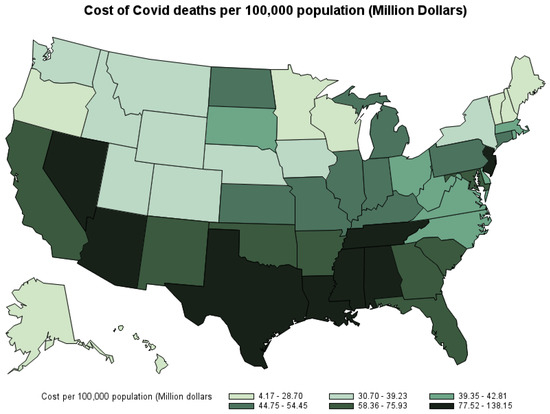
Figure 6.
Economic cost from COVID-19 deaths per 100,000 population by state, March 2020–October 2021.
4. Discussion
Our study encountered limitations due to the lack of data on the cost of COVID-19 treatment. The lack of readily and comprehensive data on the cost of COVID-19 treatment stems from several factors. First, the decentralized structure of the U.S. healthcare system leads to differences in billing practices, reimbursement rates, and healthcare delivery models among various states and healthcare providers. Second, the extent of insurance coverage for COVID-19 treatment varies among individuals, healthcare systems, insurance policies, and how health insurance providers negotiate with healthcare providers. Third, collecting accurate and comprehensive data on healthcare costs, particularly amid a rapidly evolving pandemic, presents significant challenges. In addition, healthcare cost data often contain sensitive information about patients, healthcare providers, and insurance providers, limiting the accessibility and sharing of detailed cost data. Therefore, we must rely on individual-based model estimations and the costs of treating different severity levels of pneumonia as approximations for the cost of treating COVID-19 patients.
5. Conclusions
We estimate the opportunity cost of COVID-19 deaths based on the direct medical cost and the loss of future earnings from premature deaths. According to our estimation, the U.S. has suffered a cost of USD 197.9 billion in COVID-19 deaths. The total cost of COVID-19 deaths varies with a person’s age, gender, state of residency, and the location where their death occurred. Of those USD 197.9 billion, 91.9% is from the indirect cost of loss of potential lifetime earnings, and 8.1% is from the estimated direct medical cost of treating COVID-19 symptoms and complications. On average, each COVID-19 death costs society USD 277,587.
This estimation does not consider the economic cost of COVID-19 infection and recovery, nor the potential cost of lost future productivity from COVID-19 survivors. Given that COVID-19 deaths have disproportionately impacted older individuals, the estimated impact on the loss of lifetime production is not as great as it might be for a pandemic affecting a younger population.
Since the magnitude of COVID-19 risk is different than sudden deaths from accidents, our study provides officials and lawmakers with another method to evaluate the costs and benefits of COVID-19 measures and policies as an alternative to the value of a statistical life.
Author Contributions
Conceptualization, T.P., G.J.J., and A.V.S.R.; methodology, T.P., G.J.J., and A.V.S.R.; software, T.P.; validation, T.P., G.J.J., and A.V.S.R.; formal analysis, T.P.; writing—original draft preparation, T.P., G.J.J., and A.V.S.R.; writing—review and editing, T.P., G.J.J., and A.V.S.R.; visualization, T.P. All authors have read and agreed to the published version of the manuscript.
Funding
This research received no external funding.
Informed Consent Statement
Not applicable.
Data Availability Statement
This study used publicly available data sources, including IPUMS USA: Version 11.0, CDC Provisional COVID-19 Deaths by Sex and Age data, and CDC Provisional COVID-19 Deaths by Place of Death and State data. IPUMS USA: Version 11.0 can be found at: https://www.ipums.org/projects/ipums-usa/d010.v11.0 (accessed on 20 March 2024). CDC Provisional COVID-19 Deaths by Sex and Age data can be found at: https://data.cdc.gov/NCHS/Provisional-COVID-19-Deaths-by-Sex-and-Age/9bhg-hcku/about_data (accessed on 20 March 2024). CDC Provisional COVID-19 Deaths by Place of Death and State data can be found at: https://data.cdc.gov/NCHS/Provisional-COVID-19-Deaths-by-Place-of-Death-and-/uggs-hy5q/about_data (accessed on 20 March 2024).
Conflicts of Interest
The authors declare no conflicts of interest.
Appendix A
Table A1.
Loss of potential lifetime earning in the U.S. by age and gender.
Table A1.
Loss of potential lifetime earning in the U.S. by age and gender.
| Age | Gender | Loss of Potential Lifetime Earning (USD) | Standard Error (USD) | Lower CI (USD) | Upper CI (USD) |
|---|---|---|---|---|---|
| 18 | Female | 1,491,318 | 36,166 | 1,418,676 | 1,563,961 |
| 19 | Female | 1,507,960 | 36,731 | 1,434,184 | 1,581,735 |
| 20 | Female | 1,521,910 | 37,038 | 1,447,517 | 1,596,302 |
| 21 | Female | 1,533,211 | 37,613 | 1,457,663 | 1,608,760 |
| 22 | Female | 1,542,393 | 38,180 | 1,465,706 | 1,619,079 |
| 23 | Female | 1,549,078 | 38,673 | 1,471,401 | 1,626,754 |
| 24 | Female | 1,550,817 | 38,854 | 1,472,775 | 1,628,858 |
| 25 | Female | 1,549,554 | 39,006 | 1,471,208 | 1,627,899 |
| 26 | Female | 1,542,359 | 39,089 | 1,463,846 | 1,620,871 |
| 27 | Female | 1,533,498 | 39,156 | 1,454,852 | 1,612,145 |
| 28 | Female | 1,522,975 | 39,013 | 1,444,616 | 1,601,334 |
| 29 | Female | 1,510,721 | 38,842 | 1,432,705 | 1,588,738 |
| 30 | Female | 1,495,709 | 38,521 | 1,418,337 | 1,573,080 |
| 31 | Female | 1,478,225 | 38,015 | 1,401,870 | 1,554,579 |
| 32 | Female | 1,458,376 | 37,343 | 1,383,370 | 1,533,382 |
| 33 | Female | 1,437,059 | 36,801 | 1,363,142 | 1,510,977 |
| 34 | Female | 1,413,570 | 36,184 | 1,340,892 | 1,486,248 |
| 35 | Female | 1,388,798 | 35,588 | 1,317,317 | 1,460,279 |
| 36 | Female | 1,360,836 | 34,680 | 1,291,180 | 1,430,493 |
| 37 | Female | 1,331,105 | 33,943 | 1,262,928 | 1,399,281 |
| 38 | Female | 1,302,007 | 33,012 | 1,235,701 | 1,368,313 |
| 39 | Female | 1,270,837 | 32,319 | 1,205,921 | 1,335,753 |
| 40 | Female | 1,238,919 | 31,846 | 1,174,956 | 1,302,883 |
| 41 | Female | 1,206,101 | 30,475 | 1,144,890 | 1,267,313 |
| 42 | Female | 1,170,229 | 29,349 | 1,111,280 | 1,229,179 |
| 43 | Female | 1,136,711 | 28,736 | 1,078,994 | 1,194,429 |
| 44 | Female | 1,100,249 | 27,794 | 1,044,424 | 1,156,075 |
| 45 | Female | 1,062,874 | 26,762 | 1,009,122 | 1,116,626 |
| 46 | Female | 1,023,312 | 25,526 | 972,040 | 1,074,583 |
| 47 | Female | 982,417 | 24,537 | 933,132 | 1,031,701 |
| 48 | Female | 942,120 | 23,343 | 895,234 | 989,006 |
| 49 | Female | 900,531 | 22,095 | 856,152 | 944,910 |
| 50 | Female | 858,772 | 20,953 | 816,686 | 900,857 |
| 51 | Female | 817,467 | 20,269 | 776,756 | 858,179 |
| 52 | Female | 773,234 | 19,476 | 734,115 | 812,353 |
| 53 | Female | 729,986 | 18,082 | 693,667 | 766,305 |
| 54 | Female | 687,783 | 17,155 | 653,327 | 722,240 |
| 55 | Female | 643,948 | 16,143 | 611,523 | 676,373 |
| 56 | Female | 597,605 | 14,645 | 568,190 | 627,020 |
| 57 | Female | 551,248 | 13,893 | 523,343 | 579,154 |
| 58 | Female | 503,938 | 12,551 | 478,728 | 529,147 |
| 59 | Female | 457,291 | 11,598 | 433,996 | 480,587 |
| 60 | Female | 409,558 | 10,714 | 388,038 | 431,078 |
| 61 | Female | 360,688 | 9238 | 342,134 | 379,242 |
| 62 | Female | 310,316 | 7945 | 294,358 | 326,274 |
| 63 | Female | 261,319 | 6528 | 248,207 | 274,432 |
| 64 | Female | 210,944 | 5370 | 200,158 | 221,730 |
| 65 | Female | 162,147 | 4341 | 153,428 | 170,867 |
| 66 | Female | 111,039 | 3257 | 104,497 | 117,581 |
| 67 | Female | 56,373 | 1913 | 52,530 | 60,216 |
| 18 | Male | 2,139,678 | 42,682 | 2,053,948 | 2,225,407 |
| 19 | Male | 2,165,305 | 43,438 | 2,078,057 | 2,252,552 |
| 20 | Male | 2,186,859 | 44,180 | 2,098,120 | 2,275,598 |
| 21 | Male | 2,204,880 | 44,945 | 2,114,606 | 2,295,154 |
| 22 | Male | 2,220,791 | 45,724 | 2,128,950 | 2,312,631 |
| 23 | Male | 2,232,759 | 46,541 | 2,139,279 | 2,326,239 |
| 24 | Male | 2,239,213 | 47,028 | 2,144,754 | 2,333,672 |
| 25 | Male | 2,243,386 | 47,404 | 2,148,173 | 2,338,600 |
| 26 | Male | 2,240,402 | 47,620 | 2,144,755 | 2,336,049 |
| 27 | Male | 2,234,852 | 47,874 | 2,138,695 | 2,331,009 |
| 28 | Male | 2,226,448 | 47,897 | 2,130,244 | 2,322,652 |
| 29 | Male | 2,216,546 | 47,959 | 2,120,217 | 2,312,875 |
| 30 | Male | 2,203,549 | 47,786 | 2,107,569 | 2,299,530 |
| 31 | Male | 2,187,653 | 47,571 | 2,092,103 | 2,283,203 |
| 32 | Male | 2,167,701 | 47,295 | 2,072,706 | 2,262,696 |
| 33 | Male | 2,143,765 | 46,897 | 2,049,570 | 2,237,960 |
| 34 | Male | 2,117,179 | 46,224 | 2,024,336 | 2,210,022 |
| 35 | Male | 2,089,500 | 45,707 | 1,997,695 | 2,181,305 |
| 36 | Male | 2,055,806 | 45,133 | 1,965,153 | 2,146,458 |
| 37 | Male | 2,018,999 | 43,949 | 1,930,725 | 2,107,273 |
| 38 | Male | 1,980,941 | 43,219 | 1,894,133 | 2,067,750 |
| 39 | Male | 1,939,040 | 42,232 | 1,854,215 | 2,023,865 |
| 40 | Male | 1,894,646 | 41,165 | 1,811,964 | 1,977,328 |
| 41 | Male | 1,850,927 | 40,350 | 1,769,883 | 1,931,972 |
| 42 | Male | 1,800,477 | 38,529 | 1,723,090 | 1,877,865 |
| 43 | Male | 1,751,618 | 37,192 | 1,676,915 | 1,826,321 |
| 44 | Male | 1,696,515 | 35,389 | 1,625,434 | 1,767,597 |
| 45 | Male | 1,643,458 | 34,268 | 1,574,628 | 1,712,288 |
| 46 | Male | 1,590,482 | 33,447 | 1,523,303 | 1,657,662 |
| 47 | Male | 1,532,628 | 32,514 | 1,467,322 | 1,597,935 |
| 48 | Male | 1,473,357 | 31,168 | 1,410,754 | 1,535,959 |
| 49 | Male | 1,413,613 | 30,130 | 1,353,095 | 1,474,132 |
| 50 | Male | 1,350,678 | 29,070 | 1,292,289 | 1,409,067 |
| 51 | Male | 1,283,763 | 27,019 | 1,229,494 | 1,338,033 |
| 52 | Male | 1,218,855 | 25,578 | 1,167,480 | 1,270,229 |
| 53 | Male | 1,150,315 | 23,333 | 1,103,450 | 1,197,180 |
| 54 | Male | 1,083,208 | 21,923 | 1,039,174 | 1,127,243 |
| 55 | Male | 1,015,618 | 20,718 | 974,004 | 1,057,231 |
| 56 | Male | 944,036 | 18,804 | 906,268 | 981,804 |
| 57 | Male | 872,973 | 17,747 | 837,327 | 908,619 |
| 58 | Male | 801,887 | 16,513 | 768,719 | 835,054 |
| 59 | Male | 729,080 | 15,256 | 698,437 | 759,723 |
| 60 | Male | 654,849 | 13,908 | 626,913 | 682,785 |
| 61 | Male | 576,965 | 12,202 | 552,456 | 601,473 |
| 62 | Male | 500,863 | 10,661 | 479,450 | 522,276 |
| 63 | Male | 422,833 | 9503 | 403,744 | 441,921 |
| 64 | Male | 345,665 | 8785 | 328,020 | 363,310 |
| 65 | Male | 263,179 | 6151 | 250,825 | 275,533 |
| 66 | Male | 177,665 | 4847 | 167,929 | 187,402 |
| 67 | Male | 90,807 | 2660 | 85,464 | 96,150 |
Table A2.
The economic (opportunity) cost of COVID-19 deaths by state, March 2020–October 2021.
Table A2.
The economic (opportunity) cost of COVID-19 deaths by state, March 2020–October 2021.
| State | COVID-19 Deaths per 100,000 Population | Total Cost of COVID-19 Deaths (USD) | Average Cost of COVID-19 Deaths (USD) | Cost of COVID-19 Deaths per 100,100 Population (USD) |
|---|---|---|---|---|
| Alabama | 292 | 4,502,349,787 | 306,619 | 89,610,000 |
| Alaska | 77 | 185,498,888 | 325,978 | 25,290,000 |
| Arizona | 256 | 5,897,429,919 | 324,354 | 82,900,000 |
| Arkansas | 274 | 2,035,898,457 | 247,094 | 67,600,000 |
| California | 185 | 28,713,952,363 | 394,271 | 72,890,000 |
| Colorado | 140 | 2,232,696,952 | 276,724 | 38,670,000 |
| Connecticut | 239 | 1,916,209,318 | 222,772 | 53,140,000 |
| Delaware | 194 | 407,998,085 | 211,947 | 41,210,000 |
| District of Columbia | 226 | 952,618,161 | 610,435 | 138,150,000 |
| Florida | 257 | 16,282,590,875 | 295,617 | 75,930,000 |
| Georgia | 222 | 8,069,050,457 | 340,959 | 75,720,000 |
| Hawaii | 58 | 339,002,342 | 400,418 | 23,290,000 |
| Idaho | 166 | 598,961,785 | 196,504 | 32,570,000 |
| Illinois | 193 | 6,765,680,713 | 274,809 | 53,030,000 |
| Indiana | 230 | 3,036,781,877 | 194,835 | 44,750,000 |
| Iowa | 212 | 1,075,754,808 | 158,994 | 33,720,000 |
| Kansas | 205 | 1,326,793,854 | 219,923 | 45,160,000 |
| Kentucky | 223 | 2,264,497,783 | 225,640 | 50,260,000 |
| Louisiana | 266 | 3,788,664,030 | 305,523 | 81,340,000 |
| Maine | 87 | 181,471,425 | 152,509 | 13,320,000 |
| Maryland | 182 | 3,604,970,718 | 321,060 | 58,360,000 |
| Massachusetts | 202 | 2,792,007,999 | 196,140 | 39,720,000 |
| Michigan | 199 | 4,906,365,831 | 244,935 | 48,690,000 |
| Minnesota | 147 | 1,471,887,690 | 175,420 | 25,790,000 |
| Mississippi | 341 | 2,890,979,794 | 286,474 | 97,630,000 |
| Missouri | 235 | 3,351,252,430 | 231,549 | 54,450,000 |
| Montana | 195 | 425,348,273 | 201,364 | 39,230,000 |
| Nebraska | 168 | 654,910,083 | 199,182 | 33,390,000 |
| Nevada | 244 | 2,532,488,374 | 333,954 | 81,570,000 |
| New Hampshire | 107 | 173,548,978 | 117,173 | 12,600,000 |
| New Jersey | 278 | 8,470,357,174 | 327,718 | 91,190,000 |
| New Mexico | 225 | 1,601,072,615 | 336,214 | 75,610,000 |
| New York | 134 | 6,675,133,362 | 246,953 | 33,040,000 |
| North Carolina | 174 | 4,468,789,224 | 245,605 | 42,810,000 |
| North Dakota | 239 | 366,888,686 | 196,816 | 47,090,000 |
| Ohio | 220 | 4,857,608,529 | 187,012 | 41,170,000 |
| Oklahoma | 272 | 2,878,615,072 | 266,876 | 72,700,000 |
| Oregon | 99 | 1,089,397,869 | 260,440 | 25,710,000 |
| Pennsylvania | 236 | 5,958,481,801 | 194,353 | 45,820,000 |
| Rhode Island | 255 | 431,828,725 | 154,611 | 39,350,000 |
| South Carolina | 248 | 3,591,425,909 | 283,365 | 70,170,000 |
| South Dakota | 251 | 379,480,965 | 170,450 | 42,800,000 |
| Tennessee | 260 | 5,322,669,598 | 298,522 | 77,520,000 |
| Texas | 246 | 28,019,667,234 | 393,611 | 96,640,000 |
| Utah | 100 | 1,166,700,588 | 358,310 | 35,660,000 |
| Vermont | 44 | 26,824,028 | 95,170 | 4,170,000 |
| Virginia | 149 | 3,552,556,141 | 276,514 | 41,160,000 |
| Washington | 100 | 2,365,287,745 | 308,106 | 30,700,000 |
| West Virginia | 207 | 718,524,922 | 193,687 | 40,060,000 |
| Wisconsin | 159 | 1,691,505,297 | 180,826 | 28,700,000 |
| Wyoming | 162 | 219,040,247 | 233,470 | 37,970,000 |
Notes
| 1 | See: https://www.ers.usda.gov/data-products/chart-gallery/gallery/chart-detail/?chartId=102643 (accessed on 28 May 2024) |
| 2 | This value is adjusted to the 2020 dollar from the reported USD 7.4 million in 2006 dollars. |
| 3 | This cost is inflated to 2020 dollars from a reported USD 9763 cost of treating pneumonia without complication (Chen et al. 2020; Rae et al. 2020). |
| 4 | This cost is inflated to the 2020 dollar from reported USD 20,292 cost of treating pneumonia with ventilator in 2018 (Rae et al. 2020). |
| 5 | This cost is inflated to 2020 dollars from reported USD 61,168 cost of treating pneumonia with ventilator in 2018 (Rae et al. 2020). |
| 6 | This average cost of a one-way ambulance trip is adjusted to 2020 dollars from reported 2015 U.S. dollar costs of USD 463 (Peterson et al. 2021). |
| 7 | See Table A1 for the calculated potential loss of lifetime earnings in the U.S. by gender and age. |
| 8 | See Table A2. |
| 9 | See Note 8. |
| 10 | See Note 8. |
References
- Adler, Matthew. 2020. What Should We Spend to Save Lives in a Pandemic? A Critique of the Value of Statistical Life. Duke Law School Public Law & Legal Theory Series No. 2020-40. Available online: https://ssrn.com/abstract=3636550 (accessed on 20 March 2024).
- Adler, Matthew D., Maddalena Ferranna, James K. Hammitt, and Nicolas Treich. 2021. Fair innings? The utilitarian and prioritarian value of risk reduction over a whole lifetime. Journal of Health Economics 75: 102412. [Google Scholar] [CrossRef] [PubMed]
- Allen, Douglas W. 2020. COVID-19 lockdown cost/benefits: A critical assessment of the literature. International Journal of the Economics of Business 29: 1–32. [Google Scholar] [CrossRef]
- Bartsch, Sarah M., Marie C. Ferguson, James A. McKinnell, Kelly J. O’shea, Patrick T. Wedlock, Sheryl S. Siegmund, and Bruce Y. Lee. 2020. The potential health care costs and resources use associated with COVID-19 in the United States. Health Affairs 39: 927–35. [Google Scholar] [CrossRef] [PubMed]
- Chen, Jiangzhuo, Anil Vullikanti, Stefan Hoops, Henning Mortveit, Bryan Lewis, Srinivasan Venkatramanan, Wen You, Stephen Eubank, Madhav Marathe, Chris Barrett, and et al. 2020. Medical costs of keeping the US economy open during COVID-19. Science Report 10: 18422. [Google Scholar] [CrossRef] [PubMed]
- Colmer, Jonathan. 2020. What is the meaning of (statistical) life? benefit–cost analysis in the time of COVID-19. Oxford Review of Economic Policy 36: S56–S63. [Google Scholar] [CrossRef]
- Doran, Christopher M., Rod Ling, Jorgen Gullestrup, Sarah Swannell, and Allison Milner. 2015. The impact of a suicide prevention strategy on reducing the economic cost of suicide in the New South Wales construction industry. Crisis 37: 121–29. [Google Scholar] [CrossRef] [PubMed]
- Finkelstein, Eric R., Phaedra S. Corso, Ted R. Miller, Ian Fiebelkorn, and Eduard Zaloshnja. 2006. Incidence and Economic Burden of Injuries in the United States. New York: Oxford University Press, vol. 61. [Google Scholar] [CrossRef]
- Herrera-Araujo, Daniel, and Lise Rochaix. 2020. Does the value per statistical life vary with age or baseline health? evidence from a compensating wage study in france. Journal of Environmental Economics and Management 103: 102338. [Google Scholar] [CrossRef]
- Lawrence, Bruce, and Ted Miller. 2014. Medical and Work Loss Cost Estimation Methods for the WISQARS Cost of Injury Module. Calverton: Pacific Institute for Research & Evaluation. [Google Scholar] [CrossRef]
- National Center for Health Statistics. 2021a. Provisional COVID-19 Deaths by Place of Deaths. Centers for Disease Control and Prevention. Available online: https://data.cdc.gov/NCHS/Provisional-COVID-19-Deaths-by-Place-of-Death-and-/uggs-hy5q (accessed on 13 October 2021).
- National Center for Health Statistics. 2021b. Provisional COVID-19 Deaths by Sex and Age. Centers for Disease Control and Prevention. Available online: https://data.cdc.gov/NCHS/Provisional-COVID-19-Deaths-by-Sex-and-Age/9bhg-hcku (accessed on 13 October 2021).
- O’Dea, Des, and Sarah Tucker. 2005. The Cost of Suicide to Society. Wellington: Ministry of Health. ISBN 0-478-29638-X. [Google Scholar]
- Oliveira, Eduardo, Amay Parikh, Arnaldo Lopez-Ruiz, Maria Carrilo, Joshua Goldberg, Martin Cearras, Khaled Fernainy, Sonja Andersen, Luis Mercado, Jian Guan, and et al. 2021. Icu outcomes and survival in patients with severe COVID-19 in the largest healthcare system in central Florida. PLoS ONE 16: e0249038. [Google Scholar] [CrossRef] [PubMed]
- Peterson, Cora, Likang Xu, and Curtis Florence. 2021. Average medical cost of fatal and non-fatal injuries by type in the USA. Injury Prevention 27: 24–33. [Google Scholar] [CrossRef] [PubMed]
- Rae, Matthew, Gary Claxton, Nisha Kurani, Daniel McDermott, and Cynthia Cox. 2020. Potential Costs of Coronavirus Treatment for People with Employer Coverage. Peterson Center on Healthcare and Kaiser Family Foundation. Available online: https://www.healthsystemtracker.org/brief/potential-costs-of-coronavirus-treatment-for-people-with-employer-coverage/ (accessed on 18 November 2021).
- Ruggles, Steven, Sarah Flood, Sophia Foster, Ronald Goeken, Jose Pacas, Megan Schouweiler, and Matthew Sobek. 2021. IPUMS USA: Version 11.0 [Dataset]. Minneapolis: IPUMS. [Google Scholar] [CrossRef]
- Sweis, Nadia J. 2022. Revisiting the value of a statistical life: An international approach during COVID-19. Risk Management 24: 259–72. [Google Scholar] [CrossRef]
- Viscusi, W. Kip. 2010. The heterogeneity of the value of statistical life: Introduction and overview. Journal of Risk and Uncertainty 40: 1–13. [Google Scholar] [CrossRef]
Disclaimer/Publisher’s Note: The statements, opinions and data contained in all publications are solely those of the individual author(s) and contributor(s) and not of MDPI and/or the editor(s). MDPI and/or the editor(s) disclaim responsibility for any injury to people or property resulting from any ideas, methods, instructions or products referred to in the content. |
© 2024 by the authors. Licensee MDPI, Basel, Switzerland. This article is an open access article distributed under the terms and conditions of the Creative Commons Attribution (CC BY) license (https://creativecommons.org/licenses/by/4.0/).