Article

Urbanization and Health Expenditure: An Empirical Investigation from Households in Vietnam

by
Hang Thu Nguyen-Phung
1,2,* and
Hai Le
3
1
Research Division, Asian Growth Research Institute, Fukuoka 803-0814, Japan
2
Faculty of Information Technology, Hanoi University, Hanoi 100000, Vietnam
3
Department of Business, Swinburne Vietnam, FPT University, Hanoi 700000, Vietnam
*
Author to whom correspondence should be addressed.
Economies 2024, 12(6), 153; https://doi.org/10.3390/economies12060153
Submission received: 26 December 2023 / Revised: 17 April 2024 / Accepted: 9 May 2024 / Published: 16 June 2024
(This article belongs to the Special Issue Regional Development: Opportunities and Constraints)

Abstract

:
This study examines the effects of urbanization on household health expenditure. Using a unique bi-annually household-level dataset from 2012–2016 from Vietnam, we obtain key findings as follows. To mitigate possible endogeneity concerns, we utilize a two-stage least squares regression (2SLS) approach, employing the development of information and communication (ICT) infrastructure at the province level as an instrumental variable (IV). The key findings can be summarized as follows. First, urbanization significantly reduces Vietnamese households’ inpatient and outpatient health expenses. Second, the self-treatment expenses of households increase as the process of urbanization advances. In addition, we perform various robustness checks, encompassing different measures of urbanization, the use of lag of urbanization as an additional IV, and the plausible exogenous IV. The outcomes derived from these rigorous sensitivity analyses substantiate the reliability and consistency of our key results. Finally, we propose different ways to explain these results, including health insurance expenses and household income.
Subject Classification Codes:
D10; I10; I15; I31; O10; O18

1. Introduction

Industrialization, along with the rapid development of technology, has fueled the expansion of urban areas globally (see, e.g., Shao et al. 2022; Zheng and Walsh 2019; Gollin et al. 2016). Urbanization is now considered an inevitable and essential trend for the progress of human society (see, e.g., Wang and Xu 2023; Zhu et al. 2022). It stimulates economic growth by creating demand and generating opportunities for innovation and development. According to the World Cities Report 2022 of the United Nations Human Settlements Programme (UN-Habitat), the world will continue to urbanize for the next 30 years, with urban areas accounting for all population growth. Additionally, although there has been some temporary migration from urban to rural areas due to the COVID-19 pandemic, this is not expected to change the overall trend toward urbanization. This means that the percentage of the world’s population living in urban regions is expected to rise by 12% from 56% in 2021 to 68% in 2050, representing an additional 2.2 billion urban residents, with Africa and Asia experiencing the most remarkable growth. All regions of the world will become more urbanized, but developed regions may experience a decline in urban growth rate. Urbanization refers to the process of transformation from rural living to an urban lifestyle that can have significant implications for people’s health and well-being.1 The effects of urbanization on health can be intricate and diverse, including both favorable and unfavorable outcomes (Yang et al. 2013). On the one hand, urbanization can provide access to better healthcare resources and services, potentially leading to improved health outcomes for residents (Dye 2008). On the other hand, urbanization can also lead to adverse health outcomes, such as increased exposure to environmental pollutants and the adoption of sedentary lifestyles (see, e.g., Li et al. 2012; Van de Poel et al. 2012). Healthcare expenditure is a vital part of residents’ daily expenses that encompasses spending on medicines, medical, and health services and is considered a crucial indicator of the quality of life (Nguyen-Phung and Le 2024). The impact of urbanization on healthcare expenditure is also a complex issue that varies depending on several factors. As urbanization progresses, residents may face higher healthcare costs due to increased demand for healthcare resources and services and changes in health behavior. On the other hand, urbanization can also lead to enhancements in healthcare infrastructure and better public health outcomes, reducing healthcare costs in the long run (Shen and Sun 2023; Shao et al. 2022). Therefore, it is imperative to investigate the impact of urbanization on healthcare expenditure to understand its potential effects on residents’ quality of life and economic development.
Urbanization in Vietnam has been rapid and profound, with the urban population increasing from around 20% in 1990 to over 38% in 2021, according to the 2018 Revision of World Urbanization Prospects of the United Nations Population Division. This growth has been driven by industrialization, urbanization policies, and migration from rural to urban regions. Furthermore, the political reforms enacted during the 1980s facilitated enhanced economic stability in Vietnam over the subsequent decade, thereby fostering heightened levels of urbanization. While larger cities like Ho Chi Minh City and Hanoi have experienced the fastest growth, smaller towns and cities have also witnessed substantial increases in both population and economic activity. One primary driver of urbanization in Vietnam has been industrialization, particularly in the manufacturing and service sectors. As Vietnam has opened up to foreign investment and trade, many multinational corporations have established factories and offices in the country’s major cities. This has created job opportunities and driven economic growth but has also led to environmental degradation and social inequality, as low-skilled workers are often concentrated in informal settlements with poor living conditions. Another factor driving urbanization in Vietnam is government policy. The implementation of economic reforms in the 1980s, known as “Doi Moi”, brought about increased economic stability in Vietnam. This newfound stability resulted in higher levels of urbanization in the following decade as people began to move from rural to urban areas in search of better jobs and living conditions. This trend was particularly noticeable in major cities such as Hanoi and Ho Chi Minh City, which experienced significant growth during this period. In recent decades, the Vietnamese government has instituted various policies to promote urbanization as a strategy to attain economic growth and modernization. This has involved investment in infrastructure, such as roads, bridges, and public transportation systems, to support urban growth. More specifically, in order to facilitate and manage the development of urbanization effectively, the Vietnamese government introduced the 2009 Adjustment of Orientation Master Plan for Urban Development until 2025 with a vision to 2050 (AOMP). Two national programs for urban development supplement the AOMP. First, the 2009 National Urban Upgrading Program (NUUP) was introduced to support the implementation of the AOMP and to target interventions in disadvantaged urban areas. Second, the 2012 National Urban Development Program (NUDP) was implemented to provide better-defined mechanisms for the AOMP and to align it with the Socio-economic Development Strategy further. Additionally, the Socio-economic Development Strategy 2011–2020 (SEDS) and the Vietnam Sustainable Development Strategy 2011–2020 offer overall guidance for development in Vietnam. Given these well-established urban policy frameworks, Vietnam is expected to experience a continued upward trend in urbanization rates. It is essential to recognize that healthcare expenditure among residents has increased significantly in Vietnam over the past few years alongside the process of urbanization. According to the Global Health Expenditure database of the World Health Organization, the per capita health expenditure in 2020 is USD 180.72, which is equivalent to an increase of USD 71.78 compared to 2012.
Given the significant impact of urbanization on residents’ lifestyles, it is crucial to explore the relationship between urbanization and healthcare expenditure. Such research would be of practical significance for urban management and policy development in Vietnam. As urbanization progresses, residents’ healthcare demands and behaviors may change, potentially leading to increased healthcare expenditure. Understanding these potential effects can inform policy decisions related to healthcare infrastructure development and resource allocation. Therefore, research on the relationship between urbanization and healthcare expenditure is crucial for effectively managing the impact of urbanization on residents’ quality of life in Vietnam. To the best of our knowledge, this is the first study examining the impacts of urbanization on household health expenditure in Vietnam. Using unique household-level data collection from 2012 to 2016 in Vietnam, we obtain the following key results. First, urbanization leads to a significant decrease in inpatient and outpatient health costs incurred by Vietnamese households. Second, the self-treatment expenses of households tend to rise as urbanization progresses. Several robustness checks conducted on the key findings confirm their validity.
The remainder of this study is structured as follows. Section 2 presents the related literature. Section 3 describes research data and variable definitions. Section 4 reports the research methodology. Section 5 presents empirical findings, including the main results, several robustness checks, and pathways. Section 6 provides conclusions and discusses the main results.

2. Related Literature

2.1. Impacts of Urbanization on Health and Health Expenditure

2.1.1. Impacts of Urbanization on Health

The effects of urbanization on human well-being are dual in nature. On the one hand, urbanization can offer increased accessibility to health services and improved water quality and sanitation infrastructure (see, e.g., Shen and Sun 2023; Shao et al. 2022; Miao and Wu 2016). For instance, Shen and Sun (2023) construct panel data from the China Family Panel Study (CFPS) and use the difference-in-difference approach to investigate the impact of the in situ urbanization policy (IUP) on individual health.2 They demonstrate that in contrast to other forms of urbanization that have been associated with adverse effects on mental health and increased smoking or alcohol consumption, this policy substantially improves self-reported health status among the affected population. They explain that the implementation of IUP can potentially enhance individuals’ optimism for the future, contentment with their present circumstances, and enrollment in medical insurance, ultimately leading to better self-reported health status.
On the other hand, several studies demonstrate that urbanization may give rise to stressful lifestyles, higher mortality, nutritionally imbalanced diets, excessive weight, hypertension, and greater metabolic and cancer risks, all of which can contribute to poor health outcomes (see, e.g., Fu and Land 2017; Danaei et al. 2013; Attard et al. 2012; Gong et al. 2012; Li et al. 2012; Van de Poel et al. 2012). As an example, Li et al. (2012) employ remote sensing image analysis that is based on night light data to study the impacts of urbanization on human health in China. They find that the transformation of the urban environment and residents’ lifestyles as a consequence of urbanization and urban expansion leads to health issues. Furthermore, their analysis shows that areas that experience greater degrees of urbanization tend to have a greater prevalence of chronic diseases.

2.1.2. Impacts of Urbanization on Health Expenditure

There have been few studies that have explored the nexus between urbanization and healthcare expenses. For instance, Thornton and Rice (2008) employ US data in 1998 for 50 states to examine the factors influencing healthcare spending. Their analysis reveals solid empirical evidence that states with lower levels of urbanization have higher healthcare spending. Wang (2009) re-examines the factors that influence health expenditure using 5-year US state-level data from 1999 to 2003 and finds that urbanization reduces health expenditure similarly. He demonstrates that the resulting effect of urbanization is understandable, given that providing healthcare to populations living in rural regions is far more expensive than those in urban areas. Shao et al. (2022), using a fixed-effect framework and annual data from 31 Chinese provinces from 2001 to 2019, examine the effect of urbanization on healthcare expenditure. They find a substantial rise in healthcare spending in Eastern and Central regions, which can be attributed to the process of urbanization. However, the influence of urbanization on healthcare spending in the Western region is negligible, possibly due to the region’s low urbanization rate and underdeveloped economy.

2.2. Underlying Pathways of the Effects of Urbanization on Health Expenditure

One notable limitation of existing empirical research on the connection between urbanization and health expenditure is that they do not provide a comprehensive explanation of the pathways through which urbanization affects health expenditure. Nonetheless, two possible mechanisms are explored.
The first channel is health insurance. Health insurance has been found to substantially increase household access to and utilization of health services, thereby facilitating healthcare financing (Anderson et al. 2012; Harmon and Nolan 2001; Ifeagwu et al. 2021). In addition, it functions as a safeguard against excessive healthcare costs, which can lead to financial hardship (Lim et al. 2023). Empirical evidence suggests that enrollment in the health insurance program is closely linked with a reduction in inpatient and outpatient medical expenses across all demographics, with a more pronounced effect observed among individuals with lower socioeconomic status in Vietnam (Thanh et al. 2019; Jowett et al. 2004). The effect of health insurance on health-seeking behavior has yielded inconsistent findings in the literature. While some studies have reported a positive impact (Al-Hanawi et al. 2020; Levine et al. 2016; Waters et al. 2004), others have found no discernible effect (Raza et al. 2016) or adverse effects (Wagstaff and Lindelow 2008). However, empirical evidence suggests that health insurance can enhance the accessibility of high-quality healthcare services for impoverished or marginalized households (Duc Thanh et al. 2021; Sparrow et al. 2013).
The second pathway is household income, which has been proven to enhance health outcomes significantly (Frijters et al. 2005; Marmot 2002; Ettner 1996). Households that experience income growth over time tend to utilize more healthcare services since they are more concerned about the quality of medical care and may be more willing to pay for better healthcare services. Therefore, high-income households usually incur more health-related expenses (Dang 2018).

3. Sample Construction

3.1. Data Source

The primary data source for this research is the Vietnam Household Living Standard Surveys (VHLSS) from 2012 to 2016. These surveys were conducted bi-annually by the General Statistics Office of Vietnam (GSO) in collaboration with the World Bank. They provide various information on households and individuals, such as their demographic characteristics, employment status, and health expenditure. Information on the head of household is also provided in this data.
Data on the urbanization of each province are extracted from the Statistical Yearbook of General Statistics Offices of Vietnam. Other data on province characteristics are collected from different sources. The unemployment rate is extracted from the “Report of Labor and Employment” conducted by GSO. Data on government revenue at the provincial level is collected from the Ministry of Finance of Vietnam.
Information about households’ adoption of information communication technology (ICT) is obtained from the “Vietnam ICT Index”, a report on assessing and ranking the readiness level for IT development and application in different provinces in Vietnam gathered by the Ministry of Information and Communications and the Vietnam Informatics Association. The ICT index, which has existed since 2005, demonstrates the readiness of Vietnamese provinces for ICT and has been published annually since 2005. The purpose of the index is to assist local governments in improving ICT access for households and businesses, thereby reducing income inequality in the region.

3.2. Variable Definitions

Our main covariate is urbanization, which is collected at the province level. In this study, we employ a share of the urban population to the total population as the main proxy for urbanization. We also use alternative proxies of urbanization, namely the natural logarithm form of urban population and population density, in our robustness check section.
We consider two different aspects of household health expenditure when investigating the impacts of urbanization, including inpatient and outpatient health expenses (IOHEs), which are computed as a sum of hospitalization costs and outpatient costs; self-treatment expenses (STEs), which consist of household’s expenditure on purchasing medicines without prescriptions and household’s expenditure on purchasing medical appliances and equipment (e.g., blood pressure monitors, phlegm absorbers, clinical thermometers).
In investigating the effects of urbanization on household health expenditure, we control for three main groups of characteristics. The selection of covariates in this study was grounded in both theoretical principles and practical significance, aligning with previous studies (Çetin and Bakırtaş 2019; Zhang et al. 2023). First, we include information on the age, education level, marital status, and male gender of the head of the household. In addition, we gather household data, such as the number of individuals in the household (household size), the proportion of dependents (dependent ratio), the location of residence, the household’s total value of assets, and house ownership. Finally, we control province-level characteristics, including the unemployment rate and local government revenue.
To address the potential endogeneity that might occur due to the omitted variable bias, we use the ICT index. The information on ICT is gathered from each province and reflects their level of preparedness for the ICT environment and advancements between 2012 and 2016. The computation of the ICT index considers various aspects, such as technical infrastructure, human resources, applications, manufacturing and business, organization, and the policy environment. Table 1 and Table 2 present the variable definition and summary statistics, respectively. On average, nearly 29% of the population lives in urban areas.

4. Research Methodology

4.1. Baseline Models: Fixed-Effect Regressions

To investigate the effects of urbanization on health expenditure of households, we present the following econometric model:
Y i p t = α 0 + α 1 U r b p t + α 2 X + µ i + µ t + ɛ i p t
where Y i p t denotes the health expenditure of household i in province p in year t . In this study, we use two measures to proxy for the health expenditure, namely inpatient and outpatient health expenses (IOHEs) and self-treatment expenses (STEs). U r b p t , defined as a share of urban population to the total population in province p in year t , is the main explanatory variable in our model. X denotes a set of control variables. Specifically, we control for: (1) several characteristics of the head of household, including age, squared term of age, gender, education level, and marital status; (2) various characteristics of the household, including household’s total assets, household size, house ownership, the ratio of dependent people in the household, location of residence; (3) province-level characteristics, including the unemployment rate and local government revenue. α 0 , α 1 , and α 2 are unknown parameters. µ i indicates an individual fixed effect, µ t is the provincial time trend, and ɛ i p t is an error term.3

4.2. Two-Stage Least Square Regressions

The abovementioned fixed-effect (FE) regressions might suffer endogeneity issues arising from the omitted variable bias (OVB). Therefore, we employ the two-stage least square regression to address any plausible endogeneity problems. Specifically, we use Internet communication technology (ICT) development at the provincial level as an instrumental variable (IV) for our key explanatory variables. The rationale for utilizing this particular instrument is explained as follows. First, a strong correlation probably exists between ICT deployment and the degree of urbanization in each province. For instance, ICT development enables people to access information more easily and quickly. This can help people make informed decisions about where to live, work, and invest, leading to increased urbanization. In addition, ICT deployment can improve communication between people, businesses, and governments, making it easier to coordinate activities and share resources. This can lead to more efficient and effective urbanization. These justifications are confirmed in our sample as indicated in Appendix A Table A1 when the correlation between ICT development and urbanization is relatively high (approximately 0.59). Second, health expenditure is unlikely to have a direct correlation with the level of ICT adoption. This is confirmed because the correlation between health expenditure and ICT appears relatively low (0.10).
We utilize the two-stage least square framework to estimate the impacts of urbanization on household health expenditure. In the first stage, we extract the exogenous part of urbanization that is not related to the error term by performing a regression of urbanization ( U r b p t ) on ICT ( I C T p t ), other control variables ( X ), individual fixed effect ( η i ), and time trend ( η t ):
U r b p t = δ 0 + δ 1 I C T p t + δ 2 X + η i + η t + u i p t
where I C T p t denotes the ICT in province p in year t . δ 0 , δ 1 , and δ 2 are parameters and u i p t is an error term. The predicted value of urbanization U r b ^ p t obtained from this regression is then employed as the main covariate in the following second stage:
Y i p t = β 0 + β 1 U r b ^ p t + β 2 X + ζ i + ζ t + ϑ i p t
We assume that I C T p t is uncorrelated with the household’s IOHEs and STEs. Now β 1 can be referred to as the causal effect of urbanization on IOHEs and STEs of households. Note that this method is often referred to as a fixed-effect instrumental variable (FEIV) framework.

4.3. Plausibly Exogenous IV

Generally, the instrumental variable method may be used to handle endogenous problems, including missing variables, sample selection, spurious relationships, and measurement error, which contradict the standard linear regression assumption to some extent. According to Conley et al. (2012), the classic IV assumption corresponds to exclusion restriction if the instrumental variable I C T p t can only influence the dependent variable Y i p t via the independent variable U r b p t , which means γ = 0 in the equations below:
U r b p t = δ 0 + δ 1 I C T p t + δ 2 X + η i + η t + u i p t
Y i p t = β 0 + β 1 U r b p t + γ I C T p t + β 2 X + ζ i + ζ t + ϑ i p t
However, when the instrument is plausibly exogenous, γ 0 , suggesting that the instrumental variable I C T p t may be slightly associated with Y i p t . In other words, we allow ICT index to affect IOHEs and STEs directly. If γ is known, consistent estimates of the effect of interest, the urbanization, can be obtained via approaches proposed by Conley et al. (2012). We specifically employ the Union of Confidence Intervals (UCI). This framework postulates that γ Γ where Γ is the bounded support of γ and this support Γ = δ ,   δ for different values of δ . The magnitude of this δ in our case is based on prior information about the reduced form estimates of the household’s health expenditure on ICT Index (Meierrieks and Renner 2023; Guo 2020). We then can consistently estimate β through 2SLS and compute a union of the resulting confidence interval which consists of β for all values γ within the support Γ . Provided that γ Γ , the union will encompass the true parameter value of β .

5. Empirical Findings

This section presents the estimated results for the impacts of urbanization on households’ IOHEs and STEs. To be more specific, we perform a number of exercises as follows. First, we examine the effects of urbanization using the fixed-effect models. Second, to address the endogeneity problem associated with the fixed-effect regressions, we perform the instrumental variable regressions with fixed effects. We then conduct a series of robustness checks to confirm the sensitivity of our main results. Additionally, we relax the condition of IV of exclusion restriction and conduct a test based on Conley et al. (2012). Finally, we provide potential mechanisms.

5.1. Main Results

Table 3 presents estimated results for the FE and FEIV models. A log transformation is performed on all expense variables. Panel A1 in Table 3 implies a statistically insignificant reduction of 11 percentage point IOHEs for every one percent growth in the urban population. Our A2 model employs the instrument in 2SLS to demonstrate that an additional one percent in urban population results in a 36.4 percentage point decrease in IOHEs. Findings from both the FE and FEIV models indicate, in general, a negative nexus exists between the relative urban population and the amount of money households spend on inpatient and outpatient treatment. The endogeneity of the urban population further collaborates with our hypothesis that FE biases the estimates downward, which is supported by the results from our preferred FEIV model.
Panel B in Table 3 displays the findings for self-treatment expenses. According to the FE results, model B1 predicts this spending will rise by approximately 5.8 percentage points for an additional one percent of the urban population. The FEIV results in model B2 demonstrate that STEs rise by about 34.4 percentage points for every extra one percent increase in urbanization. Again, FE biases the estimates of the effects of urbanization.
Furthermore, our first-stage findings in Table 3 show that a 10 percent rise in the ICT Index translates into a 0.21 percentage point increase in the urban population. The finding is statistically significant. The reliability of the instrument has been confirmed by a Kleibergen–Paap rk Wald F statistic being over 10. In general, Table 3 shows that FEIV findings point to lower expenditure on inpatient and outpatient treatment and greater spending on self-treatment expenses as a consequence of the increasing urban population. We also present the full results of FEIV estimates in Appendix A Table A2 and re-estimate these findings with different clusters for the standard errors, summarizing the results in Appendix A Table A3.
We conduct an array of robustness tests on the key findings. First, instead of employing the relative urban population, we use the natural log of urban population and the natural log of population density as the instrumented variables. This is to ensure that the obtained outcomes remain unaffected by the definition of variables, or the functional structure of the model being estimated. The estimated results are presented in Table 4. These results further collaborate with our main findings in Table 3.
We further investigate our main findings by employing the lag of relative urban as an additional IV. Table 5 presents the estimated results. On the whole, our key findings from this exercise are unaltered. Although the estimates of urbanization on IOHEs and STEs under this model are lower (in absolute values) than those under our FEIV, the signs remain unchanged. Specifically, a 1% rise in the relative urban population leads to a 4.4% reduction in IOHEs. Meanwhile, STEs rise by 7.7% when the relative urban population increases by 1%. Our key findings survive this robustness check. Note also that the Kleibergen–Paap rk Wald F statistic illustrates that our IVs are not weak. Furthermore, our models do not suffer an overidentification test as the Hansen J statistics cannot reject the null hypothesis at a 5% level.

5.2. Plausible Exogeneous IV

Although our chosen instrumental variables are evidently linked with the key variables, it is impossible to test the exclusion restriction due to the unobservable nature of the error term. As a result, we follow Conley et al. (2012) and utilize the union of all confidence intervals (UCI) approach to check our key findings when relaxing the exclusion restriction. This approach has been employed in previous studies (see, e.g., Zheng et al. 2023; Clarke and Matta 2018). By permitting the direct effect of instrument variables on the dependent variable to vary within a certain range rather than assuming it to be zero, this approach can help to identify a plausible range of values for the effect of the endogenous variable on the outcome of interest, even in the presence of imperfect instrumental variables.
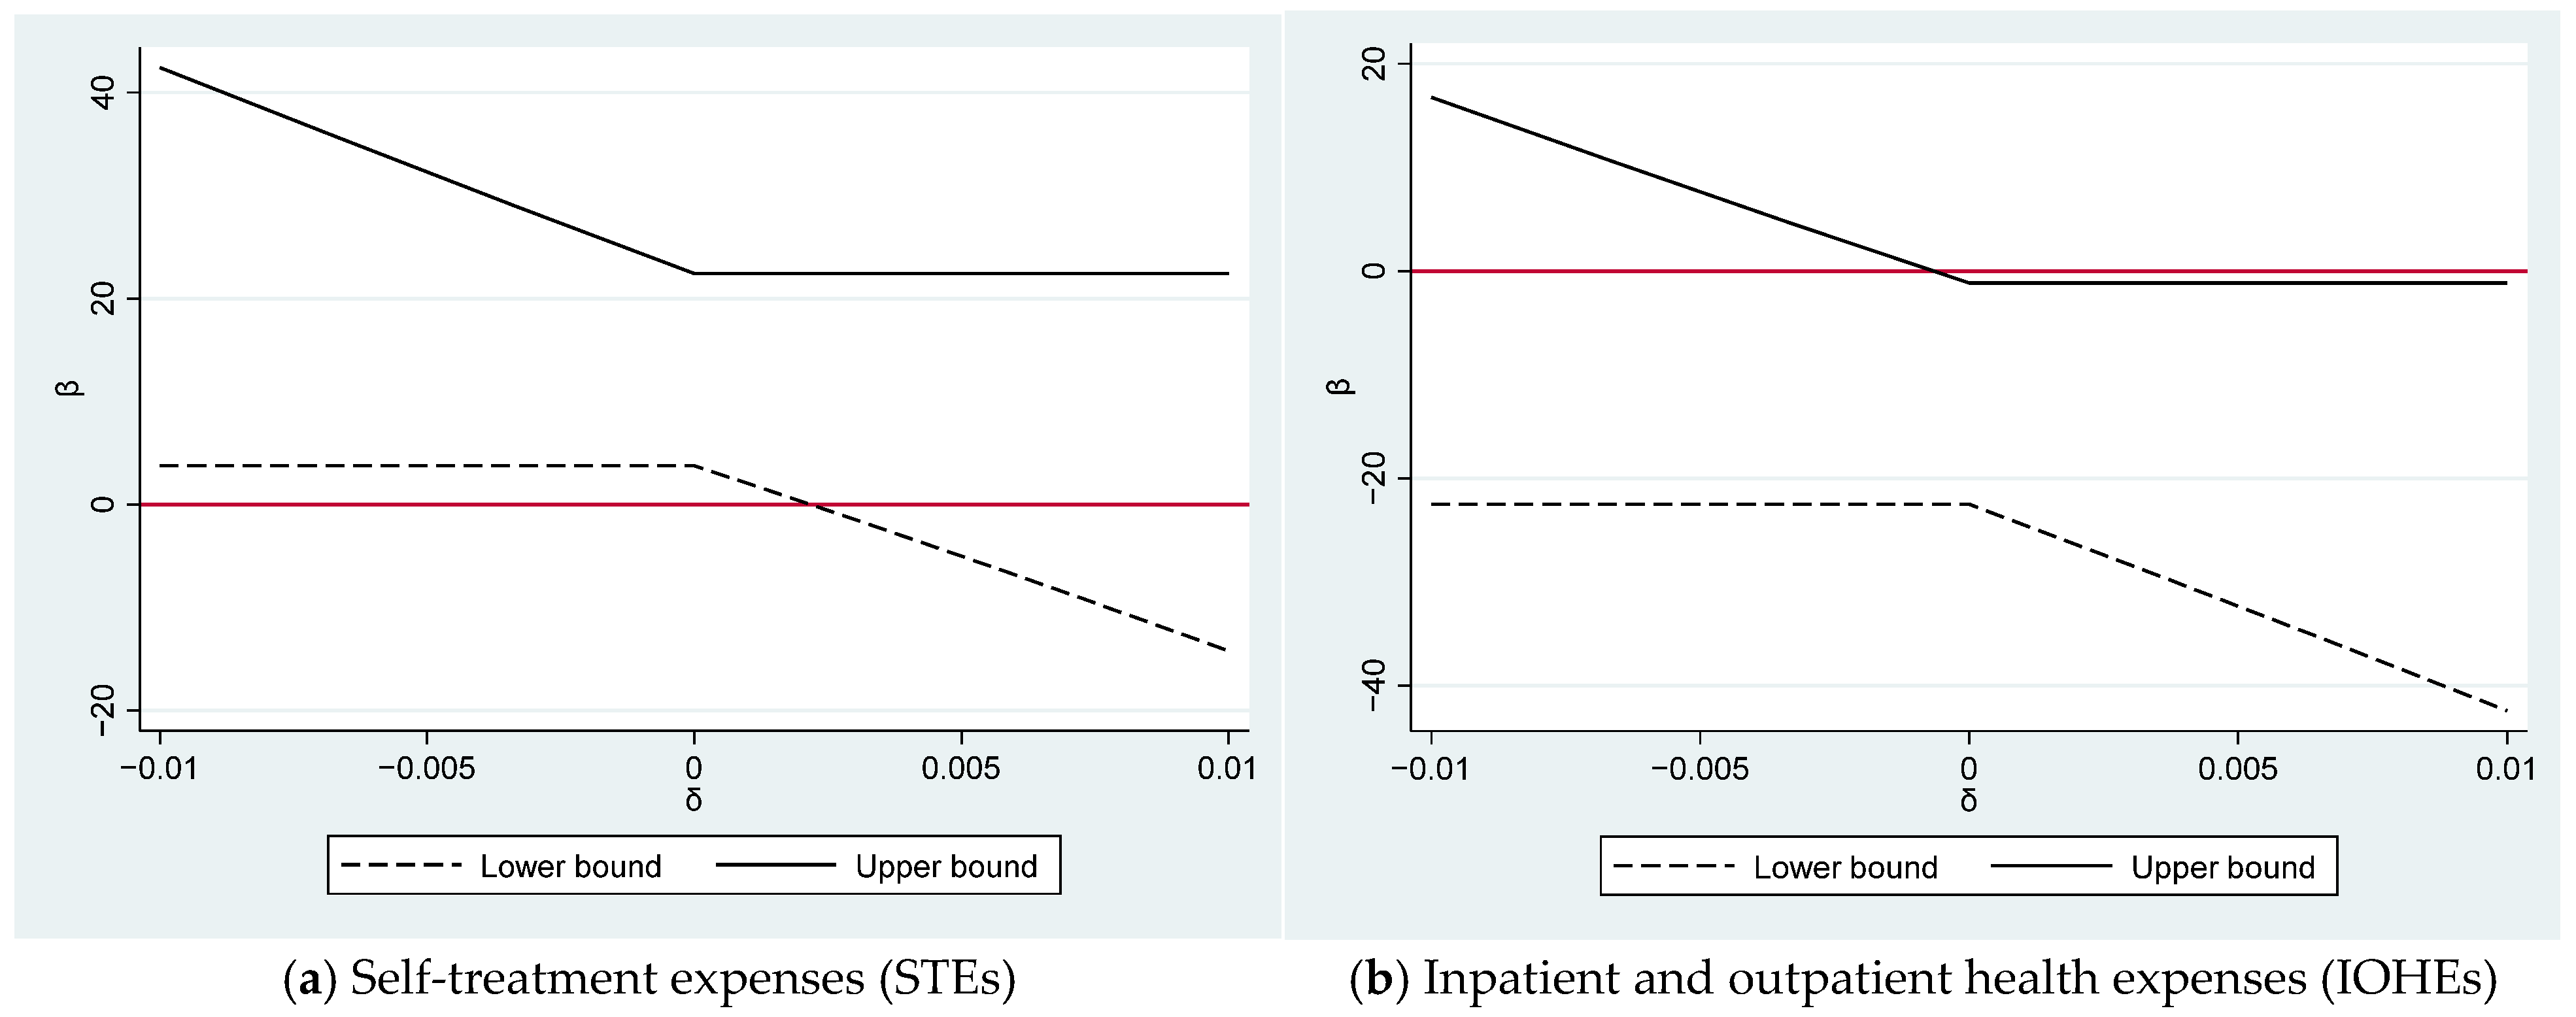
Figure 1 presents the estimated impacts of urbanization on our two main outcomes of interest (IOHEs and STEs) when the instrumental variable—ICT is plausibly exogenous. The dashed and solid lines illustrate the lower and upper bounds of the 95% confidence interval of urbanization, respectively. Overall, our FEIV estimates of the impacts of urbanization on IOHEs and STEs fall within the 95% confidence intervals computed for distinct values of δ . It is worth mentioning that δ here represents the coefficient of ICT after both the endogenous variable (urbanization) and the instrumental variable (ICT) are incorporated in the second-stage regressions. Accordingly, δ demonstrates the direct effect of ICT on IOHEs and STEs through channels other than urbanization.
Figure 1a presents the estimated impacts of urbanization on STEs. When δ is negative, the bounds on the coefficient of urbanization ( β ) are comparatively further from 0 than the FEIV estimate of β, demonstrating that the conventional FEIV estimate underestimates the true impact of urbanization on STEs when a higher ICT index lowers STEs. Furthermore, we find that the 95% confidence interval for β includes 0 only when δ is larger than 0.002. It is worth mentioning that although we do not report the result here, our reduced form estimates of the impact of ICT on STEs is roughly 0.007. Accordingly, our bound of 0.002, which accounts for nearly 30% of the overall direct impact of ICT on STEs, is appropriate. Guo (2020) allows for significantly smaller deviations (25% of reduced-form coefficient) from perfect exogeneity. Thus, our findings still support the presence of a positive and significant impact of urbanization on STEs, even though we allow for a sizable departure from the assumption of perfect exogeneity.
The FEIV estimate of urbanization on IOHEs when the ICT index is plausibly exogenous is shown in Figure 1b. Clearly, the constraints on the estimated value of urbanization are significantly further away from 0 than the FEIV estimate of urbanization when δ is positive. This indicates that the conventional FEIV approach underestimates the negative impact of urbanization on IOHEs when a higher ICT increases IOHEs. Additionally, we still obtain significantly negative impacts of urbanization provided that δ is larger than −0.001. This limit is acceptable as it is equivalent to 14% of the overall direct effect of ICT on IOHEs from the reduced-form estimation (−0.007). In brief, we confirm our main result of a negative and significant impact of urbanization on IOHEs even though we allow for a reasonable distortion from the perfect exogeneity.
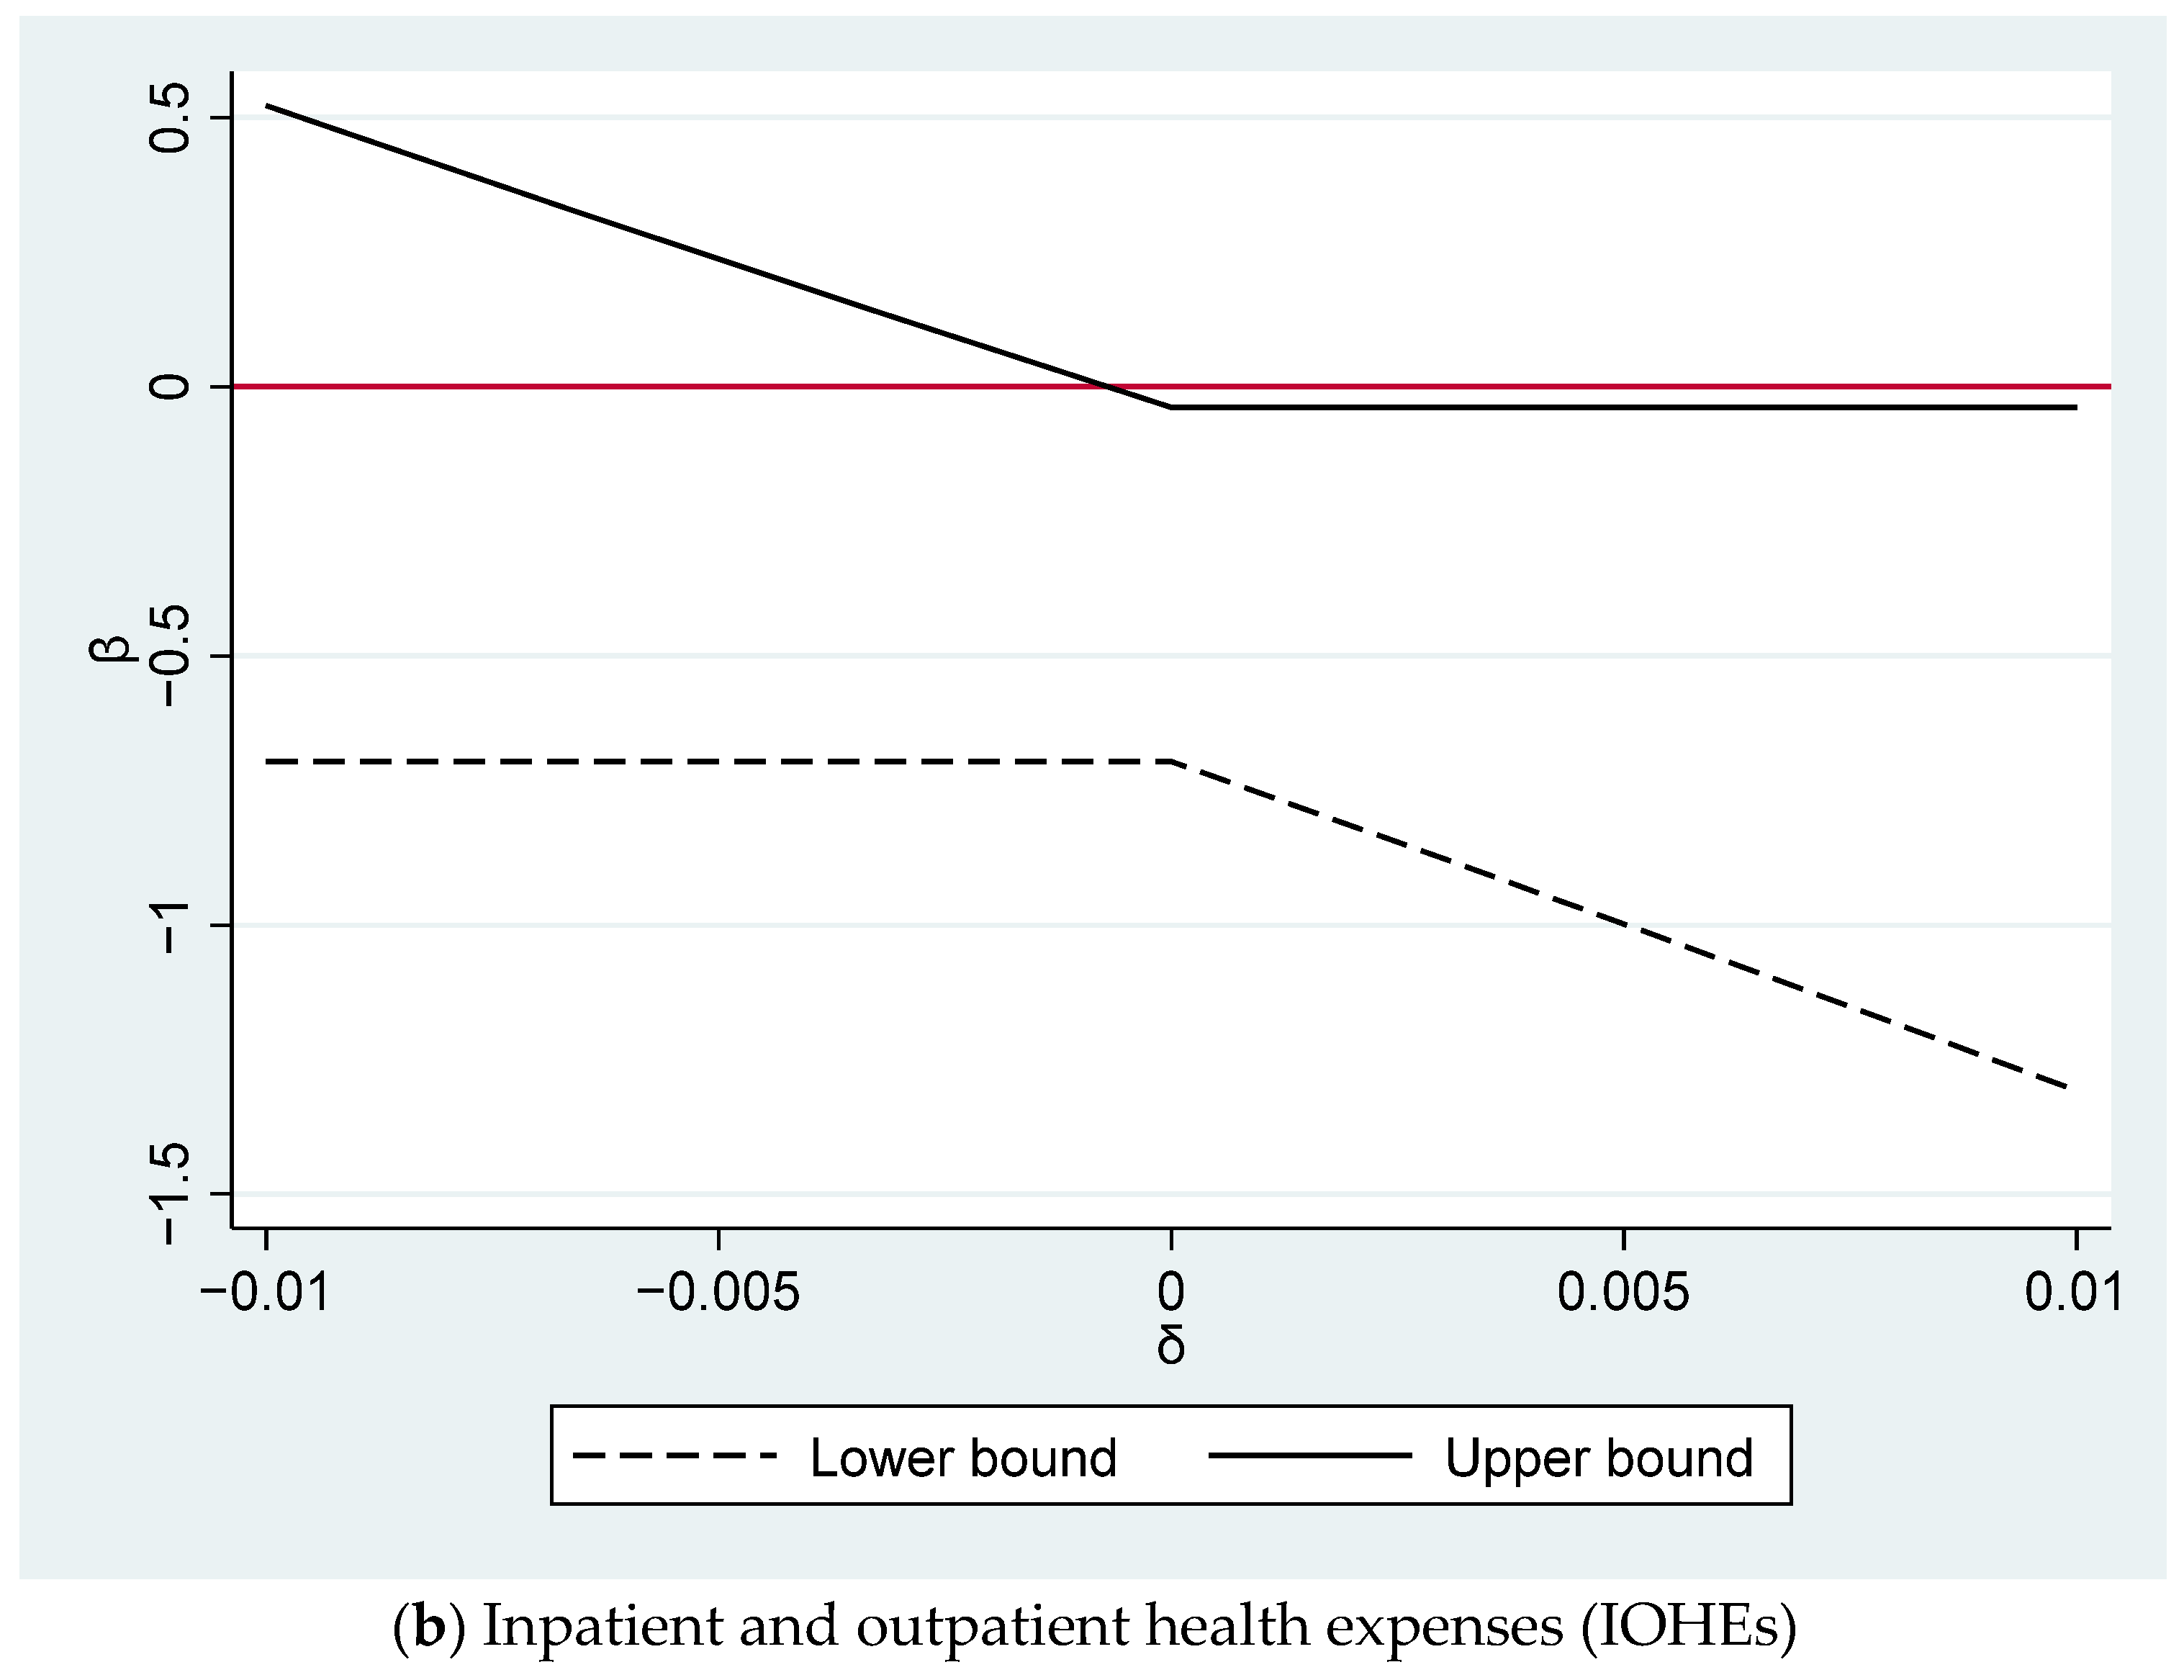
Similar results are obtained when we employ different proxies for urbanization. The results are presented in Figure A1 and Figure A2 of Appendix B. Furthermore, we provide the additional robustness test using the local-to-zero methods of Conley et al. (2012). Overall, our key results are unaltered (see Table A4 of Appendix B).

5.3. Mechanisms

The key results indicate that urbanization lowers household spending on inpatient and outpatient treatment but raises expenditures on self-treatment. Thus, these findings suggest the plausibility of urbanization affecting health expenditure through two different pathways.
First, evidence suggests that urbanization leads to an expansion of health insurance. Results based on health insurance spending are shown in Table 6 model A1. The findings imply that an additional one percent of urbanization increases 118 percentage points in the amount of money households spend on insurance. The second is the household’s total income. The results in Table 6 model A2 indicate that an extra percent of the urban population improves household earnings in the last 12 months by VND 9443 thousand (approximately USD 400).
Our main findings shed light on the impacts of urbanization on two aspects of health expenditure. It may seem surprising that urbanization leads to a decrease in hospitalization and outpatient health expenses. An increase in health insurance coverage partially explains this unexpected result. Expanding health insurance coverage can help defray the costs of hospitalization and outpatient care, thereby reducing the financial burden on households.5 Previous literature also demonstrates that participation in health insurance programs correlates with a decrease in both inpatient and outpatient healthcare expenditures across diverse demographic groups, with a particularly notable impact evident among individuals of lower socioeconomic status in Vietnam (Thanh et al. 2019; Jowett et al. 2004). Furthermore, as household incomes rise, there is a growing concern regarding the quality of medical care, prompting a preference for better healthcare services. As a result, households frequently experience increased health-related expenses (Dang 2018).

6. Conclusions and Policy Recommendations

The study investigates the relationship between urbanization and household health expenditure using a unique household-level dataset from Vietnam between 2012 and 2016. The study demonstrates that urbanization has a statistically significant influence on healthcare expenses, causing a decrease in inpatient and outpatient costs but an increase in self-treatment expenses. The results are robust across various sensitivity analyses. We also propose two different paths to explain these results. The presence of health insurance attenuates the effect of urbanization on hospitalization and outpatient costs, whereas the impact of urbanization on self-treatment expenses is strengthened in the presence of household income.
The findings of this research have potential policy implications. First, it is imperative to note that urbanization has been correlated with a decrease in hospitalization and outpatient expenses. Therefore, policymakers must prioritize the provision of accessible and cost-effective healthcare services. The study also revealed that the presence of health insurance mitigates the impact of urbanization on inpatient and outpatient healthcare expenses. Consequently, the government must encourage households to obtain health insurance. Third, policymakers can promote the regularity of health check-ups among households as a preventive measure against the development of chronic diseases, thus, potentially reducing hospitalization and outpatient expenses. Finally, in order to guarantee equitable access to healthcare services regardless of income, policymakers must tackle the issue of income inequality.
This study is not without limitations. Given that health expenditure data are solely accessible at the household level, the study is unable to discern the impact of urbanization on individual health behaviors. Further research can conduct surveys and research at the individual level, thus, providing a more comprehensive insight into the linkage between urbanization and health expenditure.

Author Contributions

Conceptualization, H.T.N.-P. and H.L.; methodology, H.T.N.-P. and H.L.; software, H.T.N.-P. and H.L.; formal analysis, H.T.N.-P. and H.L.; writing—original draft, H.T.N.-P. and H.L.; writing—review & editing, H.T.N.-P. and H.L.; funding acquisition, H.T.N.-P. All authors have read and agreed to the published version of the manuscript.

Funding

We acknowledge the financial support that we received from Japan Society for the Promotion of Science (JSPS) Grant-in-Aid for Research Activity Start-up (Grant No.23K18795).

Institutional Review Board Statement

Not applicable.

Informed Consent Statement

Not applicable.

Data Availability Statement

The authors do not have permission to share the data.

Acknowledgments

We would like to thank the participants at the Vietnam Economist Annual Meeting 2023 (VEAM 2023), the 14th Biennial Conference of Asian Consumer and Family Economics Association (ACFEA) and Kansai Labor Workshop for their comments, as well as anonymous reviewers for their feedback on the early version of this manuscript.

Conflicts of Interest

The authors declare no conflict of interest.

Appendix A. Supporting Results

Table A1. Correlation matrix.
In/Outpatient Health ExpensesSelf-Treatment ExpensesRelative Urban PopulationICTIndex
In/outpatient health expenses1
Self-treatment expenses0.19181
Relative urban population0.04180.10121
ICTIndex0.09390.14510.58631
Observations16,78616,78616,78616,786
Source: Authors’ own calculations.
Table A2. Full results of FEIV estimate in Table 3.
In/Outpatient
Health Expenses
Self-Treatment Expenses
Relative urban population−0.364 **0.344 **
(0.180)(0.154)
Head of household’s age0.0170.020
(0.022)(0.018)
Age squared−0.000−0.000
(0.000)(0.000)
Head of household’s gender−0.182−0.131
(0.146)(0.134)
Head of household’s level of education0.053−0.002
(0.044)(0.037)
Head of household’s marital status0.379 ***0.281 **
(0.139)(0.135)
Location of residence−1.4603.016 ***
(1.056)(0.888)
Household size0.090 ***0.115 ***
(0.028)(0.022)
Dependency ratio−0.2660.150
(0.196)(0.173)
Home ownership0.052−0.209
(0.153)(0.131)
Log of total asset value0.106 ***0.104 ***
(0.035)(0.030)
Provincial unemployment rate0.0040.035 **
(0.020)(0.017)
Log of province’s revenue0.309 ***−0.067
(0.107)(0.088)
Observations16,78616,786
R-squared−0.043−0.024
Number of households65826582
Notes: Robust standard errors in parentheses. *** p < 0.01, ** p < 0.05, * p < 0.1. Source: Authors’ own calculations.
Table A3. Additional specifications.
In/Outpatient Health ExpensesSelf-Treatment Expenses
Panel A: Standard errors are clustered at household level
Relative urban population−0.364 **0.344 **
(0.179)(0.157)
Number of observations16,78616,786
R-squared−0.043−0.024
Number of households65826582
Under. Id.72.94872.948
Weak id.71.34971.349
Panel B: Standard errors are clustered at commune level
Relative urban population−0.364 **0.344 **
(0.169)(0.165)
Number of observations16,78616,786
R-squared−0.043−0.024
Number of households65826582
Under. Id.16.03716.037
Weak id.30.46830.468
Panel C: Standard errors are clustered at district level
Relative urban population−0.364 *0.344 *
(0.169)(0.165)
Number of observations16,78616,786
R-squared−0.043−0.024
Number of households65826582
Under. Id.27.32127.321
Weak id.26.61126.611
Notes: Robust standard errors in parentheses. *** p < 0.01, ** p < 0.05, * p < 0.1. Under. Id. refers to Kleibergen–Paap rk LM statistic. Weak id. refers to Kleibergen–Paap rk Wald F statistic. Source: Authors’ own calculations.

Appendix B. Additional Results for Conley’s Methods
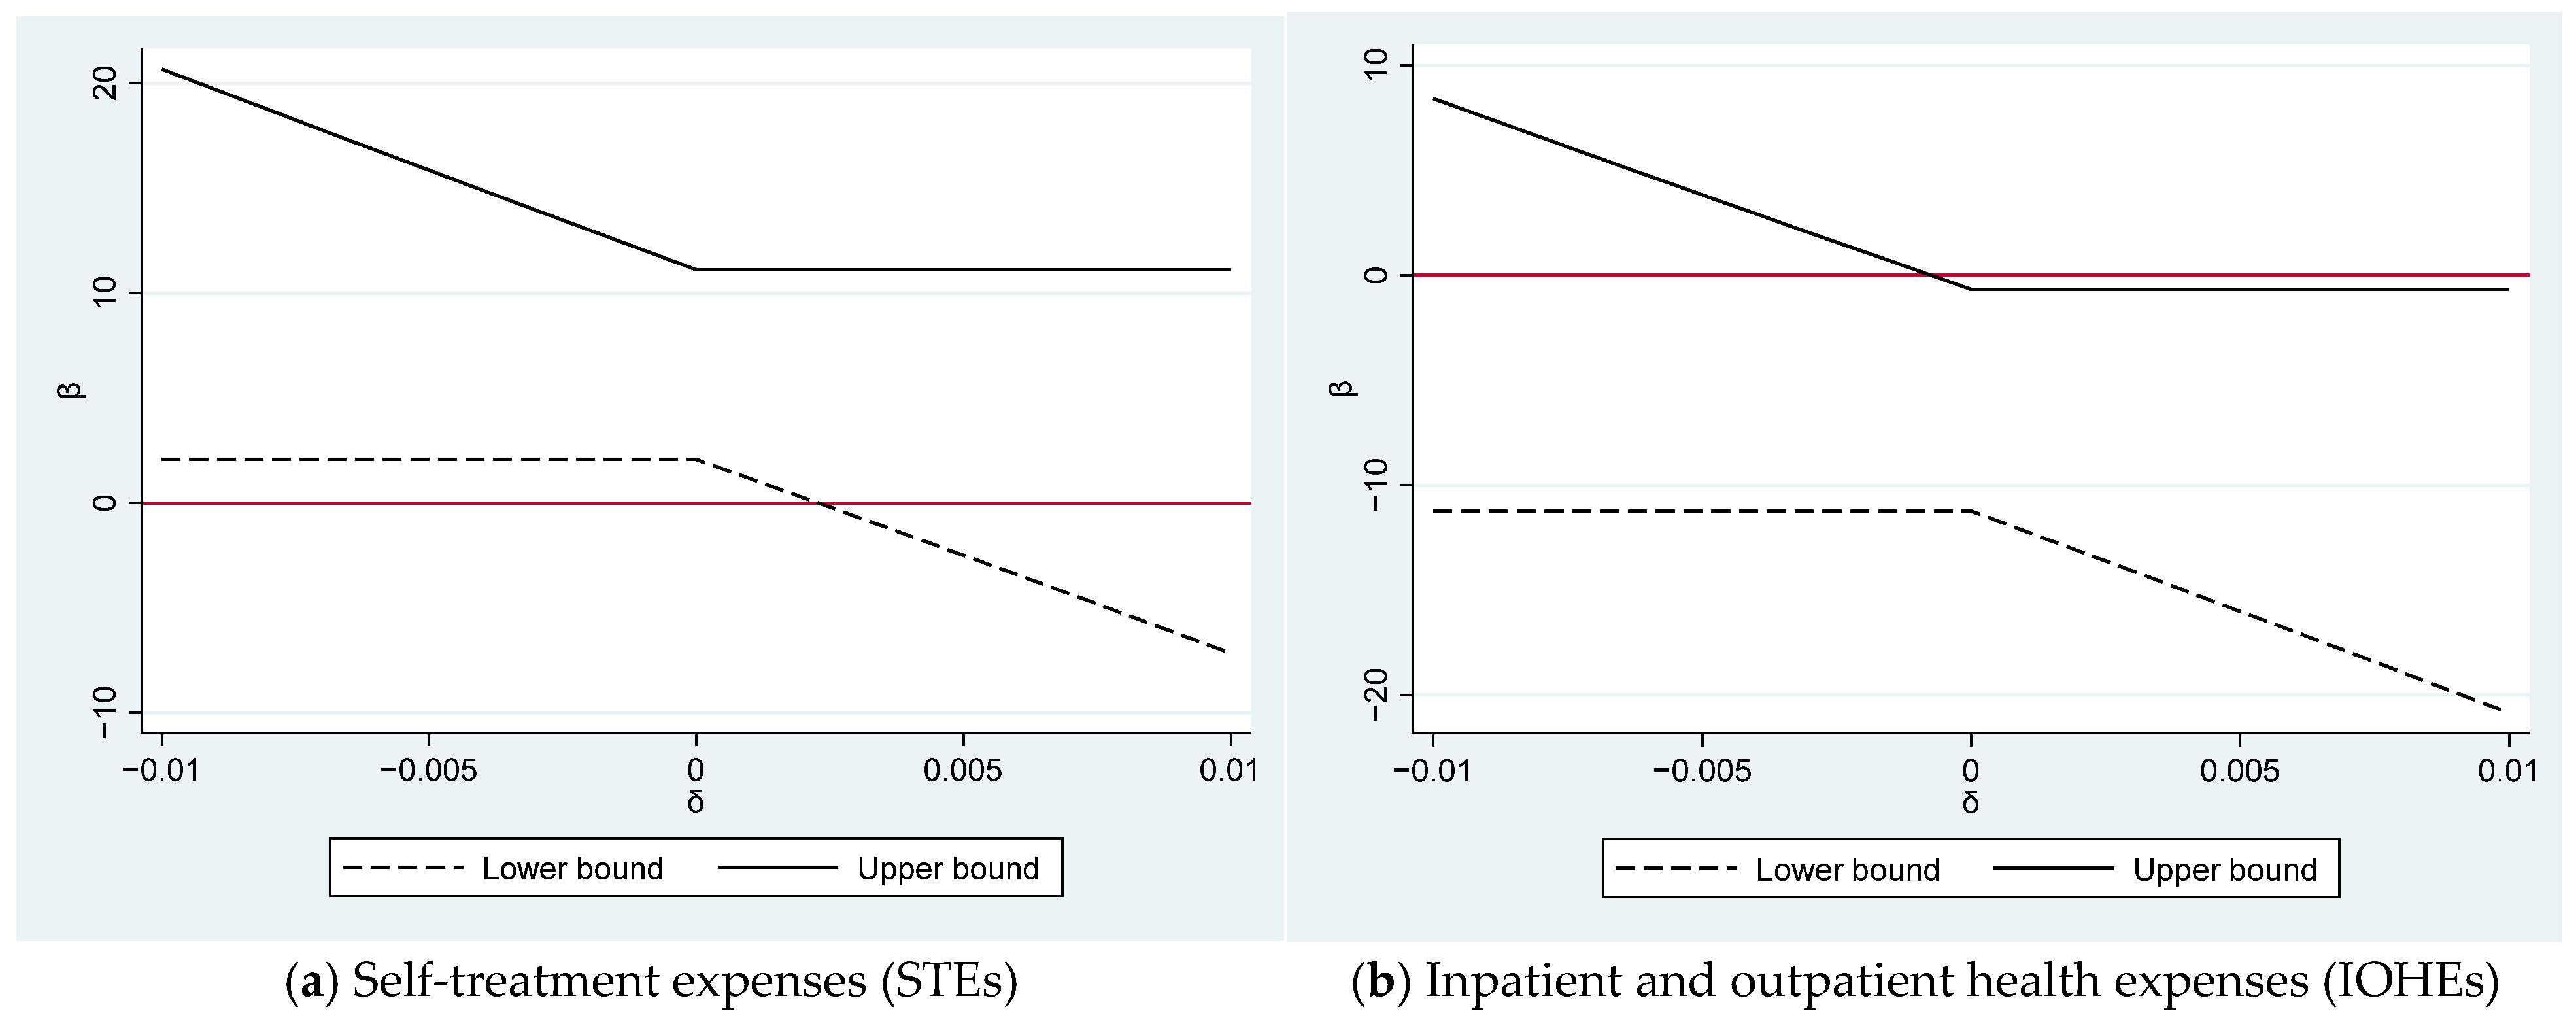
Figure A1. Plausible exogeneity for our IV–ICT: The 95% confidence intervals using Conley’s UCI approach for the impacts of urbanization on inpatient and outpatient health expenses (IOHEs) and self-treatment expenses (STEs) (log of urban population).
Economies 12 00153 g0a1
Figure A2. Plausible exogeneity for our IV–ICT: The 95% confidence intervals using Conley’s UCI approach for the impacts of urbanization on inpatient and outpatient health expenses (IOHEs) and self-treatment expenses (STEs) (log of population density).
Economies 12 00153 g0a2
Table A4. Conley’s LTZ method estimation for instrumental variable.
VariablesIOHEsSTEs
CoefRo_std95% CICoefRo_std95% CI
Panel A. Effect of relative urban population on IOHEs and STEs
Relative urban population −0.368 **0.177[−0.715; −0.020]0.408 ***0.156[0.101; 0.714]
Control variablesYes Yes
P r o v i n c e × Y e a r Yes Yes
Observations16,786 16,786
Panel B. Effect of log of urban population on IOHEs and STEs
Log of urban population −5.951 **2.848[−11.533; −0.369]6.598 ***2.484[1.730; 11.466]
Control variablesYes Yes
P r o v i n c e × Y e a r Yes Yes
Observations16,786 16,786
Panel C. Effect of log of population density on IOHEs and STEs
Log of population density−11.822 **5.747[−23.085; −0.559]13.108 **5.094[3.124; 23.091]
Control variablesYes Yes
P r o v i n c e × Y e a r Yes Yes
Observations16,786 16,786
Notes: Coef = Coefficient, Ro_std = Robust standard errors, CI = Confidence interval. Control variables include age, education level, marital status, gender of the head of the household, household size, dependent ratio, location of residence, household’s total assets, house ownership, unemployment rate, local government’s revenue. *** p < 0.01, ** p < 0.05, * p < 0.1. Source: Authors’ own calculations.

Notes

1
It is worth mentioning that urbanization significantly impacts the socioeconomic dynamics of households. The process of urbanization offers numerous advantages, including improved infrastructure, expanded employment prospects, broader markets, and enhanced allocation of resources (Obi-Ani and Isiani 2020). Nonetheless, urbanization can heighten income inequality, widening the gap between affluent and impoverished households (Chen et al. 2016).
2
The in situ urbanization policy is often referred to as the process of converting villages into urban neighborhoods, which is closely connected to the commonly used term “reclassification”. This involves changing the nature of settlements from rural to urban areas.
3
It is worth noting that we perform the Hausman specification test as a means to compare the fixed-effect regression with the random-effect counterpart. The associated chi-square statistics are equal to 78.66 and 129.48 for IOHEs and STEs, respectively. Accordingly, the null hypothesis is rejected at the 1% significance level for both IOHEs and STEs. This result demonstrates that when assessing the influences of urbanization on health expenditure, the fixed-effect regression emerges as the most suitable empirical methodology.
4
The xttest3 command in Stata is utilized for assessing heteroskedasticity, and the results reveal the presence of heteroskedasticity within our sample.
5
The expansion in health insurance coverage is in line with the efforts of the Vietnamese government to expand health insurance coverage across the whole country, primarily through the national health insurance program.

References

  1. Al-Hanawi, Mohammed Khaled, Martin Limbikani Mwale, and Tony Mwenda Kamninga. 2020. The effects of health insurance on health-seeking behaviour: Evidence from the kingdom of Saudi Arabia. Risk Management and Healthcare Policy 13: 595–607. [Google Scholar] [CrossRef] [PubMed]
  2. Anderson, Michael, Carlos Dobkin, and Tal Gross. 2012. The effect of health insurance coverage on the use of medical services. American Economic Journal: Economic Policy 4: 1–27. [Google Scholar] [CrossRef]
  3. Attard, S. M., A. H. Herring, E. J. Mayer-Davis, B. M. Popkin, James Benjamin Meigs, and P. Gordon-Larsen. 2012. Multilevel examination of diabetes in modernising China: What elements of urbanisation are most associated with diabetes? Diabetologia 55: 3182–92. [Google Scholar] [CrossRef] [PubMed]
  4. Chen, Guo, Amy K. Glasmeier, Min Zhang, and Yang Shao. 2016. Urbanization and income inequality in post-reform China: A causal analysis based on time series data. PLoS ONE 11: e0158826. [Google Scholar] [CrossRef] [PubMed]
  5. Clarke, Damian, and Benjamín Matta. 2018. Practical considerations for questionable IVs. The Stata Journal 18: 663–91. [Google Scholar] [CrossRef]
  6. Conley, Timothy G., Christian B. Hansen, and Peter E. Rossi. 2012. Plausibly exogenous. Review of Economics and Statistics 94: 260–72. [Google Scholar] [CrossRef]
  7. Çetin, Mümin Atalay, and İbrahim Bakırtaş. 2019. Does urbanization induce the health expenditures? A dynamic macro-panel analysis for developing countries. Dumlupınar Üniversitesi Sosyal Bilimler Dergisi 61: 208–22. Available online: https://dergipark.org.tr/en/download/article-file/762975 (accessed on 2 April 2024).
  8. Danaei, Goodarz, Gitanjali M. Singh, Christopher J. Paciorek, John K. Lin, Melanie J. Cowan, Mariel M. Finucane, Farshad Farzadfar, Gretchen A. Stevens, Leanne M. Riley, Yuan Lu, and et al. 2013. The global cardiovascular risk transition: Associations of four metabolic risk factors with national income, urbanization, and Western diet in 1980 and 2008. Circulation 127: 1493–502. [Google Scholar] [CrossRef] [PubMed]
  9. Dang, Thang. 2018. Do the more educated utilize more health care services? Evidence from Vietnam using a regression discontinuity design. International Journal of Health Economics and Management 18: 277–99. [Google Scholar] [CrossRef]
  10. Duc Thanh, Nguyen, Bui Thi My Anh, Phung Thanh Hung, Pham Quynh Anh, and Chu Huyen Xiem. 2021. Impact of public health insurance on out-of-pocket health expenditures of the near-poor in Vietnam. Health Services Insights 14: 11786329211017411. [Google Scholar] [CrossRef]
  11. Dye, Christopher. 2008. Health and urban living. Science 319: 766–69. [Google Scholar] [CrossRef] [PubMed]
  12. Ettner, Susan L. 1996. New evidence on the relationship between income and health. Journal of Health Economics 15: 67–85. [Google Scholar] [CrossRef] [PubMed]
  13. Frijters, Paul, John P. Haisken-DeNew, and Michael A. Shields. 2005. The causal effect of income on health: Evidence from German reunification. Journal of Health Economics 24: 997–1017. [Google Scholar] [CrossRef] [PubMed]
  14. Fu, Qiang, and Kenneth C. Land. 2017. Does urbanisation matter? A temporal analysis of the socio-demographic gradient in the rising adulthood overweight epidemic in China, 1989–2009. Population, Space and Place 23: e1970. [Google Scholar] [CrossRef]
  15. Gollin, Douglas, Remi Jedwab, and Dietrich Vollrath. 2016. Urbanization with and without industrialization. Journal of Economic Growth 21: 35–70. [Google Scholar] [CrossRef]
  16. Gong, Peng, Song Liang, Elizabeth J. Carlton, Qingwu Jiang, Jianyong Wu, Lei Wang, and Justin V. Remais. 2012. Urbanisation and health in China. The Lancet 379: 843–52. [Google Scholar] [CrossRef] [PubMed]
  17. Guo, Shiqi. 2020. The legacy effect of unexploded bombs on educational attainment in Laos. Journal of Development Economics 147: 102527. [Google Scholar] [CrossRef]
  18. Harmon, Colm, and Brian Nolan. 2001. Health insurance and health services utilization in Ireland. Health Economics 10: 135–45. [Google Scholar] [CrossRef]
  19. Ifeagwu, Susan C., Justin C. Yang, Rosalind Parkes-Ratanshi, and Carol Brayne. 2021. Health financing for universal health coverage in Sub-Saharan Africa: A systematic review. Global Health Research and Policy 6: 8. [Google Scholar] [CrossRef]
  20. Jowett, Matthew, Anil Deolalikar, and Peter Martinsson. 2004. Health insurance and treatment seeking behaviour: Evidence from a low-income country. Health Economics 13: 845–57. [Google Scholar] [CrossRef]
  21. Levine, David, Rachel Polimeni, and Ian Ramage. 2016. Insuring health or insuring wealth? An experimental evaluation of health insurance in rural Cambodia. Journal of Development Economics 119: 1–15. [Google Scholar] [CrossRef]
  22. Li, Xinhu, Cuiping Wang, Guoqin Zhang, Lishan Xiao, and Jane Dixon. 2012. Urbanisation and human health in China: Spatial features and a systemic perspective. Environmental Science and Pollution Research 19: 1375–84. [Google Scholar] [CrossRef] [PubMed]
  23. Lim, Ming Yao, Hanin Farhana Kamaruzaman, Olivia Wu, and Claudia Geue. 2023. Health financing challenges in Southeast Asian countries for universal health coverage: A systematic review. Archives of Public Health 81: 148. [Google Scholar] [CrossRef]
  24. Marmot, Michael. 2002. The influence of income on health: Views of an epidemiologist. Health Affairs 21: 31–46. [Google Scholar] [CrossRef] [PubMed]
  25. Meierrieks, Daniel, and Laura Renner. 2023. Islamist terrorism and the status of women. European Journal of Political Economy 78: 102364. [Google Scholar] [CrossRef]
  26. Miao, Jia, and Xiaogang Wu. 2016. Urbanization, socioeconomic status and health disparity in China. Health & Place 42: 87–95. [Google Scholar]
  27. Nguyen-Phung, Hang Thu, and Hai Le. 2024. Energy Poverty and Health Expenditure: Empirical Evidence from Vietnam. Social Sciences 13: 253. [Google Scholar] [CrossRef]
  28. Obi-Ani, Ngozika Anthonia, and Mathias Chukwudi Isiani. 2020. Urbanization in Nigeria: The onitsha experience. Cities 104: 102744. [Google Scholar] [CrossRef]
  29. Raza, Wameq A., Ellen Van de Poel, Arjun Bedi, and Frans Rutten. 2016. Impact of community-based health insurance on access and financial protection: Evidence from three randomized control trials in rural India. Health Economics 25: 675–87. [Google Scholar] [CrossRef]
  30. Shao, Qi, Ran Tao, and Magda Mihaela Luca. 2022. The effect of urbanization on health care expenditure: Evidence from China. Frontiers in Public Health 10: 207. [Google Scholar] [CrossRef]
  31. Shen, Yu, and Wenkai Sun. 2023. From Villages to Urban Neighborhoods: Urbanization and Health. China & World Economy 31: 37–158. [Google Scholar]
  32. Sparrow, Robert, Asep Suryahadi, and Wenefrida Widyanti. 2013. Social health insurance for the poor: Targeting and impact of Indonesia’s Askeskin programme. Social Science & Medicine 96: 264–71. [Google Scholar]
  33. Thanh, Nguyen Duc, Bui Thi My Anh, Chu Huyen Xiem, and Hoang Van Minh. 2019. Out-of-pocket health expenditures among insured and uninsured patients in Vietnam. Asia Pacific Journal of Public Health 31: 210–18. [Google Scholar] [CrossRef] [PubMed]
  34. Thornton, James A., and Jennifer L. Rice. 2008. Determinants of healthcare spending: A state level analysis. Applied Economics 40: 2873–89. [Google Scholar] [CrossRef]
  35. Van de Poel, Ellen, Owen O’Donnell, and Eddy Van Doorslaer. 2012. Is there a health penalty of China’s rapid urbanization? Health Economics 21: 367–85. [Google Scholar] [CrossRef] [PubMed]
  36. Wagstaff, Adam, and Magnus Lindelow. 2008. Can insurance increase financial risk?: The curious case of health insurance in China. Journal of Health Economics 27: 990–1005. [Google Scholar] [CrossRef]
  37. Wang, Jiankang, and Zetao Xu. 2023. Analysis of the effect of heterogeneous human capital on new urbanization in China. Economic Research-Ekonomska Istraživanja 36: 2180649. [Google Scholar] [CrossRef]
  38. Wang, Zijun. 2009. The determinants of health expenditures: Evidence from US state-level data. Applied Economics 41: 429–35. [Google Scholar] [CrossRef]
  39. Waters, Hugh R., Gerard F. Anderson, and Jim Mays. 2004. Measuring financial protection in health in the United States. Health Policy 69: 339–49. [Google Scholar] [CrossRef]
  40. Yang, Gonghuan, Yu Wang, Yixin Zeng, George F. Gao, Xiaofeng Liang, Maigeng Zhou, Xia Wan, Shicheng Yu, Yuhong Jiang, Mohsen Naghavi, and et al. 2013. Rapid health transition in China, 1990–2010: Findings from the Global Burden of Disease Study 2010. The Lancet 381: 1987–2015. [Google Scholar] [CrossRef]
  41. Zhang, Zhenhua, Mingcheng Zhao, Yunpeng Zhang, and Yanchao Feng. 2023. How does urbanization affect public health? New evidence from 175 countries worldwide. Frontiers in Public Health 10: 1096964. [Google Scholar] [CrossRef] [PubMed]
  42. Zheng, Wei, and Patrick Paul Walsh. 2019. Economic growth, urbanization and energy consumption—A provincial level analysis of China. Energy Economics 80: 153–62. [Google Scholar] [CrossRef]
  43. Zheng, Xiaoting, Anqi Wu, and Xuejing Wei. 2023. The social support returns to college education in China: Evidence from online medical crowdfunding. China Economic Review 79: 101978. [Google Scholar] [CrossRef]
  44. Zhu, Enyan, Qiuyu Qi, Lisu Chen, and Xianhua Wu. 2022. The spatial-temporal patterns and multiple driving mechanisms of carbon emissions in the process of urbanization: A case study in Zhejiang, China. Journal of Cleaner Production 358: 131954. [Google Scholar] [CrossRef]
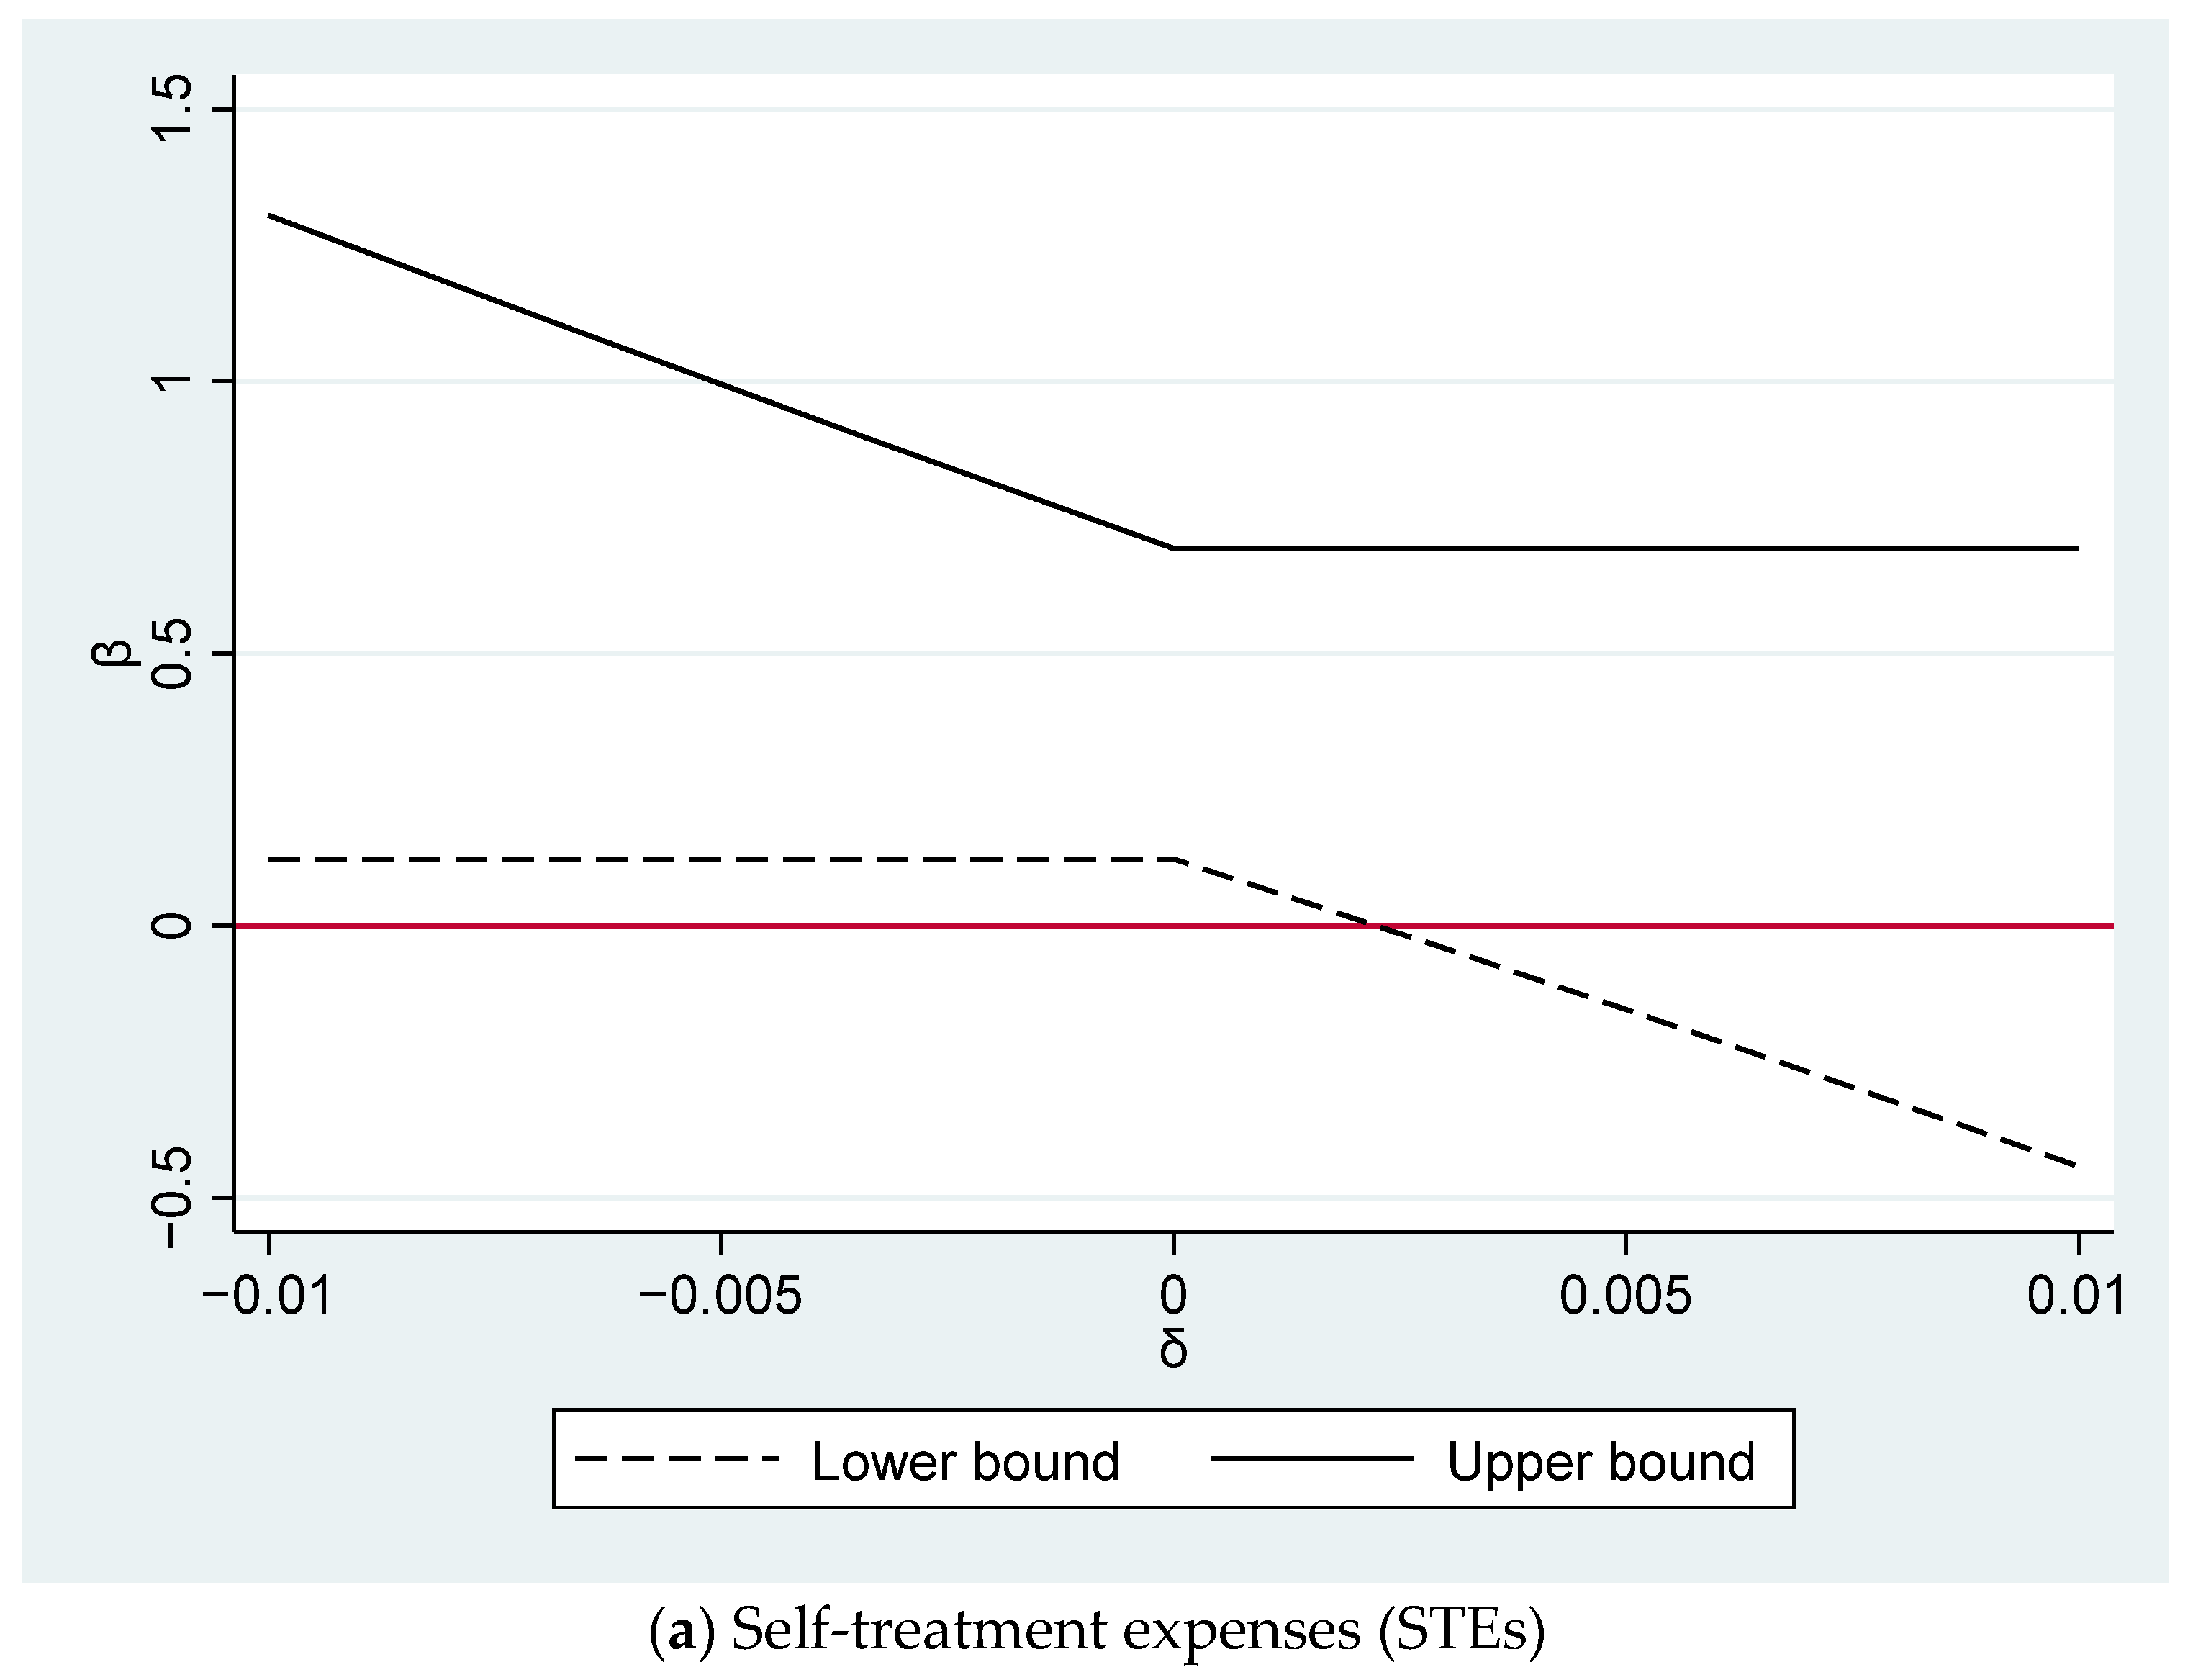
Figure 1. Plausible exogeneity for our IV–ICT: The 95% confidence intervals using Conley’s UCI approach for the impacts of urbanization on inpatient and outpatient health expenses (IOHEs) and self-treatment expenses (STEs).
Economies 12 00153 g001aEconomies 12 00153 g001b
Table 1. Variable definitions.
VariablesTypeDescriptionSource
Inpatient and outpatient health expensesContinuous Natural log of a sum of hospitalization and outpatient costsVHLSS
Self-treatment expenses Continuous Natural log of a sum of household’s expenditure on medicines without prescription and household’s expenditure on medical facilitiesVHLSS
UrbanizationContinuousAverage urban population by provinceStatistical Yearbook of General Statistics Offices of Vietnam
Relative urban intensityContinuous Urban population divided by total population for each provinceStatistical Yearbook of General Statistics Offices of Vietnam
Age of the household headContinuousAge of the household head VHLSS
Marital statusCategoricalMarital status of the household headVHLSS
Level of educationCategorical Level of education of the household head VHLSS
Male DummyGender of the household headVHLSS
Rural Dummy Location of residence: whether rural or urban VHLSS
Household size Continuous Household size VHLSS
Dependent ratioContinuous Ratio of dependent people (less than 6 years old and greater than 60 years old) VHLSS
Total value of household assets Continuous Total value of assets in the household VHLSS
Home ownership Categorical Household owns house or notVHLSS
Government revenueContinuousGovernment revenue at provincial level Ministry of Finance
Unemployment ratesContinuous Unemployment rate at provincial level Statistical Yearbook of General Statistics Offices of Vietnam
Expenditure on insurance Continuous Natural log of household’s expenditure on health insurance VHLSS
Household’s total incomeContinuousHousehold’s income in the last 12 months (thousand VND)VHLSS
Notes: VHLSSs stand for Vietnam Household Living Standards Surveys.
Table 2. Descriptive statistics.
VariablesNMeanSDMinMax
Log of in/outpatient health expenses16,7866.7812.350013.12
Log of self-treatment expenses16,7865.6762.097017.03
Relative urban population16,78629.2118.709.71887.28
ICT Index16,78644.9912.199.13094.07
Head of household’s age16,78651.3313.9713105
Head of household’s age squared16,7862830154716911,025
Head of household’s male16,7860.7520.43201
Head of household’s level of education16,7861.5331.19204
Head of household’s marital status16,7860.8030.39701
Household size16,7863.8331.570113
Dependent ratio16,7860.2390.21701
House ownership16,7860.9640.18501
Location of residence16,7860.7090.45401
Log of total asset value16,7869.9221.3053.40114.85
Log of province’s revenue16,78615.601.49711.4719.75
Provincial unemployment rate16,7862.2163.310019
Notes: SD: standard deviation, N: number of observations. Source: Authors’ own calculations.
Table 3. Effects of urbanization on household’s health expenditure.
FEFEIV
Panel A: Inpatient and outpatient health expenses (IOHEs)(A1)(A2)
Relative urban population−0.011−0.364 **
(0.015)(0.180)
Number of observations16,78616,786
R-squared0.008−0.043
Number of households65826582
Kleibergen–Paap rk LM statistic (Underidentification test) 80.2
Kleibergen–Paap rk Wald F statistic (Weak identification test) 78.565
First-stage results
ICT Index 0.021 ***
(0.002)
Panel B: Self-treatment expenses (STEs)(B1)(B2)
Relative urban population0.058 ***0.344 **
(0.013)(0.154)
Number of observations16,78616,786
R-squared0.025−0.024
Number of households65826582
Kleibergen–Paap rk LM statistic (Underidentification test) 80.2
Kleibergen–Paap rk Wald F statistic (Weak identification test) 78.565
First-stage results
ICT Index 0.021 ***
(0.002)
Notes: Robust standard errors in parentheses. *** p < 0.01, ** p < 0.05, * p < 0.1.4 Source: Authors’ own calculations.
Table 4. Robustness checks: Different proxies for urbanization.
In/Outpatient Health ExpensesSelf-Treatment ExpensesIn/Outpatient Health ExpensesSelf-Treatment Expenses
Log of urban population −5.549 **5.240 **
(2.712)(2.321)
Log of population density −11.160 **10.539 **
(5.575)(4.809)
Number of observations16,78616,78616,78616,786
R-squared−0.0230.014−0.123−0.123
Number of households6582658265826582
Under. Id.174.424174.42467.76867.768
Weak id.172.159172.15967.46367.463
First-stage results
ICT Index0.001 ***0.001 ***0.001 ***0.001 ***
(0.0001)(0.0001)(0.0001)(0.0001)
Notes: Robust standard errors in parentheses. *** p < 0.01, ** p < 0.05, * p < 0.1. Under. Id. refers to Kleibergen–Paap rk LM statistic. Weak id. refers to Kleibergen–Paap rk Wald F statistic. Source: Authors’ own calculations.
Table 5. Robustness checks: Additional IV.
Inpatient and Outpatient Health ExpensesSelf-Treatment Expenses
Relative urban population−0.044 *0.077 ***
(0.025)(0.020)
Number of observations16,78616,786
R-squared0.0070.025
Number of households65826582
Kleibergen–Paap rk LM statistic (Underidentification test)926.43926.43
Kleibergen–Paap rk Wald F statistic (Weak identification test)450.797450.797
Hansen J statistics (Overidentification test)3.3753.114
Hansen J statistics (p-value)0.0660.078
First-stage results
ICT Index0.014 ***0.014 ***
(0.002)(0.002)
Lag of relative urban population0.517 ***0.517 ***
(0.017)(0.017)
Notes: Robust standard errors in parentheses. *** p < 0.01, ** p < 0.05, * p < 0.1. Source: Authors’ own calculations.
Table 6. Possible pathways.
(A1)(A2)
Insurance ExpenseHousehold’s Total Income
Relative urban population0.780 ***9422.991 ***
(0.213)(3189.222)
Number of observations16,78612,704
R-squared−0.141−0.065
Number of households65825046
Kleibergen–Paap rk LM statistic (Underidentification test)80.256.812
Kleibergen–Paap rk Wald F statistic (Weak identification test)78.56555.614
First-stage results
ICT Index0.021 ***0.02 ***
(0.002)(0.003)
Notes: Robust standard errors in parentheses. *** p < 0.01, ** p < 0.05, * p < 0.1. Source: Authors’ own calculations.
Disclaimer/Publisher’s Note: The statements, opinions and data contained in all publications are solely those of the individual author(s) and contributor(s) and not of MDPI and/or the editor(s). MDPI and/or the editor(s) disclaim responsibility for any injury to people or property resulting from any ideas, methods, instructions or products referred to in the content.