Abstract
Chicken eggs are a staple food widely consumed directly or indirectly (as an ingredient in other food items) in Saudi Arabia. Due to the importance of eggs in Saudi consumers’ diet, this study aimed to determine the sociodemographic factors affecting Saudi consumer demand for eggs and how changes in egg prices and consumer income may influence dietary intake derived from eggs. This study analyzes survey data from 466 respondents. We used a double-log demand model to obtain the price and income elasticities of egg demand. The results show that the price elasticity of egg demand is negative and inelastic, indicating that changes in egg price have a small influence on egg demand. Additionally, income elasticity is positive and <1, implying that eggs are a necessary food item. Cross-price elasticities show that cheese and milk complement egg consumption. Meanwhile, cornflakes (a breakfast cereal) were found to be a good substitute for eggs. Furthermore, the results show that consumer demand for eggs is expected to increase as household size increases. Women exhibited a higher demand for eggs, compared with men. Nutrient income elasticity shows that an increase in consumer income increases protein, fat, and calorie intake from eggs. Nutrient price elasticity shows that an increase in egg price has the greatest negative influence on protein intake, resulting from a decrease in egg consumption. This study recommends that decision makers actively monitor egg prices and take all necessary actions to prevent spikes in egg prices, as this will improve nutritional and food security and help consumers maintain a stable protein intake from egg consumption.
1. Introduction
The lack of adequate food can result in malnutrition and famine. Accordingly, the food sector plays an important role in economic activities worldwide. The volatility of food prices resulting from a fluctuating food supply affects consumers’ acquisition of food and, consequently, their nutrient intake derived from food.
Chicken eggs have been an animal food source consumed by humans for thousands of years worldwide. Eggs have been considered as one of the staple food products that are part of most people’s diet worldwide (FAO 1995). Nonetheless, eggs can be consumed as complementary food in babies’ diet (Faber et al. 2022). They are an essential source of vitamins, minerals, and proteins, which makes them an important and indispensable food component, especially for low-income families. Moreover, eggs contain essential amino acids in appropriate proportions to meet human requirements (Ruxton et al. 2010; Matsuoka and Sugano 2022; Puglisi and Fernandez 2022).
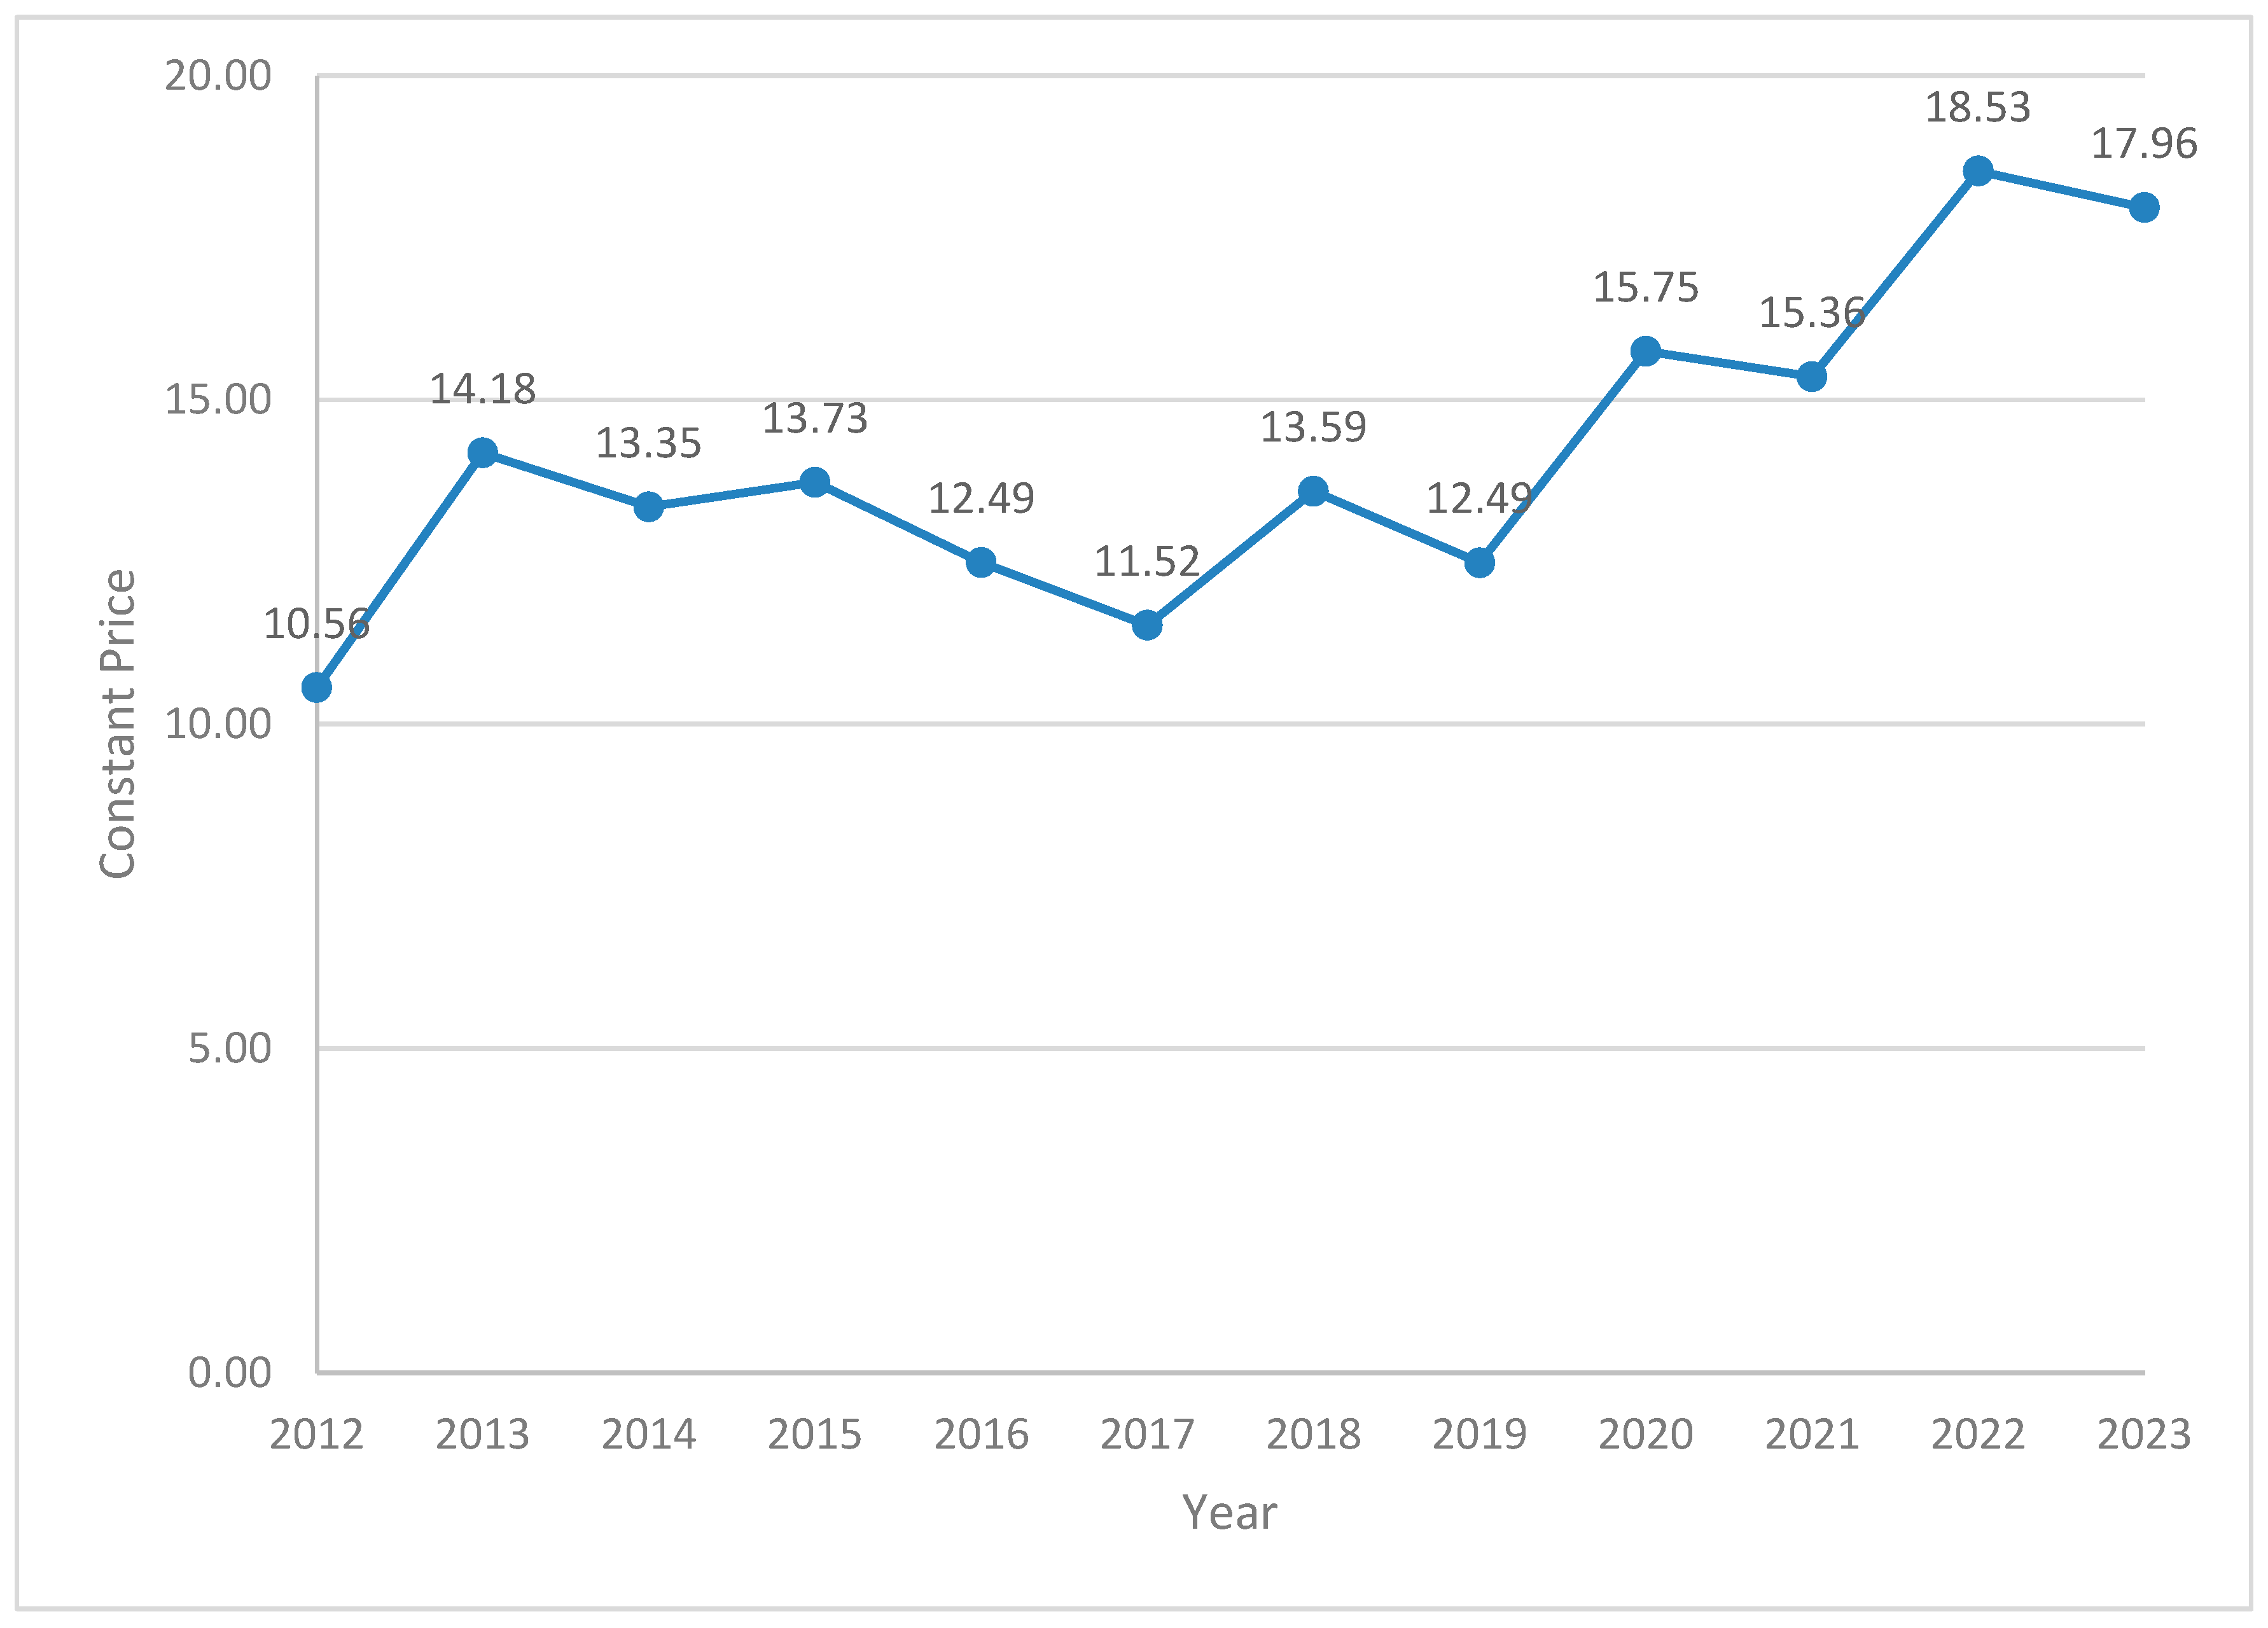
Owing to the global importance of chicken eggs, global production has increased by 69%, compared to that twenty years ago, reaching a production of 87 million/ton in 2020 (FAO 2022). The total annual domestic egg production in Saudi Arabia constitutes 0.4% of the total global production at a rate of 315 thousand/ton per year (MEWA 2019). One report (MEWA 2023) revealed that local agricultural products have shown an increase in production capacity over the past few years—with one of the most important ones being the acceleration of egg production, which has contributed significantly to achieving food security in Saudi Arabia. Egg production achieved high completion rates in 2023, as 123 chicken-laying projects were implemented in Saudi Arabia, with a sufficiency rate of 126%, surpassing production rates from previous years. In addition to this increase in production, per capita egg consumption in Saudi Arabia reached 9.07 kg in 2021 (Helgi Library 2023). It imported more than half a million cartons, equivalent to more than 183 million eggs, to balance supply in the local market (Saudi Agricultural and Livestock Investment Company 2020). However, despite the increase in egg supply, the price of the 30-egg tray has increased by 44.672%, compared with that ten years ago (GASTAT 2024). Figure 1 shows that the average price of egg trays increased to new levels in 2020–2023. This increase in egg price can be attributed to the increase in feed price (Çevrimli et al. 2024; Muhammad et al. 2023), avian flu (Jiménez 2023), and the levy of a 15% value-added tax (VAT) in 2020 following the COVID-19 pandemic (Bogari 2020; Shukeri and Alfordy 2021).
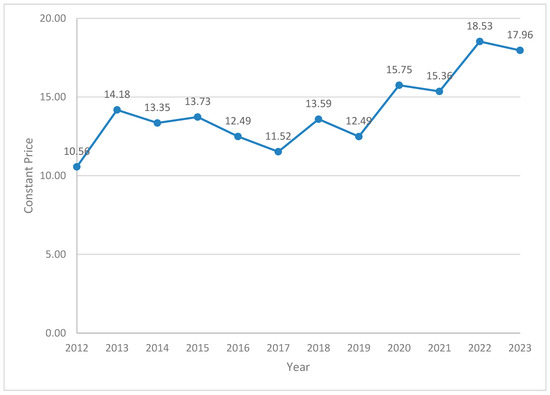
Figure 1.
Average real price of a 30-egg tray (local eggs) in SAR (2012–2022). Source: Authors’ calculation based on GASTAT data.
Therefore, the simultaneous increase in supply and prices makes the contribution of eggs to maintaining a sustainable agricultural market unclear, especially since the average Saudi individual consumes 9.1 kg of chicken eggs annually (MEWA 2023)—approximately 2.75 eggs per person/week. This shows a decline in Saudi individuals’ consumption of the recommended quantities of food rations, according to data from the Healthy Food Palm (FAO 2023; Ministry of Health 2023).
This study investigated the factors influencing egg consumption in Saudi Arabia. Additionally, this study aimed to demonstrate how changes in egg prices and consumer income influence consumers’ nutrient intake derived from egg consumption. Specifically, it estimates price and income elasticities to measure egg demand’s sensitivity to changes in price and consumer income. Further, it examines the effect of household sociodemographic characteristics on egg consumption. Finally, it concludes by estimating the nutritional elasticities of calories, proteins, carbohydrates, and total fat obtained from egg consumption.
Food consumption is one of the most important factors contributing to the continuation of business cycles. Owing to the COVID-19 pandemic and international conflicts, the cost of inputs used in food production and supply have drastically increased, resulting in a spike in food prices. However, the International Monetary Fund (2022) indicated that the global economy is resisting the increase in food prices. Meanwhile, eggs were among the food items affected by price hikes. Therefore, previous studies in other countries were reviewed for enrichment, contrast, identification of differences, and generation of ideas.
In Latin America, specifically in the Costa Rican context, Dal et al. (2022) aimed to analyze the price elasticity of the main food categories, determine the impact of consumer demand for food, anticipate changes in the quantity demanded, and provide recommendations from the perspective of cognitive behavioral therapy according to 11 food groups. The average expenditure on milk, cheese, and egg products was 14.69% of the total food expenditure, while 16.67% of families did not consume eggs, milk, or cheese. The income elasticity for the egg, milk, and cheese groups was 1.01, which means it was a luxury good for families. The uncompensated price of elasticity of the milk, eggs, and cheese groups is −1.03, meaning that this group’s demand is price-elastic. Regarding uncompensated cross-price elasticity, an increase in the price of eggs, cheese, and milk leads to an increase in the consumption of oils and fats by 3.1%.
In the United States, the demand for pastured eggs was estimated to be price-inelastic, and pastured eggs were classified as luxury goods (Bakhtavoryan et al. 2023). Bakhtavoryan et al. (2021) estimated the demand for omega-3, organic, cage-free, and conventional eggs using the exact affine stone index model. Expenditure elasticity was <1, showing that all egg types were considered necessary. Moreover, the estimated own-price elasticity was <1 in absolute value for omega-3 and conventional eggs, showing that the demand for these types of eggs was price-inelastic. The uncompensated and compensated cross-price elasticities showed that traditional eggs were a substitute for all types of eggs. Said study’s results also showed that larger households spent more on organic and conventional eggs, compared with smaller households. Further, household heads with a high school degree or a lower degree spent more on conventional eggs, compared with college-educated household heads. In an old study by Blaylock and Burbee (1985), the impact of prices, income, and household characteristics on the demand for eggs was estimated using data obtained from the United States Department of Agriculture’s food consumption survey. Its results indicated that the price elasticity of eggs was inelastic and <1. Moreover, the estimated income elasticity was negative and statistically insignificant. The authors attributed this to the fact that the demand for eggs is insensitive to changes in consumer income.
Many researchers have empirically examined egg demand in East Asia. Wongmonta (2022) analyzed food consumption patterns for six food groups (rice and grains, meat and fish, eggs and dairy products, vegetables and fruits, meals at home, and meals outside the home) to determine how families respond to changes in food prices and income. The author used a household survey of rural and urban residents in Thailand. Families spent 5.2% of their income on eggs and dairy products. Family size and the ratios of elderly individuals and children in the household had a negative impact on food expenditure at the 1% significance level. The estimated expenditure elasticities ranged from 0.71 to 1.29, indicating that most food groups were normal goods. The estimated uncompensated own-price elasticity for egg and dairy groups was −0.946, while the compensated own-price elasticity was −0.894. Rathnayaka et al. (2021) analyzed the demand for foods derived from animal sources (chicken, meat, eggs, and fish) to estimate income and price elasticities in seven Asian regions: Hong Kong, Japan, the Philippines, Singapore, Sri Lanka, Taiwan, and Thailand. Their results revealed, through income elasticity, that animal-derived foods were necessities in all regions, except for Taiwan. The conditional price elasticity of eggs ranged from −0.029 in Japan to −0.650 in Thailand, indicating that eggs were price-inelastic. Conversely, the unconditional price elasticity of eggs in Sri Lanka was −1.575, which means the demand is price-elastic. Siregar et al. (2021) analyzed the effect of consumer income and substitute products (tempeh, tofu, and chicken meat) on the demand for chicken eggs. The sample comprised 60 participants residing in Makassar, Indonesia. Their results showed that tempeh, tofu, and chicken meat significantly affected egg demand. The study predicted that if income increased by IDR 100,000/month, the demand for eggs would increase by 0.007208 trays per month. Nafaati et al. (2021) analyzed the price elasticity of demand for hybrid chicken eggs in Pamekasan, Indonesia. Their results showed that the price elasticity of demand for hybrid chicken eggs was price-inelastic. In another study (Nikmatul et al. 2020) conducted in Indonesia, the own- and cross-price elasticities of eggs were estimated using the quadratic almost ideal demand system (QUAIDS). Their results showed that eggs were a normal good and families reacted to increments in animal-source food prices by switching to cheaper animal foods, which worsened their nutritional status, especially among low-income consumers. A previous study (Astaman et al. 2020) explained the factors affecting the demand for chicken eggs in Berengkanaya, Indonesia. They surveyed 60 family respondents through observations, interviews, and questionnaires. Data were analyzed using a multiple linear regression model. Their results showed that the factors influencing egg demand were egg and broiler chicken prices. Additionally, (Febrianto et al. 2013) aimed to determine the factors affecting egg prices in Malang, Indonesia, using a multiple linear regression model. The results showed that eggs were both price-elastic and -inelastic. Regarding the results of the cross-elasticity of demand, the authors concluded that other food items did not function as substitutes for eggs. Finally, said study showed that household size and education affected egg demand. Hovhannisyan and Devadoss (2020) examined the impact of urbanization on food demand and modeled the components of supply and demand in China through a national survey of urban households. The expenditure elasticity for eggs was 1.039, indicating that eggs were a luxury good. As for the uncompensated price elasticity of eggs, it was −0.837 and inelastic. Further, the uncompensated cross-price elasticity between eggs and vegetables was positive, implying that they are substitutes. The cross-price elasticity between eggs and legumes was negative, indicating that they are complementary. Jiang et al. (2015) evaluated the impact of urban economic development on the change in demand for 10 food commodities in China. The income elasticity of the demand for eggs was 1.183, indicating that eggs were luxury goods for residents of major cities, whereas for residents of medium-sized cities, eggs were identified as necessary. The uncompensated price elasticity of eggs for residents of major cities was −0.553, while that for residents of medium-sized cities was −0.804, which means that eggs are an inelastic good in both cities.
In Europe, Kralik et al. (2020) examined the factors affecting egg consumption in Croatia. Their sample size was 200 participants. They focused on egg quality indicators and compared the preferences of men and women through the factors affecting egg consumption. These factors were product quality, expiration date, ease of cooking, diversity of use, traces of eggs, egg price, and egg safety. Peltner and Thiele (2021) used the QUAIDS to estimate the price and income elasticities of demand for food in Germany. Their estimation of the uncompensated own-price elasticity of egg demand (−0.441) and the compensated price elasticity (−0.428) indicated that egg demand in Germany is price-inelastic. Also, the expenditure elasticity (0.838) showed that eggs are a necessity in Germany. In Lithuania, the demand for eggs was shown to be price-inelastic by Petrauskaitė-Senkevič (2013). Furthermore, a comparison of egg demand in Ukraine and Lithuania confirmed the fact that egg demand in both countries is price-inelastic (Petrauskaitė-Senkevič 2020).
A study conducted in Cambodia (Sary et al. 2019) analyzed food prices and household spending on food. The authors used data from 240 random households and concluded that a 1% increase in the price of eggs contributed to a 0.22% increase in spending on eggs. The price elasticity of eggs was −0.0920; hence, it was inelastic. The cross-price-elasticities between eggs and both corn and vegetables were positive, indicating that they are substitute goods.
There are few studies that empirically estimated egg demand in Arab countries. El-Dayech et al. (2019) estimated the factors affecting egg consumption in Al-Jabal Al-Achder, Libya, based on three income categories (low, medium, and high). Their sample size was 195. Their results showed that the demand for eggs was price-inelastic. Further, the demand for eggs was inelastic for all income categories except for the middle-income category, for which demand was income-elastic. Hassan and Faied (2017) estimated the expenditure elasticities of food items, including eggs, in Beheira and Assiut, Egypt. Their results showed that eggs were a necessary food item.
In spite of the aforementioned studies’ contributions, none applied a demand model to analyze egg demand in Saudi Arabia. Thus, the price and expenditure elasticities of egg demand, as well as the factors affecting consumer egg demand in Saudi Arabia, remain unclear. Thus, the present study fills this gap in the literature by revealing how consumer characteristics affect egg demand and demonstrating how changes in egg prices and consumers’ income can influence consumers’ nutrient intake derived from eggs.
2. Materials and Methods
The data-collection process began in April 2022 and ended in July 2023. The required sample size was determined using a sample size calculator (SurveyMonkey 2024), based on the population size of Saudi Arabia, as follows:
N = population size (33 million).
e = margin of error (equal to 5 percent).
z = standardized value equal to 1.96.
p = is a probability value that is between 0 and 1, and it was set to 0.50 (Bishmani 2014).
Equation (1) indicates that the minimum sample size should not be <385. Data were collected by distributing an electronic questionnaire through various social media applications such as WhatsApp, Snapchat, Telegram, and Instagram since these apps are widely used in Saudi Arabia according to a report by (CST 2023). Although the major limitation of electronic questionnaire is concerned with residents who completely do not use the internet since they will not have a chance of inclusion in the study, the report indicated that 98.6% of Saudi males and females have access to the internet. The report also showed that the usage rate among the old population (in the age of 60 to 74 years) is in the range of 92.9% to 77.3%. Furthermore, the main limitation of data collected through questionnaires is the discrepancy between the self-reported value by respondents and the true value (Bauhoff 2014). The survey consisted of four sections. Section 1 collected participants’ sociodemographic data (including gender, age, income, education, and employment status). Section 2 collected general information on egg consumption and prices. Section 3 collected information on other factors that may influence egg consumption. Finally, Section 4 collected information on the prices and consumption of other food products that may be considered by participants as a complement or replacement for eggs. After removing unreliable and missing observations, 466 valid responses remained for analysis. Table 1 shows the summary statistics for the qualitative data, while Table 2 shows those for the quantitative data.

Table 1.
Summary of qualitative variables.
Table 2.
Summary of quantitative data.
Of the 466 respondents in the final sample, 279 were men. The participants’ average age was 32 years. The household size of most respondents (51.37%) ranged between five and nine individuals. These characteristics are close with the percentages published by Saudi Census (2022a, 2022b) for both males and females as well as household size in Saudi Arabia. Most respondents lived in cities (93.35%), which can be attributed to the fact that 82.1% of Saudi Arabia’s total population lives in urban areas (UN-Habitat 2024). Regarding social status, 51.29% were unmarried. Most respondents (66.31%) held a bachelor’s degree. Although participants in the labor force represented 64.59% of the sample, there were 101 unemployed participants in the sample, which can be attributed to the fact that the Saudi unemployment rate reached 8.6% in Q3/2023 according to the labor market statistics report released by (GASTAT 2023). Moreover, 42.27% of the sample reported a monthly income of less than SAR 4999, which is in line with the average monthly income (SAR 3618) in the private sector in Saudi Arabia in 2022 (Saudi Central Bank–SAMA 2024). Further, respondents with egg allergies represented only 12.88% of the sample, whereas 18.67% reported that they inspected the availability of eggs in other food products’ ingredient lists. Furthermore, respondents who owned laying hens accounted for 7.73% of the sample. Moreover, 91.63% of respondents consumed eggs during breakfast, 28.11% as a main course, 39.91% in snacks, 75.75% in sweets, and 65.02% in pies.
Additionally, regarding participants’ egg consumption, respondents usually bought one tray of eggs (30 eggs) on average. Respondents’ egg expenditure ranged from SAR 0.00 SAR to SAR 100.00, with a mean value of SAR 18.00. Table 2 reports data related to the prices and quantities of complementary and substitute goods for eggs, including cheese, bread, tomatoes, onions, lentils, beans, milk, cornflakes, and peanut butter. This information is necessary because it helps estimate the cross-price elasticity of egg demand. Meat was excluded from the study design because it is mainly consumed in lunch or dinner meals and rarely consumed as a breakfast meal. Indeed, Al-Hazzaa et al. (2020) investigated breakfast consumption patterns in Saudi Arabia and indicated that spread cheese sandwiches, eggs, and cereal are the most frequently consumed breakfast items by Saudi children.
Empirical estimation strategy for food demand can be mainly divided into two methods. The first method is a system demand approach, which involves estimating multiple demand equations. An example of the system demand approach is the popular almost ideal demand system (AIDS) model (Deaton and Muellbauer 1980), which is derived by applying the Shephard’s lemma on consumer cost function to obtain the Hicksian demand equations. The second method involves estimating single-equation demand model such as the famous double-log demand model (Hina et al. 2022). The main advantage of this approach is that it requires fewer parameters compared to the system demand approach. For full details regarding food demand models and their derivation, estimation, and elasticity formulas, the reader is advised to refer to Okrent and Alston (2011). A double-log demand model was used to estimate the price elasticity of the demand for eggs, income elasticity, and cross-price elasticities (Alston et al. 2002). The model can be expressed as follows:
where Qi represents the dependent variable (quantity of eggs demanded), I denotes income (or total consumer expenditure), P is the vector of the eggs’ own price and the cross-prices of other food items, and X represents socioeconomic factors affecting egg demand. For Equation (2) to satisfy microeconomic theory, the adding-up condition must hold. Thus, we tested the adding-up process as follows:
The elasticities in Equation (2) are Marshallian (uncompensated). The uncompensated demand consists of income and substitution effects, whereas the compensated demand curve includes only the substitution effects (Autor 2016). Thus, the main difference between the compensated and uncompensated demand curves is whether utility or income is held constant when establishing the demand curves (Snyder et al. 2012). To obtain the Hicksian (compensated) elasticities, we used the Slutsky equation as follows:
where is the compensated elasticity, S denotes budget shares, are the uncompensated price elasticities obtained from Equation (2), and is the expenditure elasticity of egg demand.
As eggs are an essential nutritious food item, it is important to predict how changes in egg prices and consumer income affect consumer nutrient intake obtained through egg consumption. The impact of income and price changes on dietary intake can be predicted using nutrient income and nutrient price elasticities, as follows (Faharuddin et al. 2017):
where is the nutrient elasticity k with respect to price; is the nutrient elasticity with respect to expenditure; is the amount of dietary intake such as calories, proteins, carbohydrates, and total fats available in egg; is the quantity of eggs consumed; and is the total dietary intake obtained from respondents’ regular diet.
3. Results and Discussion
The first step in the double-log demand model is the examination of the null and alternative hypotheses (3) and (4). Based on the results of the F-test in Table 3, we failed to reject null hypothesis (3), implying that we do not need to impose additional restrictions in the estimation process.
Table 3.
F-test for an adding-up condition.
The double-log demand model (2) was estimated using R software 4.3.2. After estimating the model, we conducted diagnostic tests to ensure that our model did not violate the least-squares assumptions. The results of the multicollinearity test (available upon request) show that all variance inflation factors were <5, implying that our model did not suffer from multicollinearity problems. We also examined the existence of influential outliers by inspecting the Cook’s d values and the Bonferroni outlier test. The Cook’s d values for all observations did not exceed 1, implying that we did not have an influential point. Moreover, the unadjusted p value for the Bonferroni outlier test was statistically significant at the 1% level for only one value. Thus, we re-estimated the model after removing the potentially influential points. Additionally, we rejected the null hypothesis of the Breusch–Pagan heteroskedasticity test; hence, we estimated our model with a heteroskedasticity-robust standard error. The results of the estimated model, along with the goodness-of-fit measures, are reported in Table 4.
Table 4.
Double-log demand model parameter estimates.
The results of the F-statistics were significant at the 1% level, which meant the null hypothesis was rejected and that at least one of the independent variables in the model was significant and affected egg demand. The residual standard error showed that, on average, the predicted value deviated from the actual value by 0.237 points. Additionally, the R-square value was 0.35, showing that 35% of the variation in egg demand was explained by the independent variables.
Since eggs are a normal good, the uncompensated demand is more price-responsive compared to the uncompensated demand (Snyder et al. 2012). The results of the estimated compensated and uncompensated own-price elasticities of egg demand are consistent with microeconomic theory because they were negative, <1, and significant at the 1% level. This indicates that egg demand in Saudi Arabia is price-inelastic, which implies that the quantity of eggs demanded is insensitive to changes in egg prices. Our findings regarding the inelastic own-price elasticity of egg demand coincide with prior research (Şahinli and Fidan 2012; Jiang et al. 2015; Sary et al. 2019; Hovhannisyan and Devadoss 2020; Nikmatul et al. 2020; Bakhtavoryan et al. 2021; Rathnayaka et al. 2021; Anindita et al. 2022; Chen and Zhong 2022; Wongmonta 2022; Forgenie et al. 2023; Khoiriyah et al. 2023). Conversely, our estimate of the own-price elasticity of egg demand diverged from the findings of (Astaman et al. 2020), who showed that the own-price elasticity of egg demand was positive and >1. The positive own-price elasticity of demand for necessary goods such as eggs can be attributed to various factors including using demand models that are not consistent with microeconomic theory (model specification errors), measurement error, data aggregation bias, and omitted variable bias.
The income elasticity of egg demand was statistically significant at the 1% level, positive, and <1, implying that eggs are recognized as a (normal) necessary food item. This finding coincides with prior research (Febrianto et al. 2013; Hassan and Faied 2017; Nikmatul et al. 2020; Bakhtavoryan et al. 2021; Rathnayaka et al. 2021; Anindita et al. 2022; Chen and Zhong 2022; Forgenie et al. 2023; Khoiriyah et al. 2023). However, it diverges from the findings of Blaylock and Burbee (1985), who found that the income elasticity of egg demand was negative and <1, indicating that eggs are an inferior food item. Moreover, our results also diverge from the findings of Şahinli and Fidan (2012) and Hovhannisyan and Devadoss (2020), who found that the income elasticity of egg demand is >1, implying that eggs are a luxury good.
The uncompensated price elasticities indicate that cheese and milk complemented egg consumption. Furthermore, the compensated price elasticities show that cornflakes (breakfast cereal) were a substitute for eggs. The compensated demand gives more precise classification regarding the interrelationship between eggs and other food items (as complement, substitute, or independent) because the income effect in the Marshallian elasticities may obscure the true price effects.
Regarding the influence of sociodemographic characteristics on egg consumption, our results show that household size had a significantly positive influence on egg demand. Indeed, a 1% increase in household size increased egg demand by 0.076%. The positive influence of household size on egg demand has been identified in other studies (Febrianto et al. 2013; Hassan and Faied 2017; El-Dayech et al. 2019; Bakhtavoryan et al. 2021), which showed that men exhibited a lower demand for eggs, which can be attributed to the fact that many women in Saudi Arabia not only consume eggs directly but also use eggs as an input to create other food items such as cakes and pastries (Kralik et al. 2020). Furthermore, household heads with an associate’s degree (diploma) consumed more eggs than those with a bachelor’s degree.
As eggs are a necessary food item, the nutritional intake from eggs (Egg Nutrition Center 2024; United States Department of Agriculture 2024) was calculated according to the average consumption of calories, proteins, carbohydrates, and total fats (Aljefree et al. 2021). Research has indicated that the average Saudi per capita nutritional intake is higher than recommended (Saudi Food & Drug Authority 2022). Consequently, nutritional price elasticity was calculated using Equation (6) and nutritional income elasticity using Equation (7). The results are shown in Table 5.
Table 5.
Nutrient elasticities of egg consumption.
The nutrient income elasticities for eggs were positive, indicating that an increase in consumer income led to an increase in dietary intake. We observed that an increase in consumer income had the greatest influence on protein intake from egg consumption. In fact, a 1% increase in consumer income increased protein intake from egg consumption by 0.12%. Furthermore, calorie and fat intake are expected to increase as a result of an increase in consumer income, while carbohydrates will be least affected by changes in consumer income. Nutrient–income elasticities are important because they assist decision makers in designing effective policies to alleviate malnutrition, especially for low-income populations (Zhao et al. 2022). In contrast, the nutrient price elasticities for eggs were negative, implying that an increase in the price of eggs leads to a decrease in dietary intake derived from eggs. Consequently, an increase in egg prices had the greatest impact on protein intake. The results show that a 1% increase in egg price reduced protein intake from egg consumption by 0.0882%. Not only was protein intake reduced by price increases, but fat and calorie intake were also expected to decrease. Changes in necessary food product prices such as eggs can influence consumers’ consumption bundle and consequently their dietary intake. Thus, policy makers should develop price-based policies (Harding and Lovenheim 2017) that not only achieve economic goals but also support Saudi Arabia’s Vision 2030 for nutritional goals.
4. Conclusions
Because eggs are an important food commodity, their availability and affordability contribute significantly to the maintenance of food security in any country. This study investigated consumers’ egg demand in Saudi Arabia to reveal the factors influencing egg demand and how changes in consumer income and egg prices can influence the dietary intake obtained from eggs. This study relied on primary data randomly distributed among households in Saudi Arabia. The final sample included 466 individuals. This study used a double-log demand model to estimate the price and income elasticity of egg demand. The estimated own-price elasticity of eggs was negative and <1, showing that changes in egg demand were insensitive to changes in egg prices. Furthermore, the estimated income elasticity was <1, empirically proving that eggs are a necessary food item. The estimated cross-price elasticities showed that cheese and milk complemented egg consumption. Conversely, cornflakes (a breakfast cereal) were found to be a substitute food item for eggs. Moreover, an increase in household size increased consumer demand for eggs. Respondents with an associate’s degree (diploma) demanded more eggs than those with bachelor’s degrees. Women were found to demand more eggs than men because they not only consume eggs directly but also use them as an input to create other food items. Regarding nutrient elasticities, the study showed that income had the greatest positive influence and price had the greatest negative influence on protein intake obtained from eggs. To achieve food and nutritional security, we recommend that decision makers in Saudi Arabia monitor egg prices and intervene, if necessary, with suitable policies to prevent persistent increases in egg prices. This could help ensure that eggs are accessible and affordable to all residents. The practical implication of this recommendation results from the fact that the demand for eggs in this paper was shown to be price-inelastic and eggs were proven to be a necessary commodity through income elasticity, which means that consumers will continue to purchase eggs even at a higher price. This study contributes significantly to food security in Saudi Arabia. It recommends future research to examine the factors influencing egg supply in Saudi Arabia and how external shocks to egg supply, such as bird flu, can affect consumer dietary intake. The main limitation of this study is the possible bias stemming from the use of cross-sectional data obtained through a survey that relies on self-reported data. This may lead to a discrepancy between the observed value and the true value. To overcome this issue, we recommend that future research uses scanner data from retail stores to estimate the price and expenditure elasticities of egg demand. The other limitations are the focus on egg demand in general without regard to the size of eggs, color of eggs, and farming practices such as conventional or organic eggs.
Author Contributions
Conceptualization, D.A. and M.A.-M.; methodology, M.A.-M.; software, D.A. and M.A.-M.; validation, D.A. and M.A.-M.; formal analysis, D.A. and M.A.-M.; investigation, D.A.; resources, D.A.; data curation, D.A.; writing—original draft preparation, D.A. and M.A.-M.; writing—review and editing, D.A. and M.A.-M.; visualization, D.A. and M.A.-M.; supervision, M.A.-M.; project administration, M.A.-M.; funding acquisition, D.A. All authors have read and agreed to the published version of the manuscript.
Funding
This research was funded by [Deanship of Scientific Research at King Faisal University] grant number [GrantA433] and The APC was funded by [Deanship of Scientific Research at King Faisal University].
Institutional Review Board Statement
The study was conducted in accordance with the Declaration of Helsinki, and approved by the Institutional Review Board (or Ethics Committee) of King Faisal University (protocol code KFU-REC-2023-MAY-ETHICS901 and date of approval 31 May 2023).
Informed Consent Statement
Informed consent was obtained from all subjects involved in the study.
Data Availability Statement
The raw data supporting the conclusions of this article will be made available by the authors on request.
Conflicts of Interest
The authors declare no conflict of interest.
References
- Al-Hazzaa, Hazzaa, Abdulrahman Alhowikan, Maha Alhussain, and Omar Obeid. 2020. Breakfast consumption among Saudi primary-school children relative to sex and socio-demographic factors. BMC Public Health 20: 448. [Google Scholar] [CrossRef] [PubMed]
- Aljefree, Najlaa, Israa Shatwan, and Noha Almoraie. 2021. Association between nutrients intake and coronary heart disease among adults in Saudi Arabia: A case-control study. Progress in Nutrition 23: e2021111. [Google Scholar] [CrossRef]
- Alston, Julian, James A. Chalfant, and Nicholas E. Piggott. 2002. Estimating and testing the compensated double-log demand model. Applied Economics 34: 1177–86. [Google Scholar] [CrossRef]
- Anindita, Ratya, Ana Arifatus Sa’diyah, and Nikmatul Khoiriyah. 2022. Income and price elasticities of animal food demand and welfare in Indonesian urban: An application of the LA-AIDS. Future of Food: Journal on Food, Agriculture and Society 11: 1–14. [Google Scholar] [CrossRef]
- Astaman, Putra, Ahmad Ramadhan Siregar, and SU Nurbayani. 2020. Analysis effect the price of the demand for chicken eggs in Biringkanaya district. In IOP Conference Series: Earth and Environmental Science. Bristol: Institute of Physics Publishing. [Google Scholar] [CrossRef]
- Autor, David. 2016. Linking Compensated and Uncompensated Demand. MIT OpenCourseWare. Available online: https://ocw.mit.edu/courses/14-03-microeconomic-theory-and-public-policy-fall-2016/c4cc33011be7b8f56cab3b0203148aa2_MIT14_03F16_lec7.pdf (accessed on 30 July 2024).
- Bakhtavoryan, Rafael, Vardges Hovhannisyan, and Desire Djidonou. 2023. A censored regression analysis of household-level demand for pastured eggs in the United States. Journal of Agribusiness in Developing and Emerging Economies, 1–36. [Google Scholar] [CrossRef]
- Bakhtavoryan, Rafael, Vardges Hovhannisyan, Stephen Devadoss, and Jose Lopez. 2021. An empirical evaluation of egg demand in the United States. Journal of Agricultural and Applied Economics 53: 280–300. [Google Scholar] [CrossRef]
- Bauhoff, Sebastian. 2014. Self-report bias in estimating cross-sectional and treatment effects. Encyclopedia of Quality of Life and Well-Being Research, 5798–5800. [Google Scholar] [CrossRef]
- Bishmani, Shakeeb. 2014. Comparative analysis of formulas used to calculate the size of the random sample. Tishreen University Journal for Research and Scientific Studies-Economic and Legal Sciences Series 36: 85–100. [Google Scholar]
- Blaylock, James, and Clark Burbee. 1985. Consumer Demand for Eggs and Market Implications. US Department of Agriculture. Available online: https://books.google.com.sa/books?hl=ar&lr=&id=12dpUI2od9gC&oi=fnd&pg=PA1&dq=Consumer+Demand+for+Eggs+and+Market+Implications&ots=mziCarET3W&sig=ofplEUtN7ZHDVdSuPONEzxqo8sU&redir_esc=y#v=onepage&q=Consumer%20Demand%20for%20Eggs%20and%20Market%20Implications&f=false (accessed on 19 July 2023).
- Bogari, Adel. 2020. The economic and social impact of the adoption of value-added tax in Saudi Arabia. International Journal of Economics, Business and Accounting Research (IJEBAR) 4. [Google Scholar] [CrossRef]
- Chen, Jiao, and Funing Zhong. 2022. The role of income and food prices in diet-related greenhouse gas emissions in China: A path towards a sustainable diet. Foods 11: 4051. [Google Scholar] [CrossRef]
- Communication, Space & Technology Commission—CST. 2023. Saudi Internet 2023. Available online: https://www.cst.gov.sa/en/mediacenter/pressreleases/Pages/2024042402.aspx (accessed on 28 July 2024).
- Çevrimli, Mustafa, Burak MAT, Murat Polat, Mehmet Saltuk Arikan, Ahmet Cumhur Akin, Mustafa Agah Tekindal, and Aytekin Günlü. 2024. Determinants OF Consumer Egg Prices in Turkiye Using K-Nearst Neighbors Regression Analysis. Journal of Animal & Plant Sciences 34: 557–563. [Google Scholar] [CrossRef]
- Dal, Eléonore, Rodrigo Rivera, Cristian Morales Opazo, and Mariela Madrigal. 2022. Fiscal reform in Costa Rica: Price elasticities of major food categories to inform decision-making. Frontiers in Nutrition 9: 836501. [Google Scholar] [CrossRef] [PubMed]
- Deaton, Angus, and John Muellbauer. 1980. An almost ideal demand system. The American Economic Review 70: 312–326. [Google Scholar]
- Egg Nutrition Center. 2024. Egg Nutrition Facts Labels. Available online: https://www.incredibleegg.org/nutrition/egg-nutrition-facts-labels/ (accessed on 13 February 2024).
- El-Dayech, Abd El-aaly, Abd El-Razek El-Shabah, and Hemeda Abd El-Kareem. 2019. The effected factors on egg consumption at El-gabal El-achdar Province. Journal of the Advances in Agricultural Researches 24: 126–135. [Google Scholar]
- Faber, Mieke, Linda Malan, Herculina Kruger, Hannah Asare, Marina Visser, Tshiphiri Mukwevho, Cristian Ricci, and Cornelius M. Smuts. 2022. Potential of egg as complementary food to improve nutrient intake and dietary diversity. Nutrients 14: 3396. [Google Scholar] [CrossRef] [PubMed]
- Faharuddin, Faharuddin, Andy Mulyana, Muhammad Yamin, and Yunita. 2017. Nutrient elasticities of food consumption: The case of Indonesia. Journal of Agribusiness in Developing and Emerging Economies 7: 198–217. [Google Scholar] [CrossRef]
- Febrianto, Nanang, Budi Hartono, and Dan Hari Dwi Utami. 2013. Analysis of the demand for eggs in city of Malang. IOSR Journal of Business and Management 11: 35–39. [Google Scholar] [CrossRef]
- Food and Agriculture Organization. 1995. Dimensions of Need—An Atlas of Food and Agriculture. Rome: Food and Agriculture Organization of the United Nations. Available online: https://www.fao.org/4/u8480e/U8480E00.htm#Dimensions%20of%20need (accessed on 17 August 2024).
- Food and Agriculture Organization. 2023. Food-Based Dietary Guidelines—Saudi Arabia. Available online: https://www.fao.org/nutrition/education/food-dietary-guidelines/regions/countries/saudi-arabia/en/ (accessed on 3 September 2023).
- Food and Agriculture Organization, ed. 2022. Food and Agriculture—Statistical Yearbook 2022, World Food and Agriculture—Statistical Yearbook 2022. Rome: Food and Agriculture Organization of the United Nations. [Google Scholar] [CrossRef]
- David Forgenie, Nikmatul Khoiriyah, and Evi Feronika Elbaar. 2023. Estimating household price and income elasticities for animal derived sources of food using the QUAIDS model: The case of Jakarta, Indonesia. Tropical Agriculture 100: 317–28. [Google Scholar]
- General Authority for Statistics—GASTAT. 2023. Labor Market Statistics Q3/2023. Available online: https://www.stats.gov.sa/sites/default/files/LMS%20Q3_2023_PR_EN%20Press%20Release.pdf (accessed on 28 July 2024).
- General Authority for Statistics—GASTAT. 2024. Public Data. Available online: https://www.stats.gov.sa/en/statistics-overview (accessed on 28 July 2024).
- Harding, Matthew, and Michael Lovenheim. 2017. The effect of prices on nutrition: Comparing the impact of product-and nutrient-specific taxes. Journal of Health Economics 53: 53–71. [Google Scholar] [CrossRef]
- Hassan, Howida, and Engy Faied. 2017. A comparative socioeconomic study of the consumption pattern of food commodities in light of price changes (case study). Journal of Agricultural Economics and Social Sciences 8: 427–38. [Google Scholar] [CrossRef]
- Helgi Library. 2023. Egg Consumption Per Capita in Saudi Arabia. Available online: https://www.helgilibrary.com/indicators/egg-consumption-per-capita/saudi-arabia/ (accessed on 17 August 2024).
- Hina, Hafsa, Fatima Abbas, and Unbreen Qayyum. 2022. Selecting correct functional form in consumption function: Analysis of energy demand at household level. PLoS ONE 17: e0270222. [Google Scholar] [CrossRef]
- Hovhannisyan, Vardges, and Stephen Devadoss. 2020. Effects of urbanization on food demand in China. Empirical Economics 58: 699–721. [Google Scholar] [CrossRef]
- International Monetary Fund. 2022. IMF Annual Report 2022 CRISIS UPON CRISIS. Available online: https://www.imf.org/external/pubs/ft/ar/2022/downloads/imf-annual-report-2022-arabic.pdf (accessed on 21 July 2023).
- Jiang, Li, Karen Seto, and Junfei Bai. 2015. Urban economic development, changes in food consumption patterns and land requirements for food production in China. China Agricultural Economic Review 7: 240–61. [Google Scholar] [CrossRef]
- Jiménez, Jesus. 2023. Bird Flu Cuts Egg Supply, Furthering a Price Surge. The New York Times, A15-L. Available online: https://link.gale.com/apps/doc/A733054919/HRCA?u=anon~328dd188&sid=googleScholar&xid=7d79b68a (accessed on 17 August 2024).
- Khoiriyah, Nikmatul, David Forgenie, and Atiek Iriany. 2023. Estimating household price and income elasticities for animal-sourced food: The case of Bengkulu Province, Indonesia. Agris On-Line Papers in Economics and Informatics, 15. [Google Scholar] [CrossRef]
- Kralik, Igor, Ana Zelić, Jelena Kristić, Sanja Jelić Milković, and Ana Crncan. 2020. Factors affecting egg consumption in young consumers. Acta Fytotechnica et Zootechnica 23: 1–6. [Google Scholar] [CrossRef]
- Matsuoka, Ryosuke, and Michihiro Sugano. 2022. Health functions of egg protein. Foods 11: 2309. [Google Scholar] [CrossRef] [PubMed]
- Ministry of Environment Water and Agriculture. 2023. Data of Poultry Projects in Saudi Arabia; Unpublished Data [Preprint]; Riyadh: Saudi Arabia.
- Ministry of Environment Water and Agriculture. 2019. البيئة”: قطاع الإنتاج الزراعي المحلي يحقق نسبَ اكتفاءٍ عالية. ووفرةً في المنتجات الزراعية خلال 2020. Ministry of Environment Water and Agriculture. Available online: https://www.mewa.gov.sa/ar/MediaCenter/News/Pages/News1004.aspx (accessed on 21 July 2023).
- Ministry of Health. 2023. Health Awareness—The Dietary Guidelines for Saudis. Available online: https://www.moh.gov.sa/en/HealthAwareness/Pages/SaudihealthFoodGuide.aspx (accessed on 15 August 2024).
- Muhammad, Andrew, Charles Martinez, and Abdelaziz Lawani. 2023. Why are eggs so expensive? Understanding the recent spike in egg prices. Choices 38: 1–7. [Google Scholar]
- Nafaati, Aina, Rizqi Agus Utomo, and Dahliatul Hasanah. 2021. Price elasticity of hybrid chicken egg demand in Indonesia and Pamekasan and its causative factors. Journal of Physics: Conference Series 1872: 012019. [Google Scholar] [CrossRef]
- Nikmatul, Khoiriyah, Ratya Anindita, Nuhfil Hanani, and Abdul Wahib Muhalmin. 2020. The analysis demand for animal source food in Indonesia: Using quadratic almost ideal demand system. Business: Theory and Practice 21: 427–39. [Google Scholar] [CrossRef]
- Okrent, Abigail, and Julian Alston. 2011. Demand for Food in the United States: A Review of Literature, Evaluation of Previous Estimates, and Presentation of New Estimates of Demand. Working Paper 1002. Davis: Robert Mondavi Institute. [Google Scholar]
- Peltner, Jonas, and Silke Thiele. 2021. Elasticities of Food Demand in Germany—A Demand System Analysis Using Disaggregated Household Scanner Data. German Journal of Agricultural Economics 70: 49–62. [Google Scholar] [CrossRef]
- Petrauskaitė-Senkevič, Laura. 2013. Price elasticity of demand for eggs in Lithuania. Management Theory and Studies for Rural Business and Infrastructure Development 35: 608–14. [Google Scholar]
- Petrauskaitė-Senkevič, Laura. 2020. Comparison of price elasticity of demand for eggs in Lithuania and Ukraine. Ukrainian Journal of Food Science 8: 137–46. [Google Scholar] [CrossRef]
- Puglisi, Michael, and Maria Luz Fernandez. 2022. The health benefits of egg protein. Nutrients 14: 2904. [Google Scholar] [CrossRef] [PubMed]
- Rathnayaka, Shashika, Saroja Selvanathan, and E.A. Selva Selvanathan. 2021. Demand for animal-derived food in selected Asian countries: A system-wide analysis. Agricultural Economics 52: 97–122. [Google Scholar] [CrossRef]
- Ruxton, Carrie, Emma Derbyshire, and Sigrid Gibson. 2010. The nutritional properties and health benefits of eggs. Nutrition and Food Science 40: 263–79. [Google Scholar] [CrossRef]
- Sary, Sar, Xu Shiwei, Yu Wen, Siek Darith, and Sophannak Chorn. 2019. Household food consumption in rural Cambodia almost ideal demand system analysis. Journal of Physics: Conference Series 1176: 042077. [Google Scholar] [CrossRef]
- Saudi Agricultural and Livestock Investment Company. 2020. Annual Report General Food Security Authority. Available online: https://cp.gfsa.gov.sa/Files/Upload/Studies/46449199.pdf (accessed on 17 August 2024).
- Saudi Census. 2022a. Household size According to region and Nationality. Available online: https://portal.saudicensus.sa/portal/public/2/4/48?type=DASHBOARD (accessed on 18 July 2024).
- Saudi Census. 2022b. Population According to Region, Nationality and Gender. Available online: https://portal.saudicensus.sa/portal/public/1/15/45?type=DASHBOARD (accessed on 20 July 2024).
- Saudi Central Bank–SAMA. 2024. Statistical Report. Available online: https://www.sama.gov.sa/en-US/EconomicReports/Pages/report.aspx?cid=127 (accessed on 29 July 2024).
- Saudi Food & Drug Authority. 2022. Nutrition Card Guide. Available online: https://sfda.gov.sa/ar/awarenessarticle/87229 (accessed on 13 February 2024).
- Shukeri, Siti, and Faisal Alfordy. 2021. Valued Added Tax (VAT) Impact on Economic and Societal Well-Beings (Pre-and Post COVID19): A Perception Study from Saudi Arabia. International Journal of Financial Research 12: 92–100. [Google Scholar] [CrossRef]
- Siregar, Ahmad, Putra Astaman, and M. Darwis. 2021. Income and product substitution effect on eggs demand. IOP Conference Series: Earth and Environmental Science 788: 012212. [Google Scholar] [CrossRef]
- Snyder, Christopher, Walter Nicholson, and Robert Stewart. 2012. Microeconomic Theory: Basic Principles and Extensions, 11th ed. Boston: Cengage Learning. [Google Scholar]
- SurveyMonkey. 2024. Sample Size Calculator. Available online: https://www.surveymonkey.com/mp/sample-size-calculator/ (accessed on 28 July 2024).
- Şahinli, Mehmet, and Halil Fidan. 2012. Estimation of food demand in Turkey: Method of an almost ideal demand system. Quality & Quantity 46: 653–663. [Google Scholar] [CrossRef]
- UN-Habitat. 2024. Saudi Urban Issues. Available online: https://unhabitat.org/saudi-urban-issues (accessed on 28 July 2024).
- United States Department of Agriculture. 2024. Eggs, Grade A, Large, Egg Whole, U.S. Available online: https://fdc.nal.usda.gov/fdc-app.html#/food-details/748967/nutrients (accessed on 13 February 2024).
- Wongmonta, Sasiwooth. 2022. An assessment of household food consumption patterns in Thailand. Journal of the Asia Pacific Economy 27: 289–309. [Google Scholar] [CrossRef]
- Zhao, Jinlu, Jiaqi Huang, and Fengying Nie. 2022. The Income Elasticities of Food, Calories, and Nutrients in China: A Meta-Analysis. Nutrients 14: 4711. [Google Scholar] [CrossRef]
Disclaimer/Publisher’s Note: The statements, opinions and data contained in all publications are solely those of the individual author(s) and contributor(s) and not of MDPI and/or the editor(s). MDPI and/or the editor(s) disclaim responsibility for any injury to people or property resulting from any ideas, methods, instructions or products referred to in the content. |
© 2024 by the authors. Licensee MDPI, Basel, Switzerland. This article is an open access article distributed under the terms and conditions of the Creative Commons Attribution (CC BY) license (https://creativecommons.org/licenses/by/4.0/).