Abstract
The exponential growth in popularity of ETFs over the last three decades has solidified ETFs as an essential component of many investors’ portfolios. Investor sentiment is one of the factors that influence market returns of ETFs during times of market volatility. This article highlights the gap in the literature by examining the role sentiment plays in ETF volatility and providing a more comprehensive understanding of how sentiment interacts with market conditions to affect ETF pricing in the South African context. This article aims to determine the effect of investor sentiment on JSE-listed ETF returns under changing market conditions. The study followed a quantitative methodology using monthly closing prices of seven JSE ETFs and an investor sentiment index. A sample period from October 2008 to December 2023 was used. For a more complex understanding of how sentiment evolved and influenced market regimes, the Markov regime-switching model was integrated with Principal Component Analysis. The results found that investor sentiment had a significant impact on most of the ETFs in both the bull and bear regimes. The bull market was more dominant than the bear market across the ETF returns. Therefore, investor sentiment affected the returns of JSE ETFs. Identifying the effect of investor sentiment on ETFs results in ETF portfolios being less affected by changing market conditions by using risk management techniques and diversifying across asset classes and investing methods.
JEL Classification:
G11; G14; G45
1. Introduction
Exchange-traded funds (ETFs) have gained popularity as an investment instrument since the mid-1990s due to their overnight liquidity, low transaction costs, and low expense ratios (Ben-David et al., 2017). The ability to access the market constantly and at a low cost of trading is what differentiates ETFs for investors, and as a result, ETFs might draw higher levels of high-frequency demand than other institutional portfolios, such as conventional index funds (Ben-David et al., 2018). The exponential growth in popularity and assets under management over the last three decades has solidified ETFs as an integral component of many investors’ portfolios. The most significant factors for the explosive performance of ETFs in the last few years have been their transparency, low management costs, tax efficiency, and diversity (Tsalikis & Papadopoulos, 2019). These benefits are what make ETFs attractive to many investors, and the high demand for ETFs can result in high return volatility in the market, which can ultimately be influenced by investor sentiment.
In recent years, ETFs have become increasingly popular in South Africa as financial vehicles (Kunjal et al., 2021). ETFs are one of the financial instruments with the strongest global growth rates, providing a combination of stock and mutual fund features (Miziołek et al., 2020). By definition, ETFs are collections of securities that, when purchased together, give investors instant diversification across a wide range of indices (Yiannaki, 2015). The ease of use and low cost of trading of ETFs may inherently appeal to individual investors who are more prone to follow trends, raising concerns about the effect of their popularity on the efficiency of the market as a whole (Chau et al., 2011). The diversity, market importance, and size of ETFs have all increased significantly and as a result, traders and investors are becoming more interested in using these investment vehicles (Yang & Chi, 2023). The significance of investor sentiment in financial markets has been widely documented (Sun et al., 2016). Research has shown that investor sentiment influences asset prices and thus influences market trends. High sentiment indicates poor future returns during sentiment contractions or periods of peak-to-trough investor sentiment (Lutz, 2016). Bathia and Bredin (2016) further stated that frequent shocks to the market from uninformed demand drive investor sentiment, whereas limits on arbitrage will discourage knowledgeable traders from trading.
An investor’s transaction may be influenced by their own sentiment, particularly when there is severe market uncertainty, and as a result, investor trading behaviour could change dramatically due to feedback trading, which will lead prices to fluctuate rapidly (Tseng & Lee, 2016). The optimism sentiment and stock returns nexus are not linear, and the fact that bullish and bearish markets behave differently may be the cause of this nonlinear relationship (Lee & Chen, 2020). Andleeb (2024) stated that depending on the varied reactions of market players and investors’ risk appetites, high optimism and extreme pessimism can easily move the market from bullish to bearish and from bearish to bullish situations. There is a decrease in the market spread and an increase in buy orders when investor sentiment is bullish (Trichilli et al., 2020). Implying that when sentiment is bearish, there is an increase in sell orders. This suggests that in times of optimism, investors typically have a more optimistic view of the market, which encourages more buying and raises demand for ETFs, which drives up prices. On the other hand, during pessimistic times, investors can become risk averse, which results in more selling activity and withdrawals from ETFs, and this could drive down the price of stock ETFs as selling pressure increases. Shen et al. (2017) stated that during high-sentiment times, there may be a lot of overpriced assets; however, during low-sentiment times, asset prices should be near to their fundamental value because arbitrageurs can expose underpricing, and pessimists are more likely to avoid markets because of obstacles to short sales (Shen et al., 2017).
Little research has been carried out on how investor sentiment affects ETF returns in the South African context. However, similar academic research has been explored in regard to investor sentiment in the South African context. For example, Rupande et al. (2019) examined investor sentiment and stock return volatility, Muguto et al. (2022) investigated the impact of investor sentiment on sectoral returns and volatility from the Johannesburg Stock Exchange, Dalika and Seetharam (2014) performed an analysis on investor sentiment in the South African market, and Muguto et al. (2019) examined investor sentiment and foreign financial flows in South Africa. Other studies looked into investor behaviour in the South African market; for example, Kunjal and Peerbhai (2021a, 2021b) examined investor overconfidence in the South African ETF market and investor herding during COVID-19 in the South African ETF market, and Charteris and Musadziruma (2017) examined feedback trading in stock index futures in South Africa. This article seeks to determine how investor sentiment plays a significant role in shaping market conditions and the performance of ETFs on the JSE, which also influence trading volumes, asset prices, and market trends. In recent academic research, the focus has changed from looking for entirely rational explanations for the behaviour of share prices to looking at the roles of psychological biases and the contribution of investor behaviour (Adamson, 2017).
A significant factor influencing global financial markets is investor sentiment, which is often characterised by the attitude or mood of market participants as a whole. Investor sentiment can be defined as the perception of risk and return that is not supported by reality (Wang et al., 2021). Corredor et al. (2015) and Baker and Wurgler (2006, 2007) characterised it as optimism (high sentiment) or pessimism (low sentiment) toward equities generally, yet they also associate it with an affinity for speculation. When investor mood is negative, the market can still increase during normal economic conditions; however, during recessions and moments of economic expansion, the markets reflect the prevailing sentiment (Adamson, 2017). During recessions, low-stimulation investors tend to sell their ETFs on the exchange, reducing their exposure, while high-stimulation investors increase their exposure to ETFs during economic expansions to benefit from the growth. Furthermore, investor behaviour during these periods of market instability may cast doubt on the ETF market’s stability, making ETFs less attractive and prompting investors to move away from them. Sentiment changes will result in more noise trading, more mispricing, and excess volatility if ignorant noise traders base their trading choices on sentiment, and risk-averse arbitrageurs face limitations to arbitrage (Da et al., 2015).
The primary objective of this article is to determine the effect of investor sentiment on JSE-listed ETF returns under changing market conditions. To facilitate the achievement of the primary objective and to answer the research question, the following secondary objectives have been formulated: (a) compare the effect investor sentiment has on JSE-listed ETF returns in a bull regime, (b) determine the effect of investor sentiment on JSE-listed ETF returns in a bear regime, and (c) compare the levels of bull and bear market conditions across JSE-listed ETFs.
The main contribution of the article lies in the understanding of how investor sentiment interacted with ETFs in times of fluctuating market sentiment under changing market conditions. As ETFs become more popular among investors because of their ease of use, affordability, and liquidity, this field of study becomes more important. It is important to understand how investor sentiment affects the volatility of ETFs since changes in sentiment can magnify market movements and increase ETF return volatility. As ETF products continue to offer diversification and more investors engage in the market, these insights are important for the management of risk in the ETF market. The study underlines the factors behind the heightened sensitivity of ETFs to sentiment-driven behaviours, which are usually more apparent during times of volatile markets. The immediate fluctuation in prices of ETFs can be caused by investor sentiment, which can cause significant inflows and outflows of investments during periods of increased uncertainty or abrupt market changes. It is evident from the review of the empirical literature that the majority of international and domestic studies focus on the risk and macroeconomic determinants of ETFs. Some studies focus on the linear relationship between the determinants of ETFs. However, few studies have looked into how investor sentiment affects ETF performance as an independent factor, especially in South Africa. Therefore, it is essential to comprehend these sentiment-driven fluctuations in order to forecast possible risks related to ETFs in different market situations. This insight could help investors and financial advisors better understand the possible risks in the ETF market, allowing for the development of future risk management and mitigation plans.
The paper consists of four sections: first is the review of the literature, followed by the research design and methodology. Then, after that, the results and discussion section; thereafter, the paper concludes with a summary, limitations, and recommendations of the research.
2. Literature Review
Investor sentiment is gaining a lot of attention, particularly in light of the excessive volatility that stock markets throughout the world are currently experiencing and the inability to reliably correlate fundamentals with changes in stock prices (Shiller, 2000; Dumas et al., 2009; Chau et al., 2016). Regulators are particularly interested in the role sentiment contributes to some of the manias, bubbles, and “black swan” type events that have threatened the financial system because of how quickly emotion can spread (Chau et al., 2016). The current market return and investor sentiment are highly associated, and the positive correlation between stock markets and sentiment is in favour of the idea that investor sentiment serves as a contrarian forecast of future market returns (Naseem et al., 2021). Prices of assets can fluctuate based on investor sentiment or tone, which may not be indicative of changes in the investing opportunity set or fundamentals (Chau et al., 2016). High sentiment can lead to greed in investors, and low sentiment can lead to fearful investors (Singhal, 2023). Investors are known to have uncertainty not only regarding fundamentals but also on the underlying traits and trading intentions of other market participants (Banerjee & Green, 2015). There are two types of market participants: irrational and rational investors; irrational investors make financial decisions based on sentiment and incomplete information.
Additionally, investors display different behaviours in bullish and bearish regimes; when optimism is dominant, investors typically exhibit bullish behaviour; conversely, when pessimism is dominant, investors typically exhibit bearish behaviour. When referring to all markets, bull and bear markets are typically understood to represent long periods of time during which prices have generally risen or fallen (Hanna, 2018). During bull markets, a negative shift in investor sentiment decreases equity returns, but during bear regimes, a positive shift in sentiment has the reverse effect (Wang et al., 2022). Kuhnen and Knutson (2011) observed that whereas negative sentiment states discourage investors from taking on riskier investments, positive sentiment states encourage them to do so. The way investors behave has a significant impact on the stock market and the overall market performance.
The different approaches to trading produce different kinds of bias toward securities pricing. Investors prefer to monitor and pay more attention to the information provided by preliminary positive news but steer away from subsequent information derived from unfavourable preceding news (Karlsson et al., 2009; Mbanga et al., 2019). News viewers often underreact to confidential information, and momentum traders choose to build investment portfolios based on an element of historical prices (Griffith et al., 2020). Tetlock (2007) stated that a return to fundamentals is anticipated when market prices experience downward pressure due to a high level of media pessimism. According to Kräussl and Mirgorodskaya (2017), news that contains at least one of our predefined positive or negative terms causes readers to think correspondingly positively or negatively and optimistically or pessimistically, which, in turn, influences how readers feel about the stock markets and the economy as a whole. This can suggest that good news on the ETF market can set off a feedback cycle in which rising prices draw in more investors, hence elevating sentiment and attracting new capital inflows, and vice versa. Investors’ trading activities are influenced by the fundamental information found in news stories pertaining to a corporation (Li et al., 2014).
ETFs make it easier for investors to invest in a market or index by allowing investors to trade widely diversified portfolios of assets in a single transaction (Kreis & Licht, 2018). ETFs are set up in a way that ensures that they trade close to their true Net Asset Value (NAV) by allowing large institutions and authorised participants (APs) to immediately redeem outstanding units and issue new ones (Kurian, 2017). ETFs have close differences between the NAV of the assets in their portfolio and the ETF share price defined by the stock exchange because the ETF sponsor appoints an AP to arbitrage between the ETF’s price and the value of the underlying portfolio (Ivanov, 2016). As the ETF price increases above the NAV, so does the intensity of creation activity; conversely, when the ETF price falls below the NAV, the intensity of redemption activity increases, and APs continue to capitalise on relative mispricing even during stressful times (Finnerty et al., 2024). An ETF with securities that are easy to sell or buy have a lower bid–ask spread and will have fewer transaction costs associated with its holdings, and an ETF with securities that are difficult to buy or sell can lead to greater bid–ask spreads (Lamothe & Seetohul, 2019). In response to the changes in NAV, investors may take strategic measures and wait for NAV to decrease or increase in order to purchase shares at a discounted price or to make a profit. Investors can take advantage of the useful trading information offered by the NAV to evaluate the stability of their portfolios. Due to market dynamics influencing the price of ETF shares, ETFs might occasionally deviate from their NAV, offering APs and investors the chance to profit from arbitrage opportunities at both market levels (Coletti, 2019). While investors do not participate in arbitrage similarly to APs, investors can profit or make a loss indirectly from price discrepancies depending on the investors’ risk tolerance, and irrational investors may affect the market.
The three theories that provide an insightful view of how financial markets operate and how investor sentiment is involved are the Efficient Market Hypothesis (EMH), Adaptive Market Hypothesis (AMH), and Behavioural Finance (BF). According to the efficient market theory, rational investors will optimise their portfolios in a way that encourages competition, which will lead to asset prices reaching a rational equilibrium (Su et al., 2020). Moreover, EMH views investor sentiment as noise that should not consistently impact pricing. AMH proposes far more intricate market dynamics, taking into account the fact that, depending on the circumstances, arbitrage possibilities can occasionally arise (Chu et al., 2019). The AMH states that times of turbulence or change may require investors to adjust their well-developed heuristics to reflect the new reality because both the investment environment and investor behaviour are subject to change (Hall et al., 2017). In contrast to conventional economic theory, behavioural finance theory can explain the irrationality and illogicality in behaviours; hence, the focus of the discussion switched from the efficient market model to the behavioural and psychological characteristics of market players (Naseer & Bin Tariq, 2015). Behavioural finance suggests that human behaviour is irrational when it comes to making decisions and that this behaviour influences choices about investments, portfolio construction, and when to buy and sell stocks (Parveen et al., 2020). Investor sentiment, furthermore, includes traits such as herding behaviour and cognitive biases such as anchoring, loss aversion, overconfidence, and representative bias.
When investor sentiment is high, the volatility of the ETF return increases, and when sentiment is low, the volatility of the ETF return falls (Yang & Chi, 2023). Yang and Chi’s (2023) primary findings indicate that the creation of conditional volatility in ETFs can be largely explained by investor sentiment. Chen et al. (2017) discovered that the ETF expense ratio and investor mood have a significant impact on ETF results. The substantial impact of sentiment on ETFs is shown by Chau et al. (2011), who found that the influence of sentiment on feedback trading differs across market regimes. Lutz (2016) indicated that there is an asymmetric relationship between sentiment and returns. Renault (2017) found that, after adjusting for historical market returns, the last half-hour S&P 500 index ETF return is predicted by the initial half-hour shift in investor sentiment. The outcome of Lee et al. (2021) is consistent with the conclusions of earlier studies that, in the absence of newly acquired information, public attention alone can drive ETF prices to high return levels. Tseng and Lee (2016) stated that information about the market has an impact on investors, which affects investor sentiment fluctuations and may have an additional impact on ETF liquidity. Kadiyala (2022) concluded that the demand generated by sentiment drives larger inflows during times of high sentiment, while demand from arbitrageurs is linked to ETF share redemptions. The results of Naeem et al. (2023) showed that the sentiment index revealed a positive correlation, indicating that investor sentiment and ETF volatility moved together. Baker and Wurgler (2007) and Lee and Chen (2020) found that market participants may find that investor sentiment is a significant tool for creating profitable trading strategies. Chung et al. (2012) and Huang et al. (2015) found that the overall stock market may be predicted accurately by investor sentiment. Huang et al. (2015) found that investor sentiment’s return predictability seemed to be driven by investors’ biased perceptions about future cash flows, and Chung et al. (2012) found that investor sentiment’s ability to anticipate outcomes varies within different regimes.
It is essential for practitioners to comprehend the rising importance of investor sentiment in the stock market because it reflects investors’ sentiment on a specific investment or the broader market, and the market quickly absorbs sentiment and influences investors’ risk aversion and portfolio decisions, often independently of fundamental metrics like cash flow projections or intrinsic value assessments (Ahmed, 2020). Even in the absence of news regarding the underlying fundamentals, practitioners should keep an eye on their portfolios for adjustments (Chau et al., 2016). A significant aspect of the capital market is heavily influenced by the sentiment of investors, which frequently causes stock price volatility and raises doubts about potential future returns on capital (PH & Rishad, 2020). Capital allocation decisions and the cost of capital may be affected by asset prices that do not fairly reflect underlying values; this could lead to an inefficient allocation of capital (Smales, 2017). It is important to understand how investor sentiment affects stock prices in order to protect the stock market and portfolios of investors, as this will also provide great insight to participants in the market and help them better develop efficient investment strategies to protect their returns. Andleeb (2024) stated that depending on the varied reactions of market players and investors’ risk appetite, high optimism and extreme pessimism can easily move the market from bullish to bearish and from bearish to bullish situations. This suggests that in times of optimism, investors typically have a more optimistic view of the market, which encourages more buying and raises demand for ETFs, which drives up prices. On the other hand, during pessimistic times, investors can become risk averse, which would result in more selling activity and withdrawals from ETFs, and this could drive down the price of stock ETFs as selling pressure increases. Understanding the influence that investor sentiment has can help portfolio managers become more attentive to shifts in mood since they have an impact on the performance of their portfolios.
3. Methodology
3.1. Sampling and Data Collection
A time series analysis was used for the converging period from October 2008 to December 2023. This sample period was selected to account for events that happened during the time frame, such as the 2008 global financial crisis, the 2010/2012 Eurozone debt crisis, the 2014 commodity price slump, the 2016/2017 political uncertainty in South Africa, and the 2020 COVID-19 pandemic. The chosen sample size was effective for analysis because it adequately satisfied all requirements for the statistical analysis used, such as the Markov regime-switching models. The secondary data were collected from the McGregor BFA database and comprised of monthly closing prices of 7 JSE ETFs and the investor sentiment index of Muguto et al. (2019). The exponential growth in popularity of ETFs over the last three decades has solidified ETFs as an essential component of many investors’ portfolios in South Africa. Thus, the study used domestic ETFs to capture the sentiment of South African investors; ETFs such as Satrix 40 ETF, Satrix Swix Top 40 ETF, Satrix FINI ETF, Satrix INDI ETF, Satrix Dividend Plus ETF, Satrix RAFI 40 ETF, and FNB Top 40 ETF were chosen. This solely aimed to examine the sentiment of local investors, the response of the South African market, and the effects of the regulatory environment on investor sentiment and the ETF market in the South African context. The monthly prices of the ETFs were transformed into monthly returns using the price return equation. Sentiments were measured using PCA, which is a statistical technique that uses an orthogonal transformation to transform correlated observations into linearly uncorrelated values (Karamizadeh et al., 2020). Furthermore, for a more complex understanding of how sentiment evolved and influenced market regimes, the Markov regime model was integrated with PCA. Bazzi et al. (2017) stated that the fundamental advantage of Markov switching models was that a time series’ conditional distribution is dependent upon an underlying latent state or regime.
3.2. Empirical Model
To determine a more thorough and reliable estimate of the overall sentiment, the Principal Component Analysis (PCA) was used to create a sentiment analysis index. In this model, all seven proxies were used, such as the share turnover, R/USD bid–ask spread, R/Pound bid–ask spread, R/EUR bid–ask spread, advance/decline ratio, term structure of interest rates, and equity issue ratio. The investor sentiment index of Muguto et al. (2019) was used. The investor sentiment index was structured by first standardising the proxies to ensure that all variables were on a standard scale, making comparisons easier. Then, to ensure that the remaining component was solely behavioural and not a contributor to macroeconomic risk factors, the proxies were first orthogonalised against macroeconomic variables (Muguto et al., 2019). To some degree, the sentiment proxies are influenced by economic fundamentals, and to partially eliminate these effects, the proxies were regressed using a collection of macroeconomic variables (Baker & Wurgler, 2007), and the proxies were orthogonalised against macroeconomic variables such as inflation, the short-term interest rate, the long-term interest rate, and the GDP. Baker and Wurgler (2006) suggested determining the first principal component and its first lag stage of the index. The Virmax rotation was used to determine the first lagged index, which then compared the correlation of the two indexes and chose the highest correlation variables, and it finally ran the first principal component on the proxies on the current and one-period lagged values. The model is as follows:
where θi represented the factor loadings on the first principal components of the proxies lagged and contemporaneous, and i represented a specific period. Equity was the equity issue ratio, AdvDec was the Advance/Decline ratio, BidAskD, BidAskE, and BidAskP were the bid–ask spreads between the ZAR and the USD, EUR, and GBP, and TSIR was the term structure of interest rates.
The study used the Markov regime-switching model to determine the effect of investor sentiment on JSE-listed ETFs under changing market conditions, as the model captures the market condition of the JSE in different states. A first-order Markov model was used, and it is the current probability that is influenced by the next period, so there is only one period of influence. Kunjal et al. (2021, 2024) followed a first-order Markov model when looking at ETFs, and this was sufficient for the use of the first-order model in the study. The ETF returns () were predicated on a process that was controlled by an unobservable state variable . The occurrence of a regime was divided into N states in period t when = N, where N denotes the number of regimes. The Markov regime-switching model of conditional mean permits each regime with an alternate regression model and is specified as follows:
where is the state-dependent mean, is the state-dependent coefficient and is given by the change in the investor sentiment index of Muguto et al. (2019), and is the state-dependent variance with given by 1 = bull market regime and 2 = bear market regime.
The transition probability matrix indicates that each regime is assumed to follow a first-order Markov process (Moodley, 2024). Transitions between various states (regimes) occur probabilistically in a Markov regime-switching model, and each transition has a corresponding probability. The estimation of the transition probability matrix involves two methods: the Markov Chain Monte Carlo (MCMC) and time-varying transition probability methods. The former involves a Bayesian estimation method that makes use of samples from a joint distribution of the parameters and states, which involves using the Gibbs sampler tool as contained in EViews version 13 statistical software. However, the former is also automatically estimated by EViews, but such a technique ensures that the transition probabilities vary over time. The difference between both methods is isolated to the transition probabilities; the former assumes constant transition probabilities, whereas the latter assumes time-varying probabilities. Given the objective of this study, the former was the most suited method for estimating the transition probabilities and is given by
where ij was the probability of transitioning from State i at time t − 1 to regime j in a specific period (t), where the probability is constant for all periods so that The matrix for a two-regime mode is
where P11 is the probability of remaining in the bull market, P12 is the probability of transitioning from a bull to a bear market, P21 is the probability of transitioning from a bear to a bull market, and P22 is the probability of remaining in the bear market.
4. Empirical Results and Discussion
4.1. Graphical Representation
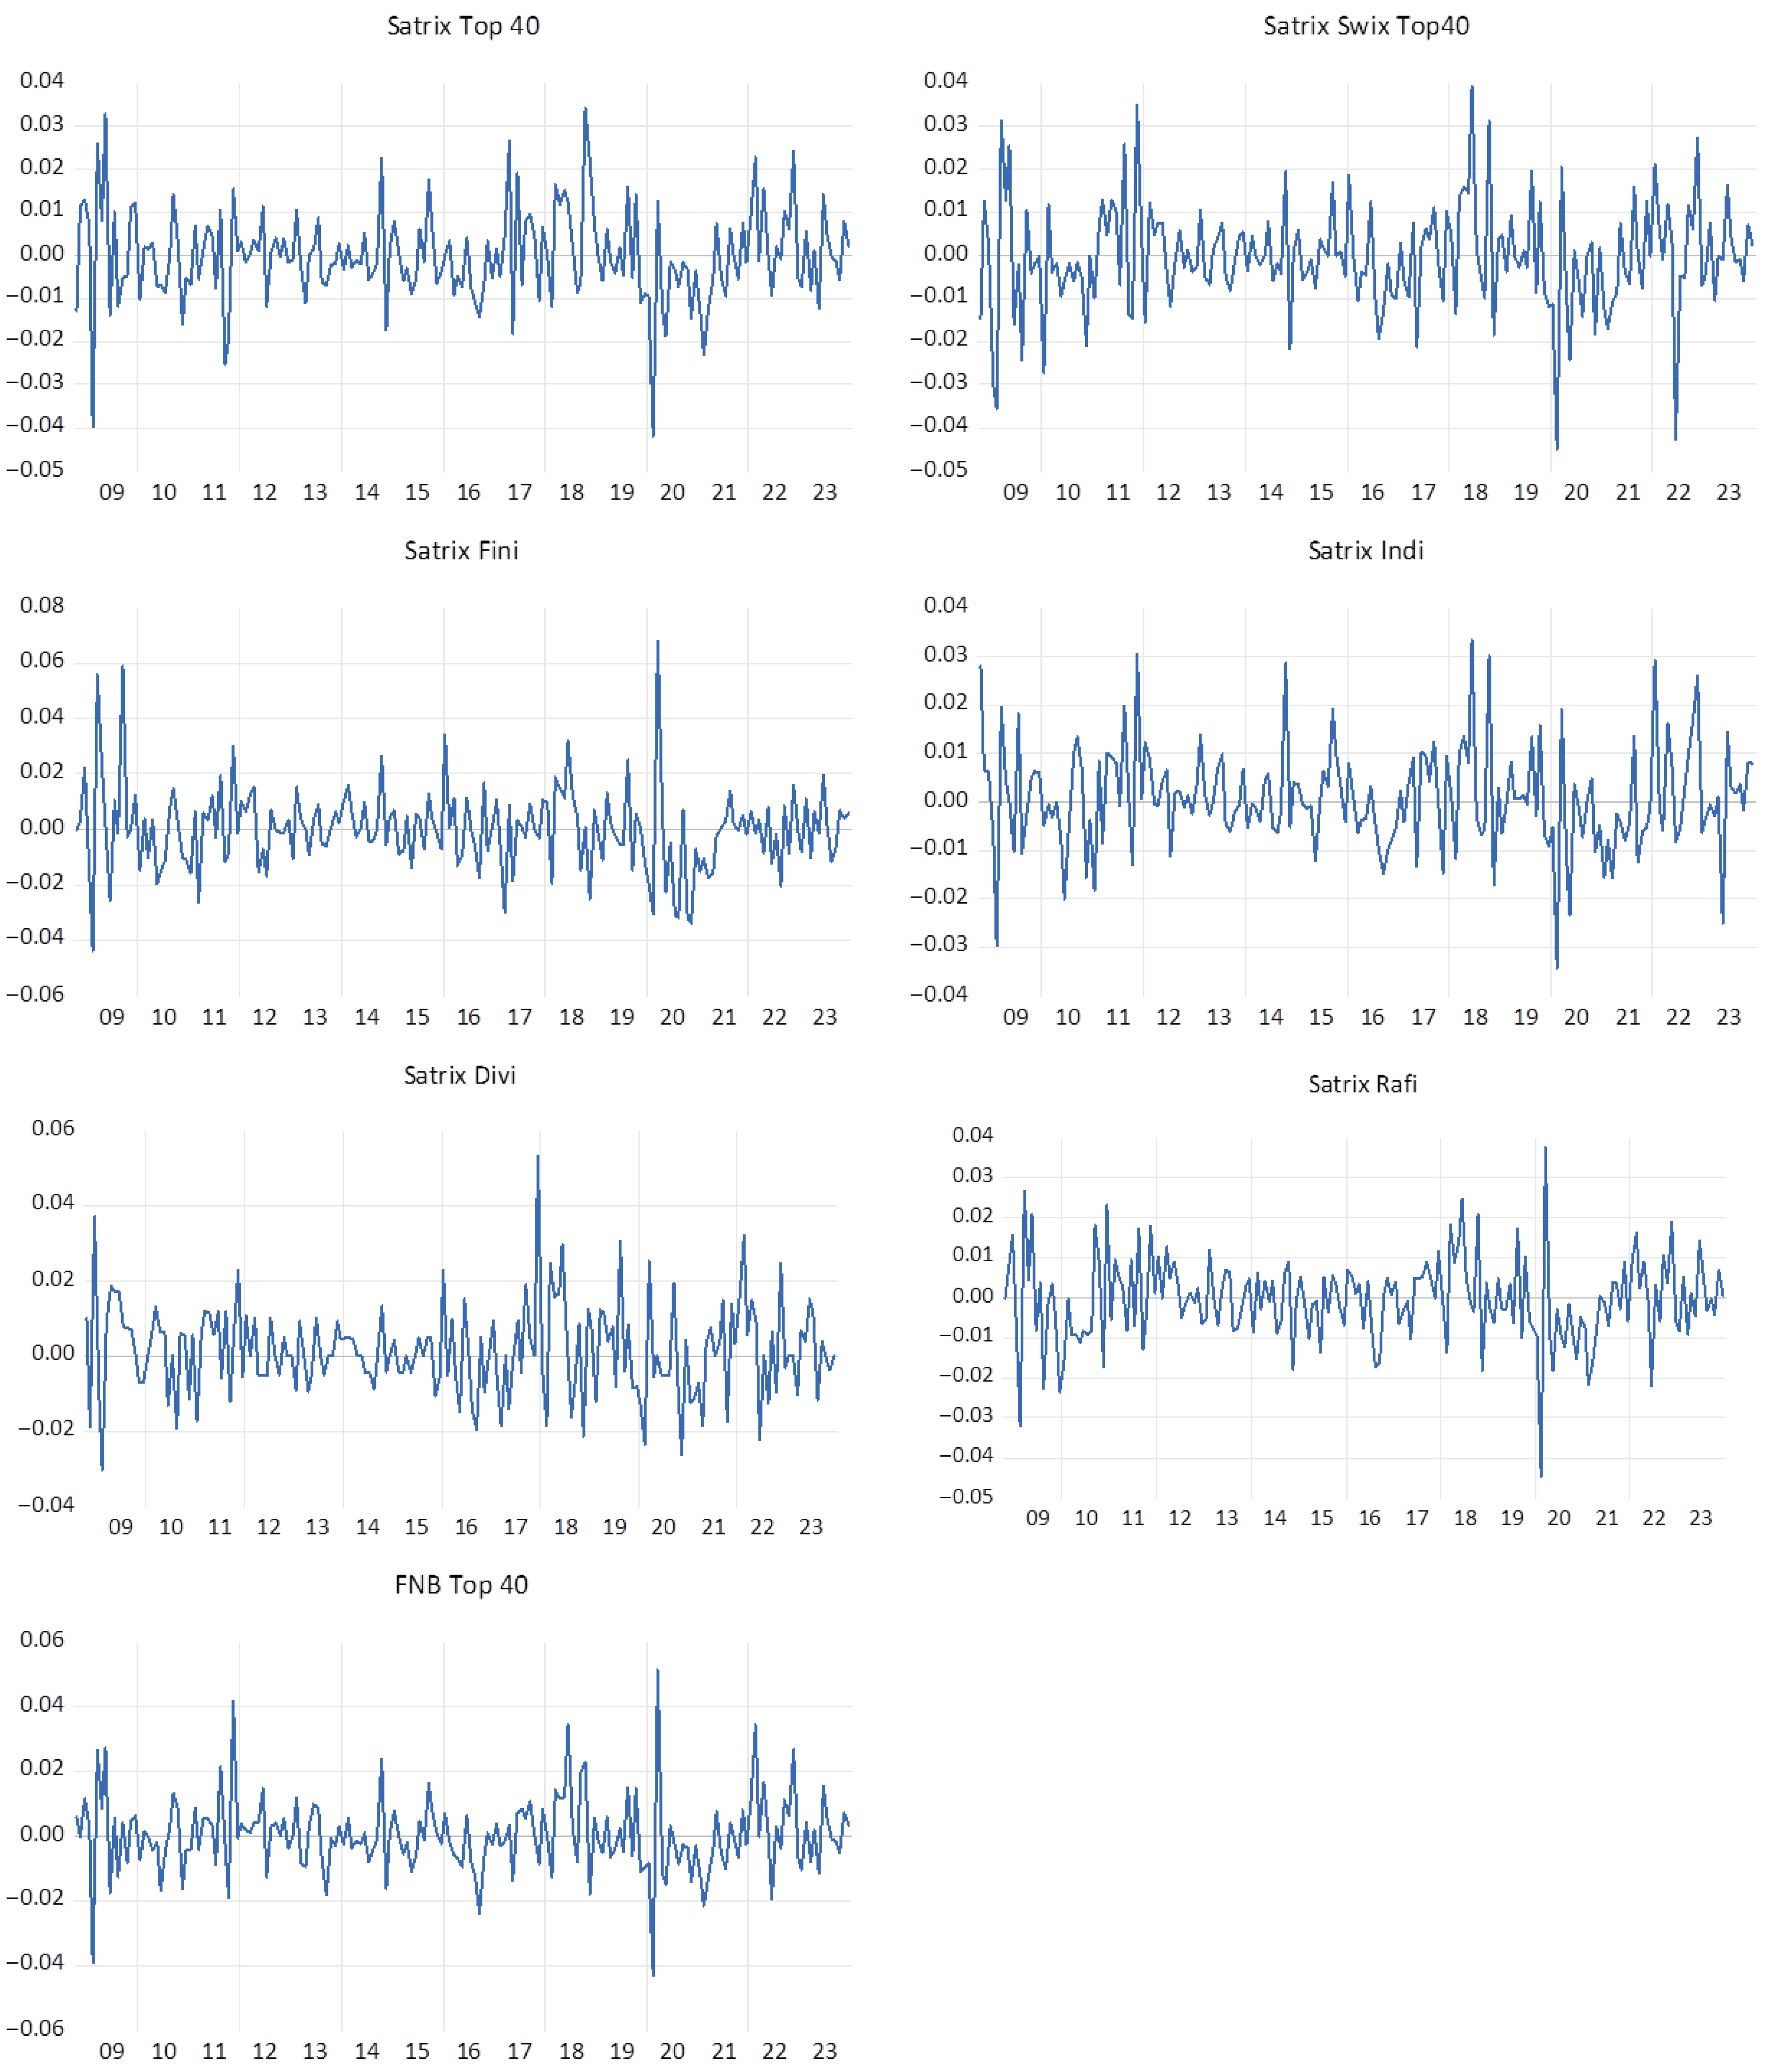
Figure 1 below provides the graphical representation of the ETF returns. It can be visualised that the ETF returns contain non-constant variance over time and tend to follow an autoregressive pattern, which illustrates volatility clustering. Moreover, the plots demonstrate that specific periods appear riskier than others, as seen by the high volatility of returns in those periods. These periods consist of the 2007/2008 global financial crises and the COVID-19 pandemic. Despite evidence of volatility clustering, the graphical plots confirm that the ETF returns are stationary, as depicted by the constant means for the sample period. It is further evident that the returns associated with all ETFs exhibit peaks and troughs, suggesting that the returns tend to vary over time. Consequently, the returns are influenced by market movements such that periods of bullish trends followed by bearish trends exist. This implies that market conditions dictate ETF returns over the sample period and should be considered as driving forces for ETF returns.
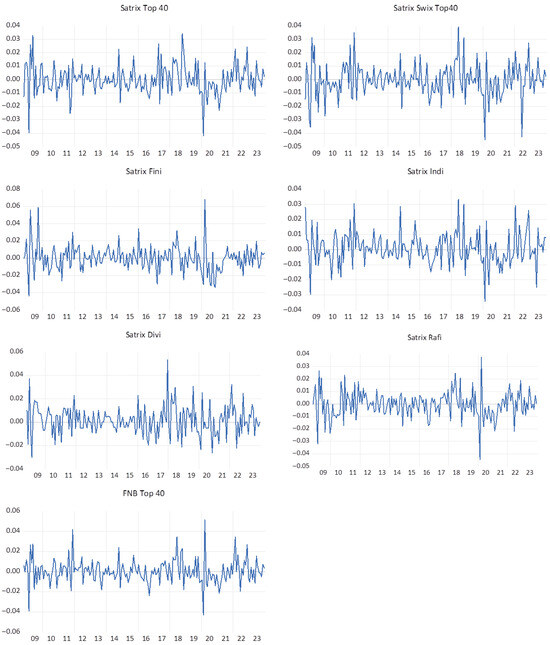
Figure 1.
ETF return plot. Source: Author’s own estimation.
4.2. Descriptive Statistics
Table 1 below presents the descriptive statistic results of investor sentiment and exchange-traded fund returns.

Table 1.
Results of descriptive statistics of investor sentiment and ETFs.
Table 1 above presents the descriptive statistics of the ETFs. The mean of the Satrix Top 40, Satrix Swix Top 40, and Satrix Rafi was negative, which indicates that, on average, the overall performance of the ETFs was negative. The Satrix INDI and Satrix Divi ETFs had the highest average performance, and the Satrix Top 40 had the lowest average performance. The Satrix Swix Top 40, Satrix FINI, Satrix Rafi, FNB Top 40, and the Satrix Top 40 ETFs had the highest minimum values, and the Satrix INDI and Satrix Divi had the lowest minimum values. The Satrix FINI, Satrix Divi, and the FNB Top 40 had the highest maximum values, whereas the Satrix Swix Top 40, Satrix Rafi, Satrix Top 40, and Satrix INDI had the lowest maximum values. The Satrix Top 40, Satrix Swix Top 40, and the Satrix Rafi ETFs were negatively skewed. The Satrix FINI, Satrix INDI, Satrix Divi, and the FNB Top 40 were positively skewed. The skewness indicates that the returns were positively skewed, showing that the returns were more positive than negative, and this suggests that Satrix FINI, Satrix INDI, Satrix Divi, and the FNB Top 40 had more positive return distributions. All of the ETFs had kurtosis values greater than three, which implies that the returns of the ETFs followed a leptokurtic distribution. The mean of investor sentiment was 0.031, which implies that, on average, investor sentiment was more optimistic than pessimistic, indicating an overall positive sentiment. The maximum and minimum values were given as 2.522 and −1.733, respectively, and the large difference between the values suggests that market sentiment drastically fluctuated over time. The maximum value of 2.522 suggests that the market displayed very high levels of optimism, while the minimum value of −1.733 reflects the times when the market exhibited levels of pessimism. The kurtosis was greater than three, and this suggests that investor sentiment followed a leptokurtic distribution.
4.3. Unit Root and Stationarity Tests
From Table 2, the ADF and KPSS test statistics for all seven ETFs show that the ETFs are stationary. The ADF test statistics for all seven ETFs are more negative than the critical values and, therefore, reject the null hypothesis (H03) and conclude stationarity. Similar to the KPSS test, the test statistics of all seven ETFs are lower than the critical value and, therefore, do not reject the null hypothesis (H04) and conclude stationarity. In addition to the ADF and KPSS unit root tests, the ADF structural break test was also utilised to account for the structural breaks in the series. The ADF structural test for all seven ETFs showed that the ETFs are stationary at unknown structural breakpoints. The test statistics for the seven ETFs were more negative than the critical values; therefore, the null hypothesis (H05) was rejected, and the conclusion was that no unit root was present (stationarity). The p-values of the ADF, KPSS, and ADF structural break test values are below the 5% level of significance and, therefore, are statistically significant.
Table 2.
Results for unit root test for the JSE ETFs returns.
From Table 2, the ADF and KPSS unit root tests show that investor sentiment is stationary. The test statistic for the ADF test is more negative than the critical value; therefore, the null hypothesis (H03) is rejected, and stationarity is concluded. Similarly, the test statistic of the KPSS test is lower than all of the critical values; therefore, do not reject the null hypothesis (H04) and conclude that there is stationarity. In addition to the ADF and KPSS tests, the ADF structural test was applied to account for structural breaks. The structural break test also shows that investor sentiment is stationary, as the test statistic for the structural break is more negative than the critical value. Therefore, reject the null hypothesis (H05) and conclude that there is no unit root and, thus, it is stationary. The probabilities of the ADF tests are below 0.05, which shows that the values are statistically significant.
4.4. Correlation Analysis Results
Table 3 provides the unconditional correlation associated with investor sentiment and ETF returns. It is evident that investor sentiment has a positive significant effect on the Satrix Top 40 returns, Satrix Swix Top 40 returns, Satrix Indi returns, Satrix Rafi returns, and the FNB-Top 40 returns. This implies that investor sentiment has a linear effect on ETF returns. However, these findings are isolated to the linear effect with no pronunciation on the nonlinear effect. Consequently, it is essential that the study proceed to test the nonlinear effect between investor sentiment and ETF returns, as the BDS test advocates for the nonlinear relationship between the dependent and explanatory variables.
Table 3.
Correlation analysis of the relationship between investor sentiment and JSE ETF returns.
4.5. Empirical Findings Results
4.5.1. Principal Component Analysis
In Table 4, the PCA revealed that the first principal component (PC1) explained 46.91% of the total variance in the data overall (bold). As PC1 accounted for 46.91% of the variability in the dataset, it was the dominant factor, and the other PCs explained less of the total variation. The study only focused on PC1 as it contributed significantly to the overall variance and captured the most significant variability of the data. The cumulative proportion of PC3 and PC4, which showed 77.61% and 88.75%, respectively, combined contributed significantly more variance, but each component individually explained less variance compared to PC1. These results were similar to those of Skender et al. (2022), Ghodbane et al. (2022), Kumar et al. (2019), Bienkowska et al. (2020), and Khalili and Pour-Aboughadareh (2016), as their PC1 ranged around the one similar to this study. However, the first principal component of the first stage index with one period of lagged proxies was 47.13% (bold), and this was higher than the 46.91% of the first stage index with current proxies. The first stage index with one period of lagged proxies was used as it generated a higher variance. All of the variables correlated with the first principal component, as shown in PC1 of the lagged proxies, Turnover (3.299), Equity (1.161), Advanced/Decline (0.988), R/USD bid–ask (0.779), R/GBP bid–ask (0.707), R/EUR bid–ask (0.044), and term structure of interest rates (0.022). Moreover, the first principal component, with its one-period of lagged proxies, generated the index with the highest variance; on this basis, the sentiment index was defined as
Table 4.
Results of the principal component analysis.
4.5.2. Markov Regime-Switching Model
In Table 5, the Markov regime-switching model results showed that investor sentiment significantly affected the Satrix FINI, Satrix INDI, and Satrix Divi in the bull market in a positive manner and significantly affected the Satrix Top 40, Satrix Rafi, and the FNB Top 40 ETFs in a negative manner in the bull market. Only the Satrix Swix Top 40 ETF was insignificantly affected by investor sentiment and in a negative manner. Subsequently, investor sentiment significantly affected the Satrix Top 40, Satrix Swix Top 40, Satrix FINI, Satrix INDI, and the FNB Top 40 in a positive manner and only affected the Satrix Divi in a negative manner. Investor sentiment only insignificantly affected the Satrix Rafi and in a positive manner.
Table 5.
JSE ETF transition probabilities and constant duration.
The Satrix FINI ETF returns remained for the longest in the bull market regime (63 months) compared to other ETF returns. This was subsequently followed by the Satrix Rafi ETF (29 months), FNB Top 40 (11 months), Satrix Top 40 (7 months), Satrix Divi (6 months), Satrix INDI (3 months), and Satrix Swix Top 40 (3 months). In contrast, the study found that Satrix Rafi (20 months) remained for the longest in the bear market regime. This was subsequently followed by Satrix FINI (12 months), Satrix INDI (5 months), Satrix Top 40 (4 months), FNB Top 40 (3 months), and Satrix Divi (1 month). The findings of the ETF returns that remained for the longest in the bull and bear regimes, the Satrix FINI and Satrix Rafi ETFs, respectively, were in line with their transition probabilities, as both moved from bull to bear market conditions (and vice versa) faster than the other ETF returns.
4.6. Discussion of the Findings
To compare the degrees of bull and bear market conditions among the JSE ETF returns, the transition probabilities and constant expected duration were determined in this section. The research concluded that investor sentiment does affect the returns of JSE-listed ETFs under changing market conditions. Investor sentiment had significant effects on all ETFs under both bull and bear market conditions, except for the Satrix Swix Top 40 and Satrix Rafi, respectively. The positive and significant effects indicated that as investor sentiment increased, suggesting market optimism, the ETF returns also increased. Consequently, investor sentiment had a negative and significant effect on the ETFs; this suggested that, as investor sentiment decreased, implying market pessimism, ETF returns also decreased. The Satrix FINI, Satrix INDI, and Satrix Divi ETFs were positively affected in the bull market, and the Satrix Top 40, Satrix Swix Top 40, Satrix FINI, Satrix INDI, and the FNB Top 40 ETFs were positively affected in the bear market. Subsequently, the Satrix Top 40, Satrix Rafi, and the FNB Top 40 ETFs were negatively affected in the bull market, and only the Satrix Divi ETF was negatively affected in the bear market. As mentioned above, the Satrix Swix Top 40 and the Satrix Rafi were insignificantly affected in the bull and bear markets, respectively; this suggests that the observed finding could be due to other factors and not really investor sentiment.
It was observed in the study that the bull regime prevailed more than the bear regime among all the ETFs, with the exception of the Satrix INDI ETF. The Satrix INDI ETF tracks industrial companies in sectors such as health care and consumer staples (often classified as defensive industries and companies) (Satrix (Own the Market), 2024), and defensive industries often perform better during recessions than cyclical ones because they are less vulnerable to shifts in economic cycles (Jansen van Rensburg & Vuuren, 2020); and this could be one of the reasons that the ETF prevailed in the bear market. Studies performed by Kunjal et al. (2021) and Kanojia and Arora (2017) found similar findings on the bull regime remaining longer than bear markets. Kunjal et al. (2021) stated how ETFs typically remain in bullish regimes for longer than in bearish regimes. Kanojia and Arora (2017) stated that in bull markets, investors receive larger and more significant returns based on the average cumulative return. Wong and Shum (2010) found that when markets are bullish, ETF returns are higher than when they are bearish. When the index rises during a bull market, investors are more likely to invest since they believe in the market’s momentum (Xu et al., 2022).
Equation (2) was estimated seven times for each JSE-listed ETF return and was meant to provide the effect investor sentiment has on JSE-listed ETF returns under the bull and bear market conditions. It was observed that the effects of investor sentiment on the returns of the JSE ETFs varied in both regimes. This observation was in line with studies performed by Ma et al. (2018), who found that bear markets have a greater and more significant impact on ETFs than bull markets on market sentiment; and Kunjal et al. (2021) suggested, from their findings, that ETF investors are exposed to a higher level of risk during bear market situations because ETF fund managers find it challenging to duplicate the performance of the underlying index. Wong and Shum (2010) concluded that, in general, in bullish markets, ETF returns, Jensen’s alpha, and the risk premium are larger than in bearish markets.
The findings of the study were in line with the Behavioural Finance Hypothesis, which stipulates that the market is not rational and that different investors behave differently in the market. Psychological factors such as overconfidence, risk aversion, or herding behaviour might have played a role. The notion that investors are prone to a variety of behavioural biases means that they do not always behave rationally when making investment decisions, which takes the place of the assumption that investors always act rationally (Rupande et al., 2019). The results of this study contradicted the EMH theory, as different investor behaviours were observed. According to the notion of market efficiency, the market is rational and sets prices that are correct (Yalçın, 2010). Since some market factors can have a substantial psychological effect on market participants and how they interpret information, which can influence how they make decisions, these variables may have an effect on how predictable stock returns are (Urquhart & McGroarty, 2016). The Behavioural Finance Hypothesis stipulates how investor sentiment as a nonfundamental component can potentially affect future returns (Naeem et al., 2021). Behavioural finance suggests that human behaviour is irrational when it comes to making decisions and that this behaviour influences choices about investments, portfolio construction, and when to buy and sell stocks (Parveen et al., 2020). The findings showed different effects that investor sentiment had on the returns of ETFs, and thus, it was found in this study that investor sentiment influences returns in the market.
Additionally, the findings of the study were also in line with the Adaptive Market Hypothesis (AMH). According to the AMH, the market is comprised of an ever-changing set of trading techniques; hence, the overall level of efficiency also changes (Meng & Li, 2021). AMH promotes market efficiency and a dynamic approach to investment, potentially benefiting investors in rapidly changing financial markets (Ma, 2013). Sing and Singh (2024) stated that adaptability is determined by evolutionary concepts, human creativity, and psychological responses, leading to a more effective solution ahead of open-ended approaches. This supports the findings of the study, as investors had different responses in different market conditions. Additionally, the evolution of technology and the influence of social media play a role in how humans can approach and respond to a situation, hence both the negative and positive findings of the investor sentiment in the results across the different ETFs. Limited local studies were available to compare the findings. However, the findings were compared to other international studies. Second, ETFs are available across a wide range of sectors; however, the study was limited to selecting a few of these ETFs due to data availability constraints under the chosen sample period of the study. However, the chosen ETFs yielded a significant sample size that showed the findings required to reach a valid conclusion and accurately reflect important market segments and investment trends.
5. Conclusions
This study proposed to examine the effect of investor sentiment on JSE-listed ETFs under changing market conditions. The exponential growth in popularity and assets under management over the last three decades has solidified ETFs as an integral component of many investors’ portfolios; however, a significant factor that influences global financial markets is investor sentiment. When market conditions change, investors with low and high sentiments respond differently, and this leads to a contradiction in the market, leading to unpredictable markets and increased risk. Understanding the effect of investor sentiment on JSE-listed ETFs is deemed beneficial to investors, financial advisors, and market participants.
The research found that investor sentiment does affect the returns of JSE-listed ETFs under changing market conditions. Investor sentiment had significant effects on all ETFs under both bull and bear market conditions, except for the Satrix Swix Top 40 and Satrix Rafi, respectively. The findings of the study were in line with the Behavioural Finance Hypothesis and the Adaptive Market Hypothesis, which stipulates that the market is not rational and different investors behave differently in the market, and contradicted the EMH theory, as different behaviours of investors were observed in the results.
The main contribution of the study lay in the understanding of how investor sentiment interacted with ETFs in times of fluctuating market sentiment under changing market conditions. It is important to understand how investor sentiment affects the volatility of ETFs since changes in sentiment can magnify market movements and increase ETF return volatility. This study introduced the aspect of investor sentiment, which, as far as the author is aware, has never been performed in South Africa. However, this study introduced the aspect of changing market conditions, which has been supported by BF and is yet to be performed in South Africa. This study bridged a gap in the literature by highlighting the role sentiment plays in ETF volatility, providing a more comprehensive understanding of how sentiment interacts with market conditions to affect ETF pricing. This insight could help investors and financial advisors better understand the possible risks in the ETF market, allowing for the development of future risk management and mitigation plans.
This is essential for investors, financial advisors, and companies to be able to mitigate the risks that investor sentiment has on the ETF market. Investors will benefit from knowing how investor sentiment impacts ETF returns as this will enable investors to be more prepared and better able to predict potential outcomes during volatile market times. When the markets change, investors can quickly predict whether sentiment will be positive or negative, trade accordingly, and successfully diversify their holdings. Understanding how investor sentiment impacts ETF returns might also help financial advisors. Using this information, financial advisors can improve their risk management strategies to help clients’ ETF portfolios optimise returns during different periods of market volatility (bull or bear) and develop measures to protect investors’ portfolios from market fluctuations, thus reducing risks to their portfolios. Companies can benefit as well because if companies that hold ETF stocks are able to predict the direction of investor sentiment in the market, they are able to plan financial strategies, communicate, improve long-term strategy, and follow risk management guidelines efficiently and promptly. Early and active communication can assist a lot in addressing criticism in the company, foster long-term trust, and improve the company’s reputation, all of which will improve relationships with investors.
As mentioned earlier, no other research study has examined how investor sentiment affects ETF returns in the South African context. This study has added a significant component to the behavioural finance literature in South Africa. By examining the effect of investor sentiment on ETF performance, this study significantly adds to the knowledge of how behavioural factors affect investments in the South African market. The limitations of this study, as well as the introduction and background, open the door for further improvements of future research, and future studies can expand the dataset to include both international and domestic ETFs. Given that this research used indirect measures and market-based metrics, future studies can incorporate different investor sentiment indexes or different methods to calculate investor sentiment, such as direct approaches like survey measures or a more modern strategy like gathering information from online sources. However, this did not affect the findings of the study, as the chosen metric was sufficient to reach a valid conclusion.
Author Contributions
Conceptualization, F.M.; methodology, P.A.S. and F.M; software, F.M.; validation, S.F.-S.; formal analysis, P.A.S.; investigation, P.A.S.; resources, P.A.S.; data curation, P.A.S.; writing—original draft preparation, P.A.S.; writing—review and editing, P.A.S., S.F.-S. and F.M.; visualization, P.A.S.; supervision, S.F.-S. and F.M.; project administration, S.F.-S. All authors have read and agreed to the published version of the manuscript.
Funding
This research received no external funding.
Informed Consent Statement
Not applicable.
Data Availability Statement
Data is available from corresponding author on request.
Conflicts of Interest
The authors confirm no conflict of interest.
References
- Adamson, M. (2017). Investor sentiment as a market-timing tool [Ph.D. thesis, University of Pretoria]. [Google Scholar]
- Ahmed, B. (2020). Understanding the impact of investor sentiment on the price formation process: A review of the conduct of American stock markets. The Journal of Economic Asymmetries, 22, 00172. [Google Scholar] [CrossRef]
- Andleeb, R. (2024). Investor sentiment dynamics and returns in emerging equity markets [Ph.D. thesis, Capital University]. [Google Scholar]
- Baker, M., & Wurgler, J. (2006). Investor sentiment and the cross-section of stock returns. Journal of Finance, 61(4), 1645–1680. [Google Scholar] [CrossRef]
- Baker, M., & Wurgler, J. (2007). Investor sentiment in the stock market. Journal of Economic Perspectives, 21(2), 129–151. [Google Scholar] [CrossRef]
- Banerjee, S., & Green, B. (2015). Signal or noise? Uncertainty and learning about whether other traders are informed. Journal of Financial Economics, 117(2), 398–423. [Google Scholar] [CrossRef]
- Bathia, D., & Bredin, D. (2016). An examination of investor sentiment effect on G7 stock market returns. In Contemporary issues in financial institutions and markets (pp. 99–128). Routledge. [Google Scholar]
- Bazzi, M., Blasques, F., Koopman, S. J., & Lucas, A. (2017). Time-varying transition probabilities for Markov regime switching models. Journal of Time Series Analysis, 38(3), 458–478. [Google Scholar] [CrossRef]
- Ben-David, I., Franzoni, F., & Moussawi, R. (2017). Exchange-traded funds. Annual Review of Financial Economics, 9, 169–189. [Google Scholar] [CrossRef]
- Ben-David, I., Franzoni, F., & Moussawi, R. (2018). Do ETFs increase volatility? The Journal of Finance, 73(6), 2471–2535. [Google Scholar] [CrossRef]
- Bienkowska, T., Suchowilska, E., & Wiwart, M. (2020). Triticum polonicum L. as promising source material for breeding new wheat cultivars. Journal of Elementology, 25(1), 238–248. [Google Scholar]
- Charteris, A., & Musadziruma, A. (2017). Feedback trading in stock index futures: Evidence from South Africa. Research in International Business and Finance, 42, 1289–1297. [Google Scholar] [CrossRef]
- Chau, F., Deesomsak, R., & Koutmos, D. (2016). Does investor sentiment really matter? International Review of Financial Analysis, 48, 221–232. [Google Scholar] [CrossRef]
- Chau, F., Deesomsak, R., & Lau, M. C. (2011). Investor sentiment and feedback trading: Evidence from the exchange-traded fund markets. International Review of Financial Analysis, 20(5), 292–305. [Google Scholar] [CrossRef]
- Chen, M. P., Lee, C. C., & Hsu, Y. C. (2017). Investor sentiment and country exchange traded funds: Does economic freedom matter? The North American Journal of Economics and Finance, 42, 285–299. [Google Scholar] [CrossRef]
- Chu, J., Zhang, Y., & Chan, S. (2019). The adaptive market hypothesis in the high frequency cryptocurrency market. International Review of Financial Analysis, 64, 221–231. [Google Scholar] [CrossRef]
- Chung, S. L., Hung, C. H., & Yeh, C. Y. (2012). When does investor sentiment predict stock returns? Journal of Empirical Finance, 19(2), 217–240. [Google Scholar] [CrossRef]
- Coletti, E. (2019). ETFs: Investigation on the possible threats to financial stability [Master’s thesis, Ca’Foscari Univeristy of Venice]. [Google Scholar]
- Corredor, P., Ferrer, E., & Santamaria, R. (2015). The impact of investor sentiment on stock returns in emerging markets: The case of central European markets. Eastern European Economics, 53(4), 328–355. [Google Scholar] [CrossRef]
- Da, Z., Engelberg, J., & Gao, P. (2015). The sum of all FEARS investor sentiment and asset prices. The Review of Financial Studies, 28(1), 1–32. [Google Scholar] [CrossRef]
- Dalika, N. K., & Seetharam, Y. (2014). Sentiment and returns: Analysis of investor sentiment in the south African market [Ph.D. thesis, University of the Witwatersrand]. [Google Scholar]
- Dumas, B., Kurshev, A., & Uppal, R. (2009). Equilibrium portfolio strategies in the presence of sentiment risk and excess volatility. Journal of Finance, 64, 579–629. [Google Scholar] [CrossRef]
- Finnerty, J. D., Reisel, N., & Zhong, X. (2024). ETFs, creation and redemption processes, and bond liquidity. Journal of Financial and Quantitative Analysis, 1–61. [Google Scholar] [CrossRef]
- Ghodbane, M., Benaabidate, L., Boudoukha, A., Gaagai, A., Adjissi, O., Chaib, W., & Aouissi, H. A. (2022). Analysis of groundwater quality in the lower Soummam Valley, North-East of Algeria. Journal of Water and Land Development, 54(VII–IX), 1–12. [Google Scholar] [CrossRef]
- Griffith, J., Najand, M., & Shen, J. (2020). Emotions in the stock market. Journal of Behavioral Finance, 21(1), 42–56. [Google Scholar] [CrossRef]
- Hall, S., Foxon, T. J., & Bolton, R. (2017). Investing in low-carbon transitions: Energy finance as an adaptive market. Climate Policy, 17(3), 280–298. [Google Scholar] [CrossRef]
- Hanna, A. J. (2018). A top-down approach to identifying bull and bear market states. International Review of Financial Analysis, 55, 93–110. [Google Scholar] [CrossRef]
- Huang, D., Jiang, F., Tu, J., & Zhou, G. (2015). Investor sentiment aligned: A powerful predictor of stock returns. The Review of Financial Studies, 28(3), 791–837. [Google Scholar] [CrossRef]
- Ivanov, S. I. (2016). Analysis of ETF bid-ask spread components. The Quarterly Review of Economics and Finance, 61, 249–259. [Google Scholar] [CrossRef]
- Jansen van Rensburg, J., & Vuuren, G. (2020). Evaluating investment decisions based on the business cycle: A South African sector approach. Cogent Economics & Finance, 8, 1852729. [Google Scholar]
- Kadiyala, P. (2022). Response of ETF flows and long-run returns to investor sentiment. Financial Markets and Portfolio Management, 36(4), 489–531. [Google Scholar] [CrossRef]
- Kanojia, S., & Arora, N. (2017). Investments, market timing and portfolio performance across Indian bull and bear markets. Asia-Pacific Journal of Management Research and Innovation, 13(3–4), 98–109. [Google Scholar] [CrossRef]
- Karamizadeh, S., Abdullah, S. M., Manaf, A. A., Zamani, M., & Hooman, A. (2020). An overview of principal component analysis. Journal of Signal and Information Processing, 4, 173–175. [Google Scholar] [CrossRef]
- Karlsson, N., Loewenstein, G., & Seppi, D. (2009). The ostrich effect: Selective attention to information. Journal of Risk and uncertainty, 38, 95–115. [Google Scholar] [CrossRef]
- Khalili, M., & Pour-Aboughadareh, A. (2016). Parametric and non-parametric measures for evaluating yield stability and adaptability in barley doubled haploid lines. Journal of Agricultural Science and Technology, 18, 789–803. [Google Scholar]
- Kräussl, R., & Mirgorodskaya, E. (2017). Media, sentiment and market performance in the long run. The European Journal of Finance, 23(11), 1059–1082. [Google Scholar] [CrossRef]
- Kreis, Y., & Licht, J. W. (2018). Trading on ETF mispricings. Managerial Finance, 44(3), 357–373. [Google Scholar] [CrossRef]
- Kuhnen, C. M., & Knutson, B. (2011). The influence of affect on beliefs, preferences, and financial decisions. Journal of Financial and Quantitative Analysis, 46(3), 605–626. [Google Scholar] [CrossRef]
- Kumar, V., Sharma, A., Kohli, S. K., Bali, S., Sharma, M., Kumar, R., Bhardwaj, R., & Thukral, A. K. (2019). Differential distribution of polyphenols in plants using multivariate techniques. Biotechnology Research and Innovation, 3(1), 1–21. [Google Scholar] [CrossRef]
- Kunjal, D., & Peerbhai, F. (2021a). Investor herding during COVID-19: Evidence from the South African exchange traded fund market. African Review of Economics and Finance, 13(2), 168–185. [Google Scholar]
- Kunjal, D., & Peerbhai, F. (2021b). Investor overconfidence in the South African exchange traded fund market. Cogent Economics & Finance, 9(1), 1978190. [Google Scholar]
- Kunjal, D., Peerbhai, F., & Muzindutsi, P. F. (2021). The performance of South African exchange traded funds under changing market conditions. Journal of Asset Management, 22(5), 350–359. [Google Scholar] [CrossRef]
- Kunjal, D., Peerbhai, F., & Muzindutsi, P. F. (2024). The effect of disaggregated country risk on the returns of the South African exchange traded fund market. Journal of Economics and Financial Analysis, 8(1), 1–34. [Google Scholar]
- Kurian, B. C. (2017). A brief structure of exchange traded fund. Asia Pacific Journal of Research ISSN (Print), 2320, 5504. [Google Scholar]
- Lamothe, C., & Seetohul, Y. (2019). Deviations between ETF prices & their net asset value [Master’s thesis, Simon Fraser University]. [Google Scholar]
- Lee, C. C., & Chen, M. P. (2020). Happiness sentiments and the prediction of cross-border country exchange-traded fund returns. The North American Journal of Economics and Finance, 54, 101254. [Google Scholar] [CrossRef]
- Lee, C. C., Chen, M. P., & Lee, C. C. (2021). Investor attention, ETF returns, and country-specific factors. Research in International Business and Finance, 56, 101386. [Google Scholar] [CrossRef]
- Li, Q., Wang, T., Li, P., Liu, L., Gong, Q., & Chen, Y. (2014). The effect of news and public mood on stock movements. Information Sciences, 278, 826–840. [Google Scholar] [CrossRef]
- Lutz, C. (2016). The asymmetric effects of investor sentiment. Macroeconomic Dynamics, 20(6), 1477–1503. [Google Scholar] [CrossRef]
- Ma, H. (2013). Adaptive investment approach (pp. 1–21). Elsevier. SSRN 2359011. [Google Scholar]
- Ma, J. Z., Ho, K. C., Yang, L., & Chu, C. C. (2018). Market sentiment and investor overreaction: Evidence from New York listed Asian country exchange traded funds. Emerging Markets Finance and Trade, 54(11), 2455–2471. [Google Scholar] [CrossRef]
- Mbanga, C., Darrat, A. F., & Park, J. C. (2019). Investor sentiment and aggregate stock returns: The role of investor attention. Review of Quantitative Finance and Accounting, 53, 397–428. [Google Scholar] [CrossRef]
- Meng, K., & Li, S. (2021). The adaptive market hypothesis and high frequency trading. PLoS ONE, 16(12), 0260724. [Google Scholar] [CrossRef]
- Miziołek, T., Feder-Sempach, E., Zaremba, A., Miziołek, T., Feder-Sempach, E., & Zaremba, A. (2020). The Basics of Exchange-Traded Funds. In International equity exchange-traded funds: Navigating global ETF market opportunities and risks (pp. 63–113). Springer Nature. [Google Scholar]
- Moodley, F. (2024). Bond Indices Maturities and Changing Macroeconomic Conditions: Evidence from South Africa. Journal of Economics and Financial Analysis, 8(1), 57–73. [Google Scholar]
- Muguto, H. L., Rupande, L., & Muzindutsi, P. (2019). Investor sentiment and foreign financial flows: Evidence from South Africa. Zbornik Radova Ekonomski Fakultet u Rijeka, 37(2), 473–498. [Google Scholar]
- Muguto, H. T., Muguto, L., Bhayat, A., Ncalane, H., Jack, K. J., Abdullah, S., Nkosi, T. S., & Muzindutsi, P. F. (2022). The impact of investor sentiment on sectoral returns and volatility: Evidence from the Johannesburg stock exchange. Cogent Economics & Finance, 10(1), 2158007. [Google Scholar]
- Naeem, M. A., Mbarki, I., & Shahzad, S. J. H. (2021). Predictive role of online investor sentiment for cryptocurrency market: Evidence from happiness and fears. International Review of Economics & Finance, 73, 496–514. [Google Scholar]
- Naeem, M. A., Karim, S., Yarovaya, L., & Lucey, B. M. (2023). COVID-induced sentiment and the intraday volatility spillovers between energy and other ETFs. Energy Economics, 122, 106677. [Google Scholar] [CrossRef]
- Naseem, S., Mohsin, M., Hui, W., Liyan, G., & Penglai, K. (2021). The investor psychology and stock market behavior during the initial era of COVID-19: A study of China, Japan, and the United States. Frontiers in Psychology, 12, 626934. [Google Scholar] [CrossRef]
- Naseer, M., & Bin Tariq, D. Y. (2015). The efficient market hypothesis: A critical review of the literature. The IUP Journal of Financial Risk Management, 12(4), 48–63. [Google Scholar]
- Parveen, S., Satti, Z. W., Subhan, Q. A., & Jamil, S. (2020). Exploring market overreaction, investors’ sentiments and investment decisions in an emerging stock market. Borsa Istanbul Review, 20(3), 224–235. [Google Scholar] [CrossRef]
- PH, H., & Rishad, A. (2020). An empirical examination of investor sentiment and stock market volatility: Evidence from India. Financial Innovation, 6(1), 34. [Google Scholar]
- Renault, T. (2017). Intraday online investor sentiment and return patterns in the US stock market. Journal of Banking & Finance, 84, 25–40. [Google Scholar]
- Rupande, L., Muguto, H. T., & Muzindutsi, P. F. (2019). Investor sentiment and stock return volatility: Evidence from the Johannesburg stock exchange. Cogent Economics & Finance, 7(1), 1600233. [Google Scholar]
- Satrix (Own the Market). (2024). Fund fact sheet. Available online: https://satrix.co.za/media/90275?inline=true (accessed on 10 December 2024).
- Shen, J., Yu, J., & Zhao, S. (2017). Investor sentiment and economic forces. Journal of Monetary Economics, 86, 1–21. [Google Scholar] [CrossRef]
- Shiller, R. J. (2000). Measuring bubble expectations and investor confidence. The Journal of Psychology and Financial Markets, 1(1), 49–60. [Google Scholar] [CrossRef]
- Sing, N. B., & Singh, R. G. (2024). Testing the adaptive market hypothesis and time-varying efficiency in the Indian equity market. Colombo Business Journal, 15(1), 106–135. [Google Scholar] [CrossRef]
- Singhal, J. (2023). Role of greed and fear index in investment decision making. Leveraging Technology for Creating Competitive Advantage, 1–17. [Google Scholar] [CrossRef]
- Skender, A., Hadžiabulić, S., Ercisli, S., Hasanbegović, J., Dedić, S., Almeer, R., Sayed, A. A., Ullah, R., & Assouguem, A. (2022). Morphological and biochemical properties in fruits of naturally grown cornelian cherry (Cornus mas L.) genotypes in Northwest Bosnia and Herzegovina. Sustainability, 14(8), 4579. [Google Scholar] [CrossRef]
- Smales, L. A. (2017). The importance of fear: Investor sentiment and stock market returns. Applied Economics, 49(34), 3395–3421. [Google Scholar] [CrossRef]
- Su, C. W., Cai, X. Y., & Tao, R. (2020). Can stock investor sentiment be contagious in China? Sustainability, 12(4), 1571. [Google Scholar] [CrossRef]
- Sun, L., Najand, M., & Shen, J. (2016). Stock return predictability and investor sentiment: A high-frequency perspective. Journal of Banking & Finance, 73, 147–164. [Google Scholar]
- Tetlock, P. C. (2007). Giving content to investor sentiment: The role of media in the stock market. The Journal of Finance, 62(3), 1139–1168. [Google Scholar] [CrossRef]
- Trichilli, Y., Boujelbène Abbes, M., & Masmoudi, A. (2020). Predicting the effect of Googling investor sentiment on Islamic stock market returns: A five-state hidden Markov model. International Journal of Islamic and Middle Eastern Finance and Management, 13(2), 165–193. [Google Scholar] [CrossRef]
- Tsalikis, G., & Papadopoulos, S. (2019). ETFS-performance, tracking errors and their determinants in Europe and the USA. Risk Governance & Control: Financial Markets & Institutions, 9(4), 67–76. [Google Scholar]
- Tseng, Y. C., & Lee, W. C. (2016). Investor sentiment and ETF liquidity-evidence from Asia markets. Advances in Management and Applied Economics, 6(1), 89. [Google Scholar]
- Urquhart, A., & McGroarty, F. (2016). Are stock markets really efficient? Evidence of the adaptive market hypothesis. International Review of Financial Analysis, 47, 39–49. [Google Scholar] [CrossRef]
- Wang, W., Su, C., & Duxbury, D. (2021). Investor sentiment and stock returns: Global evidence. Journal of Empirical Finance, 63, 365–391. [Google Scholar] [CrossRef]
- Wang, W., Su, C., & Duxbury, D. (2022). The conditional impact of investor sentiment in global stock markets: A two-channel examination. Journal of Banking & Finance, 138, 106458. [Google Scholar]
- Wong, K. H., & Shum, W. C. (2010). Exchange-traded funds in bullish and bearish markets. Applied Economics Letters, 17(16), 1615–1624. [Google Scholar] [CrossRef]
- Xu, R., Liu, Y., Hu, N., & Guo, J. M. (2022). What drives individual investors in the bear market? The British Accounting Review, 54(6), 101113. [Google Scholar] [CrossRef]
- Yalçın, K. C. (2010). Market rationality: Efficient market hypothesis versus market anomalies. European Journal of Economic and Political Studies, 3(2), 23–38. [Google Scholar]
- Yang, C., & Chi, J. (2023). Investor sentiment and volatility of exchange-traded funds: Evidence from China. International Journal of Finance & Economics, 28(1), 668–680. [Google Scholar]
- Yiannaki, S. M. (2015). ETFs performance Europe—A good start or not? Procedia Economics and Finance, 30, 955–966. [Google Scholar] [CrossRef]
Disclaimer/Publisher’s Note: The statements, opinions and data contained in all publications are solely those of the individual author(s) and contributor(s) and not of MDPI and/or the editor(s). MDPI and/or the editor(s) disclaim responsibility for any injury to people or property resulting from any ideas, methods, instructions or products referred to in the content. |
© 2025 by the authors. Licensee MDPI, Basel, Switzerland. This article is an open access article distributed under the terms and conditions of the Creative Commons Attribution (CC BY) license (https://creativecommons.org/licenses/by/4.0/).