Abstract
This study examines the relationship between gender-related aid and legal frameworks governing women’s economic opportunities. Using data from 116 countries (2009–2022), we analyze how significant (SGRA) and principal (PGRA) gender-related aid influence the Women, Business, and Law (WBL) Index, which measures women’s access to employment, credit, and entrepreneurship. Results from fixed-effects models show that SGRA consistently improves WBL Index components, while PGRA significantly impacts marriage, parenthood, and mobility regulations, with modest effects on workplace and entrepreneurship measures. PGRA substantially affects marriage, parenthood, and mobility regulations while demonstrating more modest impacts on workplace conditions and entrepreneurship measures. These observations underscore the complexity of addressing gender inequality and the necessity of targeted, multifaceted approaches to overcome legal restrictions, entrenched social norms, and economic barriers. The research offers valuable insights for policymakers and donors on the transformative potential of gender-mainstreamed aid initiatives in fostering a more equitable world.
JEL Codes:
F35; J16; K38; O19; P48
1. Introduction
Empowering women requires the resources, opportunities, and support necessary to control their lives and fully participate in all aspects of society. This includes access to financial resources, employment opportunities, quality education, political participation, and comprehensive healthcare. It also involves promoting gender equality through equal legal rights and protections and removing discriminatory provisions that limit opportunities for women and girls at home, in the workplace, and across society (Kabeer, 2005). Empirical evidence demonstrates that countries with gender-sensitive legal frameworks achieve better outcomes in women’s economic participation and overall development (Gonzales et al., 2015; Klugman et al., 2014; Hallward-Driemeier & Gajigo, 2015).
Significant barriers continue to impede women’s economic opportunities globally, including inadequate property and inheritance rights, inequitable divorce and custody laws, and the absence of guarantees for paid maternity leave or job protection. Gender-discriminatory laws, such as those perpetuating unequal pay and occupational segregation, further exacerbate these challenges. While research (IMF, 2022; World Bank, 2022) highlights these barriers, the role of gender-mainstreamed aid in addressing systemic legal issues remains underexplored. This study seeks to fill this gap by analyzing how such aid impacts legal frameworks shaping women’s economic opportunities.
The 1995 United Nations Fourth World Conference on Women marked a significant step by emphasizing the integration of gender perspectives into all aspects of policy and practice, including legal and economic systems. Gender-mainstreamed aid, a key outcome of this initiative, provides financial and technical assistance to address structural inequalities and empower women and girls through systemic legal, social, and economic changes. This includes targeted measures such as legal reforms, capacity building, advocacy, awareness campaigns, and institutional strengthening, alongside broader programs embedding gender considerations (United Nations, 2017).
Legal reforms are pivotal in promoting equal pay laws, anti-discrimination policies, and maternity leave regulations. They establish a formal framework that safeguards women’s rights and fosters economic participation. The impact of these reforms is tangible, as countries with robust anti-discrimination laws often exhibit higher female labor force participation rates and maternity leave policies that enable women to balance work and family responsibilities, increasing workforce retention rates (Kleven et al., 2019; World Bank, 2020).
Capacity-building ensures policymakers, legal professionals, and enforcement agencies have the knowledge and skills to implement gender-sensitive laws effectively. For example, training programs may help judges and lawyers interpret and apply gender equality laws better, improving legal outcomes for women. Policymakers educated about the economic benefits of gender equality are more likely to prioritize and implement relevant reforms. Duflo (2012) indicates that capacity-building initiatives have been instrumental in equipping policymakers with the tools and understanding needed to prioritize gender-sensitive reforms. Furthermore, the UNDP’s (2016) efforts in training legal professionals have shown well-informed enforcers’ importance in ensuring that symbolic gender equality laws are actively implemented and enforced.
Advocacy and awareness campaigns can transform the societal attitudes and norms that often hinder women’s economic opportunities. These campaigns facilitate gender communication by employing targeted messaging, media platforms, and community engagement to promote gender equality. By reshaping public discourse, they create environments supportive of reforms and challenge entrenched stereotypes. Studies show public awareness efforts can shift perceptions and foster gender equality reforms (Bicchieri & Xiao, 2009). For example, NGO advocacy in various regions has successfully led to adopting gender equality laws, demonstrating the impact of sustained awareness campaigns (True & Mintrom, 2001).
Institutional strengthening helps enforce gender equality laws. Strong institutions are necessary for the effective implementation and enforcement of laws. This includes not only judicial institutions but also labor inspectorates and equality bodies. In addition, effective institutions ensure that laws are in the books and practiced. Providing resources and training for these bodies ensures that they can effectively carry out their mandates (North, 1990; European Institute for Gender Equality, 2018).
Cognizant of these benefits, donors have committed significant financial resources to gender-related aid over the last decade. Indicative of this commitment, approximately USD 200 billion in aid aimed at gender equality initiatives has been disbursed from 2010 to 2020 (OECD, 2021). Among others, the outlay involves funding activities that seek to reform legal and regulatory frameworks that enhance women’s economic participation. For example, in 2020 alone, about USD 20 billion in gender-related aid was dedicated to initiatives primarily focused on legal reforms and institutional strengthening (OECD, 2021).1
The significant financial outlay underscores global recognition of the critical role that legal and regulatory frameworks play in empowering women economically and fostering inclusive growth. However, an essential question remains for policymakers and development practitioners: How has gender-mainstreamed aid improved the legal and regulatory environments that impact women’s economic opportunities? The present study bridges this gap by integrating a theoretical framework with an empirical examination of the transformative role of gender-mainstreamed aid in shaping these legal environments.
To address this question, we employ a two-step approach. First, we develop a theoretical framework that connects gender-mainstreamed aid (GMA) inflows and the evolution of legal and regulatory provisions (gender discretionary laws) shaping women’s economic opportunities. Second, we utilize comprehensive data to empirically test whether increases in gender-mainstreamed aid inflows lead to measurable improvements in the Women, Business, and the Law (WBL) Index—a benchmark for assessing progress in legal provisions that impact women’s economic opportunities. Our study contributes to the literature by offering insights into whether, and to what extent, targeted aid drives legal reforms that enhance women’s economic opportunities while fostering inclusive economic growth. Additionally, the findings provide valuable guidance for policymakers and practitioners, helping them refine strategies and allocate resources effectively to maximize impact.
The panel fixed-effects estimation results demonstrate that gender-mainstreamed aid, lagged by one and two periods, significantly improves the WBL Index—a broad measure of the extent to which legal and regulatory frameworks support women’s economic participation and rights. Notably, significant gender-related aid (SGRA), which incorporates gender considerations into broader development projects, and principal gender-related aid (PGRA), which explicitly targets gender equality, positively impact legal frameworks shaping women’s workforce participation and business opportunities. These findings are robust across multiple estimation methods, including mixed-effects models with random intercepts (spanning six regions and 116 countries), random coefficients for gender-related aid variables, and instrumental variable (IV) regression analyses, further reinforcing the reliability of the observed effects.
These results are particularly relevant in the context of substantial investments in gender-mainstreamed aid and the United Nations Sustainable Development Goals (SDGs), which emphasize gender equality and women’s empowerment as cornerstones of sustainable development. The SDGs highlight that empowering women and girls and ensuring their active participation in economic activities is critical for building inclusive and sustainable economies. The results demonstrate that gender-mainstreamed aid supports these global objectives, serving as an effective tool to advance them.
The remainder of this paper is structured as follows: Section 2 briefly reviews the relevant literature. Section 3 develops the theoretical framework underpinning the empirical analysis. Section 4 presents descriptive statistics of variables along with the empirical results. Section 5 concludes with a discussion of the implications of the findings for practice in international development and gender equality.
2. Related Literature
Numerous studies emphasize the legal and regulatory barriers impacting women’s economic participation. Gonzales et al. (2015) highlight that legal restrictions on women’s rights reduce their participation in the labor market and entrepreneurship. Their cross-country analysis shows that countries with fewer legal barriers have higher female labor force participation rates. Islam et al. (2020) similarly investigate the impact of discriminatory laws on women’s labor market participation using data from over 59,000 firms in 94 economies. They identify the barriers associated with gender disparities—such as limited access to finance, property ownership, and business registration—that disempower women and restrict their engagement in the private sector. Their findings reveal that unequal laws significantly hinder women’s participation in the workforce and reduce their chances of becoming managers or business owners.
Annen and Asiamah (2023) investigate the relationship between women in African parliaments and foreign aid allocations by exploring the intersection of foreign aid and women’s political representation. They find a significant and statistically robust correlation: increasing the proportion of women legislators from 15% to 20% is associated with a roughly 4% rise in aid flows over current aid levels. The authors attribute this increase to the donor community’s growing emphasis on gender equality and women’s empowerment over the past two decades to the greater female representation in parliament, which can enhance policies, legal structures, and institutional frameworks as women advocate for beneficial reforms.
The effectiveness of gender-mainstreaming aid in improving health and education outcomes for women and girls is another area of focus. Arndt et al. (2015) find that gender-targeted aid significantly improves health and education outcomes for women and girls, laying the foundation for their economic participation. Their study includes a case analysis of Mozambique, where gender-mainstreamed aid has substantially improved girls’ education and women’s health outcomes, enabling women to participate more in economic activities. Similarly, Dreher et al. (2016) provide empirical evidence indicating that targeting gender equality positively impacts gender-related outcomes, including legal reforms. They highlight Rwanda, where gender-focused aid has supported implementing progressive gender laws and policies, leading to gender parity in political representation and significant improvements in women’s economic opportunities.
Berlin et al. (2024) investigate the impact of foreign aid on female empowerment using geo-coded data from Malawi. Their study reveals that foreign aid, especially gender-targeted aid, has a positive and significant effect on various dimensions of female empowerment (e.g., improvements in women’s agencies and attitudes towards sexual and fertility preferences). The effects are less pronounced in patrilineal communities, where traditional gender norms constrain effectiveness. Their research underscores the importance of tailoring foreign aid initiatives to the specific sociocultural contexts of recipient communities to maximize impact on gender equality.
Busse et al. (2017) assess the impact of foreign aid on regulatory quality in developing countries. Using data from 77 countries between 2002 and 2012, they find that targeted and sector-specific aid, especially Aid for Business, significantly improves regulatory quality, while general aid or aid aimed at broad governance does not have the same effect. Their study underscores the importance of focused aid interventions in enhancing regulatory frameworks.
The role of institutional quality in influencing the effectiveness of legal reforms has also been a central theme in the related literature. Acemoglu et al. (2001) argue that strong institutions are essential for sustainable economic development and the enforcement of laws. Their hypothesis suggests that legal reforms may not translate into real-world improvements in economic opportunities for women without robust institutions. Hallward-Driemeier et al. (2013) also show that countries with better regulatory quality and institutional strength tend to have more effective implementation of gender equality laws, leading to improved economic outcomes for women.
Donno et al. (2022) discuss the influence of international incentives on reforms associated with women’s rights in autocracies. They find that autocracies often implement gender-related legislation to comply with international norms, driven by foreign aid dependence and pressure from international NGOs. However, these regimes avoid more politically risky reforms related to elections and political pluralism. The study concludes that autocrats strategically use women’s rights reforms to maintain power while signaling compliance with international expectations.
The effect of societal attitudes and norms in shaping gender equality is also well documented. Ferrant et al. (2014) note that deep-rooted cultural norms impede the progress of gender equality, even with favorable laws. Hence, they emphasize the importance of advocacy and awareness campaigns in changing societal attitudes towards gender roles. Based on a detailed examination of India, where cultural norms have traditionally restricted women’s economic participation, the authors note that targeted awareness campaigns are gradually changing public perceptions and improving gender equality. Jayachandran (2015) similarly highlights how social norms and gender biases can restrict women’s economic activities and how interventions to change these norms can have significant positive impacts.
Observations from these studies underscore the importance of addressing legal, institutional, and cultural barriers that limit women’s economic opportunities. By leveraging gender-mainstreamed aid to target specific areas of interest, countries may create an inclusive environment that supports women’s participation in the economy, thereby driving overall economic growth and development. Although they highlight the critical role of gender-mainstreamed aid and robust institutions, the available studies rarely develop a theoretical model that permits gender-mainstreaming aid inflows with improvements in the legal and regulatory frameworks that characterize the environment under which women live and work. This study aims to fill the void by providing a theoretical framework linking gender-mainstreaming aid to enhanced legal protections for women and the mechanisms guiding more effective policy interventions.
3. Theoretical Framework and Empirical Model
3.1. Theoretical Model
Utility Maximization Framework: Consider a representative woman who chooses between work and leisure, with her utility derived from consumption (C) and leisure (L). Wages and non-wage factors, such as cultural, legal, and institutional environment, shape her labor market decisions.2
The utility function U is defined as
C is consumption, L is leisure, Js represents job security and safety, Jq reflects job quality (e.g., parental leave policies, flexible working conditions), and D represents the absence of workplace discrimination and harassment.
Budget Constraint: Consumption is financed by wages earned from working hours (h), and the total time endowment is normalized to 1, such that . The woman faces the following budget constraint:
where w is the wage rate for women and T is non-labor income.
Wage Determination Function: We derive the wage equation as a function of several variables that affect women’s wages in the labor market. These include human capital (H), the legal environment (Φ), and labor market characteristics (M). Thus, we specify the wage as
where H is human capital (e.g., education, skills), Φ represents the strength and quality of legal frameworks (e.g., anti-discrimination laws, equal pay laws, maternity rights), and M refers to labor market conditions (e.g., labor demand, employment rates). We consider that Φ, representing the legal framework, directly influences wage rates by ensuring gender equality and reducing discriminatory practices. Stronger legal protections (higher Φ) should increase wages for women by leveling the playing field in the labor market.
Non-Wage Factors Influencing Labor Force Participation: Besides wages, job security, safety, and quality, workplace conditions drive women’s workforce participation. Thus, we introduce an employment quality index (Q):
The index captures job characteristics such as security (Js)—the stability and assurance that the job will be available in the long term, reducing the risk of sudden unemployment; job quality (Jq)—factors such as access to benefits (e.g., parental leave, health insurance), work-life balance, and opportunities for career advancement; and the absence of discrimination and harassment (D)—policies that guarantee employees are treated fairly and with respect in the workplace, free from harassment or biased treatment, which can significantly affect their well-being and job satisfaction.
Labor Supply Decision: Given the wage w and employment quality Q, the woman maximizes utility by choosing the optimal number of labor hours (h):
The first-order condition of this maximization problem gives the optimal labor supply decision :
The model presents labor force participation as a function of wages (influenced by the legal framework, Φ), and non-wage factors captured by the employment quality index Q.
Incorporating Gender-Mainstreamed Aid: We hypothesize that by supporting legal reforms, advocacy, and enforcement of gender-equal laws, gender-mainstreamed aid (A) leads to improved legal frameworks. Thus, the strength of the legal framework, Φ depends on gender-related aid (A) and other factors such as government effectiveness (G) and cultural norms (C):
where A is gender-mainstreamed aid, G is government effectiveness (e.g., capacity to implement and enforce laws), and C represents cultural norms that may support or hinder gender equality.3
Role of Mediating Factors: The effects of gender-mainstreamed aid on legal reforms are not uniform across contexts as they are likely to be mediated by institutional and cultural factors. For example, corruption can limit aid effectiveness by diverting resources or weakening the enforcement of reforms, undermining progress toward stronger legal frameworks (Minasyan & Montinola, 2022; Bagade et al., 2022). Similarly, entrenched cultural norms that devalue gender equality may resist reform efforts even when laws are strengthened. These mediating factors influence how aid translates into meaningful legal and institutional changes promoting women’s economic participation.
To reflect these dynamics, the empirical model includes key variables such as the Institutional Quality Index, which captures governance strength and corruption, and Cultural Globalization, which proxies for openness to international norms, including those promoting gender equality. These variables ensure that the broader institutional and cultural environment is accounted for in the analysis, providing a robust foundation for interpreting the results.
3.2. The Empirical Model
Based on the theoretical model, we construct a reduced-form empirical model that enables us to test whether the gender-mainstreamed aid (A) inflow that a country receives, conditional on a vector of control variables (Z), influence the WBL index.
where is the Women, Business and Law score in country at time t, is the amount of gender-mainstreamed aid received by the given recipient, is a vector of control variables (e.g., economic development, educational attainment, political stability, cultural norms), and is an independently and identically distributed error term. To address potential reverse causality between gender-related aid (Ait) inflow and the Women, Business, and Law Index (WBLit), we use a two-period lagged value of aid (Ait-2).4
We estimate the parameters using the standard panel fixed-effects and quantile fixed-effects regression approaches. The panel fixed-effects model accounts for unobserved country-specific factors that could bias the results if omitted, ensuring that time-invariant heterogeneities across countries do not distort the observed relationship between gender-mainstreamed aid and WBL outcomes. The quantile fixed-effects approach allows for us to explore how the impact of gender-mainstreamed aid varies across different levels of the WBL Index distribution, providing a better understanding of its effects.
We utilize the multilevel model (mixed-effects random coefficient approach) and instrumental variable (IV) regression methods for robustness checks. The mixed-effects random coefficient approach accommodates potential variations in the relationship between gender-mainstreamed aid and WBL Index outcomes across countries, systematically modeling heterogeneity in aid effectiveness. The IV regression approach was employed to address potential endogeneity concerns, leveraging maternal mortality as an instrument for gender-related aid. Maternal mortality, a widely recognized indicator of gender disparities, is correlated with aid allocation decisions (Pickbourn & Ndikumana, 2016) but does not directly affect the WBL Index, ensuring the validity of the instrument. This approach enhances the robustness of our findings by mitigating bias from reverse causality or omitted variable effects.
4. Empirical Results
4.1. Descriptive Statistics
The determinants of the legal and regulatory environment that women often navigate through their working lives are multifaceted, encompassing political, economic, social, cultural, and institutional factors. Table 1 presents the panel descriptive statistics of the variables in the empirical model.

Table 1.
Panel descriptive statistics.
The primary dependent variable of interest is the WBL score, a composite metric ranging from 0 to 100, with higher values reflecting the availability of better legal and regulatory frameworks facilitating women’s economic opportunities. The score is derived from eight indicators: Mobility (assesses freedom of movement); Workplace (examines employment regulations); Pay (focuses on equality in remuneration); Marriage (evaluates rights within marriage and after divorce); Parenthood (considers the impact of laws on work post-childbirth); Business or Entrepreneurship (addresses constraints on business ownership; Assets, scrutinizing property, and inheritance rights; and Pension (covers pension entitlements). Data are sourced from the World Bank (2024).
The panel of descriptive statistics concerning the Women, Business, and Law (WBL) Index and its component dimensions presented in Table 1 provide a comprehensive overview of the legal and regulatory frameworks impacting women among the 116 countries in this study. The overall mean score for the WBL Index is 68.964, with a standard deviation of 15.702, indicating moderate variability in how countries score on gender-related legal protection. The “between” variability (15.424) is significantly higher than the “within” variability (3.581), suggesting that differences between countries are more pronounced than changes within individual countries over time. The highest mean score among the dimensions is observed in Mobility (84.148), with the lowest variability within countries (4.518), implying relatively consistent legal conditions related to women’s mobility. On the other hand, Parenthood has the lowest mean score (45.628) with significant variability between (26.451) and within countries (7.077), indicating substantial disparities in legal and regulatory support for women regarding parenthood.
Examining the other dimensions, we observe that Workplace (71.675) and Marriage (71.594) both show high mean scores but also considerable overall variability (31.644 and 30.242, respectively), suggesting that while some countries have robust frameworks in these areas, others lag significantly. The Pay dimension has the lowest mean score (54.390) among the higher-ranking areas, with high between-country variability (28.247), reflecting significant global disparities in pay equity. The Business, or Entrepreneurship (79.519) and Assets (78.207) dimensions exhibit relatively high mean scores with moderate variability, indicating generally favorable legal conditions for women in these areas, but still with notable differences between countries. Lastly, the Pension dimension has a mean score of 66.550, with considerable variability between (25.222) and within (7.385) countries, suggesting diverse legal frameworks affecting women’s pension rights. Overall, the data reveal significant achievements in some legal and regulatory provisions that impact women’s lives while exhibiting persistent gaps and disparities in others, underscoring the need for targeted policy interventions to achieve gender equality.5
Data on the control variables, per capita income, and mean years of schooling are from the UNDP (2022); institutional quality data are from Kaufmann et al. (2021); and cultural and economic globalization indices are from Gygli et al. (2019). The descriptive statistics for the respective variables reveal the divergence of socioeconomic and institutional contexts among the 116 countries in this study. The years of schooling have an overall mean of 7.163 and a standard deviation of 2.861, indicating moderate variability. The average per capita income among the countries in this study stands at USD 9013.257, with a substantial standard deviation of 6565.725, reflecting significant economic disparities among countries. Notably, the between-country variability (7166.382) far exceeds the within-country differences (1313.597), highlighting pronounced economic differences across nations. Institutional Quality, with a mean of 0.004 and minimal variability (0.006), suggests relatively consistent institutional conditions, though differences exist between countries (0.007). A mean (standard deviation) of 43.955 (15.947) for cultural and 56.572 (9.932) for economic globalization showcases that the typical country in this study has relatively higher economic than cultural integration.
The inclusion of these variables as control factors is guided by the established literature. Higher educational attainment fosters greater awareness of women’s rights and the importance of gender equality, which can lead to the creation and enforcement of supportive laws (Barro & Lee, 2013). Education empowers women with the knowledge and skills necessary to advocate for their rights and participate actively in the economy, resulting in more robust legal protections (Klasen & Lamanna, 2009). Empirical evidence suggests that countries with higher average educational attainment tend to have more robust legal frameworks supporting women’s economic participation (Schultz, 2002).
The institutional quality, encompassing government effectiveness, rule of law, and corruption control, is crucial in determining the legal and regulatory frameworks women must navigate (Acemoglu et al., 2001). High-quality institutions are more likely to enforce laws fairly and efficiently, ensuring that legal protections for women are practical. Effective institutions can close the gap between legal provisions and their implementation (North, 1990), thus consistently upholding women’s rights. Moreover, strong institutions correlate with better gender equality outcomes, providing the necessary infrastructure for enforcing women’s legal rights (Hall & Jones, 1999).
Cultural and economic globalization levels can influence the legal and regulatory frameworks defining women’s economic opportunities by exposing countries to global norms and practices regarding gender equality and women’s rights. Globalization can lead to adopting international standards and best practices in legal frameworks, driven by international agreements and global pressure (Inglehart & Norris, 2003). Through increased trade and foreign investment, economic globalization introduces multinational corporations that adhere to higher gender equality standards, influencing local practices and policies (Potrafke & Ursprung, 2012). Studies also show that globally integrated countries adopt more progressive gender-related laws and policies, improving the WBL Index (True & Mintrom, 2001).
Turning to the independent variable of interest, the table presents gender-related aid extended to the 116 countries at the aggregate (TGRA) along with its components, the principal (PGRA) and significant (SGRA) gender-related aid. We observe that the typical country in this study during the reference period (2009–2022) received, on average, a minimum of USD 0.521 million to USD 203.544 million in total aid targeting gender equality and women’s empowerment. Of this amount, USD 26.207 million was extended as principal gender-related aid (PGRA), and a larger amount, USD 177.451 million, was disbursed as significant gender-related aid (SGRA). The data on gender-related aid are from the OECD (2021) credit reporting system.
Aid activities to address gender disparity, including legal and regulatory protections for women, can be extended as principal and/or significant aid (Koester et al., 2016). Principal gender-related aid finances activities specifically designed to promote gender equality and women’s empowerment as the primary purpose. Such activities may include projects enhancing women’s access to education, increasing female participation in political processes, improving legal rights, or addressing gender-based violence. Significant gender-related aid, on the other hand, includes activities that address gender equality and women’s empowerment as important but secondary objectives. While these activities have other primary goals, they also encompass promoting gender equality and strengthening legal and regulatory protections for women. For example, an agricultural development project might include components that ensure women farmers have equal access to resources and training and advocate for legal reforms that protect women’s property rights. While the primary aim is agricultural development, these projects can significantly contribute to gender equality and legal protections, thus being defined as gender-related aid.
Table 2 shows the average annual Overseas Development Aid (ODA) and the breakdown of the gender-related aid inflows into its components (SGRA and PGRA) and their proportions across the countries in this study. First, apart from a few exceptions like Nepal (57.3%), Ethiopia (43.9%), Burkina Faso (47.0%), Nigeria (47.6%), and Guinea (45.5%), where the values exceed 40%, the share of total gender-related aid (TGRA) in the annual ODA inflows to most countries in this study is relatively low (generally in the low- to mid-30% range). This implies that gender-related aid constitutes a relatively small portion of overall aid. Second, principal gender-related aid (PGRA), which funds activities explicitly designed to promote gender equality and women’s empowerment as a primary objective, represents a relatively meager share of the TGRA. For example, in Zambia, which has the highest share, PGRA accounts for 26.4% of TGRA. In Mali, Tanzania, and Liberia, the corresponding shares stand at 21.3%, 20.6%, and 20.4%, respectively.
Table 2.
Average annual gender-related aid inflows by recipients in millions of USD (2009–2022).
In all other countries, the share of PGRA in TGRA is in the low teens, indicating that a substantial proportion of TGRA is devoted to activities that address gender equality and women’s empowerment as important but secondary objectives (i.e., SGRA). For instance, in Guyana, Mongolia, and Gabon, PGRA accounts for two to five percent of TGRA, while SGRA accounts for 36.0%, 96.3%, and 96.8%, respectively. This observation highlights that the primary focus of a larger share of gender-related aid extended to many countries lies elsewhere. In contrast, aid funding activities that address gender equality and women’s empowerment are just as important.
Second, there is a strong correlation among the WBL Index components: a correlation coefficient (ρ) of 0.921 between average annual ODA and TGRA inflows, 0.932 between ODA and SGRA receipts, 0.733 between TGRA and PGRA inflows, and 0.842 between SGRA and PGRA inflows. The high correlation values suggest that countries with significant ODA inflows are also where gender-related issues are being systematically addressed through principal and significant aid activities. While this focused effort can lead to a more holistic and integrated approach to gender equality, leveraging broader development initiatives to support specific gender-focused interventions, it also calls for a careful evaluation of whether the funds are leading to tangible improvements in gender equality outcomes such as better legal protections and increased economic opportunities for women (i.e., the effectiveness of gender-related aid).
4.2. Does Gender-Related Aid Enhance the Legal and Regulatory Protections for Women?
Table 3 highlights the significant positive relationship between gender-related aid inflows and improvements in the WBL Index, even after accounting for unobserved heterogeneities across countries and over time. Notably, SGRA demonstrates a more pronounced impact on legal reforms than PGRA, underscoring the importance of integrating gender considerations into broader development initiatives.6 The results are derived using one-year lagged values of gender-related aid, allowing for the assessment of delayed impacts.7 Column (a) shows the results from the specification, which includes the control variables and total gender-related aid (TGRA). Column (b) presents the results from the specification that includes only the significant component of gender-related aid (SGRA). Column (c) includes only the principal gender-related aid (PGRA) component. In column (d), we present results from the specification, which includes the SGRA and PGRA components. In contrast, column (e) reports results from the specification in which we control for the interaction effects of the SGRA and PGRA.
Table 3.
Fixed effects panel estimation results.
The overall performance of the estimated models is robust, as indicated by several key statistics. The R-squared values range from 0.235 to 0.259, suggesting that the models explain about 23.5% to 25.9% of the variation in the WBL Index within countries over time. The F-statistics for all models are highly significant (p < 0.01), confirming that the models are statistically significant and that the included variables jointly explain the variation in the dependent variable. Additionally, the log-likelihood values (ranging from 2248 to 2379) and the very low root mean square error (RMSE) values (from 0.0548 to 0.0560) indicate a good fit of the models to the data. The unobserved country-specific heterogeneity (sigma u) ranges from 0.255 to 0.263, with an average rho value of 0.96. This indicates that the unobserved country-specific effects account for a substantial portion of the variance in the legal and regulatory frameworks affecting the economic lives of women in the countries included in this study, highlighting the importance of controlling for these effects in the analysis.
Except for a few cases where some control variables lack statistically discernible effects, all columns show that the variables have the theoretically expected a priori positive effects. Accordingly, higher average education levels are associated with higher WBL Index scores, with the mean years of schooling variable maintaining a consistently positive and highly significant effect (p < 0.01) across all models, with coefficients ranging from 0.215 to 0.237. Using the coefficient reported in column (c) as an example, we observe that a 1% increase in mean years of schooling in a typical country is associated with a 0.237% increase in the WBL Index in that country. The observation underscores the crucial role of educational achievements in improving women’s legal protection. As a priori expected, per capita income also shows a positive and significant effect in most models, with coefficients ranging from 0.0207 to 0.0257. Using the results in column (b) as an example, we find that a 1% increase in per capita income is associated with a 0.0233% increase in the WBL Index, highlighting the effect of a country’s economic prosperity in enhancing women’s legal and regulatory environments.
The measure of institutional quality (IQ), the only variable that enters the model in levels, has a large and highly significant effect (p < 0.01) in all models, with its coefficients ranging from 3.393 to 4.415, again highlighting the critical role of well-functioning institutional capabilities in enhancing women’s legal protections. Using the coefficient reported in column (e), for example, we compute that a 1% increase in institutional quality results in a 4.168% [( − 1) × 100] increase in the WBL Index, indicating that robust institutions are critical for advancing women’s legal protections. Economic globalization has consistently positive and highly significant (p < 0.01) effects, with coefficients ranging from 0.260 to 0.316, suggesting that countries with higher economic globalization levels have improved legal and regulatory environments for women. Using the results in column (c), we observe that a 1% increase in economic globalization leads to a 0.316% increase in the WBL Index, a critical depiction of the global economic integration’s role in improving the legal frameworks defining opportunities for women. Higher Cultural Globalization has a positive and significant effect (p < 0.10) in most models, indicating that the more culturally integrated countries are with the rest of the world, the higher their WBL Index scores.
Turning to the main variables of interest, a rise in gender-related aid inflow at the aggregate (TGRA) and disaggregate levels (SGRA and PGRA) is associated with statistically discernible improvements in the WBL Index. For example, the result in column (a) indicates that a 1% increase in the TGRA inflows yields a 0.017% increase, on average, in the WBL score a year later. While a 1% increase in the SGRA yields a 0.0169% (column b) increase in the WBL Index, a proportionate increase in PGRA yields a much lower but statistically significant 0.00662% increase in the WBL Index, on average. When controlling for the potential effects of both components of gender-related aid inflows, without (column d) and with interaction effects (column e), in addition to each component maintaining their statistical significance, indicating that targeted interventions are effective in enhancing the legal protections for women, they have a statistically significant positive interaction effect. The observation highlights the synergy in the aid strategies addressing both primary and secondary gender-related objectives, reinforcing each other to produce substantial improvements in legal and regulatory frameworks for women. For policymakers and donors, this would mean that allocating resources to both broad and specific gender-related initiatives can significantly enhance women’s empowerment and legal protections.
4.3. Dimensional Variations in the Observed Effects
While the above results provide valuable insights into the effectiveness of gender-related aid on legal and regulatory frameworks affecting women’s lives, a meaningful and policy-relevant understanding requires a detailed examination of its effects across the different dimensions of the overall index (WBL), as aid could be highly effective in certain areas while potentially less impactful in others.8
Table 4 presents estimates of the effects of each TGRA, SGRA, and PGRA inflow extracted from 24 different panel fixed-effect specifications using each of the eight component dimensions of the WBL Index. The results highlight that gender-related aid significantly impacts the aggregate WBL Index, but its effectiveness varies across the different dimensions of the index. For instance, total gender-related aid (TGRA) significantly improves the legal constraints related to marriage (0.0299%) and laws affecting women’s work after having children, i.e., parenthood (0.0303%) with a high degree of statistical significance (p < 0.01), indicating that aid positively influences legal frameworks that affect these areas. However, it has a weaker and statistically insignificant impact on the workplace, laws affecting women’s decisions to work (0.0192), and business or entrepreneurship, imposing constraints on women’s ability to start and run businesses (0.00712). Hence, aid in these areas may require more targeted interventions, or other factors may be at play.
Table 4.
Coefficient estimates of the effects of TGRA, SGRA, and PGRA on component dimensions of the Women, Business, and Law Index extracted from panel fixed effects estimations.
The weaker effects of gender-related aid on workplace and business (entrepreneurship) dimensions may indicate the presence of structural barriers that go beyond the scope of legal and regulatory reforms. These areas likely require complementary interventions such as capacity-building programs to enhance women’s participation in the workforce and support business (entrepreneurship) initiatives. For instance, capacity-building programs could focus on improving women’s access to financial resources, business networks, and entrepreneurial training. Furthermore, addressing deeply entrenched societal norms that limit women’s economic participation may necessitate targeted awareness campaigns and advocacy efforts. These measures could strengthen the impact of aid in areas where legal reforms alone may not be sufficient to overcome existing barriers.
Similarly, significant gender-related aid (SGRA), which incorporates gender considerations into broader development projects, shows positive and significant effects on mobility (constraints on women’s freedom of movement) (0.0109%, p < 0.10), legal constraints related to marriage (0.0261%, p < 0.01), and parenthood (laws affecting women’s work after having children) (0.0264%, p < 0.05). SGRA’s influence on laws and regulations affecting women’s compensation (i.e., pay) (0.0217) and business (0.00757) is less pronounced and only marginally significant or not significant.
Principal gender-related aid (PGRA), which explicitly targets gender equality, has a statistically significant effect on fewer components, notably on marriage (0.0114%, p < 0.05), parenthood (0.0103%, p < 0.10), and on laws and regulations affecting the size of a woman’s pension (0.0183%, p < 0.01). However, its impact on other dimensions, like mobility (0.00398) and business (0.000788), is not statistically discernible.
These observations suggest that the impact (statistical and practical) varies across dimensions. Thus, policymakers and donors must consider these variances when designing aid programs, ensuring that resources are allocated effectively across different areas to maximize improvements in the legal and regulatory frameworks affecting women. As indicated earlier, comprehensive strategies targeting gender equality as a primary and secondary objective can synergize, leading to broader and more substantial improvements in women’s legal protections and economic opportunities.
4.4. Distributional Impact Variations
The fluence may also vary among countries at different stages (distribution) of the legal and regulatory development. Thus, analyzing the variation in the observed effects of gender-related aid across countries situated at different locations on the WBL Index distribution can help identify where aid is most beneficial and inform a more targeted and strategic allocation of resources.
Accordingly, Table 5 presents results obtained using the Machado and Silva (2019) panel fixed effects quantile regression estimation approach. By depicting the effect of a percentage increase in the given variable of interest on the WBL Index, compared to the panel fixed effects results in Table 3 and Table 4, the quantile regression results permit a more comprehensive examination of the effectiveness of gender-related aid across countries. This is particularly valuable when dealing with heterogeneous data such as the WBL Index, where the relationship between the primary variables of interest may differ among countries at various points in the distribution.9
Table 5.
Quantile fixed effects estimation of the effects of gender-related aid on the WBL Index (in logs).
Panel A (the upper part) of Table 5 presents results from the specification in which only the SGRA component enters the model. In contrast, Panel B (the bottom part of the table) presents the corresponding results when PGRA is the only gender-related aid component that enters the model.10 Given that the observed effects for most of the variables remain consistent with the results obtained from the panel fixed effect regression results, for brevity, we limit the discussion to the breakdown of the main variables of interest: SGRA and PGRA.
The coefficients for SGRA (Panel A) are positive and statistically significant across all quantiles (q5 to q95), with the magnitude of the observed effect of a 1% increase in SGRA gradually increasing from 0.012% (q5) to 0.022% (q95). While the consistently significant coefficients across all quantiles establish the robustness of the impact of SGRA on the WBL Index at all levels, the rise in the observed effects underscores that as SGRA increases, the WBL Index, indicating better conditions for women in business and law, also improves.
The PGRA (Panel B) coefficients are also positive and statistically significant from the lower end of the distribution (the 5th quartile to the 75th quartile), ranging from 0.010 at the 5th quartile to 0.005 at the 75th quartile. However, the coefficients become statistically insignificant at the upper ends of the WBL distribution (the 85th to 95th quartiles). This indicates that PGRA positively impacts the WBL Index, particularly at the lower and middle levels, but its effect diminishes at higher levels. Therefore, while PGRA improves conditions for women, its impact is less pronounced at the higher quantiles of the WBL Index.
The dimensional and distributional analyses highlight that while gender-related aid has an overall positive impact, its effectiveness varies across legal and regulatory contexts. This observation suggests that aid programs should be tailored to address the unique needs of countries at different stages of legal and regulatory development. For instance, countries with lower WBL scores may benefit from foundational legal reforms, while those with higher scores may require complementary measures, such as programs that focus on shifting societal norms or enhancing the enforcement of existing laws.
Comparing the observed effect, while increased SGRA and PGRA inflows positively affect the WBL Index, SGRA has a more consistent and more considerable impact, especially at the higher end of the quantiles. For instance, at the 95th quartile, a 1% increase in the SGRA is associated with a 0.022% increase in the WBL Index. The corresponding effect of PGRA is not statistically discernible, indicating that SGRA is more effective for comprehensive improvements in gender-related business and law conditions affecting women. Conversely, the observation that PGRA significantly impacts the WBL Index at the lower to middle quantiles indicates that perhaps complementary measures are needed to enhance its effectiveness across countries at various ends of the legal and regulatory contexts. To aid visual observation of the patterns of the observed effects, Figure 1 presents the visualization of the coefficients of the SGRA and PGRA along with that of mean years of schooling and per capita income.
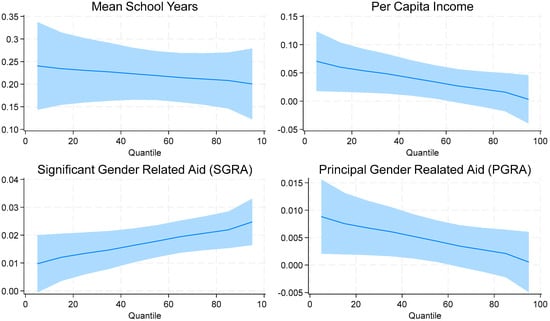
Figure 1.
Relative impacts of the control variables on rules and regulatory frameworks affecting women. Results from the quantile regression model.
Comparing the patterns of the observed effects of mean years of schooling and per capita income in both specifications, while the years of schooling exhibit similarities to that of SGRA (with positive and significant coefficients across all quantiles), the impact of per capita income is more nuanced (positive and significant at lower quantiles, but diminished impacts at the higher end of the distribution), indicating that income improvements have a more substantial effect at lower levels of the WBL Index.
4.5. Robustness Checks
To ensure the robustness of the results, we also employ two alternative estimation approaches: the random intercepts (for six regions and 116 countries) and random coefficients (for the gender-related aid variables) mixed effects model, and the instrumental variable (IV) regression methods. The mixed-effects model addresses unobserved heterogeneity by including random intercepts for regions and countries, capturing baseline differences in the Women, Business, and the Law (WBL) Index across contexts. It also includes random coefficients for gender-related aid, allowing for variation in aid effectiveness across countries.
We use maternal mortality as an instrument to address the potential endogeneity of the main variable of interest, gender-related aid.11 Maternal mortality is strongly correlated with gender disparities, which influences aid allocation decisions but does not directly affect the WBL Index (Bhalotra et al., 2023; Bagade et al., 2022; Cameron et al., 2019). The WBL Index reflects legal and institutional reforms related to women’s economic participation, which are unlikely to be directly impacted by maternal mortality, a health outcome.12 Results from the corresponding estimation approaches—the random coefficient mixed-effects model and the IV regression model (when using two-period lagged values of the gender-related aid variables)—are presented in Table 6 and Table 7.
Table 6.
Mixed effects model estimation of the determinants of the WBL Index.
Table 7.
Panel fixed effects instrumental variable estimation of the determinants of the WBL Index.
Estimation results from both the mixed-effects random coefficients model and the IV regression approaches, presented in Table 6 and Table 7, show that the coefficient for mean years of schooling is positive and statistically significant. This indicates that higher levels of educational attainment in a country are strongly associated with improvements in the legal and regulatory frameworks that influence women’s economic opportunities. Per capita income also maintains a consistent positive and significant effect on the WBL Index across most specifications. The coefficients remain significant at the 5% level in models (a), (b), (d), and (e). In comparison, column (c) shows significance at only the 10% level, indicating that increased protections for women also result from income improved income levels. However, the effect size diminishes slightly in column (c), consistent with the results obtained from the quantile regression models. The stability of these coefficients across specifications in columns (a) to (e) underscores the robustness of the primary findings.
Turning to our main variables of interest, in Table 6, column (a), the coefficient for TGRA is 0.0193 and significant (p < 0.01), suggesting a 1% increase in total gender-related aid is associated with approximately a 0.019% improvement in the WBL Index, demonstrating the overall efficacy of such aid. In column (b), the coefficient for SGRA is 0.0196 and significant (p < 0.01), indicating that a 1% increase in SGRA leads to a 0.0196% improvement in the WBL Index, highlighting the substantial positive effect of targeted gender-related initiatives. The effect of PGRA is also significant (p < 0.01), indicating a 1% increase in PGRA results in an approximately 0.0.0824% improvement in the WBL Index.
In Table 7, the coefficient of TGRA, SGRA, and PGRA are, respectively, 0.0281 (p < 0.01), 0.0282 (p < 0.01), and 0.0157 (p < 0.01), indicating that a 1% increase in gender-related aid inflow (aggregate, significant, and principal), driven by changes in the maternal mortality rate, is associated with a 0.281%, 0.282%, and 0015% increase in the WBL Index. This indicates a causal relationship where increased gender-related aid inflow leads to positive changes in the discretionary regulatory laws affecting women’s economic participation, as measured by the WBL Index.13
The findings also underscore the importance of a multidimensional approach to aid design. The significant positive interaction effects between principal and significant gender-related aid suggest that integrated strategies targeting both primary and secondary gender objectives are particularly effective. For dimensions like workplace and business (entrepreneurship), where weaker impacts are observed, policymakers may consider combining legal reforms with targeted capacity-building and advocacy efforts to enhance women’s participation and overcome societal barriers.
Overall, the results from both estimation approaches (the mixed-effects models with random coefficients and the IV regression) corroborate the primary findings, suggesting that gender-related aid has a significant and beneficial impact on enhancing the legal frameworks that affect women’s ability to participate in the economy.
5. Conclusions and Implications
This study provides empirical evidence on the effectiveness of gender-related aid in enhancing legal and regulatory protections for women across 116 countries from 2009 to 2022. The findings reveal that increased inflows of gender-related aid are associated with statistically significant improvements in the Women, Business, and Law (WBL) Index, a key measure of the legal environment impacting women’s economic opportunities.
At the aggregate level, an increase in TGRA is linked to improvements in the overall WBL Index score. When disaggregated, both the SGRA component, which emphasizes gender considerations in broader development projects, and the PGRA component, explicitly targeting gender equality, exhibit positive and statistically significant effects on the WBL Index. Notably, the impact of SGRA appears more consistent and substantial across countries at different levels of WBL development.
The analysis further indicates that while gender-related aid positively impacts the aggregate WBL Index, its effectiveness varies across the dimensions constituting it. TGRA and SGRA strongly affect aspects like marriage, parenthood, and mobility but have relatively weaker effects on workplace conditions and entrepreneurship. In comparison, PGRA significantly influences marriage, parenthood, and pension-related legal provisions.
Results from the quantile regression analysis further reveal stark distributional differences in the effects of gender-related aid on the WBL Index. The impact of SGRA is consistently positive and significant across all quantiles of the WBL distribution, with its magnitude increasing toward the higher quantiles. In contrast, the effect of PGRA is significant at the lower and middle quantiles but weakens at the upper end of the distribution. This observed heterogeneity suggests that SGRA is particularly effective in driving comprehensive legal reforms across countries at diverse stages of development. However, PGRA appears more impactful in countries with less advanced legal frameworks, indicating the need for complementary measures to amplify its effectiveness in contexts where gender-related legal reforms are already relatively well established.
These findings carry several important implications for policymakers, donors, and development practitioners working toward gender equality and women’s economic empowerment. First, development agencies should strategically balance investments in SGRA and PGRA to harness their complementary effects. Second, aid strategies must align with a country’s WBL Index level, prioritizing PGRA for foundational reforms in lower-scoring nations and SGRA for addressing institutional barriers in higher-scoring contexts. Third, targeted interventions in workplace conditions and entrepreneurship, coupled with strengthened enforcement mechanisms and professional training, are essential for maximizing the impact of legal reforms.
Additionally, donors should incorporate specific actionable steps tailored to stakeholders. For instance, recipient governments could be encouraged to integrate gender-focused legal frameworks into national development plans. NGOs may focus on advocacy campaigns that reshape societal attitudes and promote gender equality. Donors themselves could implement monitoring and evaluation frameworks to ensure aid effectiveness.
The findings also align closely with the Sustainable Development Goals (SDGs), particularly Goal 5: achieve gender equality and empower all women and girls. Highlighting the need for context-sensitive and integrated approaches, the findings from this research underscore the transformative potential of gender-mainstreamed aid. Future studies should investigate the mechanisms through which each type of GMA influences legal reforms and explore how cultural and institutional factors mediate these effects. By advancing evidence-based strategies, policymakers and practitioners can optimize aid programs to accelerate progress toward gender equality and women’s economic empowerment worldwide.
Author Contributions
Conceptualization, B.T.; methodology, B.T.; software, B.T.; validation, E.K.S. and B.F.; formal analysis, B.T.; investigation, E.K.S. and B.F.; formal analysis, B.T.; resources, E.K.S. and B.F.; data curation, B.T.; writing—original draft preparation, B.T.; writing—review and editing, E.K.S. and B.F.; visualization, B.T. All authors have read and agreed to the published version of the manuscript.
Funding
This research received no external funding.
Informed Consent Statement
Not applicable.
Data Availability Statement
The original contributions presented in the study are included in the article. Further inquiries can be directed to the corresponding author.
Conflicts of Interest
The authors declare no conflict of interest.
Correction Statement
This article has been republished with a minor correction to the Informed Consent Statement. This change does not affect the scientific content of the article.
Appendix A
Table A1.
Descriptive statistics of WBL Index and its components by regional location of the countries in this study.
Table A1.
Descriptive statistics of WBL Index and its components by regional location of the countries in this study.
| Variables | East Asia & Pacific | Europe & Central Asia | Latin America & Caribbean | Middle East & N. Africa | South Asia | Sub-Saharan Africa | All Regions |
|---|---|---|---|---|---|---|---|
| Wbl Index | 71.24 | 79.86 | 79.12 | 45.10 | 57.63 | 68.86 | 69.63 |
| (10.44) | (7.069) | (9.153) | (13.96) | (14.03) | (13.65) | (15.68) | |
| Mobility | 88.38 | 100 | 93.95 | 51.04 | 87.62 | 80.01 | 84.48 |
| (16.14) | (0) | (13.13) | (38.76) | (22.26) | (23.93) | (25.28) | |
| Workplace | 75.96 | 81.43 | 80.88 | 44.79 | 73.51 | 72.25 | 73.09 |
| (27.57) | (22.42) | (28.27) | (32.77) | (26.65) | (33.05) | (31.27) | |
| Pay | 58.76 | 45.60 | 68.95 | 35.76 | 39.36 | 59.43 | 55.22 |
| (21.72) | (31.91) | (22.80) | (22.64) | (34.16) | (29.09) | (29.45) | |
| Marriage | 80.76 | 94.76 | 84.63 | 23.47 | 68.51 | 68.02 | 72.42 |
| (21.94) | (8.814) | (17.15) | (21.46) | (26.88) | (29.74) | (30.15) | |
| Parenthood | 40.25 | 74.86 | 52 | 34.44 | 20.40 | 41.81 | 46.50 |
| (28.19) | (14.38) | (23.92) | (23.23) | (14.69) | (24.63) | (27.02) | |
| Business | 84.87 | 90.24 | 81.84 | 77.78 | 72.77 | 75.11 | 80.09 |
| (12.26) | (12.23) | (13.49) | (7.884) | (9.420) | (16.51) | (14.71) | |
| Assets | 84.71 | 100 | 96.91 | 40 | 54.06 | 72.37 | 78.41 |
| (20.27) | (0) | (10.69) | (0) | (17.79) | (26.28) | (26.28) | |
| Pension | 56.21 | 52.02 | 73.77 | 53.47 | 44.80 | 81.90 | 66.86 |
| (25.58) | (15.04) | (22.56) | (29.36) | (21.01) | (21.00) | (26.05) | |
| Observations | 157 | 210 | 285 | 144 | 101 | 464 | 1361 |
Notes
| 1 | Numerous donor-funded initiatives have supported gender-focused legal and regulatory reforms legal and regulatory frameworks that impact women’s rights and opportunities worldwide. Examples include South Africa’s USD 100 million program to combat gender-based violence (2010–2017), Nepal’s USD 50 million for women’s legal rights and political participation (2010–2018), and the Pacific Islands’ USD 75 million for gender-responsive climate policies (2012–2017). Mexico and Kenya received USD 80 million (2010–2016) and USD 150 million (2008–2014), respectively, for women’s safety and health reforms. Additional efforts include Bangladesh’s USD 300 million Education for All initiative (2000–2015) and Ethiopia’s USD 200 million to empower women farmers (Food and Agriculture Organization, 2016; Kenya National Bureau of Statistics, 2015; United Nations, 2017; World Bank, 2019). These initiatives align with national strategies to promote gender parity and women’s empowerment. |
| 2 | Women’s workforce participation is shaped by factors beyond wages, including workplace conditions, legal protections, social norms, job security, and parental leave policies (World Bank, 2023). Codazzi et al. (2018) emphasize how these non-wage elements significantly impact female labor force engagement. Dahl et al. (2016) show the positive effect of paid maternity leave on women’s workforce attachment. Saha and Singh (2024) note that labor market dynamics like employer discrimination and job security can promote or hinder female participation, especially for highly educated women. |
| 3 | The derived theoretical relationships show that wages (w) for women depend on human capital, the legal framework (Φ), and labor market conditions; legal frameworks (Φ) are influenced by gender-mainstreamed aid (A) and other institutional and cultural factors; and labor force participation (h) is influenced by wages and non-wage factors related to job quality. Thus, gender-mainstreamed aid impacts female labor force participation through its effect on legal frameworks, affecting wages and employment conditions. |
| 4 | By doing so, we ensure that the current value of the WBL Index (WBLit)—which reflects the legal framework—does not directly influence the gender-related aid received in the same period. In other words, using Ait-2 helps prevent the possibility of the prevailing legal framework or its improvements forming the basis for a country receiving higher aid. We also employ the instrumental variable (IV) regression approach for robustness check. |
| 5 | Appendix A Table A1 presents the breakdown of the corresponding measures of legal and regulatory environments facing women by the regional location of the countries in this study. Countries in Europe and Central Asia, Latin America, and the Caribbean have the highest WBL Index scores of 79.86 and 79.12, respectively, indicating more favorable legal and regulatory environments for women. In contrast, the Middle East and North Africa score the lowest at 45.10, highlighting regions where women face more challenging conditions. South Asia also scores relatively low at 57.63, while East Asia, the Pacific, and Sub-Saharan Africa have moderate scores of 71.24 and 68.86, respectively. The overall average for all regions is 69.63, reflecting a wide range of experiences and legal environments impacting women worldwide. Further disparities across the regions can also be gleaned from the components. Mobility is highest, on average, among countries in Europe and Central Asia, scoring a perfect 100, with those in the Middle East and North Africa scoring significantly lower at 51.04. Workplace conditions also vary, with Europe and Central Asia scoring 81.43 and the Middle East and North Africa trailing at 44.79. Pay equity also differs, with Latin America and the Caribbean at 68.95 and the Middle East and North Africa at 35.76. Marriage-related legal conditions are most favorable in Europe and Central Asia (94.76) and least favorable in the Middle East and North Africa (23.47). Parenthood scores show Europe and Central Asia leading at 74.86, while South Asia scores the lowest at 20.40. Business (Entrepreneurship) and asset ownership rights are highest in Europe and Central Asia (90.24 and 100, respectively), with South Asia, the Middle East, and North Africa scoring lower. Pension scores also vary considerably, with the lowest score, 44.8, observed in South Asia. These variations underscore the diverse legal and regulatory landscapes affecting women’s economic opportunities across different regions. |
| 6 | By controlling for the cross-sectional dimension, we account for time-invariant characteristics unique to each country, including geographical factors, cultural aspects, and institutional frameworks characterized by slow changes. This helps to isolate the effects of our variable of interest from the unobserved factors. Controlling for the time dimension enables us to account for global trends and events (e.g., economic cycles, international policies, or technological advancements) that might influence all countries in this study. |
| 7 | We also obtain results using contemporaneous values of gender-related aid to help differentiate between the immediate and lagged effects and provide a more comprehensive understanding of how such aid influences changes in legal and regulatory protections for women over time. However, for brevity, we limit our discussion to results obtained from the lagged values of gender-related aid. |
| 8 | An improvement in the overall WBL Index does not necessarily imply uniform progress across all its components and all countries. For example, India made notable strides in its WBL Index score, improving from 95th in 2010 to 117th in 2020, mainly due to legislative reforms such as the Maternity Benefit (Amendment) Act of 2017, which extended paid maternity leave and mandated crèche facilities (IASPOINT, 2024; World Bank, 2020). Despite these advancements in the parenthood indicator, India still faces significant challenges in areas such as marriage and assets, where discriminatory laws and practices persist (World Bank, 2020). Similarly, in Saudi Arabia, reforms have led to significant improvements in the WBL Index. The country improved its score from 31.1 in 2010 to 70.6 in 2020 following comprehensive legal reforms to increase women’s workforce participation. These reforms included lifting the ban on women driving and changes to guardianship laws, which enhanced women’s mobility and workplace opportunities; however, despite these improvements, women continue to face challenges in areas such as marriage and parenthood due to deeply rooted cultural norms and legal restrictions that limit women’s full economic participation (World Bank, 2020). |
| 9 | For instance, countries with lower initial WBL scores might experience different impacts from gender-related aid than those at the upper end of the WBL score. By providing insights into how aid impacts countries at the different loci of the WBL Index, the analysis may help tailor policies and interventions more to effectively address the specific needs and conditions of countries at different stages of legal and regulatory development. |
| 10 | Apart from the difference in the estimation approach (the quantile fixed effects), the specifications correspond with those presented in columns (b) and (c) of Table 3. |
| 11 | For instance, unobserved factors that influence legal and institutional reforms reflected in the WBL Index, such as changes in political stability, shifts in cultural norms, or the emergence of advocacy movements, may simultaneously affect the allocation of gender-related aid. |
| 12 | To address the reviewer’s suggestion regarding the exclusion restriction assumption, first we regressed maternal mortality rates (the sole instrument) on all control variables in our model (excluding the gender-related aid variables) using contemporaneous values and a fixed-effects panel regression. Residuals from this regression were then tested for their correlation with the WBL Index. The analysis reveals no significant correlation (correlation = 0.017, p = 0.830), suggesting that maternal mortality rates affect the WBL Index exclusively through their impact on gender-related aid. To further strengthen the exogeneity of the instrument, we repeated this analysis using two-period lagged values of maternal mortality rates (t-2). The results were consistent, showing no significant correlation (correlation > 0.012, p > 0.113) between the residuals and the WBL Index in either case. Combined with the strong first-stage regression results (F-statistic > 14.6, p < 0.001), these findings provide robust evidence supporting the validity of maternal mortality rates as an instrument. |
| 13 | One limitation of the IV approach is its reliance on the exclusion restriction assumption, which cannot be formally validated with a single instrument. To address this, we tested the assumption by regressing maternal mortality rates on all control variables (excluding gender-related aid) and examining the correlation between the residuals and the WBL Index. The results showed no significant correlation (e.g., correlation = 0.017, p = 0.830 for contemporaneous values) or for two-period lags (t-2), supporting the validity of the instrument. |
References
- Acemoglu, D., Johnson, S., & Robinson, J. A. (2001). The colonial origins of comparative development: An empirical investigation. American Economic Review, 91(5), 1369–1401. [Google Scholar] [CrossRef]
- Annen, K., & Asiamah, H. A. (2023). Women legislators in Africa and foreign aid. The World Bank Economic Review, 37(1), 1–23. [Google Scholar] [CrossRef]
- Arndt, C., Jones, S., & Tarp, F. (2015). Assessing foreign Aid’s long-run contribution to growth and development. World Development, 69(C), 6–18. [Google Scholar] [CrossRef]
- Bagade, T., Chojenta, C., Harris, M., Oldmeadow, C., & Loxton, D. (2022). The human right to safely give birth: Data from 193 countries show that gender equality does affect maternal mortality. BMC Pregnancy Childbirth, 22, 874. [Google Scholar] [CrossRef] [PubMed]
- Barro, R. J., & Lee, J. W. (2013). A new data set of educational attainment in the world, 1950–2010. Journal of Development Economics, 104, 184–198. [Google Scholar] [CrossRef]
- Berlin, M. P., Bonnier, E., & Olofsgård, A. (2024). Foreign aid and female empowerment. The Journal of Development Studies, 60(5), 662–684. [Google Scholar] [CrossRef]
- Bhalotra, S., Clarke, D., Gomes, J. F., & Venkataramani, A. (2023). Maternal mortality and women’s political power. Journal of the European Economic Association, 21(5), 2172–2208. [Google Scholar] [CrossRef]
- Bicchieri, C., & Xiao, E. (2009). Do the right thing: But only if others do so. Journal of Behavioral Decision Making, 22(2), 191–208. [Google Scholar] [CrossRef]
- Busse, M., Hoekstra, R., & Osei, R. D. (2017). The effectiveness of aid in improving regulations: An empirical assessment. South African Journal of Economics, 85(3), 368–385. [Google Scholar] [CrossRef]
- Cameron, L., Contreras Suarez, D., & Cornwell, K. (2019). Understanding the determinants of maternal mortality: An observational study using the Indonesian Population Census. PLoS ONE, 14(6), e0217386. [Google Scholar] [CrossRef]
- Codazzi, K., Pero, V., & Sant’Anna, A. A. (2018). Social norms and female labor participation in Brazil. Review of Development Economics, 22(3), 1159–1181. [Google Scholar] [CrossRef]
- Dahl, G. B., Løken, K. V., Mogstad, M., & Salvanes, K. V. (2016). What is the case for paid maternity leave? The Review of Economics and Statistics, 98(4), 655–670. [Google Scholar] [CrossRef]
- Donno, D., Fox, S., & Kaasik, J. (2022). International incentives for women’s rights in dictatorships. Comparative Political Studies, 55(3), 451–492. [Google Scholar] [CrossRef]
- Dreher, A., Fuchs, A., Hodler, R., Parks, B., Raschky, P., & Tierney, M. J. (2016). Aid on demand: African leaders and the geography of China’s foreign assistance (AidData Working Paper No. 3, revised). AidData. SSRN. [Google Scholar] [CrossRef][Green Version]
- Duflo, E. (2012). Women empowerment and economic development. Journal of Economic Literature, 50(4), 1051–1079. [Google Scholar] [CrossRef]
- European Institute for Gender Equality (EIGE). (2018). Institutional mechanisms for the advancement of women. Available online: https://eige.europa.eu (accessed on 18 August 2024).
- Ferrant, G., Pesando, L. M., & Nowacka, K. (2014). Unpaid care work: The missing link in the analysis of gender gaps in labor outcomes. OECD Publishing. Available online: https://doi.org/10.1787/1f3fd03f-en (accessed on 18 August 2024). [CrossRef]
- Gonzales, C., Jain-Chandra, S., Kochhar, K., Newiak, M., & Zeinullayev, T. (2015). Fair play: More equal laws boost female labor force participation. IMF Staff Discussion Note. Available online: https://www.imf.org (accessed on 18 August 2024).
- Food and Agriculture Organization. (2016). Ethiopia’s agricultural transformation agenda. Available online: http://www.fao.org/ethiopia/news/detail-events/en/c/460776/ (accessed on 12 August 2024).
- Gygli, S., Haelg, F., Potrafke, N., & Sturm, J.-E. (2019). The KOF Globalization Index—Revisited. Review of International Organizations, 14(3), 543–574. [Google Scholar] [CrossRef]
- Hall, R. E., & Jones, C. I. (1999). Why do some countries produce so much more output per worker than others? Quarterly Journal of Economics, 114(1), 83–116. [Google Scholar] [CrossRef]
- Hallward-Driemeier, M., & Gajigo, O. (2015). Strengthening economic rights and women’s occupational choice: The impact of reforming Ethiopia’s family Law. World Development, 70(C), 260–273. [Google Scholar] [CrossRef]
- Hallward-Driemeier, M., Hasan, T., & Rusu, A. B. (2013). Women’s legal rights over 50 years: What is the impact of reform? (Policy Research Working Paper No. 6617). World Bank. Available online: https://hdl.handle.net/10986/16318 (accessed on 17 August 2024).
- IASPOINT. (2024). India climbs to 113th position in World Bank’s women, business and law index 2023. Available online: https://iaspoint.com (accessed on 25 August 2024).
- Inglehart, R., & Norris, P. (2003). Rising tide: Gender quality and cultural change around the world. Cambridge University Press. [Google Scholar]
- International Monetary Fund (IMF). (2022). Tackling legal impediments to women’s economic empowerment. Available online: https://www.imf.org/en/Publications/WP/Issues/2022/02/18/Tackling-Legal-Impediments-to-Womens-Economic-Empowerment-513392 (accessed on 21 January 2025).
- Islam, A., Gaddis, I., López, A. P., & Amin, M. (2020). The labor productivity gap between formal businesses run by women and men. Feminist Economics, 26(4), 228–258. [Google Scholar] [CrossRef]
- Jayachandran, S. (2015). The Roots of Gender Inequality in Developing Countries. Annual Review of Economics, 7, 63–88. [Google Scholar] [CrossRef]
- Kabeer, N. (2005). Gender equality and women’s empowerment: A critical analysis of the third millennium development goal. Gender and Development, 13(1), 13–24. [Google Scholar] [CrossRef]
- Kaufmann, D., Kraay, A., & Mastruzzi, M. (2021). The Worldwide Governance Indicators (WGI) project. World Bank. Available online: https://info.worldbank.org/governance/wgi/ (accessed on 10 September 2024).
- Kenya National Bureau of Statistics. (2015). Kenya demographic and health survey 2014. Available online: https://dhsprogram.com/pubs/pdf/FR308/FR308.pdf (accessed on 12 December 2024).
- Klasen, S., & Lamanna, F. (2009). The impact of gender inequality in education and employment on economic growth: New evidence for a panel of countries. Feminist Economics, 15(3), 91–132. [Google Scholar] [CrossRef]
- Kleven, H., Landais, C., & Søgaard, J. E. (2019). Children and gender inequality: Evidence from Denmark. American Economic Journal: Applied Economics, 11(4), 181–209. [Google Scholar] [CrossRef]
- Klugman, J., Hanmer, L., Twigg, S., Hasan, T., McCleary-Sills, J., & Santamaria, J. (2014). Voice and agency: Empowering women and girls for shared prosperity. World Bank Publications. Available online: https://openknowledge.worldbank.org (accessed on 17 July 2024).
- Koester, D., Esplen, K., Barnes, R., Castillejo, C., & O’Neil, T. (2016). How can donors improve their support to gender equality in fragile settings? Findings from oecd research. Gender & Development, 24(3), 353–373. [Google Scholar]
- Machado, J. A. F., & Silva, S. (2019). Quantiles via Moments. Journal of Econometrics, 213(1), 145–173. [Google Scholar] [CrossRef]
- Minasyan, A., & Montinola, G. (2022). Gendered aid and women’s rights. SSRN. Available online: https://papers.ssrn.com/sol3/papers.cfm?abstract_id=4433969 (accessed on 17 July 2024).
- North, D. C. (1990). Institutions, institutional change, and economic performance. Cambridge University Press. [Google Scholar]
- OECD. (2021). Aid in support of gender equality and women’s empowerment. Available online: https://www.oecd.org (accessed on 12 December 2024).
- Pickbourn, L., & Ndikumana, L. (2016). The impact of the sectoral allocation of foreign aid on gender inequality. Journal of International Development, 28(3), 396–411. [Google Scholar] [CrossRef]
- Potrafke, N., & Ursprung, H. W. (2012). Globalization and gender equality in the course of development. European Journal of Political Economy, 28(4), 399–413. [Google Scholar] [CrossRef]
- Saha, T., & Singh, P. (2024). Political and institutional dynamics of global female labor force participation: Discovering the role of women political participation. Sustainable Development. [Google Scholar] [CrossRef]
- Schultz, T. P. (2002). Why governments should invest more to educate girls. World Development, 30(2), 207–225. [Google Scholar] [CrossRef]
- True, J., & Mintrom, M. (2001). Transnational networks and policy diffusion: The case of gender mainstreaming. International Studies Quarterly, 45(1), 27–57. [Google Scholar] [CrossRef]
- UNDP. (2016). Strengthening the rule of law in crisis-affected and fragile situations. Available online: https://www.undp.org (accessed on 12 December 2024).
- UNDP. (2022). Human Development Index (HDI) and other composite indices (1990–2022). Available online: https://hdr.undp.org/data-center/human-development-index (accessed on 21 January 2025).
- United Nations. (2017). Fourth world conference on women, Beijing 1995. United Nations. Available online: https://www.un.org/en/conferences/women/beijing1995women/beijing1995 (accessed on 17 July 2024).
- World Bank. (2019). Bangladesh education sector review. Available online: https://www.worldbank.org/en/country/bangladesh/publication/education-sector-review (accessed on 12 December 2024).
- World Bank. (2020). Women, business, and the law 2020. Available online: https://openknowledge.worldbank.org/server/api/core/bitstreams/6c2b5974-9a3b-5249-995b-2b22e5fd7909/content (accessed on 12 December 2024).
- World Bank. (2022). Accelerating gender equality through reforming legal frameworks. Available online: https://documents1.worldbank.org/curated/en/099758006132310429/pdf/IDU04bef0153039c304a680b9e501b0b599ba039.pdf (accessed on 12 December 2024).
- World Bank. (2023). Women, business, and the law 2023. Available online: https://openknowledge.worldbank.org/server/api/core/bitstreams/b60c615b-09e7-46e4-84c1-bd5f4ab88903/content (accessed on 12 December 2024).
- World Bank. (2024). Women, business, and the law 2024: A decade of reform. The World Bank. Available online: https://wbl.worldbank.org/en/reports (accessed on 12 December 2024).

Disclaimer/Publisher’s Note: The statements, opinions and data contained in all publications are solely those of the individual author(s) and contributor(s) and not of MDPI and/or the editor(s). MDPI and/or the editor(s) disclaim responsibility for any injury to people or property resulting from any ideas, methods, instructions or products referred to in the content. |
© 2025 by the authors. Licensee MDPI, Basel, Switzerland. This article is an open access article distributed under the terms and conditions of the Creative Commons Attribution (CC BY) license (https://creativecommons.org/licenses/by/4.0/).