Article

Assessment of Socio-Economic Impacts of Hyperloop Technology on European Trade Routes

by
Aleksejs Vesjolijs
1,
Yulia Stukalina
1,* and
Olga Zervina
2
1
Transport and Telecommunication Institute, Accenture, 1 Grand Canal Square, D02 P820 Dublin, Ireland
2
Transport and Telecommunication Institute, 2 Lauvas street, LV-1019 Riga, Latvia
*
Author to whom correspondence should be addressed.
Economies 2025, 13(3), 65; https://doi.org/10.3390/economies13030065
Submission received: 6 January 2025 / Revised: 8 February 2025 / Accepted: 19 February 2025 / Published: 1 March 2025
(This article belongs to the Section International, Regional, and Transportation Economics)

Abstract

:
This study investigates the possible socio-economic impacts of Hyperloop technology on establishing and reshaping EU trade routes. Hyperloop—a novel ultra-high-speed transportation system—demonstrates the capability to achieve supersonic speeds to move cargo and passengers. Delivering goods in a faster and sustainable way could change the existing trade routes and offer new opportunities for the development of international trade. This research focuses on assessing how Hyperloop may influence existing EU trade routes by improving delivery times and reducing energy usage/carbon emissions (these terms will be used interchangeably throughout the paper where both reducing long-terms costs and meeting climate goals are equally impacted by this technology). Further objectives include evaluating potential new trade routes that could emerge due to Hyperloop’s capabilities. In this paper, twelve different scenarios are constructed and compared; these scenarios contain the description of current EU trade routes that could be influenced by Hyperloop and those that could be introduced given the improved delivery times and sustainable business opportunities. The gravity model is proposed and an equation is estimated using the PPML (Poisson Pseudo Maximum Likelihood) method based on Eurostat and IMF open data. Based on the research results, different socio-economic outcomes for different layers of EU trade, including negative and positive impacts, are identified. The findings suggest that deploying Hyperloop technology would result in a 15% increase in exports and a 10% increase in imports for European trade. Both positive and negative socio-economic impacts are identified, highlighting the complexities of adopting such a disruptive technology. The research results could be used in the process of decision-making for estimating risks and performing economic analysis on various aspects of the EU trade policy. The study results could also guide EU decision-makers in assessing the main impacts of Hyperloop technology on the transportation industry, on the environment, and on society, in the context of further developing EU trade routes.

1. Introduction

Hyperloop transportation technology—introduced in 2012 by (Tesla, 2012)—was designed to use near-vacuum tubes where unmanned autonomous capsules are transported at near-supersonic speeds using levitation (Bajor, 2024). Fully autonomous pods (capsules) are able to reach the Kantrowitz limit—1223 km/h—i.e., top speed, without compromising sustainability. However, at higher speeds, the energy efficiency significantly drops (Borghetti, 2023). Overall, this technology is considered to be close to zero-emission and carbon-neutral. Recent studies showed that Hyperloop can be distinct as the fifth standalone transportation mode due to its unique features and characteristics that make it different from air and railway transportation (Ali-Yrkkö & Kuusi, 2020). Currently, there are more than 20 standalone Hyperloop projects in the EU, reflecting a growing interest in this innovative transportation solution (Imamkulieva & Kondakova, 2022). Key features of the new transportation mode are its ultra-high-speed velocity and near carbon neutrality. Since 2012, the technology has met the standards of TRL6 (technology validated in the test environment) (Gkoumas & Christou, 2020; Horizon, 2020). However, since the start of 2025, there has been no deployed commercial version of Hyperloop technology.
In 2023–2024, Hyperloop technology received recognition from the European Union. An EU regulatory framework proposal was announced in 2023, and intentions for its adoption are highlighted in the European Parliament’s new plan for Europe’s sustainable prosperity and competitiveness (PAR, 2025). The development of strategies for Hyperloop implementation and promotion was prioritized by the European Commission in September 2024 (COM, 2024). This event influenced the European Hyperloop industry, resulting in the joint efforts of multiple Hyperloop vendors. Several projects have demonstrated a tendency to form new industry associations separate from the existing ones. Some Hyperloop projects have been reintroduced. For example, the main Spanish Hyperloop developer Zeleros (Zeleros, 2025) fully returned to the industry after nearly a year of uncertainty about the project’s future. Then, Nevomo (Poland) (Nevomo, 2025), TUM Hyperloop (Germany) (TUM, 2025) and Swisspod (Switzerland) (Swisspod, 2025) conducted successful Hyperloop test runs, positively influencing the TRL. Swisspod demonstrated technology robustness and failsafe features, building its new track in Colorado (Swisspod, 2025), while TUM were able to transport passengers in a test run (TUM, 2023). The Nevomo project has successfully validated MagRail (Nevomo, 2025) technology. Further, the German Institute of Hyperloop Technology from Emden-Leer deployed a Hyperloop testing track, which is already being used by other Hyperloop projects (IHT, 2025). Overall, 2024 was successful for the Hyperloop industry in policy development and technical advancement perspectives.
Trade has been the driver of advancements in civilization since the Ancient World’s first trade agreements. The impact of trade on human lives is colossal, ranging from wealth and quality of life to survival (Stryhunivska et al., 2020). In the Ancient World, Greek and Phoenician civilizations were built around trade. The term commerce originated in the slave trade, impacting the social and cultural background of nations. Often, trade commutes meant changes in the geographical landscape (Rumin et al., 2019). Rivers were forced to change flow and water reservoirs poured to allow better trade conditions in the Medieval Era. Trade routes significantly impacted urban and rural planning, which ultimately led to the founding of new settlements and outposts to facilitate their needs.
The arrival of European civilizations in the New World in the 15th century was motivated by trade and commerce. The international tea and coffee trade in the 18th and 19th centuries led to changes in international borders (Werner et al., 2016). Interestingly, at that time, there was no transportation mode faster than a horse. The later introduction of railways changed how goods flowed on a global scale and in international markets (Premsagar, 2023). Even small changes in a nation’s trade can lead to significant effects on a single human life, the nation, and even the geographic landscape.
Given the recent changes in the Hyperloop industry, the question has arisen as to how the technology’s eventual commercial use will impact EU trade routes and whether these changes will be positive or negative (Hsu et al., 2021). Transporting passengers and cargo at 1223 km/h has the potential to revolutionize the way we transport people and goods. It is faster than air (900 km/h) and rail (450 km/h) transportation modes (Armağan, 2020). Aside from its impressive velocity, Hyperloop has the potential to achieve zero-emissions and bring a carbon-free transportation solution to fruition. This study critically evaluated positive and negative socio-economic impacts of Hyperloop technology on EU trade routes. A complex Hyperloop infrastructure will include nodes, logistics centers, terminals, and many other facets. However, this study focuses on the investigation of its trade routes paths.
While Hyperloop technology projects promised ultra-high-speed, carbon-neutral transport for both cargo and passengers, there is limited empirical evidence on how its deployment would specifically influence EU import and export volumes or reshape existing trade routes (Ma et al., 2022). Without a quantitative, data-driven understanding of these potential changes, policymakers, industry stakeholders, and researchers lack the necessary insight to evaluate the economic feasibility, logistical benefits, and risks associated with integrating Hyperloop into European trade infrastructure (E. Polak & W. Polak, 2017). This gap in knowledge is a barrier for the effective decision-making regarding investments, regulations, and long-term strategic planning for Hyperloop adoption (Premsagar, 2022).
The research question formulated by the authors is as follows: How would the introduction of Hyperloop technology affect existing European Union trade routes, and what are the primary socio-economic impacts anticipated from its deployment?
Accordingly, the main research goal is to assess the socio-economic impacts of deploying Hyperloop technology, estimating changes in import/export volumes, trade route restructuring, and the broader economic and social implications for the European Union.

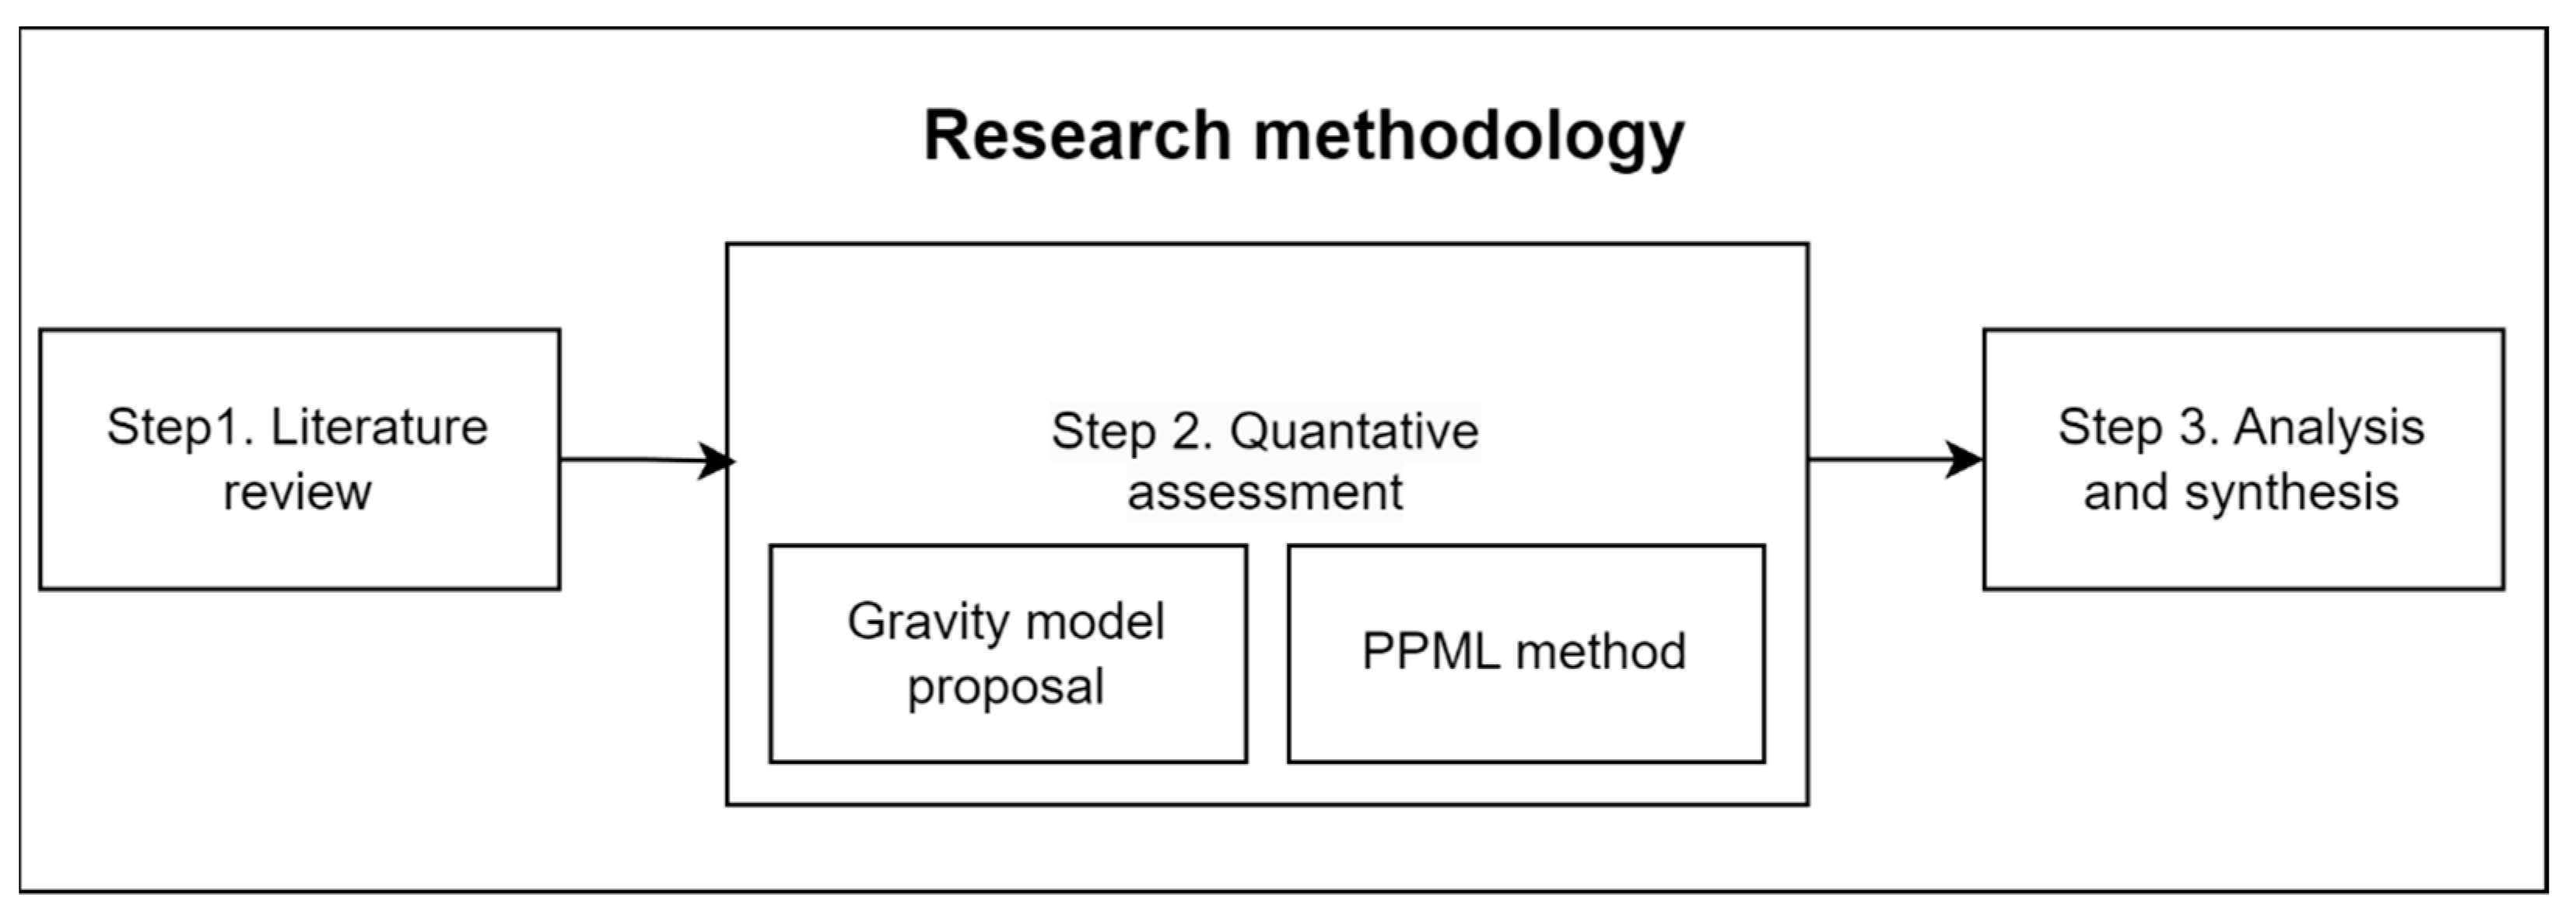
2. Materials and Methods

To identify the socio-economic impacts of Hyperloop technology on EU trade routes, research methodology depicted in Figure 1 is proposed. It should be noted that the conducted research is multidisciplinary in nature, covering economics and logistics disciplines.
The research methodology was designed in three interlinked steps—(1) literature review, (2) quantitative assessment, and (3) analysis and synthesis—aimed at systematically capturing the socio-economic implications of Hyperloop deployment on European trade routes. This structure followed a logical progression from theoretical contextualization to synthesis and interpretative insights.
In the first step, existing studies and data sources were analyzed to establish the current knowledge on Hyperloop’s socio-economic impact and strategies for evaluating transportation’s impacts on trade routes. The literature review surveyed peer-reviewed articles, industry reports, and policy documents on Hyperloop technology, including its engineering principles, cost projections, and anticipated advancements. This examination also covered studies on existing high-speed transport modes (rail, air) and their socio-economic effects, thereby discussing potential parallels and methodological considerations for analyzing Hyperloop. Emphasis was placed on identifying research gaps related to Hyperloop’s environmental impacts and its logistical feasibility in European contexts. The outcome of this step set the theoretical and conceptual grounding for the quantitative modeling phase.
In the second step, a quantitative assessment was conducted using a gravity model framework augmented by the Poisson Pseudo Maximum Likelihood (PPML) method. Quantitative assessment formed the core of the methodology to evaluate micro- and macro- impacts. A gravity model—commonly used in international trade studies—was adapted to incorporate potential Hyperloop variables.
This study primarily seeks to define how much trade flows would change under different scenarios of Hyperloop deployment given known reductions in transit times and energy usage. The standard empirical practice for capturing trade-cost-driven effects is the gravity model (Anderson & van Wincoop, 2003). This is a cross-sectional study on bilateral flows, which is precisely what the gravity framework was developed to address (Head & Mayer, 2014). PPML then provides consistent estimates of the marginal effects of improved connectivity on trade, which aligns perfectly with our aim of quantifying trade changes due to a disruptive transport technology—Hyperloop—which is at a TRL6.
System dynamics (SD) is supposed to be well-suited for capturing feedback mechanisms and long-term policy adjustments in the dynamic system evolution (Forrester, 1990), but its focus on time-dependent behavior and endogenous loops does not align with this study’s aim of estimating trade impacts. Those second-order dynamic interactions (e.g., technology diffusion, investment cycles, feedback on system behavior, etc.) are beyond the immediate impacts this study aimed to quantify. According to (Forrester, 1961), SD is not designed for static trade comparisons; SD models emphasize how policies and decisions interact over time, rather than evaluating the comparative static impacts of a policy at a fixed point in time. To summarize, the current research focuses on impact assessment, not dynamic system evolution.
Key variables were reduced transit times and lower energy usage. Data from open access sources (Eurostat, IMF) were utilized to populate parameters on bilateral trade flows, GDP, distance, and other relevant trade cost factors for preliminary analysis prior to the definition of exact variables for calculations. Scenarios enabled the capture of both optimistic and conservative estimations simulating differing levels of Hyperloop adoption (e.g., partial versus extensive network coverage). The PPML estimation method was chosen to address exploratory analysis issues in trade flow data, thus enhancing model reliability. The outcomes quantify how import and export volumes could shift across multiple EU routes under Hyperloop’s influence, providing a data-driven perspective on trade route reconfigurations.
The results from the gravity model were critically examined and compared against the insights gleaned from the literature review at the analysis and synthesis phase. Key metrics, i.e, projected growth in import/export volumes, changes in carbon emissions, and shifts in trade corridors, were Madrid–Paris, Barcelona–Munich, Lyon–Milan, Rotterdam–Düsseldorf, Berlin–Warsaw, Paris–Vienna–Bucharest–Sofia, Milan–Vienna–Munich, Paris–Brussels–Cologne, Madrid–Lisbon, Stockholm–Copenhagen–Hamburg, Pan-EU Network, and Warsaw–Vilnius–Riga–Tallinn. By comparing different scenarios, it became possible to identify areas of heightened socio-economic benefit and potential negative effects (e.g., displacement of existing transport sectors). The synthesis consolidated these findings into a coherent narrative on the viability and consequences of Hyperloop deployment, offering recommendations for EU policymakers, industry stakeholders, and future research directions. Ultimately, the proposed approach allows authors to refine the understanding of Hyperloop’s role in shaping next-generation European trade routes by combining multidisciplinary qualitative (literature-based) and quantitative (model-based) insights.

3. Literature Review

A literature review was conducted using the PRISMA method (Page et al., 2021). The research methodology for the literature review is presented in Figure 2.
The PICO framework was used to identify the research problem (Richardson et al., 1995), focusing on the population (trade routes), intervention (Hyperloop technology), comparator (other transport modes), and outcomes (socio-economic impacts). A systematic search strategy was developed to identify the relevant literature. Advanced search queries using Boolean operators and field-specific tags were executed in multiple databases, including Scopus, Web of Science, and IEEE Xplore (Table 1). The strategy was iteratively refined to cover the most relevant results, to identify the research problems, and to address the main research goal.
By applying PRISMA method, 53 studies were identified for further processing. Table 2 provides a consolidated overview of the literature review results supporting the assessment of potential socio-economic impacts of Hyperloop technology on European trade routes. Each row corresponds to a thematic category and highlights key findings related to Hyperloop’s potential influence on areas—transit times, energy usage, industrial development, and regulatory frameworks. References are listed for each category to demonstrate the variety of academic work supporting or illustrating those findings. Taken together, these categories capture the multifaceted nature of Hyperloop’s prospective role in reshaping trade patterns, boosting competitiveness, and contributing to environmental objectives within the European Union. Impacts are highlighted with the I<number> pattern and are used in the analysis.
The aim of the following analysis iteration is to derive impact categories and estimate effects based on the literature review results. Impact categories and their effects are shown in Table 3. In total, 25 impact categories are derived from the key findings (Table 2) and are further refined with impact ID assigned. Impact ID contributes to the transparency of mapping how each category was created.
Summary: The literature review results highlighted the evaluation of changes in import/export flows and potential GDP changes as the main criteria for impact assessment. Further, the results showed complex and multifaceted socio-economic impacts of Hyperloop technology on European trade routes. For better results, granulation research provided the following dimensions of socio-economic impacts: financial, logistical, environmental, and policy. Studies suggested that Hyperloop enhances supply chain efficiency through reduced transit times (I1) and improved delivery reliability (I2) while enhancing global competitiveness for the EU (I4). Furthermore, the carbon-neutral operations of Hyperloop are aligned with decarbonization goals (I7), offering potential for green logistics and reducing energy usage (I9). However, the transformative nature of Hyperloop raises the possibility of reshaping trade routes (I5, I6) and altering trade balances between economies, presenting both opportunities and challenges.
The construction of Hyperloop infrastructure requires significant land acquisition. Land acquisition can lead to land alienation, especially in vulnerable regions and/or in rural areas. Research conducted by Ding et al. (2023) mentioned that large-scale infrastructure projects require extensive land use. This might result in the displacement of local communities and disruption of agricultural activities. It aligns with findings (Jiang et al., 2020) that discuss how transportation projects can lead to conflicts over land rights, particularly in rural areas where communities depend on land for their livelihoods.
The introduction of Hyperloop technology could deepen regional disparities. Ferrari et al. (2023) argue that while urban areas may benefit from improved connectivity and economic opportunities, rural regions may experience economic decline and increased marginalization due to the concentration of resources and investments in urban centers. This concern (D. Yang et al., 2018) emphasizes that transportation advancements can lead to uneven economic growth, favoring regions directly served by new infrastructure while neglecting others.
It should be noted that the results of this study are also indicative of some negative effects of Hyperloop technology, including job displacement (I23, I24), land alienation (I24), centralization, and regional disparities (I25) and others.
A critical research gap emerged regarding the empirical assessment of Hyperloop’s socio-economic impacts, particularly in the European context. Existing studies extensively addressed high-speed transport modes and their economic implications, but limited attention has been given to disruptive technologies like Hyperloop. Additionally, the integration of Hyperloop into policy frameworks and its role in shifting trade alliances (I19) requires further exploration. These gaps underscored the need for quantitative methodologies to evaluate impact.
To address these complexities, the literature identified the Poisson Pseudo Maximum Likelihood model as an econometric tool suitable for analyzing trade flows and the impacts of reduced transportation costs and times and forecasting. The model’s ability to account for zero trade flows and flexible parametrization made it suitable for isolating the direct and indirect effects of Hyperloop adoption on EU trade patterns. By incorporating scenario-based simulations, the PPML model could capture the projection of trade volume shifts (I14) and GDP impacts (I10). This review confirmed that Hyperloop technology holds transformative potential for the EU trade routes but requires quantified assessment for forecasting. This advancement has the potential to support policymakers and industry stakeholders to evaluate Hyperloop’s implementation viability from positive and negative perspectives and guide strategic decisions, ultimately contributing to global sustainable trade and EU competitiveness.

4. Empirical Assessment of Hyperloop’s Socio-Economic Impacts: Results and Discussion

In this section, the authors present and discuss the results of the empirical assessment of the possible socio-economic impacts of Hyperloop technology on reshaping EU trade routes.
Results: The PPML model—as applicable to the Hyperloop domain—was chosen to address the research question. The classic PPML model equation that can be used to understand impacts on trade between two countries is presented below.
l n   l n   T r a d e i j , t = α 0 + α 1 l n   l n   G P D i + α 2 l n   l n   G P D j + α 3 l n   l n   D i s t a n c e i , j + i j , t
where T r a d e i j , t is the export or import flow from country i to j in year t; i j , t is the error term. To capture the effect of Hyperloop on the European trade routes, new variables were introduced, and the baseline PPML specification for calculating export is as follows:
T r a d e i j , t = e x p   e x p   ( β 0 + β 1 l n   l n   G P D i , t + β 2 l n   l n   G P D j , t + β 3 l n   l n   D i s t a n c e i , j + β 4 H L i j , t + β 3 l n   l n   T i m e R e d u c t i o n i j , t + 1 + ) +   i j , t
where T r a d e i j , t is the export or import flow from country i to j in year t; β 4 and β 5 capture effect of potential Hyperloop connectivity on trade flows; e x p   e x p   (   ) means the exponential link for PPML is used; i j , t is the error term. Following the research goal, a comparison between state-of-the-art transportation modes utilized for specific scenarios must be evaluated against the use of Hyperloop. The GDP amount is a fixed value and thus does not affect the relative (percent) difference between currently used transportation modes (further, baseline) and Hyperloop. Therefore, it could be omitted from the calculation formula, and instead, exact arguments which allow for capturing relative differences were defined for comparison.
In order to quantify the potential impacts of Hyperloop technology on European trade, 12 scenarios were proposed. Initial data for each corridor are shown in Table 4, corresponding to the technical specification for Hyperloop TRL9 according to technical specification by (Tesla, 2012). According to (Horizon, 2020), the lowest technical readiness level is TRL1 (basic principles observed) and the highest is TRL9 (system proven in an operational environment) (Horizon, 2020).
The second set of values was for Hyperloop at current state-of-the-art speeds according to TRL achievements, i.e., TRL6 (technology validated in a relevant environment) (Horizon, 2020). These refer to operational speeds in the range between 600 and 1000 km/h (UNStudio, 2018). However, according to primary source data from the European Hyperloop Week 2023, the current operational speed is in the range between 350 and 500 km/h. This aspect will be improved in the future; however, for realistic outcomes right now, it is better to rely on these numbers. Therefore, an additional set of input data was produced (Table 5).
The next step was to predict exact numbers which would be used for export formula (2) calculation, as the data provided in the sources have values in various ranges. The Monte Carlo simulation method was chosen because this approach includes uncertainty in parameter estimations rather than relying on deterministic or single-point values due to a min-max range in source data. This method was employed by repeatedly sampling probability distributions (Beta-PERT) that capture realistic ranges (min–max) and the most likely values (mode) (Cinnirella & Pirrone, 2013; Gavrilin & Steen, 2017). Within the scope of this study, an empirical distribution of possible outcomes was determined for the following key variables: speed, emissions, and energy consumption. This approach produced the best estimates, typically taken as the mean of the simulated samples, and it also allowed us to quantify the extent of variability through percentile measures (P5, P95) (Yang, 2011). The results of Monte Carlo simulations using Beta-PERT are shown in Table 6 for TRL9.
Results of Monte Carlo simulations using Beta-PERT are shown in Table 7 for TRL6.
Changes in import/export volumes are shown as relative percentages through the impact estimation of Hyperloop technology deployment to specific trade routes and through comparison with existing transportation modes (baseline).
The impact estimation formula for evaluating the baseline transportation coefficient developed by the authors is presented below:
φ i j , t B L = e x p   e x p   ( α 0 + α 1 l n   l n   D i , t + α 2 l n   l n   σ i j B L + α 3 l n   l n   τ i j B L + 1 + α 4 l n   l n   k i j B L + 1 + α 5 l n   l n   μ i j B L + 1 )
where φ i j , t B L is the baseline transportation efficiency coefficient; D i , t is distance; σ i j B L is baseline transportation speed; τ i j B L is baseline transit time; k i j B L is baseline CO2 emissions; μ i j B L is baseline energy consumption; α 0 α 5 are regression coefficients.
The impact estimation formula for the evaluation of the Hyperloop transportation mode coefficient developed by the authors is given below:
φ i j , t H L = e x p   e x p   ( α 0 + α 1 l n   l n   D i , t + α 2 l n   l n   σ i j H L + α 3 l n   l n   τ i j H L + 1 + α 4 l n   l n   k i j H L + 1 + α 5 l n   l n   μ i j H L + 1 )
where φ i j , t H L is the Hyperloop transportation efficiency coefficient; D i , t is distance; σ i j H L is Hyperloop transportation speed; τ i j H L is Hyperloop transit time; k i j H L is Hyperloop CO2 emissions; μ i j H L is Hyperloop energy consumption; α 0 α 5 are regression coefficients.
The relative percentage difference between baseline and Hyperloop identified by the authors is as follows:
i j ( % ) = φ i j , t H L φ i j , t B L φ i j , t B L
where i j is percentage difference; φ i j , t H L is Hyperloop transportation efficiency coefficient; φ i j , t B L is baseline transportation efficiency coefficient.
For calculating formulas, a special program was developed using the Python programming language (Python, 2025); the code is available in the Supplementary Materials section. The results of changes in transportation mode efficiency on a specific route after the implementation of Hyperloop technology are presented in Figure 3; detailed results are also available in the Supplementary Materials Section.
Discussion: The average value of trade route efficiency improvement was 87.58% for Hyperloop-TRL6 if the transition were to happen given the current state of development. However, transition to the technology at its full potential at TRL9 showed an additional 26.75% improvement, reaching 117.52% for Hyperloop-TRL9. The improvement in results at TRL9 was due to its superior operational parameters, higher average speeds (877.96 km/h at TRL9 versus 432.30 km/h at TRL6), reduced average travel times, and reduced environmental footprint in terms of CO2 and energy consumption.
The efficiency gains observed across scenarios revealed corridor-specific dynamics. The results showed a potential increase in trade route efficiency from 59.41% (TRL6) to 117.52% (TRL9) by switching to the Hyperloop transportation mode. Interestingly, the most efficient TRL9 route transition would be S3 (Barcelona–Munich, distance approx. 1500 km), with an improvement of 117.52%. On the contrary, S1 (Pan-EU Network, distance approx. 6000 km) could be the least efficient, with an improvement of 100.83%. This is due to a better interplay of transportation speed versus energy spent, more complex connection points, and technical engineering factors. However, the difference in S2 and S6 was less for TRL9.
The optimal route for Hyperloop is circa 1500 km according to the original Alpha Paper (Tesla, 2012), especially in terms of energy efficiency. Also, according to (Siemenn et al., 2023), the energy utilization of Hyperloop systems could vary with distance due to the dynamics of propulsion and the need for acceleration and deceleration phases, which have different impact on routes over longer distances.
Hyperloop technology is fundamentally reliant on a variety of subsystems to achieve its operational goals, as highlighted in the original technology specification (Tesla, 2012). These subsystems include the vacuum system, which minimizes air resistance; the tube infrastructure that supports the pods; the pods themselves, which are designed for aerodynamic efficiency; and the evacuation mechanisms that maintain the low-pressure environment necessary for optimal performance (Sakowski, 2016; Kale, 2019).
Critically, this reliance introduced uncertainty for the technological landscape of the Hyperloop domain, because if any of the technology is replaced, then the whole background is impacted; thus, efficiency at TRL9 could be different. Changes could happen to the effects of the socio-economic impacts shown in Table 3, for example, if parts of the Hyperloop subsystems were repurposed or restricted to use under changes in EU regulations or if they became part of strategic imports, which would limit their use and affect the costs of technology transition.
The findings of an empirical approach with the application of a custom PPML model and Monte Carlo simulations showed the potential of higher technological maturity in enabling economic and environmental benefits for EU trade routes. The input variables presented a direct impact on route efficiency and highlighted the necessity to consider the technology’s multidisciplinary nature during the transition of EU trade routes to Hyperloop technology. Hyperloop is a strong driver of the evolution of sustainable transport.

5. Conclusions

In this paper, the main socio-economic impacts anticipated from the deployment of Hyperloop on European trade routes have been categorized into 23 impact categories based on existing research. Each category has been assigned a unique ID and mapped to the corresponding positive or negative effect.
The assessment results presented in this paper have allowed the authors to provide an answer to the research question and accomplish the research goal. The data for the empirical study have been gathered using Eurostat; IMF and input variable values have been derived using the gravity-model framework and Monte Carlo simulation (BE-TA-Pert), with n_sample = 10,000.
This study has proposed using impact the estimation formulas φ i j , t B L (3) and φ i j , t H L (4) for assessing the socio-economic effects. A special Python application has been shown to run Monte Carlo simulations and calculate the impacts. Estimated changes in import/export volumes are shown as relative percentages and were calculated through efficiency comparison of existing transportation modes against Hyperloop deployment at TRL6 or TRL9.
It has been estimated that changes following the deployment of Hyperloop at TRL6 and TRL9 to EU trade routes have a potential to achieve 87.58% and 114.35%, correspondingly, based on mean values from 12 scenarios. This study has covered the following trade corridors: Madrid–Paris, Barcelona–Munich, Lyon–Milan, Rotterdam–Düsseldorf, Berlin–Warsaw, Paris–Vienna–Bucharest–Sofia, Milan–Vienna–Munich, Paris–Brussels–Cologne, Madrid–Lisbon, Stockholm–Copenhagen–Hamburg, Pan-EU Network, and Warsaw–Vilnius–Riga–Tallinn.
The synthesis analysis performed in this paper confirms that the integration of Hyperloop systems has the potential for significant efficiency gains compared to current transportation modes, particularly when the technology reaches higher levels of maturity (TRL9). The efficiency gap between TRL6 and TRL9 underscores the importance of continued technological advancement in the Hyperloop domain.
Outcomes derived from the gravity model framework and Monte Carlo simulations suggest that Hyperloop could lead to positive shifts in EU trade patterns. EU trade patterns are subject to change due to the socio-economic impacts of the transition to Hyperloop technology, which offers route distances different from conventional transportation modes. The socio-economic impacts may be both positive and negative in nature; consequently, they should be carefully evaluated by the decision-makers.
A few challenges and uncertainties have been identified in this paper as well. The technological complexity of Hyperloop necessitates policy coordination and regulatory frameworks across multiple EU jurisdictions. Potential geopolitical shifts, variations in member state priorities, and differences in fiscal capacities could have negative consequences on Hyperloop’s adoption by the EU Member States. Further interdisciplinary research that integrates engineering, economics, environmental science, and public policy perspectives is required.
The proposed custom model for the empirical evaluation of Hyperloop technology impacts could be further refined into a framework and used by decision-makers.
The following limitations may influence the outcomes and conclusions of the conducted research.
This study does not cover the effect of the EU trade route transition to the Hyperloop transportation mode on specific countries’ GDP, and it does not take granular socio-economic data into consideration. This research does not produce any exact financial export/import values in currency representation. Trade route scenarios are limited by internal EU trade routes only and do not include international trade routes.
Psychological acceptance is not discussed in this paper, since it is associated with the active embracing of subjective experience and is consequently more related to the successful implementation of Hyperloop. Hyperloop safety and security issues are outside the scope of this paper as they are linked to specific load types and feasibility studies of specific Hyperloop projects. Nevertheless, the authors consider user perceptions and safety concerns to be important factors in the context of Hyperloop technology implementation; so, further research that would incorporate these dimensions is recommended. From the transport infrastructure perspective, this study focuses only on trade routes and does not evaluate nodes, logistic centers, and terminals. The effect on capacity of load/unload cargo infrastructure is not considered either.
Future research should include international trade routes and focus on integrating granular socio-economic data, evaluating the technology’s direct impacts on a country’s GDP. Upcoming modeling efforts (e.g., system dynamics or partial equilibrium models) could address how evolving market conditions and adaptive user behaviors might amplify or reduce Hyperloop’s impacts over time. The next step would be to design a roadmap with exact timelines for Hyperloop technology implementation in EU trade routes based on an assessment of its socio-economic impacts. To calculate the impacts of particular Hyperloop projects is of particular interest and could be included in the further studies.

Supplementary Materials

The following supporting information can be downloaded at https://github.com/pirrencode/hpl_trade_routes, app.py: Python Program; scenario_sim.py: Monte Carlo Simulations; hl_efficiency_output_current_speeds.csv: Hyperloop efficiency, TRL6 comparison outputs; hyperloop_montecarlo_results_current_speeds_short.csv: Monte Carlo simulations results for TRL6, compact; hyperloop_montecarlo_results_current_speeds.csv: Monte Carlo simulations results for TRL6, detailed; hl_efficiency_output_high_speeds.csv: Hyperloop efficiency TRL9 comparison outputs; hyperloop_montecarlo_results_high_speeds_short.csv: Monte Carlo simulation results for TRL9, compact; hyperloop_montecarlo_results_high_speeds.csv: Monte Carlo simulations results for TRL9, detailed.

Author Contributions

Conceptualization, A.V. and Y.S.; methodology, A.V.; software, A.V.; validation, A.V.; formal analysis, A.V.; investigation, A.V.; resources, A.V.; data curation, A.V.; writing—original draft preparation, A.V. and Y.S.; writing—review and editing, A.V., Y.S., and O.Z.; visualization, A.V.; supervision, Y.S.; project administration, O.Z. All authors have read and agreed to the published version of the manuscript.

Funding

This research received no external funding.

Informed Consent Statement

Not applicable.

Data Availability Statement

The original contributions presented in this study are included in the article/Supplementary Materials; further inquiries can be directed to the corresponding authors.

Conflicts of Interest

The authors declare no conflicts of interest.

References

  1. Aizenman, J., Lindahl, R., Stenvall, D., & Uddin, G. S. (2024). Geopolitical shocks and commodity market dynamics: New evidence from the Russia-Ukraine conflict. European Journal of Political Economy, 85, 102574. [Google Scholar] [CrossRef]
  2. Ali-Yrkkö, J., & Kuusi, T. (2020). Brexit and impact routes through global value chains. National Institute Economic Review, 252, R33–R44. [Google Scholar] [CrossRef]
  3. Anderson, J. E., & van Wincoop, E. (2003). Gravity with gravitas: A solution to the border puzzle. American Economic Review, 93(1), 170–192. [Google Scholar] [CrossRef]
  4. Armağan, K. (2020). The fifth mode of transportation: Hyperloop. Journal of Innovative Transportation, 1(1), 1105. Available online: https://dergipark.org.tr/en/pub/jit/issue/55759/761535 (accessed on 24 February 2025).
  5. Bajor, I. (2024). The eu logistics sector. Periodica Polytechnica Transportation Engineering, 52(3), 229–234. [Google Scholar] [CrossRef]
  6. Besedeš, T., Chu, J., & Murshid, A. P. (2024). Fly the unfriendly skies: The role of transport costs in gravity models of trade. Journal of International Economics, 152, 103994. [Google Scholar] [CrossRef]
  7. Bilici, S., Holtz, G., Jülich, A., König, R., Li, Z., Trollip, H., Call, B. M., Tönjes, A., Vishwanathan, S. S., Zelt, O., Lechtenböhmer, S., Kronshage, S., & Meurer, A. (2024). Global trade of green iron as a game changer for a near-zero global steel industry?—A scenario-based assessment of regionalized impacts. Energy and Climate Change, 5, 100161. [Google Scholar] [CrossRef]
  8. Bolatto, S., & Moramarco, G. (2023). Gains from trade and their quantification: Does sectoral disaggregation matter? International Economics, 174, 44–68. [Google Scholar] [CrossRef]
  9. Borghetti, F. (2023). Preliminary technical and economic analysis of a hyperloop line: Case study from Italy. European Transport/Trasporti Europei, 90, 1–12. [Google Scholar] [CrossRef]
  10. Böhmecke-Schwafert, M. (2024). The role of blockchain for trade in global value chains: A systematic literature review and guidance for future research. Telecommunications Policy, 48, 102835. [Google Scholar] [CrossRef]
  11. Canbay, Ş. (2024). The analysis of relationships between global shipping networks and foreign trade volumes in developing countries. Case Studies on Transport Policy, 17, 101242. [Google Scholar] [CrossRef]
  12. Cariou, P., Lindstad, E., & Jia, H. (2021). The impact of an EU maritime emissions trading system on oil trades. Transportation Research Part D: Transport and Environment, 99, 102992. [Google Scholar] [CrossRef]
  13. Cesar De Oliveira, S. E. M., Visentin, J. C., Pavani, B. F., Branco, P. D., De Maria, M., & Loyola, R. (2024). The European Union-Mercosur Free Trade Agreement as a tool for environmentally sustainable land use governance. Environmental Science & Policy, 161, 103875. [Google Scholar] [CrossRef]
  14. Cinnirella, S., & Pirrone, N. (2013). An uncertainty estimate of global mercury emissions using the monte carlo technique. E3s Web of Conferences, 1, 07006. [Google Scholar] [CrossRef]
  15. COM. (2024). European commission. Apostolos tzitzikostas—Mission letter. Available online: https://commission.europa.eu/document/de676935-f28c-41c1-bbd2-e54646c82941_en (accessed on 29 January 2025).
  16. Ding, W., Shibasaki, R., & Kavirathna, C. A. (2023). Impact of Northern Sea Route on China’s grain imports with EU countries. Asian Transport Studies, 9, 100108. [Google Scholar] [CrossRef]
  17. Doko Tchatoka, F., & Dufour, J.-M. (2024). Exogeneity tests and weak identification in IV regressions: Asymptotic theory and point estimation. Journal of Econometrics, 105821. [Google Scholar] [CrossRef]
  18. Elsayed, A. H., Khalfaoui, R., Nasreen, S., & Gabauer, D. (2024). The impact of oil shocks on green, clean, and socially responsible markets. Energy Economics, 136, 107729. [Google Scholar] [CrossRef]
  19. Ferrari, E., Christidis, P., & Bolsi, P. (2023). The impact of rising maritime transport costs on international trade: Estimation using a multi-region general equilibrium model. Transportation Research Interdisciplinary Perspectives, 22, 100985. [Google Scholar] [CrossRef]
  20. Forrester, J. W. (1961). Industrial dynamics (pp. 13–14). MIT Press. [Google Scholar]
  21. Forrester, J. W. (1990). Principles of systems. System Dynamics Series. PEGASUS. ISBN 978-1883823412. [Google Scholar]
  22. Frensch, R., Fidrmuc, J., & Rindler, M. (2023). Topography, borders, and trade across Europe. Journal of Comparative Economics, 51, 816–832. [Google Scholar] [CrossRef]
  23. Gavrilin, S., & Steen, S. (2017). Uncertainty of full-scale manoeuvring trial results estimated using a simulation model. Applied Ocean Research, 64, 281–289. [Google Scholar] [CrossRef]
  24. Gkoumas, K., & Christou, M. (2020). A triple-helix approach for the assessment of hyperloop potential in Europe. Sustainability, 12(19), 7868. [Google Scholar] [CrossRef]
  25. Guo, Q., & Wang, Y. (2024). Rare earth trade dependence network structure and its impact on trade prices: An industry chain perspective. Resources Policy, 91, 104930. [Google Scholar] [CrossRef]
  26. Ha, Y.-S., & Seo, J. S. (2014). The Northern Sea Routes and Korea’s Trade with Europe: Implications for Korea’s shipping industry. International Journal of e-Navigation and Maritime Economy, 1, 73–84. [Google Scholar] [CrossRef]
  27. Hayo, B., & Roth, D. H. W. (2024). The perceived impact of immigration on native workers’ labour market outcomes. European Journal of Political Economy, 85, 102610. [Google Scholar] [CrossRef]
  28. Head, K., & Mayer, T. (2014). Gravity equations: Workhorse, toolkit, and cookbook. In G. Gopinath, E. Helpman, & K. Rogoff (Eds.), Handbook of international economics (Vol. 4, pp. 131–195). Elsevier. [Google Scholar] [CrossRef]
  29. Hermeling, C., Klement, J. H., Koesler, S., Koehler, J., & Klement, D. (2014). Sailing into a dilemma—An economic and legal analysis of an EU trading scheme for maritime emissions. SSRN Journal. [Google Scholar] [CrossRef]
  30. Horizon, G. (2020). Technology readiness levels (TRL). General annexes, HORIZON 2020—WORK PROGRAMME 2018–2020. Available online: https://ec.europa.eu/research/participants/data/ref/h2020/other/wp/2018-2020/annexes/h2020-wp1820-annex-g-trl_en.pdf (accessed on 2 January 2025).
  31. Hsu, W. K., Huang, S. S., & Huynh, N. T. (2021). An evaluation model for foreign direct investment performance of free trade port zones. Promet-Traffic&Transportation, 33(6), 859–870. [Google Scholar] [CrossRef]
  32. Iht-emden.de. (2025). Institute of hyperloop technology. Available online: https://iht-emden.de (accessed on 24 February 2025).
  33. Imamkulieva, E., & Kondakova, K. (2022). International cargo transportation through the suez canal and alternative routes (by the example of china-eu). SHS Web of Conferences, 134, 00135. [Google Scholar] [CrossRef]
  34. Jackson, K., & Shepotylo, O. (2024). Political alliances and trade: Europe in a polarized world. European Journal of Political Economy, 85, 102612. [Google Scholar] [CrossRef]
  35. Jamil, N., Chaudhry, T. T., & Chaudhry, A. (2022). Trading textiles along the new silk route: The impact on Pakistani firms of gaining market access to China. Journal of Development Economics, 158, 102935. [Google Scholar] [CrossRef]
  36. Jiang, Y., Qiao, G., & Lu, J. (2020). Impacts of the new international land–Sea trade corridor on the freight transport structure in China, central Asia, the ASEAN countries and the EU. Research in Transportation Business & Management, 35, 100419. [Google Scholar] [CrossRef]
  37. Kale, S. (2019). Hyperloop: Advance mode of transportation system and optimize solution on traffic congestion. International Journal for Research in Applied Science and Engineering Technology, 7(7), 539–552. [Google Scholar] [CrossRef]
  38. Kang, Y., Liao, S., Jiang, C., & D’Alfonso, T. (2022). Synthetic control methods for policy analysis: Evaluating the effect of the European emission Trading System on aviation supply. Transportation Research Part A: Policy and Practice, 162, 236–252. [Google Scholar] [CrossRef]
  39. Kosztyán, Z. T., Kiss, D., & Fehérvölgyi, B. (2024). Trade network dynamics in a globalized environment and on the edge of crises. Journal of Cleaner Production, 465, 142699. [Google Scholar] [CrossRef]
  40. Latifi, A., Naboka-Krell, V., Tillmann, P., & Winker, P. (2024). Fiscal policy in the Bundestag: Textual analysis and macroeconomic effects. European Economic Review, 168, 104827. [Google Scholar] [CrossRef]
  41. Li, Y., Huang, J., Zeng, A., & Zhang, H. (2024). Trade risk transmission of global cobalt industrial chain based on multi-layer network. Resources Policy, 98, 105338. [Google Scholar] [CrossRef]
  42. Liu, Y., Li, H., An, H., Guan, J., Shi, J., & Han, X. (2021). Are the environmental impacts, resource flows and economic benefits proportional? Analysis of key global trade routes based on the steel life cycle. Ecological Indicators, 122, 107306. [Google Scholar] [CrossRef]
  43. Ma, X., Jing, L., Zhao, K., Wu, T., & Zhang, P. (2022). Simulation of spatial service range and value of carbon sink based on intelligent urban ecosystem management system and net present value models—An example from the qinling mountains. Forests, 13(3), 407. [Google Scholar] [CrossRef]
  44. Martínez-Zarzoso, I., Serranito, F., & Turcu, C. (2023). Recent advances in international macroeconomics, financial development and globalization: Some policy challenges. International Economics, 175, 135–138. [Google Scholar] [CrossRef]
  45. Meng, X., Gu, A., Zeng, J., Chen, M., Zhou, J., Liu, B., & Mao, Z. (2024). Advantages and challenges of China’s participation in international hydrogen trade. International Journal of Hydrogen Energy, 52, 1356–1368. [Google Scholar] [CrossRef]
  46. Meza, A., Ari, I., Al Sada, M., & Koç, M. (2023). Relevance and potential of the Arctic Sea Routes on the LNG trade. Energy Strategy Reviews, 50, 101174. [Google Scholar] [CrossRef]
  47. Nevomo.tech. (2025). The future of transportation. Available online: https://www.nevomo.tech (accessed on 29 January 2024).
  48. Nordås, H. K. (2023). Services in the India-EU free trade agreement. International Economics, 176, 100460. [Google Scholar] [CrossRef]
  49. Page, M. J., Moher, D., Bossuyt, P. M., Boutron, I., Hoffmann, T. C., Mulrow, C. D., Shamseer, L., Tetzlaff, J. M., Akl, E. A., Brennan, S. E., Chou, R., Glanville, J., Grimshaw, J. M., Hróbjartsson, A., Lalu, M. M., Li, Y., Loder, E. W., Mayo-Wilson, E., McDonald, S., . . . McKenzie, J. E. (2021). PRISMA 2020 explanation and elaboration: Updated guidance and exemplars for reporting systematic reviews. BMJ, 372, n160. [Google Scholar] [CrossRef]
  50. PAR. (2025). European Parliament. legislative train 01.2025. 1 a new plan for Europe’s sustainable prosperity and competitiveness. Available online: https://www.europarl.europa.eu/legislative-train/carriage/eu-regulatory-framework-for-hyperloop/report?sid=8801 (accessed on 4 February 2025).
  51. Peng, H., Sun, Y., Hao, J., An, C., & Lyu, L. (2024). Carbon emissions trading in ground transportation: Status quo, policy analysis, and outlook. Transportation Research Part D: Transport and Environment, 131, 104225. [Google Scholar] [CrossRef]
  52. Pinto, M. C., Simões, S. G., & Fortes, P. (2024). How can green hydrogen from North Africa support EU decarbonization? Scenario analyses on competitive pathways for trade. International Journal of Hydrogen Energy, 79, 305–318. [Google Scholar] [CrossRef]
  53. Polak, E., & Polak, W. (2017). Współczesne uwarunkowania polityki gospodarczej. Prace Naukowe Uniwersytetu Ekonomicznego We Wrocławiu, 498, 263–272. [Google Scholar] [CrossRef]
  54. Premsagar, S. (2022). A critical review of hyperloop (ultra-high speed rail) technology: Urban and transport planning, technical, environmental, economic, and human considerations. Frontiers in Sustainable Cities, 4. [Google Scholar] [CrossRef]
  55. Premsagar, S. (2023). A critical review of the proposed hyperloop (ultra-high-speed rail) project between mumbai and pune and its broader implications for sustainable mobility in Indian cities. Future Transportation, 3(3), 931–969. [Google Scholar] [CrossRef]
  56. Python. (2025). Python programming language. Available online: http://www.python.org (accessed on 24 February 2025).
  57. Ren, Q., & Du, J. (2024). Harmonizing innovation and regulation: The EU Artificial Intelligence Act in the international trade context. Computer Law & Security Review, 54, 106028. [Google Scholar] [CrossRef]
  58. Richardson, W. S., Wilson, M. C., Nishikawa, J., & Hayward, R. S. (1995). The well-built clinical question: A key to evidence-based decisions. ACP Journal Club, 123(3), A12. [Google Scholar] [CrossRef] [PubMed]
  59. Rumin, R., Kozioł, K., Polak, J., Hyla, P., & Blaut, J. (2019). Analysis of time of intermodal container transport from China to the Eu by means of hyperloop technology. AUTOBUSY—Technika, Eksploatacja, Systemy Transportowe, 20(1–2), 452–457. [Google Scholar] [CrossRef]
  60. Sakowski, M. (2016). The next contender in high speed transport elon musks hyperloop. The Journal of Undergraduate Research at the University of Illinois at Chicago, 9(2). [Google Scholar] [CrossRef]
  61. Sanchez-Matos, J., Vázquez-Rowe, I., & Kahhat, R. (2024). Estimating carbon and plastic emissions of seafood products in trade routes between the European Union and South America. Resources, Conservation and Recycling, 205, 107539. [Google Scholar] [CrossRef]
  62. Sanjuán, A. I., Philippidis, G., Ferrer Pérez, H., & Gracia De Rentería, P. (2023). Empirical insights on the dynamics of SPS trade costs: The role of regulatory convergence and experience in EU dairy trade. Food Policy, 119, 102524. [Google Scholar] [CrossRef]
  63. Scheelhaase, J., Maertens, S., & Grimme, W. (2021). Options for improving the EU Emissions Trading Scheme (EU ETS) for aviation. Transportation Research Procedia, 59, 193–202. [Google Scholar] [CrossRef]
  64. Schoulund, D. H., Breed, C. A., Pasgaard, J. C., & Pasgaard, M. (2024). Ecological and societal trade-offs of living a good, safe and green life in urban ecological enclaves. Cities, 155, 105454. [Google Scholar] [CrossRef]
  65. Siemenn, A. E., Deo, B., Ng, F., Zhou, J., Owens, C., Atue, S. U., & Forsuelo, M. (2023). A railgun secondary propulsion system for high-speed hyperloop transportation. IEEE Transactions on Plasma Science, 51(1), 243–248. [Google Scholar] [CrossRef]
  66. Stryhunivska, O., Gdowska, K., & Rumin, R. (2020). Key points of the management system for the safety of passengers travelling with low-pressure trains. New Trends in Production Engineering, 3(1), 462–471. [Google Scholar] [CrossRef]
  67. Sun, Y., Zheng, J., Yang, L., & Li, X. (2024). Allocation and trading schemes of the maritime emissions trading system: Liner shipping route choice and carbon emissions. Transport Policy, 148, 60–78. [Google Scholar] [CrossRef]
  68. Sur, J. M., & Kim, D. J. (2020). Multi criteria evaluation of beneficial effect of commercializing Northern Sea Route on Europe and Asia countries. The Asian Journal of Shipping and Logistics, 36, 193–201. [Google Scholar] [CrossRef]
  69. Swisspod.com. (2025). Building hyperloop. Available online: https://www.swisspod.com (accessed on 24 February 2025).
  70. Tan, Z., Shao, S., Zhang, D., Shang, W.-L., Ochieng, W., & Han, Y. (2024). Decarbonizing the inland container fleet with carbon cap-and-trade scheme. Applied Energy, 376, 124251. [Google Scholar] [CrossRef]
  71. Tesla.com. (2012). Hyperloop alpha. Available online: https://www.tesla.com/sites/default/files/blog_images/hyperloop-alpha.pdf (accessed on 24 February 2025).
  72. Tumhyperloop.com. (2023). Europe’s first passenger run under vacuum conditions. Available online: https://tumhyperloop.com/demonstrator/#passenger-run (accessed on 24 February 2025).
  73. Tumhyperloop.com. (2025). TUM Hyperloop. Engineering a world without the limits of distance and time. Available online: https://tumhyperloop.com (accessed on 24 February 2025).
  74. Unstudio.com. (2018). Hardt hyperloop. Available online: https://www.unstudio.com/page/11735/hardt-hyperloop (accessed on 24 February 2025).
  75. Vukić, L., & Cerbán, M. D. M. (2022). Economic and environmental competitiveness of container shipping on alternative maritime routes in the Asia-Europe trade flow. Maritime Transport Research, 3, 100070. [Google Scholar] [CrossRef]
  76. Wan, Y., Li, Y., Wang, D., Yang, D., Huang, T., Zhang, Y., Zheng, L., & Liu, C. (2024). International trade of green hydrogen, ammonia and methanol: Opportunities of China’s subregions. Renewable Energy, 235, 121294. [Google Scholar] [CrossRef]
  77. Wang, M., & Kuusi, T. (2024). Trade flows, carbon leakage, and the EU Emissions Trading System. Energy Economics, 134, 107556. [Google Scholar] [CrossRef]
  78. Werner, M., Eissing, K., & Langton, S. (2016). Shared value potential of transporting cargo via hyperloop. Frontiers in Built Environment, 2. [Google Scholar] [CrossRef]
  79. Xu, L., Yang, Z., Chen, J., Zou, Z., & Wang, Y. (2024). Spatial-temporal evolution characteristics and spillover effects of carbon emissions from shipping trade in EU coastal countries. Ocean & Coastal Management, 250, 107029. [Google Scholar] [CrossRef]
  80. Yalılı, M., Menlik, T., & Boran, F. E. (2024). A novel multi-objective decision-making model to determine optimum resource and capacity configuration for hybrid electricity generation systems: A comparative case study in Türkiye. Applied Energy, 376, 124338. [Google Scholar] [CrossRef]
  81. Yang, D., Jiang, L., & Ng, A. K. Y. (2018). One Belt one Road, but several routes: A case study of new emerging trade corridors connecting the Far East to Europe. Transportation Research Part A: Policy and Practice, 117, 190–204. [Google Scholar] [CrossRef]
  82. Yang, J. (2011). Convergence and uncertainty analyses in Monte-Carlo based sensitivity analysis. Environmental Modelling & Software, 26(4), 444–457. [Google Scholar] [CrossRef]
  83. Yang, J., & Chen, W. (2023). Unravelling the landscape of global cobalt trade: Patterns, robustness, and supply chain security. Resources Policy, 86, 104277. [Google Scholar] [CrossRef]
  84. Yang, Y., & Liu, W. (2024). Free trade agreements and domestic value added in exports: An analysis from the network perspective. Economic Modelling, 132, 106656. [Google Scholar] [CrossRef]
  85. Yu, Y., Ma, D., & Zhu, W. (2023). Resilience assessment of international cobalt trade network. Resources Policy, 83, 103636. [Google Scholar] [CrossRef]
  86. Zeleros.com. (2025). Zeleros—Your electrification partner. Available online: https://zeleros.com (accessed on 24 February 2025).
  87. Zhang, L., & Wen, S. (2024). The influence of global gallium trade network dynamics on price: A complex network and panel regression approach. Resources Policy, 93, 105091. [Google Scholar] [CrossRef]
  88. Zhang, Q., Mao, X., Lu, J., Guo, Z., Duman, Z., Chen, Y., Song, P., & Tu, K. (2024). EU-Russia energy decoupling in combination with the updated NDCs impacts on global fossil energy trade and carbon emissions. Applied Energy, 356, 122415. [Google Scholar] [CrossRef]
  89. Zhang, Y., & Wang, K. (2024). Mitigation effect of the European Union emission trading system on aviation emissions. Transportation Research Part D: Transport and Environment, 130, 104186. [Google Scholar] [CrossRef]
  90. Zhong, H., Zhang, S., Zhang, X., Yu, Y., Li, D., Wang, S., Xiao, J., & Tian, P. (2024). Water-land-energy efficiency and nexus within global agricultural trade during 1995–2019. Science of The Total Environment, 951, 175539. [Google Scholar] [CrossRef] [PubMed]
  91. Zhu, S., Jia, S., Sun, Q., & Meng, Q. (2023). An empirical study of China–Singapore International Land–Sea Trade Corridor: Analysis from supply and demand sides. Transport Policy, 135, 1–10. [Google Scholar] [CrossRef]
Figure 1. Research methodology overview (authors’ elaboration).
Economies 13 00065 g001
Figure 2. Literature review methodology (based on Page et al., 2021).
Economies 13 00065 g002
Figure 3. Changes in efficiency of Hyperloop against baseline transportation modes on specific routes (authors’ elaboration) (%).
Economies 13 00065 g003
Table 1. Research strategy and yield of relevant studies (based on Page et al., 2021).
Search QueryNumber of ResultsNotes/Observations
TITLE-ABS-KEY((“European Union” OR EU) AND (“trade infrastructure” OR “transport innovations” OR “economic impact”)) AND PUBYEAR > 2021418Large number of studies; crucial for framing Hyperloop’s impact on EU trade infrastructure and economics.
TITLE-ABS-KEY((“high-speed transport” OR “railway” OR “aviation”) AND (“trade routes” OR “international trade”)) AND PUBYEAR > 2021115High relevance for comparison with other high-speed transport modes like railways or aviation.
TITLE-ABS-KEY (“international trade” AND “general equilibrium model”) AND PUBYEAR > 202173Substantial research; valuable for trade dynamics and economic modeling.
TITLE-ABS-KEY((“low carbon” OR “carbon neutral” OR “sustainable transport”) AND (“Hyperloop” OR “transport innovations”)) AND PUBYEAR > 202124Good number of studies on sustainability and Hyperloop; relevant for environmental impact analysis.
TITLE-ABS-KEY (“transport costs” AND “gravity models” AND “international trade”) AND PUBYEAR > 202118Relevant for understanding how transport costs impact trade flows, supporting gravity model methodology.
TITLE-ABS-KEY (“Free Trade Agreement” AND “environmentally sustainable”) AND PUBYEAR > 20216Emerging topic; useful for linking trade policies with sustainable transport objectives for Hyperloop.
TITLE-ABS-KEY(“gravity model” AND (“trade analysis” OR “transport economics”)) AND TITLE-ABS-KEY(“PPML” OR “Poisson Pseudo Maximum Likelihood”) AND PUBYEAR > 20212Limited research on using the gravity model with trade and transport; essential for your methodology.
TITLE-ABS-KEY((“transport policy” OR “economic feasibility”) AND (“European Union” OR EU) AND (“trade routes” OR “socio-economic impact”)) AND PUBYEAR > 20212Few studies focus specifically on EU transport policy and feasibility regarding trade routes.
TITLE-ABS-KEY(“Hyperloop technology” OR “Hyperloop transport”) AND TITLE-ABS-KEY(“socio-economic impact” OR “economic analysis” OR “trade impact”)1Limited studies specifically address the socio-economic impacts of Hyperloop technology.
TITLE-ABS-KEY (“global shipping networks” AND “foreign trade volumes”) AND PUBYEAR > 20211Research gap; limited studies on direct effects of shipping networks on trade volumes.
Table 2. Assessment of socio-economic impacts of Hyperloop technology affecting EU trade routes, Iteration 1 (impacts are marked with I<number>) (authors’ elaboration).
CategoryKey FindingsReferences
Trade Route
Disruptions
and Shipping
-
Faster transit times have a potential to reduce overall shipping costs (I1) and enhancing supply chain reliability (I2) and on-time delivery (I3), ultimately boosting EU competitiveness (I4).
-
New or reconfigured transportation corridors (I5) may emerge, reshaping import/export patterns (I6) and logistics networks.
Ding et al. (2023); Ferrari et al. (2023); Ha and Seo (2014); Jamil et al. (2022); Jiang et al. (2020); Meza et al. (2023); Sur and Kim (2020); Vukić and Cerbán (2022); D. Yang et al. (2018); Zhu et al. (2023)
Carbon Emissions and Emissions Trading
-
Hyperloop’s carbon-neutral operations support the Eu in meeting decarbonization targets (I7), providing first-mover advantages (I8) for stakeholders reducing emissions (I9).
-
Under strict carbon-pricing regimes, zero-emission Hyperloop could provide better GDP impacts (I10) compared to transportation modes non-compliant with green policies, driving green logistics and policy support (I11).
Cariou et al. (2021); Hermeling et al. (2014); Kang et al. (2022); Peng et al. (2024); Scheelhaase et al. (2021); Sun et al. (2024); Tan et al. (2024); Wang and Kuusi (2024); Xu et al. (2024); Y. Zhang and Wang (2024)
Ultra-High-Speed Impact Analysis
on Trade Routes
-
Time-sensitive industries gain competitive edges on cargo safety (I12) through reliable deliveries.
-
Greater transport capacity at supersonic speeds stimulates industrial growth changes (I13), increasing trade volumes (I14) and attracting foreign direct investment (I15) (FDI) into regions connected by Hyperloop. Increased trade volumes affect better human need delivery, improving quality of life (I16).
Bilici et al. (2024); Guo and Wang (2024); Li et al. (2024); Liu et al. (2021); Meng et al. (2024); Pinto et al. (2024); Sanchez-Matos et al. (2024); Sanjuán et al. (2023); Wan et al. (2024); J. Yang and Chen (2023); Yu et al. (2023); L. Zhang and Wen (2024); Zhong et al. (2024)
Geopolitical
and Policy
Analyses
-
Major infrastructure rollouts like Hyperloop require substantial policy coordination (I17), funding, and regulatory alignment (I17) across EU member states and partners, increasing cooperation between EU member countries (I18).
-
Changing geopolitical alliances and evolving trade agreements can expedite (or impede) Hyperloop’s deployment, affecting regional integration and trade resilience. And, on the contrary, Hyperloop stimulates change in trade alliances (I19).
Aizenman et al. (2024); Cesar De Oliveira et al. (2024); Hayo and Roth (2024); Jackson and Shepotylo (2024); Nordås (2023); Ren and Du (2024); Q. Zhang et al. (2024)
Gravity Models and Transport Costs
-
Reduced effective distance and shorter transit times challenge distance-based trade assumptions in gravity models, increasing overall trade flows (I14) for regions connected (I20) by Hyperloop.
-
Transport cost reductions may re-distribute trade benefits (I14) across large and small economies, altering regional trade balances.
Besedeš et al. (2024); Bolatto and Moramarco (2023); Canbay (2024); Frensch et al. (2023)
Methodological and Econometric Tools
-
The identified advanced PPML model is necessary to quantify the net economic gains of Hyperloop, isolating its direct and indirect impacts on the complex EU trade environment.
-
Export/import outcomes are evaluated through impact on GDP (I10).
-
Time-series and policy simulation approaches help capture how new transportation technologies reshape trade networks, informing better infrastructure investment decisions.
Doko Tchatoka and Dufour (2024); Kosztyán et al. (2024); Latifi et al. (2024); Martínez-Zarzoso et al. (2023); Y. Yang and Liu (2024)
Emerging
Trade
Catalysts
-
Green enclaves and hybrid energy models underscore the need for integrated, sustainable solutions, positioning Hyperloop as a transportation mode in a decarbonized economy (I7).
-
Oil price volatility and market shocks accelerate the shift toward faster, cleaner transport if policies and consumer sentiment are supportive.
The digitalization (I21) and automation of trade routes (I22) lead to changes in the workforce (I23) to supply routes.
Böhmecke-Schwafert (2024); Elsayed et al. (2024); Schoulund et al. (2024); Yalılı et al. (2024)
Land Use and
Infrastructure
-
Significant land acquisition, which can lead to land alienation (I24), resulting in the displacement of local communities and disruption of agricultural activities.
-
Extensive land use and resources. Rural regions may experience economic challenges due to the concentration of resources and investments in urban centers (I25).
Ding et al. (2023); Ferrari et al. (2023); Ha and Seo (2014); Jiang et al. (2020)
Table 3. Assessment of socio-economic impacts of Hyperloop technology affecting EU trade routes, Iteration 2: mapped impact category overview (authors’ elaboration).
Impact IDImpact CategoryAssessed Impact EffectDimension
I1Change in Shipping CostspositiveFinancial
I2Supply Chain ReliabilitypositiveLogistics
I3Supply Chain On-Time DeliverypositiveLogistics
I4EU Global CompetitivenesspositivePolicy
I5Enable New or Reconfigured Transportation Corridorspositive/negativePolicy
I6Reshape Import/Export Patternspositive/negativeFinancial
I7Decarbonization TargetspositiveEnvironmental
I8First-mover Advantagespositive/negativeFinancial
I9Reduce Carbon EmissionspositiveEnvironmental
I10GDP Changespositive/negativeFinancial
I11Green LogisticspositiveEnvironmental
I12Cargo Safetypositive/negativeLogistics
I13Industrial Growth ChangespositiveFinancial
I14Trade VolumespositiveFinancial
I15Foreign Direct Investmentpositive/negativeFinancial
I16Quality of LifepositiveFinancial
I17Policies and Regulationspositive/negativePolicy
I18Cooperation Between EU Member Countriespositive/negativePolicy
I19Changes in Trade Alliancespositive/negativePolicy
I20Urban and Rural Regional ConnectionspositiveLogistics
I21Digitalization of Trade RoutespositiveLogistics
I22Trade Routes AutomationpositiveLogistics
I23Changes in Workforcepositive/negativeFinancial
I24Land AlienationnegativePolicy
I25Centralizationpositive/negativePolicy
Table 4. Initial data setup for proposed scenarios, with Hyperloop at TRL9 operating velocity (authors’ elaboration).
IDCorridorDistance (km)Baseline ModeBaseline Speed (km/h)Baseline Time
(h)
Baseline CO2 (t/day)Baseline Energy (MWh/d)HL Speed (km/h)HL
Time (h)
HL
CO2 (t/day)
HL
Energy (MWh/d)
S1Pan-EU
Network
6000Mixed Modes60–12070–80120–150400–600900–10006–730–40250–350
S2Paris–Vienna–Bucharest–Sofia2245Mostly Rail80–12028–3010–14190–260800–10002.8–3.64.4–9.5275–350
S3Barcelona–
Munich
1500Road/Rail 80/12016–1735–45150–200900–10001.63.0–3.290–110
S4Milan–Vienna–Munich1200Mostly Rail100–11011–1228–35120–160900–10001.2–1.33–470–90
S5Warsaw–
Vilnius–Riga–Tallinn
1180Road/Rail 80/11012–1330–38120–160800–10001.2–1.53–470–90
S6Paris–Brussels–Cologne1100Mostly Rail110–1209–1025–30100–140900–10001.13.0–3.260–80
S7Stockholm–
Copenhagen–Hamburg
1000Rail/Ferry70–10010–1325–32100–140900–10001.0–1.23–460–80
S8Lyon–Milan900Mostly Rail110–1208–918–2290–110800–10001.0–1.22–350–70
S9Madrid–Paris800Road/Rail 80/12010–1120–2580–120800–100012.0–2.250–60
S10Madrid–Lisbon750Road/Rail 808–918–2270–90800–10000.8–0.92.0–2.240–50
S11Berlin–Warsaw600Mostly Rail100–1205–614–1860–80800–10000.6–0.71–235–45
S12Rotterdam–Düsseldorf500Road/Rail 80/1005–612–1550–70800–10000.51–230–40
Table 5. Initial data setup for proposed scenarios, with Hyperloop at the TRL6 operating velocity (authors’ elaboration).
IDCorridorDistance (km)Baseline ModeBaseline Speed (km/h)Baseline Time
(h)
Baseline CO2 (t/day)Baseline Energy (MWh/d)HL Speed (km/hHL
Time (h)
HL
CO2 (t/day)
HL
Energy (MWh/d)
S1Pan-EU Network6000Mixed Modes60–12070–80120–150600–9006–730–406000300–420
S2Paris–Vienna–Bucharest–Sofia2245Mostly Rail80–12025–32190–260380–4702.5–3.590–1402245330–420
S3Barcelona–Munich1500Road/Rail80/1201635–45320–3751.4–1.82–41500108–132
S4Milan–Vienna–Munich1200Mostly Rail100–12011–1328–40380–4701.2–1.53–5120084–108
S5Warsaw–
Vilnius–Riga–Tallinn
1180Road/Rail80/11012–1330–38390–4502.8–3.32–2.2120084–108
S6Paris–Brussels–Cologne1100Mostly Rail110–1209–1125–35380–4501.1–1.52–4110072–96
S7Stockholm–Copenhagen–Hamburg1000Rail/ Ferry70–10010–1325–32390–4501.0–1.32–3100072–96
S8Lyon–Milan900Rail110–120818–22390–4501.0–1.42–390060–84
S9Madrid–Paris800Road/ Rail80/1201020–25380–4200.8–1.21–380060–72
S10Madrid–Lisbon750Road/Rail80/1108–1018–27380–4200.8–1.01–375048–60
S11Berlin–Warsaw600Rail100–1205–614–18380–4200.6–0.71–260042–54
S12Rotterdam–Düsseldorf500Road/Rail80/1005–612–15380–4200.5–1.21–250036–48
Table 6. Monte Carlo simulation result for scenarios S1–S12, n_sample = 10,000, with Hyperloop at TRL9 operating velocity (authors’ elaboration).
IDDistance (km)Baseline Speed (km/h)Baseline Time
(h)
Baseline CO2
(t/d)
Baseline
Energy (MWh/d)
HL
Speed (km/h)
HL
Time (h)
HL
CO2 (t/d)
HL
Energy (MWh/d)
S1600083.1775.00134.99615.98999.746.5035.00300.31
S2224599.9530.34225.05499.49999.933.206.91304.06
S3150093.2416.5039.991016.421017.61.653.1099.95
S41200110.0412.0033.95139.98999.781.283.5080.00
S5118094.9513.0033.99139.94900.381.453.1079.95
S61100115.0010.0130.0199.99900.191.153.1069.97
S7100084.9811.5028.17120.00999.771.103.1070.02
S8900115.028.5020.00100.00900.221.102.5059.99
S980093.3910.5022.50899.60900.121.152.1054.99
S1075091.689.0022.1679.98900.140.892.1045.01
S11600110.016.0016.0090.02899.960.651.5039.98
S1250090.025.5013.5068.41900.100.521.5035.00
Table 7. Monte Carlo simulation result for scenarios S1–S12, n_sample = 10,000, with Hyperloop at TRL6 operating velocity (authors’ elaboration).
IDDistance (km)Baseline Speed (km/h)Baseline Time
(h)
Baseline CO2
(t/d)
Baseline
Energy (MWh/d)
HL
Speed (km/h)
HL
Time
(h)
HL
CO2 (t/d)
HL
Energy (MWh/d)
S1600083.3875.00135.00750.02716.606.5035.01339.81
S22245100.0128.16224.99418.34428.343.00118.15375.23
S3150093.3316.5039.97347.55349.091.603.00120.07
S41200109.9412.0033.97421.64421.701.324.0095.98
S5118095.0213.0034.01419.98419.893.022.1095.94
S61100115.0010.0030.03418.54411.891.303.0183.98
S7100084.9911.528.16420.22420.091.182.5082.00
S8900114.998.5020.00419.92419.831.202.5072.02
S980093.3110.5022.49399.82400.111.002.0066.03
S1075091.669.0122.15400.06400.010.902.0054.00
S11600110.046.0016.01400.03400.120.772.0048.01
S1250089.946.0013.49400.05400.030.952.0041.99
Disclaimer/Publisher’s Note: The statements, opinions and data contained in all publications are solely those of the individual author(s) and contributor(s) and not of MDPI and/or the editor(s). MDPI and/or the editor(s) disclaim responsibility for any injury to people or property resulting from any ideas, methods, instructions or products referred to in the content.

