Abstract
In this study, we aimed to assess the effectiveness of monetary policy in influencing housing prices in Morocco. Bayesian estimation over the period 2007Q2–2017Q2 of a dynamic stochastic general equilibrium model allowed us to reveal a significant impact of the increase in policy interest rates on the prices of residential goods. Indeed, the implementation of a restrictive monetary policy in Morocco will drive the prices of this type of asset downward. Despite this empirical finding, the historical decomposition of shocks impacting the inflation of residential property prices shows that interest rates explain only a small portion of the variations in housing prices in this country. Our results also indicate that an increase in the share of borrowers extends the time required for economic and financial variables to return to their equilibrium state. This is a sign of the potential dangers of fueling housing bubbles through credit booms.
Keywords:
house prices; monetary policy; effectiveness; DSGE; JEL classification:
C11; E17; E32; E44; E52; E58
1. Introduction
The real estate bubble of the mid–2000s, accompanied by low interest rates and followed by the collapse of the subprime market in the United States, which pushed the global economy into a financial system collapse and a new recession cycle, led academic research to study the impact of monetary policy on housing prices. Indeed, according to Kuttner (2012), these elements gave rise to two viewpoints: the first based on the idea that monetary policy should respond proactively to increases in asset prices1; the second suggesting that the implementation of an excessively loose monetary policy may create a real estate bubble2.
On one hand, real estate is one of the sectors playing a significant role in the economic scene. Indeed, residential investment is one of the components of production, and the spending of all employees in this sector (construction workers, real estate agents, etc.) varies according to the income derived from their work. It is through these two mechanisms that Hatzius (2008) captures the macroeconomic effects of housing. On the same level, Gan (2010) argues that fluctuations in real estate asset prices generate a wealth effect, prompting economic agents to adjust their consumption and borrowing decisions. On the other hand, the relationship between monetary decisions and housing prices has garnered particular attention in recent years, especially after the dramatic rise in the prices of these assets, which has called into question the affordability of residential properties for middle-income households3 (particularly in large cities in developed economies). Furthermore, the implementation of new unconventional monetary instruments has sparked greater interest in better understanding this relationship (Nsafoah & Hashmi, 2021).
For the Moroccan case, although the country’s monetary authorities, as mandated by the 2006 statute, consider the policy interest rate (alongside required reserves) as a key instrument for achieving price stability4, we have noticed the absence of any academic contribution aimed at studying the relationship between changes in policy rate adjustments and housing prices. Consequently, we believe that our work may spark a debate on Bank Al-Maghrib’s ability to control housing prices, particularly in a context where the real estate sector in this country is experiencing significant dynamism. This dynamism is marked by the implementation of several government programs, an increase in the number of housing units produced, a rising trend in housing price inflation, and a 32% increase in outstanding real estate loans between 2012 and 2021. Notably, housing loans accounted for around 80% of these loans in 2021, amounting to Dhs 232.82 billion. This latter observation could represent a potential danger, as housing price bubbles financed by credit carry greater economic and financial risks than those caused by excessive optimism5. This is why combating the excessive appreciation in housing prices in the first case is of crucial importance. Along these lines, several countries (including Morocco) are increasingly relying on macroprudential instruments, which can be adjusted to address market failures. However, designing and implementing these instruments remains challenging, limiting their ability to prevent real estate bubbles. In this regard, it would be beneficial for the Moroccan case to explore the effectiveness of other types of measures, particularly monetary measures, in mitigating housing price booms.
As with André et al. (2022), we aim to verify, for the Moroccan case and more specifically for housing prices, the counterintuitive result obtained by Galí and Gambetti (2015). They revealed, using a VAR model with time-varying coefficients, a persistent increase in stock prices following an exogenous monetary tightening. However, in our case, we will conduct our analysis within a general equilibrium analytical framework, using a DSGE model adapted to the characteristics of a small open economy and estimated using a Bayesian approach6 on Moroccan quarterly data spanning the period from 2007Q2 to 2017Q2. Compared to other estimated DSGE models for this country, such as those of El Othmani (2018), Achour (2019), El Khalifi et al. (2024), Ouakil et al. (2024), Moustabchir et al. (2024a), and Moustabchir et al. (2024b), our contribution stands out for its ability to capture the financing mechanism for acquiring new housing through the banking market while taking into account a borrowing constraint imposed on borrowers. Thus, our analysis has allowed us to consider the effect of the increase in the share of borrowers on the transmission of a restrictive monetary policy.
The rest of this work is structured as follows: Section 2 is dedicated to presenting some empirical studies examining the relationship between monetary decisions and housing prices. Section 3 aims to describe the dynamics of the Moroccan housing market. Section 4 is reserved for presenting the analytical framework of the model. Section 5 explains the procedure for calibration and Bayesian estimation of the model’s parameters. In Section 6, we will analyze the effects of an increase in the policy interest rates by Bank Al-Maghreb. The final section will present the main conclusions of this work, its limitations, and potential directions for further exploration to improve it.
2. Literature Review
The housing bubble of the mid-2000s, accompanied by low interest rates and followed by the 2007–2009 subprime crisis, gave rise, according to Kuttner (2012), to two points of view: the first based on the idea that monetary policy should react proactively to asset price increases7; the second arguing that the implementation of an excessively accommodative monetary policy would produce a housing bubble8. However, the formulation of these two opinions is based on the assumption that interest rates have an economic effect on the prices of durable goods. Indeed, from a historical perspective, housing bubbles have been preceded by low interest rates, but few empirical studies have supported this hypothesis.
Kuttner (2012) analyzed the channels through which interest rates influence housing prices. He began with a user cost framework, which assumes that rental costs are equated to the total risk-adjusted cost of ownership by market forces. Through this analytical framework, Kuttner argued that interest rates are one of the fundamental economic factors underlying housing prices. In this sense, he justified the lack of necessity to invoke bubbles when explaining the relationship between declining interest rates and rising housing prices. This model implies that, for a real user cost of 6%, a 10% reduction in interest rates would lead to a 1.3% increase in housing prices. For a real user cost of 5%, the same interest rate reduction would result in a 1.6% appreciation in residential property prices. Along the same lines, a dynamic and simplified9 version of this model revealed that fluctuations in interest rates cause a temporary overvaluation of housing prices relative to the steady state. It also showed that expected appreciations and depreciations in these prices are part of a normal adjustment process and do not indicate the existence of a housing bubble. Despite this, the analytical framework of this model overlooked an important factor that can influence housing prices: credit supply. Indeed, a high availability of credit, combined with the relaxation of borrowing constraints, would lower the shadow cost of borrowing, producing effects similar to those of an interest rate cut. In other words, an operational credit channel would tend to amplify the effects of an expansionary monetary policy on housing prices. A third channel to consider is risk-taking. A decrease in interest rates encourages financial intermediaries to take on additional risks, making them more willing to lend and thereby contributing to an increase in credit supply. This, in turn, raises household demand for residential properties, driving housing prices upward.
Housing is one of the key sectors playing a significant role in the economic landscape. Indeed, residential investment is one of the components of production, and the expenditures of all employees in this sector (construction workers, real estate agents, etc.) vary according to their income derived in exchange for the work performed. It is through these two mechanisms that Hatzius (2008) captured the macroeconomic effects of housing. Similarly, Gan (2010) identified a significant effect of housing wealth on consumption. This effect is amplified among households owning multiple properties and when credit constraints are relaxed.
For Leamer (2015), whether from a forecasting or causal perspective, the residential real estate sector is a key element of the U.S. economic cycle. His analysis of economic data revealed that out of 11 economic recessions, nine were preceded by a decline in housing activity. This downturn can be seen as a signal of an upcoming economic recession. Thus he argued that monetary policy should intervene to smooth the housing cycle. However, monetary authorities must consider that such monetary decisions create an intertemporal control problem10. Along the same lines, he suggested that the ideal time to curb a durable goods cycle by raising interest rates is when housing construction volumes are above normal and continue to rise11.
It is clear that housing activity has a significant impact on the economic cycle. For this reason, several academic studies have sought to examine the factors driving changes in housing prices. A number of these empirical contributions focus on measuring the effects of monetary decisions on these prices. Using a VAR model estimated on U.S. data covering the period from February 1964 to August 1999, Lastrapes (2002) found that house prices and housing sales respond positively to monetary supply shocks. Ahearne et al. (2005) concluded that housing price appreciations are preceded by low interest rate levels. Similarly, they argued that it would be difficult to measure the effect of interest rates alone. This is explained by the presence of other macroeconomic factors influencing the demand for residential real estate.
Del Negro and Otrok (1999) estimated a dynamic factor model for the U.S. using quarterly data from 1986 to 2005. Their results revealed that, from a historical perspective, housing price variations were driven by local components. Thus, using a VAR model, they argued that the implementation of an expansionary monetary policy leads to an immediate appreciation in housing prices by 0.9%.
In line with studies using econometric models to address this issue, Jarociński and Smets (2008) estimated two Bayesian VAR models for the U.S. economy. The first model is in levels, and it revealed that a 25% reduction in the key interest rate drives housing prices upward12. For the second model, which is in first differences, it yielded larger and more persistent results, but with wider confidence intervals.
Goodhart and Hofmann (2008) sought to study the links between money, credit, housing prices, and economic activity. By estimating a panel VAR for 17 industrial countries over the period from 1970 to 2006, they found a multidirectional link between monetary variables and housing prices. In parallel, they showed that the implementation of a restrictive policy has a negative effect on housing prices13.
Campbell et al. (2009) performed a decomposition of housing price variations in 23 metropolitan areas in the U.S. into real interest rates, rents, and risk premiums. According to this analysis, the risk premium is the component that explains the majority of these fluctuations. In contrast, interest rates explain only a small portion of these price changes.
Musso et al. (2011) using data covering the period from 1986 to 2009, estimated a VAR for the U.S. economy with the following seven variables: the CPI, consumption expenditures, residential investment, housing prices, the three-month interbank rate, the mortgage rate, and mortgage debt14. Their results indicate that monetary shocks reduce residential investment and housing prices.
Kuttner (2012) estimated an error correction model and conducted a cross-national exploration of the relationships between interest rates, the monetary base, housing prices, and mortgage credit, revealing a weak effect of interest rates on real estate prices. Furthermore, the study noted that in certain economies, growth in the monetary base is accompanied by an appreciation in these prices. At the same level, the study concluded that the results of academic studies tend to show a weak negative relationship between interest rates and the prices of durable goods15.
Gupta et al. (2012) estimated a large-scale Bayesian VAR with monthly data from 143 variables spanning from January 1986 to December 2003. They found that housing starts, building permits, and real estate sales react negatively to the implementation of an austerity monetary policy. As for housing prices, they represent the weakest response to this monetary decision.
Chen and Lin (2022), using data on housing prices, examined the relationship between monetary policy and residential property prices16. Their results reveal that an expansionary monetary policy leads to a statistically significant increase in the real prices of these properties.
André et al. (2022), using a Bayesian VAR, proved that for the United States, the United Kingdom, and Canada, and contrary to the results revealed by Campbell et al., housing prices react negatively to a monetary tightening. This is explained by a larger negative variation in the fundamental component of housing asset prices, which offsets the positive variation of the rational bubble component. Through this, an increase in the base interest rate is capable of absorbing the housing bubble17.
André et al. (2022) emphasized the importance of considering investor sentiment in this analysis. Indeed, in the case where these sentiments influence the response of housing prices, it is assumed that monetary authorities, in order to mitigate real estate bubbles, would be forced to raise the base interest rate further, which would have adverse consequences on production. To this end, these authors used a Markov regime-switching autoregressive model with two sentiment cases: an optimistic one and a bearish or neutral one. Their results show the effectiveness of monetary policy regardless of the sentiment state.
Miles and Zhu (2023), using a local projection method, revealed the ineffectiveness of monetary policy in influencing the housing sector. In this context, they proposed the implementation of a regulatory policy, such as a macroprudential type, capable of absorbing the macroeconomic and financial effects generated by real estate bubbles.
For the Canadian case, Nsafoah and Dery (2024) using a Bayesian VAR model, revealed that the adoption of an expansionary monetary policy, whether conventional or unconventional, would push Canadian housing prices upwards. Compared to forward guidance, conventional monetary shocks and those related to quantitative easing have a significant and more persistent effect on real housing prices18. They also emphasized that although economic theory postulates that the implementation of an expansionary monetary policy will drive real estate prices upward19, it is not easy to measure the real effect of these monetary measures on real estate prices. Indeed, academic contributions addressing this question have revealed diverse results. This may be explained by the monetary tools analyzed, the methodology adopted to identify monetary shocks, as well as the periods and countries covered by the study.
However, most studies using macro-econometric models to examine the relationship between interest rates and housing prices overlook financial frictions and the heterogeneity of economic agents. Moreover, they are subject to the Lucas critique due to their inability to account for the impact of structural changes on the behavior of economic agents20. In this regard, Lucas proposed using structural models, capable of capturing the reactions of rational economic agents to changes in their environment. DSGE models, due to their microeconomic foundations, fulfill this role21.
One of the benchmark DSGE models addressing the previously mentioned issue is that of Monacelli (2009). Through the introduction of a borrowing constraint into a New Keynesian model, Monacelli was able to reconcile the results of this model with econometric evidence. The latter shows that in response to monetary shocks, expenditures on non-durable goods co-vary positively with expenditures on durable goods22. This work highlighted the fact that considering credit market imperfections allows for capturing the dissociation of dynamics between the cost of use and the relative prices of durable goods. In this sense, the decrease in real estate prices reduces the value of collateral, thereby tightening borrowing conditions, which in turn lowers the demand for these goods by borrowers. Conversely, due to a positive income shock, lenders increase their consumption of both durable and non-durable goods.
Another work to cite is that of Funke et al. (2018), who conducted a Bayesian estimation of a DSGE model for the New Zealand economy. Their results show that a monetary shock has significant spillover effects on housing prices, while emphasizing that these prices are primarily determined by housing sector-specific shocks. Through this study, they also revealed that the implementation of a macroprudential policy focused on loan-to-value (LTV) ratio restrictions would lower housing prices with negligible effects on consumer prices.
After this brief overview of studies evaluating the impact of monetary decisions on housing prices, it is clear that academic contributions for the Moroccan case are lacking. For this reason, we believe that our work can open a discussion on the ability of Bank Al-Maghreb to control housing prices, especially in a context where the housing sector in the country, as will be shown in the next section, is experiencing significant dynamism.
3. The Dynamics of the Moroccan Housing Sector
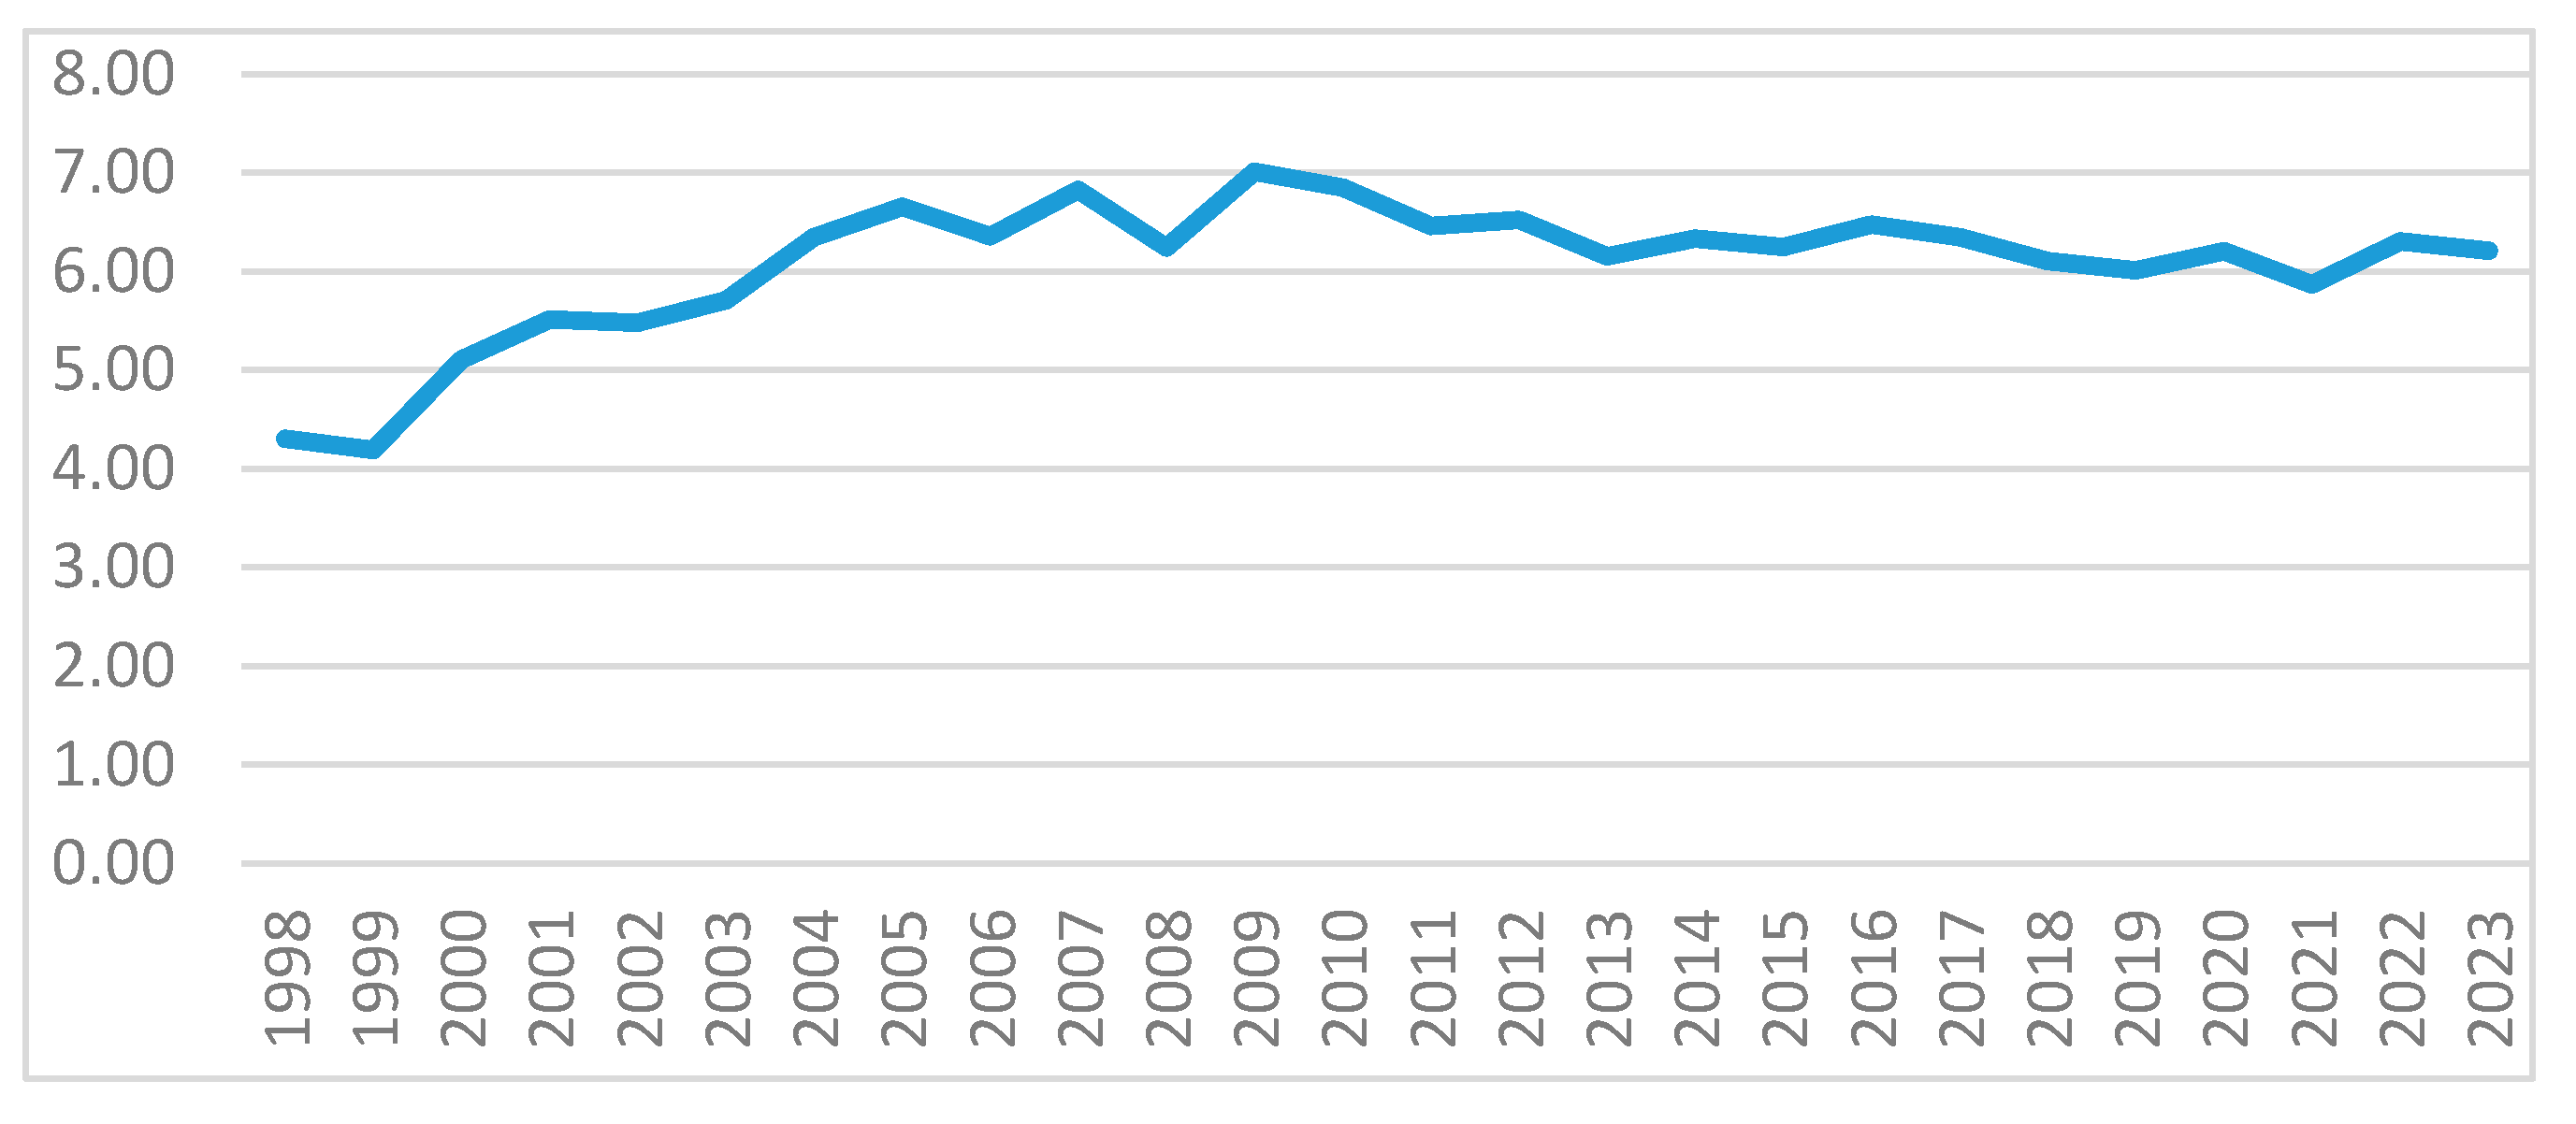
The increase in Morocco’s urban population and migration flows are two factors that intensify the challenge of addressing the housing deficit. It is in this context that the public authorities in this country have made intense efforts23 to ensure the social integration of the underprivileged population. In the same vein, the real estate sector has a strong driving effect on industrial and service activities, the financial system, logistics, and infrastructure24. This explains the active contribution of the sector to the dynamics of the Moroccan economy. As shown in Figure 1, the contribution of the construction and public works sector to the total added value of the Moroccan economy reached 6.21% in 2023.

Figure 1.
Evolution (in percentage) of the contribution of the construction and public works sector to Morocco’s total economic added value.
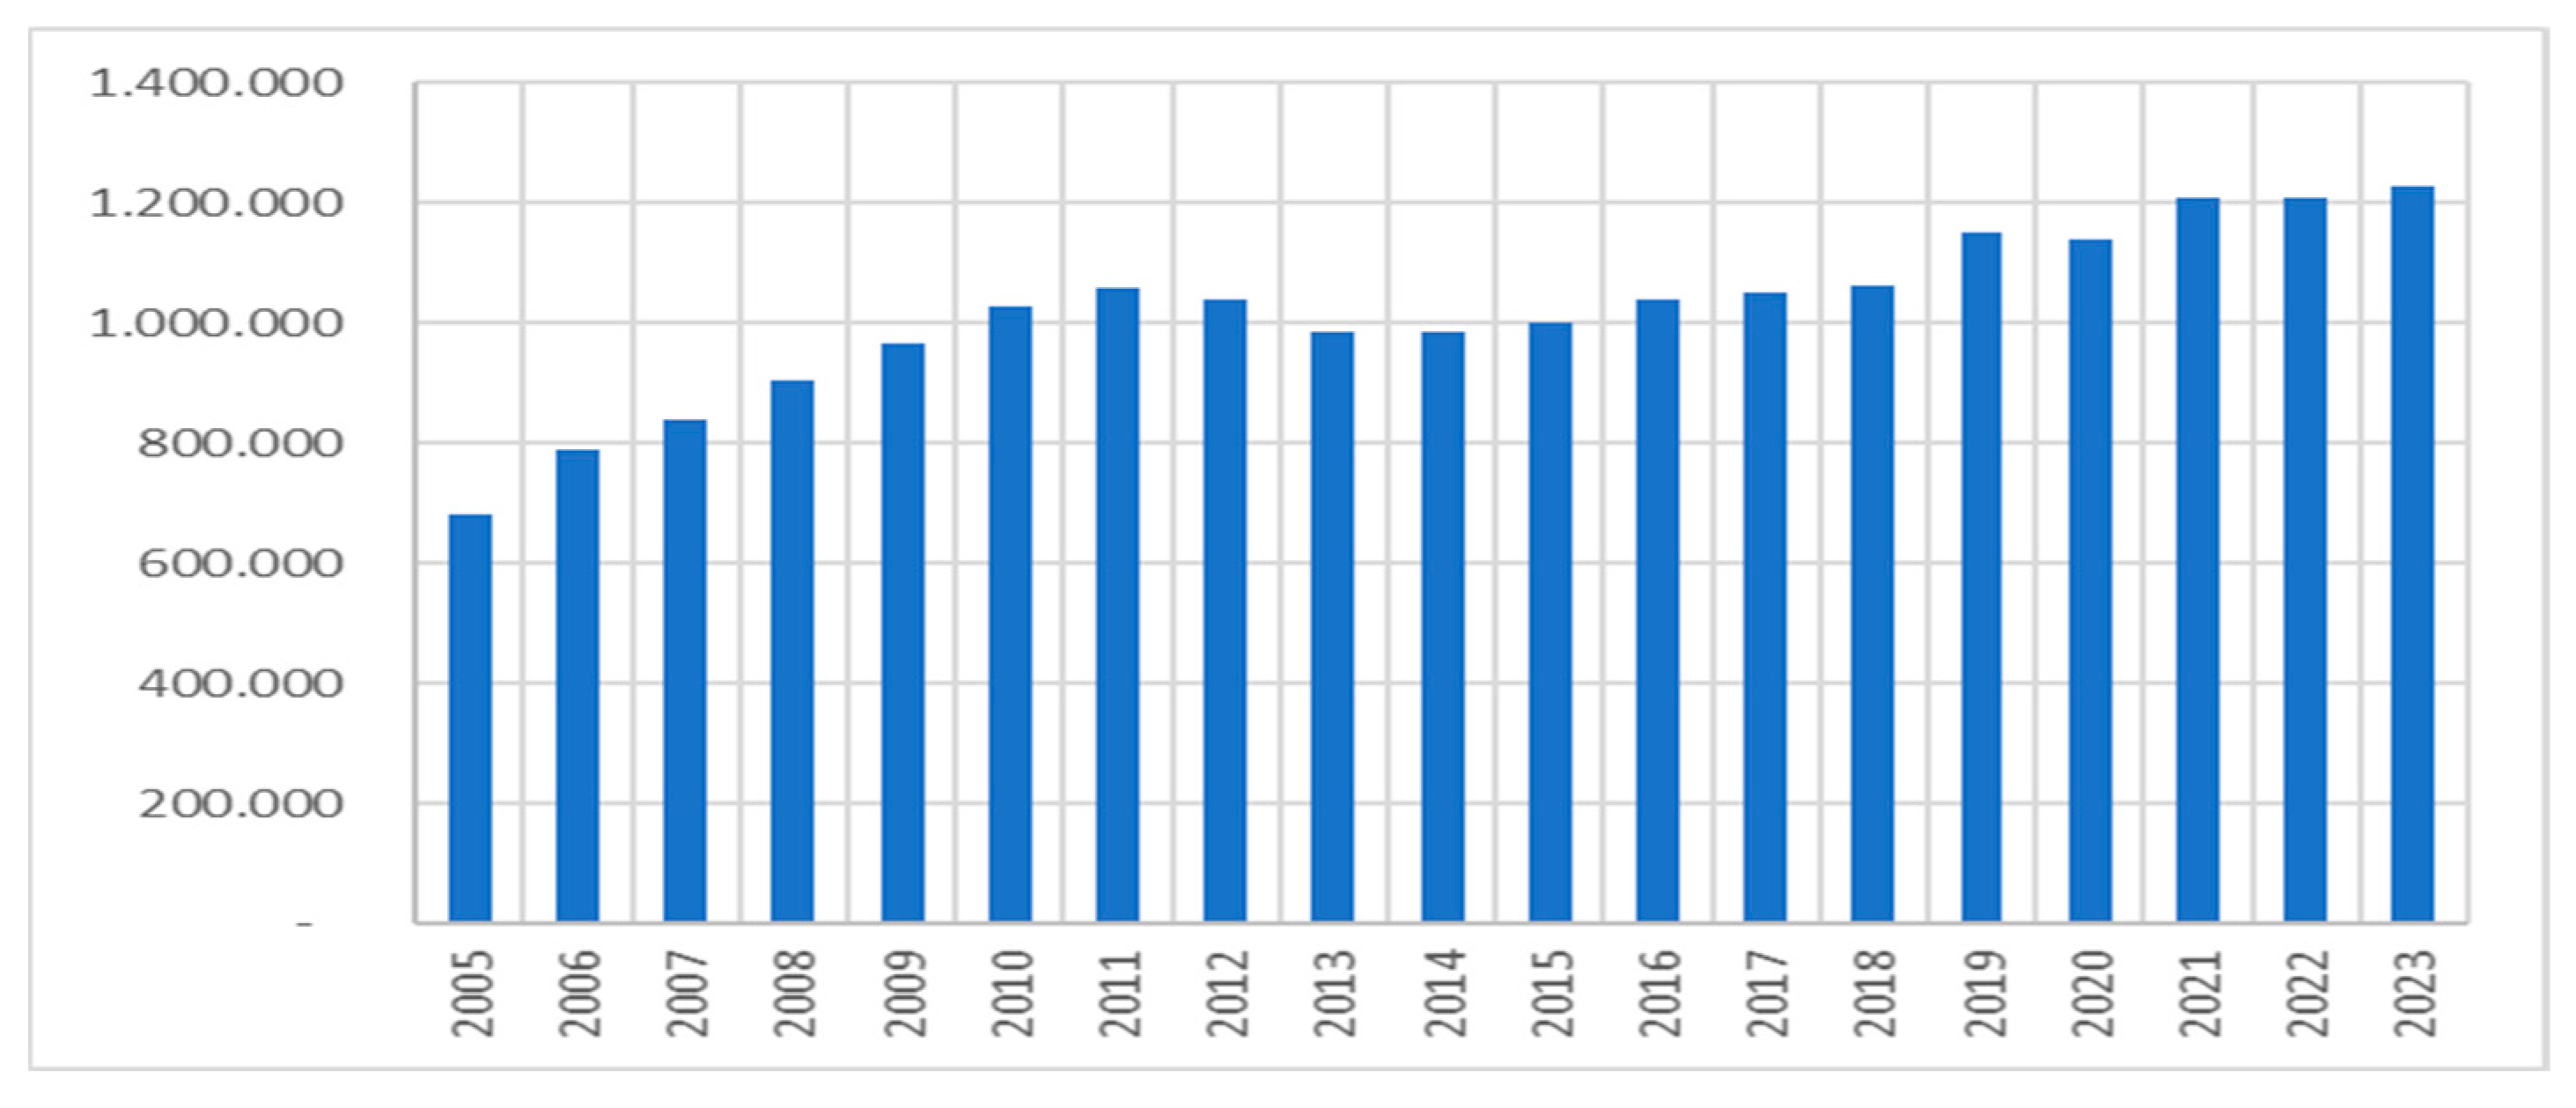
On the other hand, this sector plays a significant role in reducing the unemployment rate by absorbing a large share of unskilled workers (Ministère de l’Aménagement du Territoire National, 2022). Figure 2 shows that in 2023, the total number of jobs in the durable goods sector reached 1,229,000 posts.
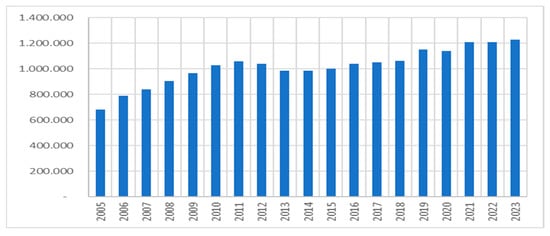
Figure 2.
Total number of job posts in the construction and public works sector.
The employment situation in this sector can be seen as an indicator of its strong performance, as evidenced by the increase in the number of housing units produced25, shown in Figure 3. At the same level, the financial sector played an important role in achieving this result. As highlighted in the report published by the Directorate of Real Estate Promotion within the Ministry of National Territorial Planning, Urbanism, Housing, and City Policy (Ministère de l’Aménagement du Territoire National, 2022), outstanding mortgage loans increased by 32% between 2012 and 2021, with housing loans accounting for around 80% of the total in 2021, amounting to MAD 232.82 billion26.

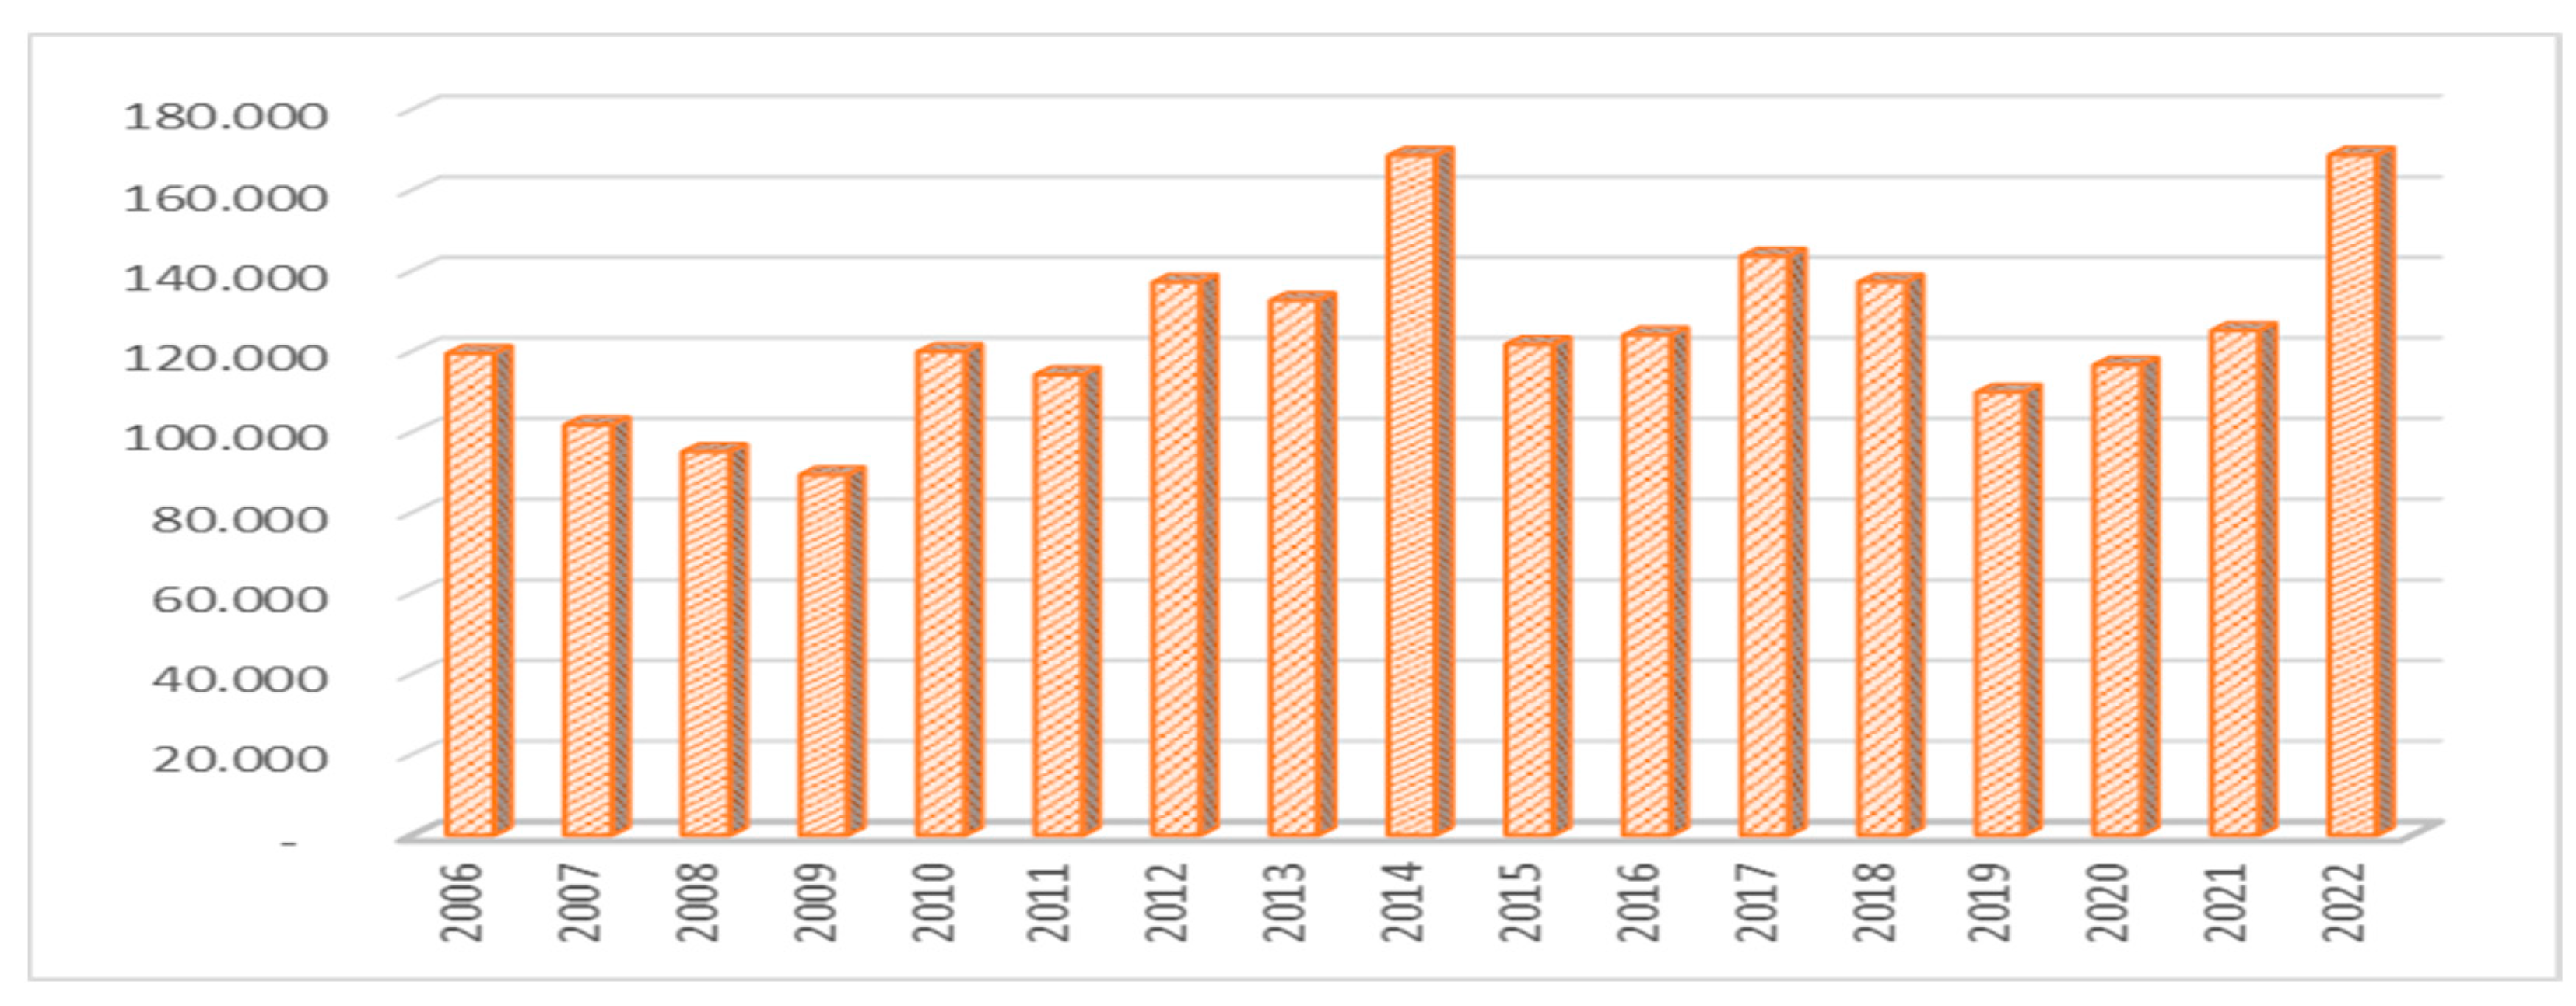
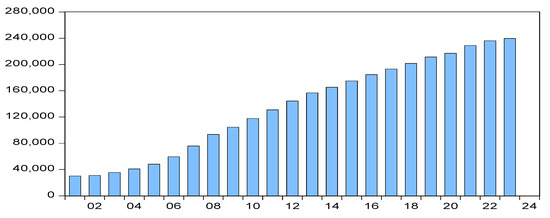
Figure 3.
Evolution of completed housing units.
Figure 3.
Evolution of completed housing units.
Figure 4.
Evolution of housing loans in millions of Dhs.
Figure 4.
Evolution of housing loans in millions of Dhs.
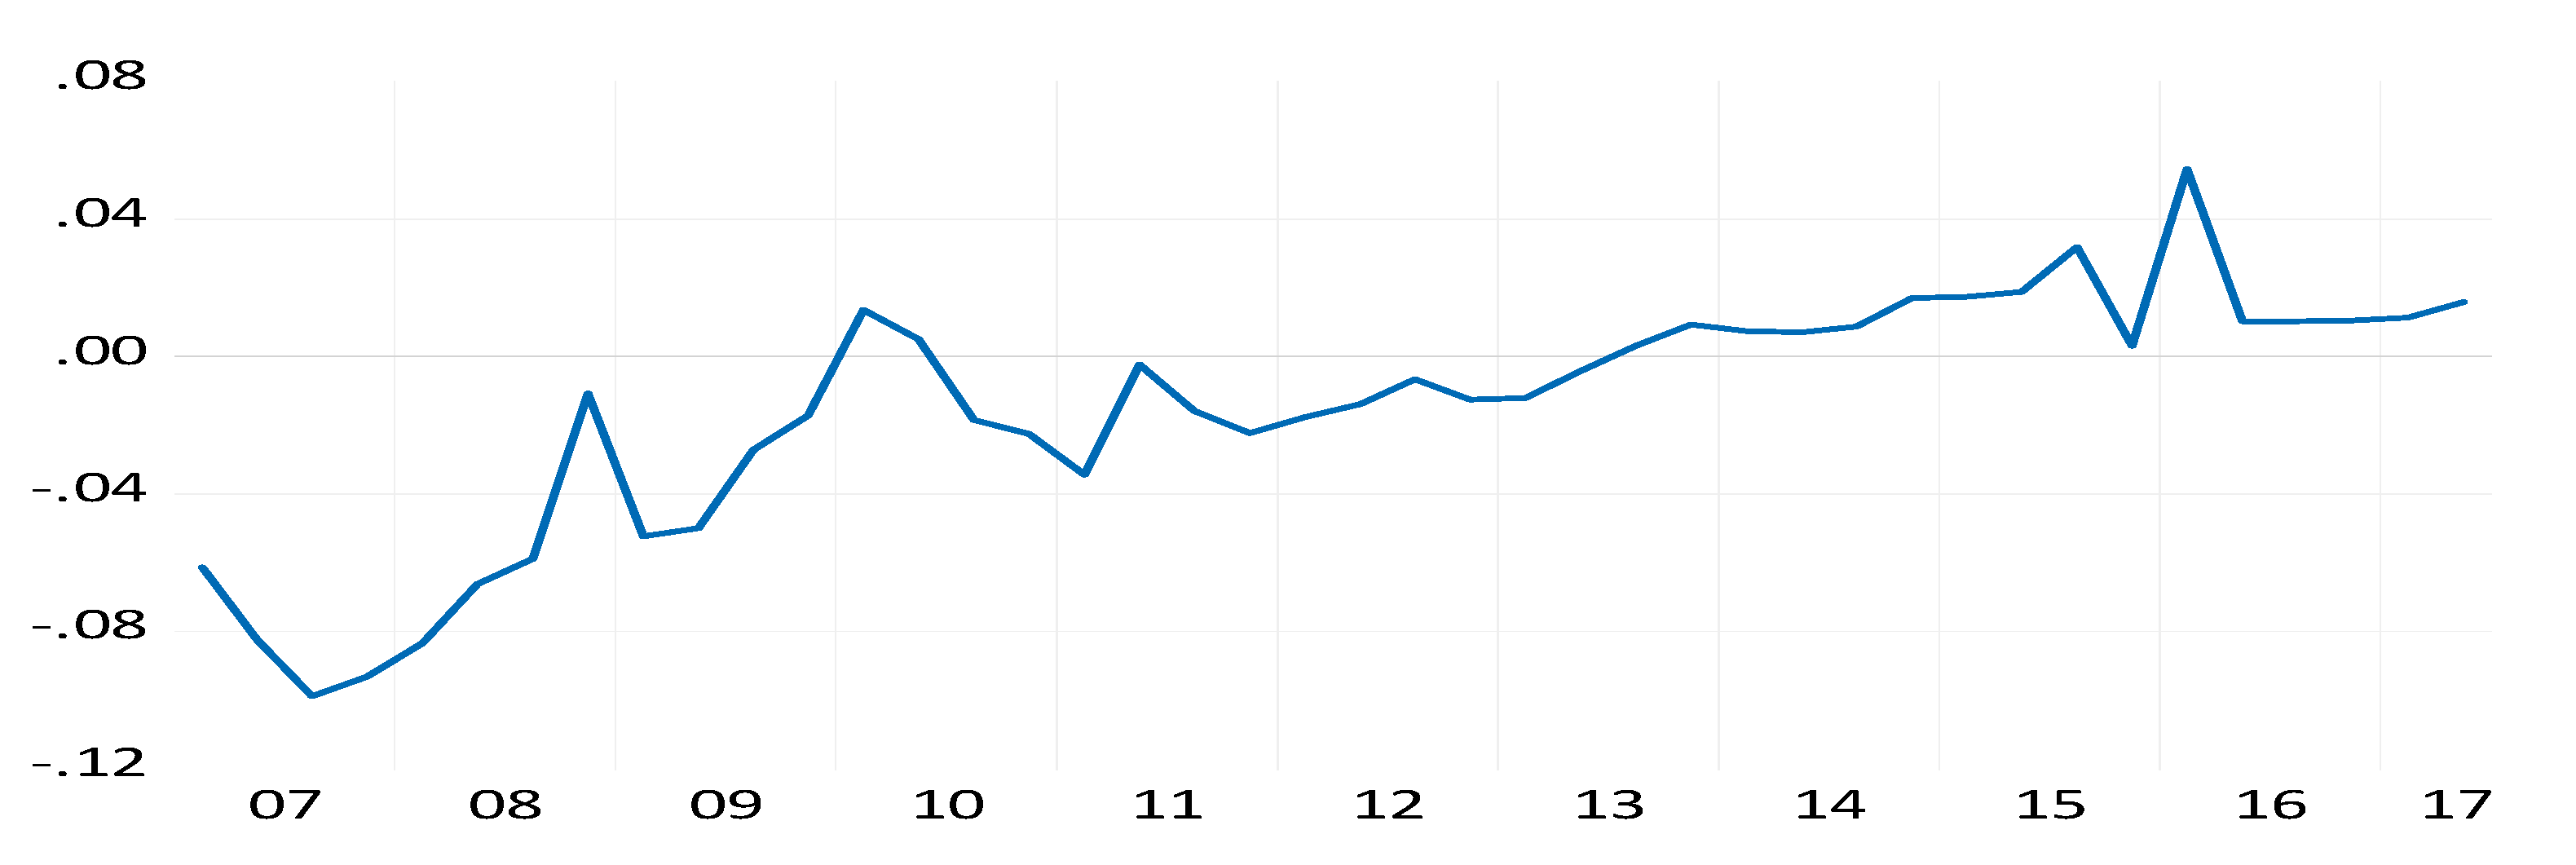
Regarding residential property prices, Figure 5 shows an upward trend in housing price inflation during the period 2007–2017. Although “The Global Housing Watch” by the International Monetary Fund considers the real price growth of residential properties in Morocco to be among the lowest in the world, this variation warrants an evaluation and analysis of the ability of the economic policies implemented in this country to control these fluctuations.
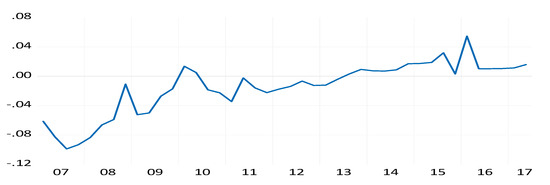
Figure 5.
Evolution of housing price inflation from 2007 to 2017.
4. The Model
Funke et al.’s (2018) model offers a useful framework for assessing the effectiveness of monetary policy in stabilizing housing prices while reducing its secondary impacts on the broader economy. It is a modeling tool with an open DSGE-type analytical framework, inspired by four academic contributions: Iacoviello (2005), Monacelli (2009), Gali and Monacelli (2005), and Funke and Paetz (2013).
As in Kiyotaki and Moore (1997)27, this model categorizes households into two groups: those who borrow (representing a fraction ω) and those who save (representing a fraction of 1 − ω). Despite a lower discount rate for borrowers than for savers, both groups derive utility from the consumption of residential and non-residential goods. The latter offer only one option: they can be consumed either on the domestic or international market. In contrast, housing goods offer two options: they can either be consumed immediately or serve as collateral for taking out a new loan28.
We assume that the production of the Moroccan economy is structured into two sectors: one for final goods and the other for intermediate goods (Costa, 2025). These intermediate goods are produced by two types of monopolistic firms, referred to as wholesalers: some companies specialize in the production of non-durable and differentiated intermediate goods, while others focus on the production of durable and differentiated intermediate goods29. Using a relevant production function, each of these producers must determine the price of these goods and the optimal quantity of production factors to be used in the production process of these intermediate goods. In the final goods sector, whether for durable goods or non-durable goods, perfectly competitive retailers aggregate the intermediate goods into final goods.
This paper models the behavior of Bank Al-Maghrib, under a floating exchange rate regime and using a standard (Taylor, 2007) rule, according to which the monetary authorities use the policy interest rate to achieve two objectives: price stability and economic growth (Costa, 2025). In parallel, we assume that the Moroccan fiscal authorities impose registration fees (at a rate of 4%) whenever a household acquires a property30. Additionally, to ensure a balanced government budget, this modeling tool assumes that the government makes lump-sum transfers to both categories of households.
4.1. The Borrowers
Let us assume that a fraction ω of households, indexed by b and with an infinite lifespan, seeks to maximize the following intertemporal utility function:
Moroccan borrowers, according to a discount factor , determine their labor supply (in each sector j = C, D) and their level of consumption . The parameters φ and σ represent, respectively, the inverse of the intertemporal elasticities of labor and consumption.
Consumption is introduced in this model as a weighted average of expenditure flows on durable goods (with a share of ) and non-durable goods:
With designating the housing preference shock31.
To capture the effect of consumption habits for goods other than housing, it is possible to define as:
measures the degree of persistence of consumption habits.
The budget constraint of Moroccan borrowers can be stated as follows:
The right-hand side of the equation summarizes the financial resources of this category of households: is the nominal remuneration of the labor force supplied in sector j, the real stock of domestic debt is denoted by 32, and represents the lump-sum transfers received from the government.
The left-hand side of Equation (4) reflects their expenses, specifically their consumption of goods other than housing. , is the nominal loan rate on loan contracts stipulated at t – 1 (Monacelli, 2009), is the inflation rate based on the CPI (Funke et al., 2018). The term represents the portion of real expenditures dedicated to acquiring a new housing unit: is the relative price of durable goods, is the investment in housing goods33, and reflects the stamp duty.
The Equation (4) can be reformulated as follows:
In line with the macroprudential approach adopted by Bank Al-Maghrib to minimize risks arising from the real estate market, we assume that the decision to acquire a new home using domestic debt is constrained by a borrowing limitation of the following form:
represents the fraction of the housing value that cannot be used as collateral. This mathematical formulation links the amount to be paid (in the following period) to the expected and adjusted future value34 of the real estate asset . This relationship is of great importance, as any fluctuation in the relative price of housing directly impacts the borrowing capacity of this group of households. This will enable this study to capture another essential channel of monetary policy transmission.
The representative borrower determines the optimal level of , , that maximizes (1) subject to the constraint of (5) and (6)35. In this sense, the determination of the first-order conditions resolving this problem will yield the following results:
According to Monacelli (2009), Equation (6) links the real wage to the marginal rate of substitution between consumption and leisure. Equation (7) expresses an equality between the marginal utility derived from the consumption of non-durable goods (represented by the left-hand side of the equation) and the shadow value of durable goods services (represented by the right-hand side of the equation)36. Regarding Equation (8), it is a modified version of the Euler equation.
4.2. The Savers
Similarly to impatient households37, the other fraction of households (1 – ω), indexed by s and over an infinite lifespan, seeks to maximize an intertemporal utility function of the form:
Subject to the constraint:
where:
- is the floating nominal exchange rate38,
- denotes the foreign bonds held by these households,
- is the interest rate prevailing in foreign financial markets,
- indicates the profits earned by patient households due to their ownership of intermediate firms.
The search for a solution to this problem leads us to the determination of the following first-order conditions39:
Formula (11) equates the real wage to the marginal rate of substitution between consumption and leisure. The second condition presented by Equation (12) expresses that the acquisition price of a durable good equals the initial payment plus the value of its anticipated sale by the saving household. Formulas (13) and (14) reflect the conventional Euler equations adjusted to account for housing in the consumption index.
4.3. The Intermediate Goods Firms
These firms produce these type of goods according to the following production function:
represents the labor factor and denotes the labor productivity specific to each sector40.
The marginal real cost can be expressed as follows:
where reflects the marginal productivity of labor in each production sector.
After combining the optimal choices of labor and leisure for borrowers and savers, the marginal real costs for each sector are represented by41 the following.
For the case of intermediate firms operating in the production of non-durable goods:
For the case of intermediate firms operating in the production of durable goods:
With:
and
Funke et al. (2018) assume that a random fraction of these firms adjust their prices, while the rest adjust their prices according to the following rule:
- : the degree of indexation to the inflation of the previous period.
For non-residential intermediate goods:
For residential intermediate goods:
A logarithmic approximation of the optimality conditions for domestic firms regarding price setting and their indices leads us to a new log-linearized formulation of the New Keynesian Phillips curve. This framework is very useful because it incorporates both anticipated and retrospective elements (Justiniano & Preston, 2010):
where:
- reflects the slope of the New Keynesian Phillips curve.
- is the marginal real cost in its log-linearized form.
4.4. The Final Goods Firms
In a perfectly competitive market, the firms producing durable and non-durable final goods produce using the aggregation of inputs produced by the firms K of intermediate goods. This is achieved by using the following production function:
where is the elasticity of substitution between the different differentiated intermediate goods (Monacelli, 2009).
Let’s assume:
This ratio represents, for each sector, a markup of prices over the marginal cost prevailing in the intermediate goods sector42. Using this definition, we can rewrite (24) in the following form:
The retailer’s problem is to determine the optimal quantity to produce in order to maximize their profit:
Subject to the constraint of:
Through the determination of the first-order conditions, we formulate the equation of the downward-sloping demand curve for the good K addressed by:
4.5. The Tradable Goods Sector
Following Gali and Monacelli (2005), it is possible to define the index of non-durable goods consumption as:
et represent, respectively, in the form of a CES function, the index of consumption of locally produced and imported non-durable goods:
is the quantity consumption index of goods imported from country i:
represents, from the perspective of Moroccan households, the intertemporal elasticity between domestic products and imported ones, is the degree of openness of the Moroccan economy, measures the degree of substitution between the different goods produced abroad, and reflects the substitutability between differentiated goods produced within a given country.
4.6. Price Formation
In the same way as Funke et al. (2018), we define the price index as:
The price of imported non-durable goods, expressed in terms of domestic goods, can be formulated as follows:
reflects the sectoral trade balance between Morocco and the country i:
According to Gali and Monacelli (2005), Equation (32) can be approximated, to the first order, in the following log-linear form:
Under the assumption of a symmetric steady state adapted to the theory of purchasing power parity43, the log-linearization of domestic price indices gives us the following formula:
This equation links the terms of trade in the non-residential goods sector, inflation, and the inflation of domestic products.
The aggregation of all tradable goods and countries, under the assumption of applying the law of one price at the brand level, allows us to obtain:
The log-linearization of around the symmetric steady state gives us:
where:
- is the logarithm of the nominal effective exchange rate,
- is the log of the global price index of tradable goods.
4.7. International Risk-Sharing Mechanism
The adopted analytical framework assumes that Moroccan borrowers cannot access the international financial market, while Moroccan lenders have the ability to trade bonds on international markets in a complete securities market.
The equalization of the optimal domestic and foreign conditions related to consumption, and the linearization of the result around a symmetric steady state under the assumption of symmetric initial conditions, allows us to obtain44:
is the composite index of non-residential goods consumption by foreign savers, while taking into account the persistence of consumption habits, denotes the index of durable goods consumption, reflects the total consumption index of patient foreign households, is the real effective exchange rate based on consumption prices, and is an element that captures the foreign counterparts of shocks affecting the Moroccan economy45.
4.8. Monetary Policy Rule:
We assume that Bank Al-Maghrib guides monetary policy in Morocco by responding to movements in inflation and output46, according to a (Taylor, 2007) rule of the following form:
; with: ∽N (0,).
and are two parameters reflecting the sensitivity of the base interest rate to inflation and output, is a smoothing parameter, and is the parameter capturing the monetary shock.
4.9. Equilibrium
For each good k in each sector j, the equilibrium of the aggregated goods market is conditioned by:
These two equations can be approximated around a symmetric steady state by:
With: .
The aggregate real production expressed in terms of the aggregate producer price index must satisfy:
The consumption of borrowers and lenders in non-residential and residential goods can be formulated as follows:
As stated earlier, investment in residential goods can be expressed by:
as well as:
We neglect income redistribution through fiscal policy:
5. Calibration and Estimation Procedure
Like several empirical studies using DSGE models as a tool for analyzing economic policies, we adopt a methodology that combines calibration and Bayesian estimation of the parameters.
As shown in Table 1, the values of the calibrated parameters are obtained either by referring to the work of Funke et al. (2018)47, through calculations based on Moroccan data, or by referring to Moroccan economic reports and legislative texts.
The model adopted above is estimated based on quarterly data, covering the period48 2007Q2–2017Q2, while using the following series49: real GDP per capita, real consumption per capita, real housing investment50, benchmark interest rate, CPI inflation, housing price inflation, and employment51.
Following Funke et al. (2018), the variables for the benchmark interest rate, CPI inflation, and housing price inflation are centered around their means. For the remaining variables, their data are detrended using the one-sided Hodrick–Prescott filter.

Table 1.
Calibrated parameters.
Table 1.
Calibrated parameters.
| Parameters | Definition | Source of the Calibration | Value |
|---|---|---|---|
| Discount factor of savers. | Funke et al. (2018) | 0.99 | |
| Discount factor of borrowers. | Funke et al. (2018) | 0.98 | |
| Elasticity of substitution between differentiated non-durable goods. | Funke et al. (2018) | 6 | |
| Elasticity of substitution between differentiated durable goods. | Funke et al. (2018) | 6 | |
| Depreciation rate of residential stock. | Funke et al. (2018) | 0.01 | |
| LTV ratio. | (Rapport Annuel Sur La Stabilité Financière, 2017)52. | 0.69 | |
| Share of housing in utility. | Calculated by the authors53. | 0.58 | |
| Property tax. | CODE GENERAL DES IMPOTS (2024). | 0.04 | |
| Degree of openness. | Calculated by the authors54. | 0,42 | |
| Elasticity of substitution between goods produced in different foreign countries. | Funke et al. (2018) | 2 | |
| Elasticity of substitution between domestic and foreign goods. | Funke et al. (2018) | 2 |
The prior means, source of the calibration, standard deviations, and posterior means of the estimated parameters are summarized in Table 2. The Bayesian estimation procedure55 reveals the following for the monetary policy rule: a sensitivity of the base interest rate to inflation and output with respective values of 1.39 and 0.40, as well as a value of 0.51 for the smoothing parameter. Regarding the parameter capturing consumption habits, it is estimated at an average value of 0.37, which is lower than those obtained in two benchmark studies for the Moroccan case: Achour (2019) and El Othmani (2018).
Table 2.
Estimated Parameters.
The inverses of the intertemporal elasticities with respect to labor and consumption are estimated at 1.63 and 1.92, respectively. In the same context, our results indicate that the degree of indexing to past inflation is higher in the residential goods sector than in the non-residential goods sector.
6. Results
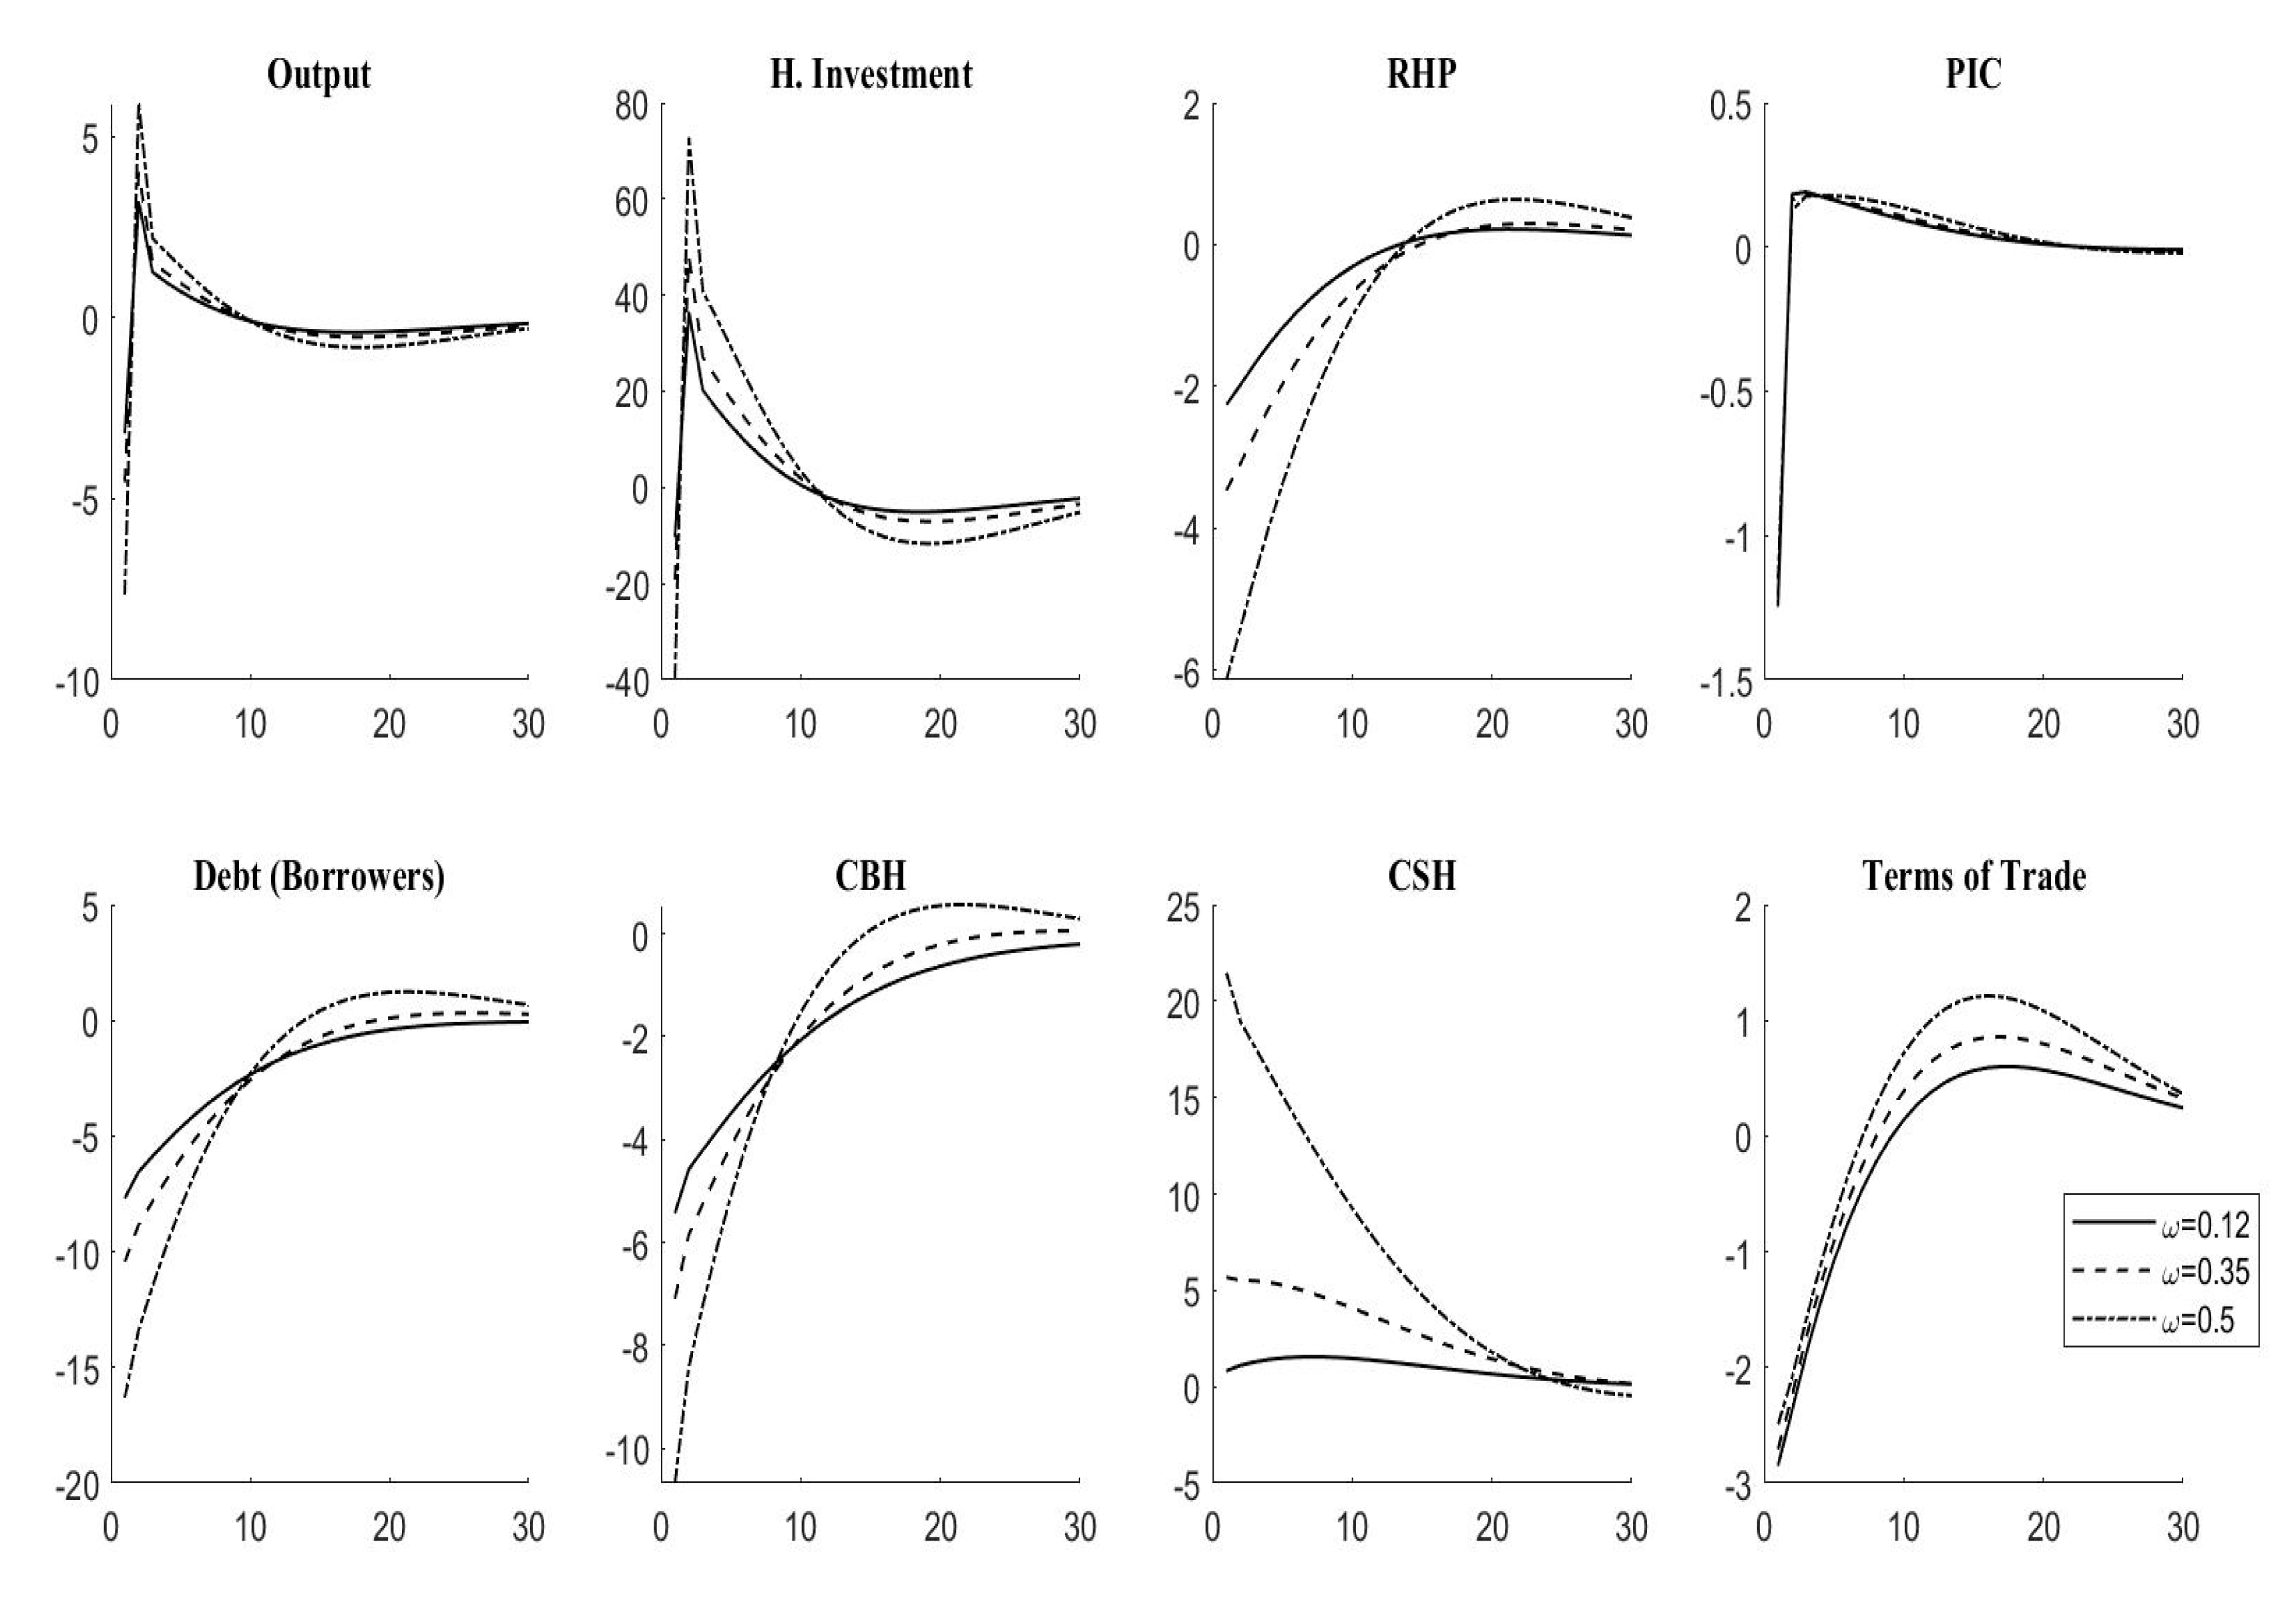
Figure 6 illustrates the impact of a 1% increase in the policy interest rate for different shares of borrowers56. It is clear that the implementation of a restrictive monetary policy has led Moroccan borrowers to reduce their debt as well as their demand for residential goods (noted in the figure as CBH). Consequently, the relative prices of Moroccan housing57 have significantly decreased58. This decline in housing prices leads to a decrease in the value of collateral. According to the borrowing constraint rule, this effect results in a further tightening of credit conditions and amplifies the reduction in the level of indebtedness before returning to equilibrium as the cost of using housing decreases59. This empirical finding highlights the amplifying effect of both the credit channel and the risk-taking channel. Indeed, an increase in interest rates will discourage Moroccan financial intermediaries from taking additional risks (especially after the decrease in the value of collateral), which will influence the average levels of leverage and indebtedness in the country. In the same context, impatient households are forced to reduce their consumption of non-residential goods, which explains the decline in the consumer price index.
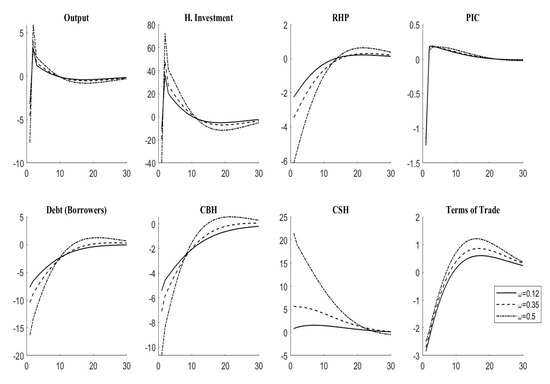
Figure 6.
IRFs of a one-percentage-point increase in the policy interest rates.
For Moroccan lenders, Figure 6 shows that they have substituted their consumption of non-durable goods with residential goods60 (noted in the figure as CSH). This result is consistent with the explanation proposed by Monacelli (2009), according to which the demand of patient households is influenced by a positive income shock and an increase in the real interest rate.
On the other hand, an increase in the key interest rate leads to an appreciation in the real exchange rate and, therefore, a deterioration of the current account. All of these factors explain the decline in Moroccan production. This decline is an important element to analyze, as shown in Figure 6, where GDP variations in this economy follow those of housing investment, a result confirming what has been previously stated by Leamer (2015) regarding the significant impact of the residential sector on the economic cycle. However, the effect of changes in the share of borrowers should not be overlooked. Indeed, our results align with the findings obtained by Funke et al. (2018) for the New Zealand case: due to the amplification of the financial accelerator effect, an increase in the share of impatient households extends the time required for the economic variables presented above to return to their equilibrium state. This empirical finding is a sign of the potential dangers of fueling housing bubbles through credit booms61.
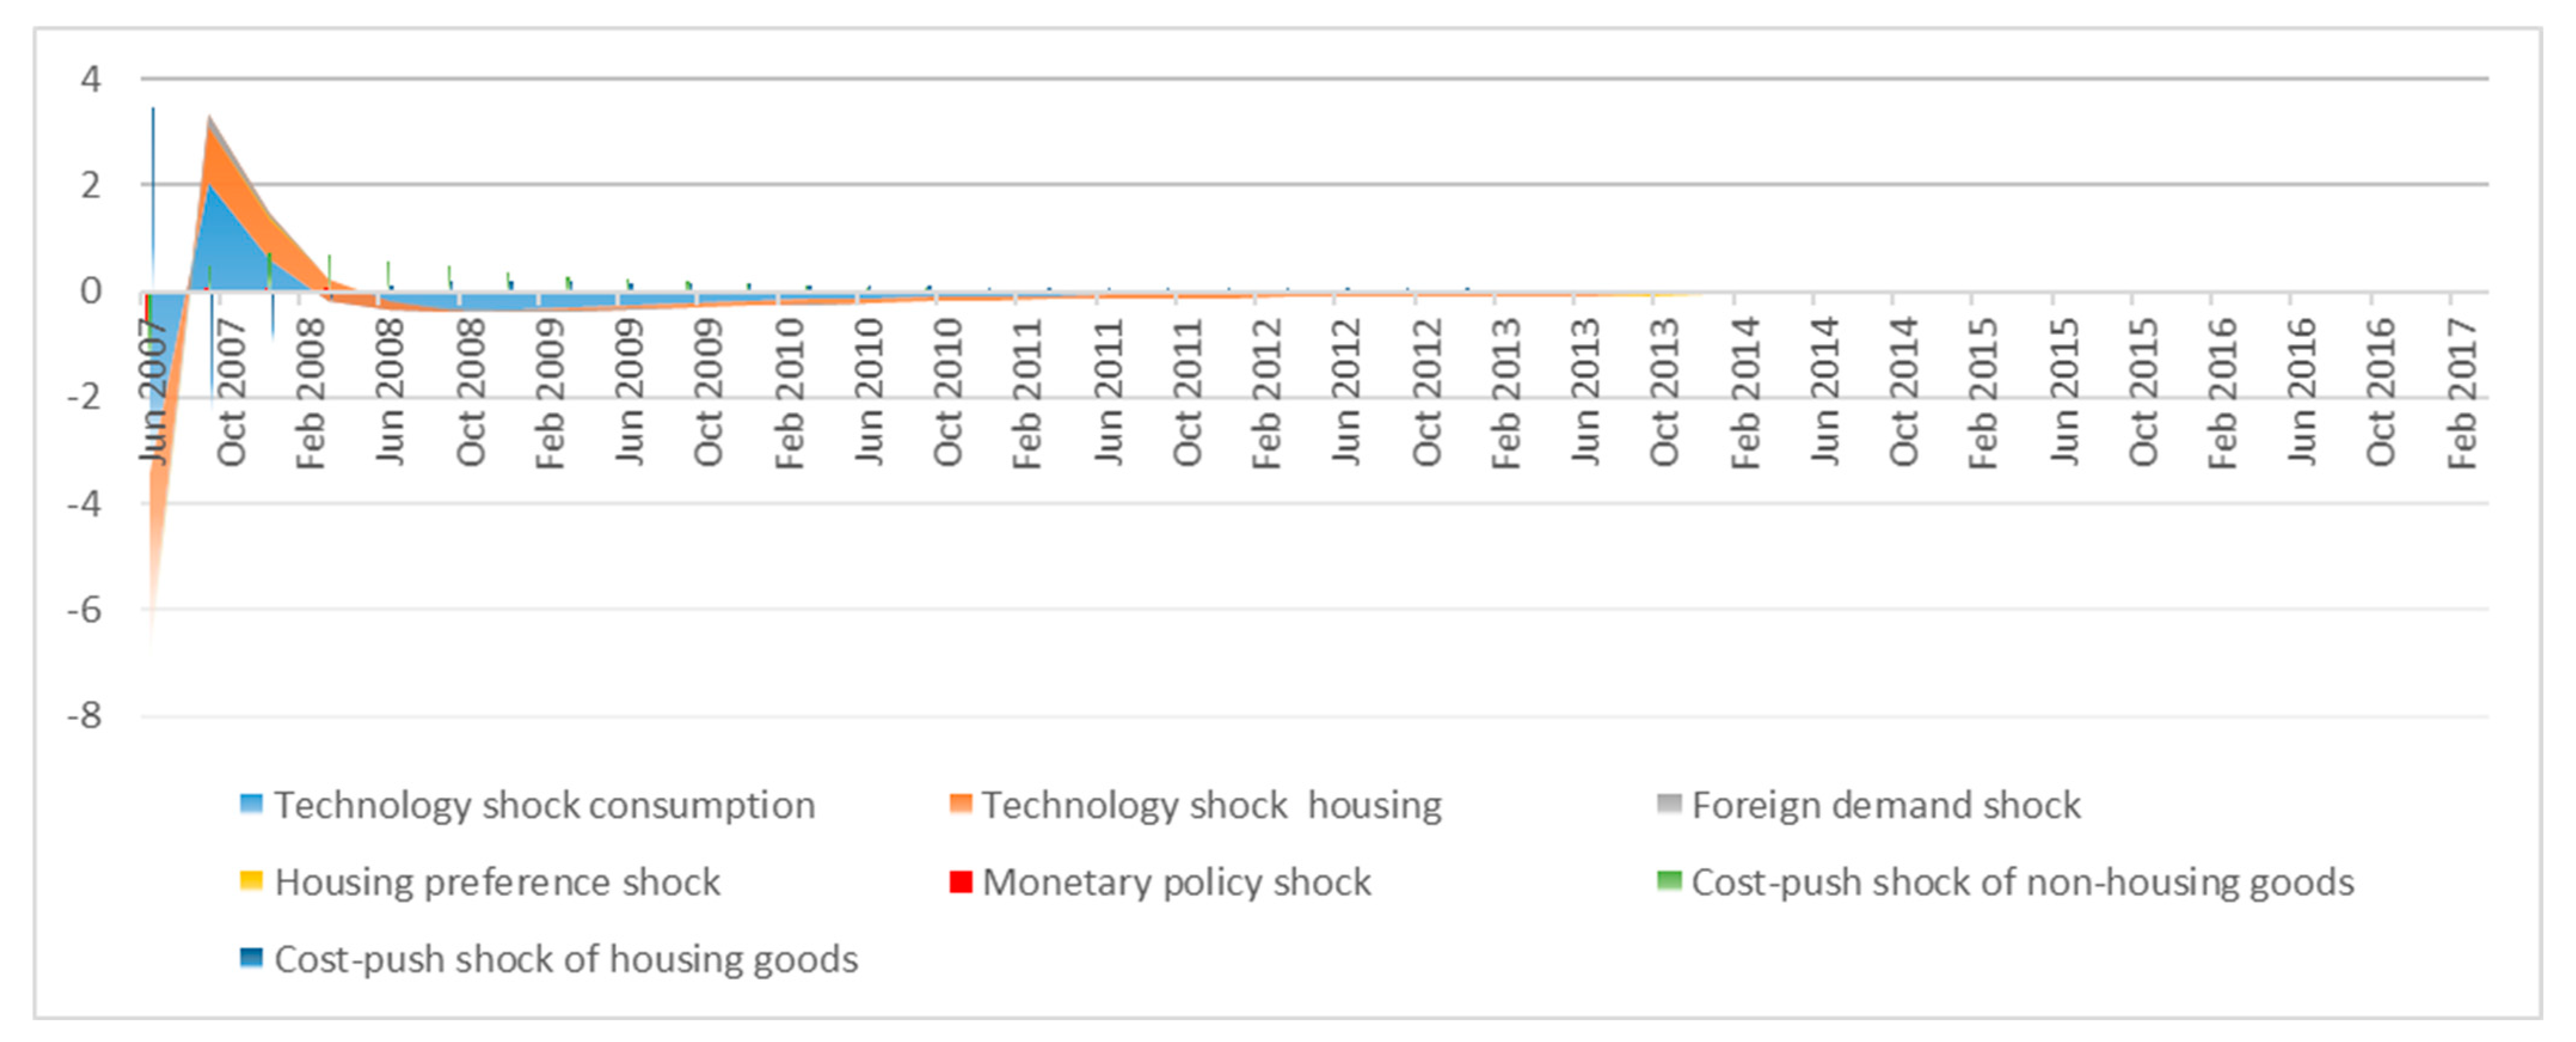
The analysis of the impulse responses above shows that the implementation of an austerity monetary policy could drive housing prices in Morocco downward, but with significant spillover effects on other macroeconomic and financial aggregates. However, as shown in Figure 7, related to the historical decomposition of shocks impacting housing price inflation in Morocco, supply shocks in both the residential and non-residential goods sectors account for a significant share of the variability in this variable62.

Figure 7.
Historical decomposition of shocks impacting housing price inflation in Morocco.
7. Conclusions
In this study, we aimed to assess the effectiveness of monetary policy in influencing housing prices in Morocco. The simulation of the Moroccan economy using a DSGE model revealed a significant impact of the increase in the policy interest rates on the prices of residential goods. This contrasts with the counterintuitive result obtained by Galí & Gambetti (Galí & Gambetti, 2015), that the implementation of a restrictive monetary policy in Morocco will drive the prices of this type of asset downward. Despite this empirical finding, the historical decomposition of shocks impacting the inflation of residential property prices shows that interest rates explain only a small portion of the variations in housing prices in this country.
In addition to the limitations affecting the quality of the model already mentioned by Funke et al. (2018)63, the analytical framework of this model neglects another category of households: renters. Indeed, the inclusion of the rental market could have an effect on the results obtained. In the same context, it would have been preferable to incorporate investor sentiment, as in the case where such sentiment influences the response of residential property prices. It is assumed that monetary authorities, in order to mitigate housing bubbles, would be forced to further increase the key interest rate, which would have negative consequences on production64.
Author Contributions
Conceptualization, R.S.; methodology, R.S.; software, R.S.; validation, O.H.; formal analysis, O.H.; investigation, R.S.; resources, R.S.; data curation, R.S.; writing—original draft preparation, R.S.; writing—review and editing, O.H.; visualization, O.H.; supervision, O.H.; project administration, O.H.; funding acquisition, R.S. All authors have read and agreed to the published version of the manuscript.
Funding
This research received no external funding.
Institutional Review Board Statement
Not applicable.
Data Availability Statement
Data are contained within the article.
Conflicts of Interest
The authors declare no conflict of interest.
Notes
| 1 | This viewpoint contrasts with that of Bernanke and Gertler (1999), who argued that monetary policy should not be guided by an approach aimed at reacting to fluctuations in asset prices. Instead, it should focus on responding to the macroeconomic effects resulting from these fluctuations. |
| 2 | Cf. (Ahir & Loungani, 2019). |
| 3 | Cf. (Bernanke & Gertler, 1999) |
| 4 | Indeed, monetary policy in Morocco has evolved over time in line with the country’s economic situation and objectives: from a policy focused on credit regulation and administered interest rates to one marked by the deregulation of the banking sector and the liberalization of interest rates, aiming to ensure a transition to an inflation-targeting regime. |
| 5 | According to Jordà et al. (2015), real estate bubbles fueled by credit are riskier, and the recessions that follow them are more severe and prolonged. |
| 6 | This approach will allow us to improve the model’s fit by incorporating priors that reflect the structure of the Moroccan economy, especially when the study is conducted with a limited sample size. |
| 7 | This viewpoint contrasts with that of Bernanke and Gertler (1999), according to which monetary policy should not be guided by an approach aimed at responding to fluctuations in asset prices, but rather it should address the macroeconomic effects arising from these fluctuations. |
| 8 | See note 2 above. |
| 9 | Like that of Poterba (1984). |
| 10 | In the sense that implementing a monetary policy characterized by lower interest rates to stimulate housing construction can shift them over time. |
| 11 | It should be noted that Leamer argued that residential properties follow a volume cycle rather than a price cycle. |
| 12 | Indeed, house prices reach their peak of 0.5% after 10 quarters following the monetary shock, and they only return to their trend after 20 quarters. |
| 13 | It should be noted that, in line with other studies, these authors tested the hypothesis suggesting that due to structural changes in the financial system and the monetary policy regime (during the 1980s), the relationship between monetary variables and housing prices has changed. Their results indicate a stronger relationship during the period 1985–2006. |
| 14 | Cf. (Miles & Zhu, 2023). |
| 15 | Kuttner (2012) has stated that the results of these studies are weaker than those implied by the user cost theory. Indeed, the latter suggests an effect of interest rates on housing prices between 1.3% and 1.6%. However, VAR models predict an effect between 0.3% and 0.8%. |
| 16 | These quarterly data, provided by the Bank for International Settlements, cover 20 countries and span the period from 1970 to 2018. |
| 17 | However, for them, this does not mean that it is always the optimal decision. Indeed, according to André et al. (2022), it is necessary to distinguish between two situations: the first is for an economy at full employment with an inflation rate exceeding the target rate, and the second is for an economy with underemployment, a low inflation rate, and coinciding with a rapid appreciation in housing prices. Implementing a restrictive monetary policy would be more costly in economic terms in the second situation than in the first. |
| 18 | Indeed, the increase in real housing prices resulting from an accommodative quantitative easing shock (4.56%) is larger than that produced by a conventional monetary shock (2.30%). |
| 19 | Due to the decrease in borrowing costs and the increase in demand for durable goods. |
| 20 | Cf. (Pierre, 2018). |
| 21 | Rossi (2021) noted the robustness of VAR-based methods compared to the potential misspecification of DSGE models. However, structural DSGE models provide researchers with greater flexibility in integrating external information and narratives on structural changes. |
| 22 | While noting that expenditures on durable goods are characterized by greater sensitivity compared to expenditures on non-durable goods. |
| 23 | Examples of these efforts include: providing financial assistance to buyers, the 250,000-dirham social housing program, and the low-value 140,000-dirham social housing program. |
| 24 | Cf. (Funke et al., 2018). |
| 25 | In 2023, the number of housing units produced reached 168,628 units. |
| 26 | As shown in Figure 4. |
| 27 | Cf. (Kiyotaki & Moore, 1997). |
| 28 | Through the imposition of a borrowing constraint on impatient households, this model allowed us to take into account the commitment of Bank Al-Maghrib to implement one of the crucial instruments of macroprudential policy aimed at preventing financial crises. This is the "loan-to-value" ratio, which requires this type of economic agent to borrow up to a determined fraction of the value of the new real estate acquisition. |
| 29 | It should be noted that, following other previous academic contributions such as (Monacelli, 2009), (Funke & Paetz, 2013), and Funke et al. (2018), we chose to neglect the modeling of the capital accumulation process. |
| 30 | Cf. (CODE GENERAL DES IMPOTS, 2024). |
| 31 | This exogenous process can be formulated as follows: . |
| 32 | With:. |
| 33 | It can be defined as
where
is the depreciation rate of the residential property stock. |
| 34 | Adjusted for LTV and amortization . |
| 35 | Note that we define
and as multipliers on Equations (5) and (6), respectively. |
| 36 | According to Monacelli, this value depends on three elements: the utility gain resulting from the consumption of an additional unit of durable goods , the additional utility provided by the relaxation of the collateral constraint , and the anticipated utility derived from future consumption financed by the sale of a real estate asset acquired in the middle of the previous period: |
| 37 | Except that they are not subject to a borrowing constraint. |
| 38 | Although Morocco has not yet fully liberalized its exchange rate regime, adopting an analytical framework based on the assumption of a floating nominal exchange rate has two implications: firstly, it reflects the commitment of the country’s monetary authorities to a gradual transition towards a more flexible exchange rate regime; secondly, it will allow us to capture the impact of this transition on the transmission of monetary policy in this economy. |
| 39 | For the other variables, we maintain the same notation as that used for the variables related to borrowers. |
| 40 | Where et . |
| 41 | Cf. (Funke & Paetz, 2013). |
| 42 | Where: . This equation, according to (Funke & Paetz, 2013), denotes the sector-specific cost shocks for each production sector. |
| 43 | For more details on the conditions under which purchasing power parity is upheld, the reader may refer to the work of Gali and Monacelli (2005). |
| 44 | Cf. (Funke & Paetz, 2013), (Funke et al., 2018). |
| 45 | This shock is defined by (Funke et al., 2018) as: . |
| 46 | We assume that Bank Al-Maghrib defines price stability as the main objective of its monetary decisions. |
| 47 | Indeed, the choice of this work as the calibration reference is explained by our observation that, for the Moroccan case, these values improve the model’s fit quality and the consistency of the impulse response functions. |
| 48 | As noted by Achour (2019), the choice of an estimation period starting from 2007 is justified by two reasons: first, this year, after the update of the Moroccan national accounting system, is established as the base year; second, it is possible that statistical methods related to the alignment of samples with different base years may lead to an incorrect specification of the model. |
| 49 | All these variables are seasonally adjusted using the X-13 ARIMA procedure. |
| 50 | Due to a lack of data on real housing investment, this variable was approximated by the number of completed housing units sourced from the database of the Ministry of National Territorial Planning, Urbanism, Housing, and City Policy. To align it with the quarterly frequency of the model, this annual data series was transformed into a quarterly format. |
| 51 | The variables for real GDP per capita, real consumption per capita, and employment are collected and processed from the database of the High Commission for Planning in Morocco. |
| 52 | Cf. (Rapport Annuel Sur La Stabilité Financière, 2017). |
| 53 | This value is obtained by calculating the average ratio of real residential investment to real GDP. |
| 54 | Obtained by calculating the average ratio of imports to GDP over the period 2014Q1–2023Q1. |
| 55 | The estimation of the posterior distribution is carried out using the Metropolis–Hastings algorithm. |
| 56 | The impulse responses are plotted for three assumptions regarding the shares of Moroccan borrowers: 0.12, as estimated by Funke et al. (Funke et al., 2018) 0.35 as in Iacoviello and Neri (2010) and 0.50 as in Monacelli (2009). |
| 57 | Noted in the figure as RHP. |
| 58 | The empirical finding of a negative impact of an increase in the policy interest rate on housing prices in Morocco aligns with the results obtained by Goodhart and Hofmann (2008), Musso et al. (2011), and André et al. (2022). However, it contrasts with the findings of Miles and Zhu (2023), who revealed the ineffectiveness of monetary policy in influencing housing prices. |
| 59 | This result is in agreement with what is suggested by Yassine Slaoui (2024) on the ability of housing prices, as a credit supply factor, to influence credit growth in Morocco. |
| 60 | It should be noted that the lenders in this economy reduce their consumption of non-residential goods in a less intense manner than the borrowers. |
| 61 | As demonstrated by Jordà et al. (2015), asset price bubbles fueled by credit increase the risk of financial crises. Moreover, the collapse of these prices generates deeper recessions and slower returns to equilibrium. |
| 62 | This finding is consistent with the results of Campbell et al. (2009) and Funke et al. (2018). |
| 63 | Among these limitations, we can mention the failure to account for recession and expansion cycles, capital gains taxation, and legal depreciation requirements. In addition to an analysis conducted at the intensive margin rather than the extensive margin, the analytical framework of this model is characterized by limited heterogeneity. |
| 64 | As previously stated by André et al. (2022). |
References
- Achour, A. (2019). Réserves de change et fonctionnement de l’économie marocaine: Enseignements partir d’un modèle DSGE. Available online: https://www.bkam.ma/ (accessed on 11 March 2025).
- Ahearne, A. G., Ammer, J., Doyle, B. M., Kole, L. S., & Martin, R. F. (2005). House prices and monetary Policy: A cross-country study. Available online: https://www.federalreserve.gov/econres.htm (accessed on 11 March 2025).
- Ahir, H., & Loungani, P. (2019). Managing House Price Booms: Evolution of IMF Surveillance and Policy Advice. In Hot property: The housing market in major cities (pp. 83–95). Springer International Publishing. [Google Scholar] [CrossRef]
- André, C., Caraiani, P., Călin, A. C., & Gupta, R. (2022). Can monetary policy lean against housing bubbles? Economic Modelling, 110, 105801. [Google Scholar]
- Bernanke, B., & Gertler, M. (1999). Monetary policy and asset price volatility. Available online: https://www.kansascityfed.org/documents/3539/1999-S99gert.pdf (accessed on 11 March 2025).
- Campbell, S. D., Davis, M. A., Gallin, J., & Martin, R. F. (2009). What moves housing markets: A variance decomposition of the rent-price ratio’. Journal of Urban Economics, 66(2), 90–102. [Google Scholar] [CrossRef]
- Chen, S. S., & Lin, T. Y. (2022). Revisiting the link between house prices and monetary policy’, B.E. Journal of Macroeconomics, 22(2), 481–515. [Google Scholar] [CrossRef]
- CODE GENERAL DES IMPOTS. (2024). Available online: https://impots.cm/fr/document/code-general-des-impots-2024 (accessed on 11 March 2025).
- Costa, C. J. (2025). Understanding DSGE (1st ed.). Vernon Press. 2016. Available online: https://vernonpress.com/book/70 (accessed on 11 March 2025).
- Del Negro, M., & Otrok, C. (2007). 99 Luftballons: Monetary policy and the house price boom across U.S. states’. Journal of Monetary Economics, 54(7), 1962–1985. [Google Scholar] [CrossRef]
- El Khalifi, A., Ouakil, H., & Torres, J. L. (2024). Efficiency and welfare effects of fiscal policy in emerging economies: The case of morocco. International Economic Journal, 38(3), 507–530. [Google Scholar] [CrossRef]
- El Othmani, J. (2018). Estimation bayésienne d’un modèle néo-keynésien pour l’économie marocaine. Available online: www.bkam.ma (accessed on 11 March 2025).
- Funke, M., Kirkby, R., & Mihaylovski, P. (2018). House prices and macroprudential policy in an estimated DSGE model of New Zealand. Journal of Macroeconomics, 56, 152–171. [Google Scholar] [CrossRef]
- Funke, M., & Paetz, M. (2013). Housing prices and the business cycle: An empirical application to Hong Kong. Journal of Housing Economics, 22(1), 62–76. [Google Scholar] [CrossRef]
- Gali, J., & Monacelli, T. (2005). Monetary policy and exchange rate volatility in a small open economy. The Review of Economic Studies, 72(3), 707–734. [Google Scholar]
- Galí, J., & Gambetti, L. (2015). The effects of monetary policy on stock market bubbles: Some evidence. American Economic Journal: Macroeconomics, 7(1), 233–257. [Google Scholar] [CrossRef]
- Gan, J. (2010). Housing wealth and consumption growth: Evidence from a large panel of households. Review of Financial Studies, 23(6), 2229–2267. [Google Scholar] [CrossRef]
- Goodhart, C., & Hofmann, B. (2008). House prices, money, credit, and the macroeconomy. Oxf Review of Economic Policy, 24(1), 180–205. [Google Scholar] [CrossRef]
- Gupta, R., Jurgilas, M., Kabundi, A., & Miller, S. M. (2012). Monetary policy and housing sector dynamics in a large-scale Bayesian vector autoregressive model’. International Journal of Strategic Property Management, 16(1), 1–20. [Google Scholar] [CrossRef]
- Hatzius, J. (2008). Beyond leveraged losses: The balance sheet effects of the home price downturn. Brookings. [Google Scholar]
- Iacoviello, M. (2005). House prices, borrowing constraints, and monetary policy in the business cycle. American Economic Review, 95(3), 739–764. [Google Scholar] [CrossRef]
- Iacoviello, M., & Neri, S. (2010). Housing market spillovers: Evidence from an estimated DSGE model. American Economic Journal: Macroeconomics, 2(2), 125–164. [Google Scholar] [CrossRef]
- Jarociński, M., & Smets, F. (2008). House prices and the stance of monetary policy. Available online: https://www.ecb.europa.eu/pub/pdf/scpwps/ecbwp891.pdf (accessed on 11 March 2025).
- Jordà, Ò., Schularick, M., & Taylor, A. M. (2015). Leveraged bubbles. Journal of Monetary Economics, 76, S1–S20. [Google Scholar] [CrossRef]
- Justiniano, A., & Preston, B. (2010). Monetary policy and uncertainty in an empirical small open-economy model. Journal of Applied Econometrics, 25(1), 93–128. [Google Scholar] [CrossRef]
- Kiyotaki, N., & Moore, J. (1997). Credit cycles. Journal of Political Economy, 105(2), 211–248. [Google Scholar] [CrossRef]
- Kuttner, K. N. (2012). Low interest rates and housing bubbles: Still no smoking gun. In The role of central banks in financial stability, world scientific studies in international economics (Vol. 30, pp. 159–185). World Scientific Publishing. [Google Scholar] [CrossRef]
- Lastrapes, W. D. (2002). The real price of housing and money supply shocks: Time series evidence and theoretical simulations. Journal of Housing Economics, 11(1), 40–74. [Google Scholar] [CrossRef]
- Leamer, E. E. (2015). Housing really is the business cycle: What survives the lessons of 2008–09? Journal of Money, Credit and Banking, 47(S1), 43–50. [Google Scholar] [CrossRef]
- Miles, W., & Zhu, X. (2023). Housing and the changing impact of monetary policy. International Review of Economics & Finance, 86, 587–603. [Google Scholar]
- Ministère de l’Aménagement du Territoire National. (2022). Ministère de l’Aménagement du Territoire National, ‘Évolution des indicateurs du secteur de l’immobilier: Dix ans de dynamisme (2012–2021). Available online: https://www.mhpv.gov.ma/fr/ (accessed on 11 March 2025).
- Monacelli, T. (2009). New Keynesian models, durable goods, and collateral constraints. Journal of Monetary Economics, 56(2), 242–254. [Google Scholar] [CrossRef]
- Moustabchir, A., Ouakil, H., El Ouazzani, H., & Lechheb, H. (2024a). A DSGE model approach to examining the impact of the Russian–Ukrainian War and oil shocks on the Moroccan economy. African Development Review, 36(S1), S94–S107. [Google Scholar] [CrossRef]
- Moustabchir, A., Ouakil, H., El Ouazzani, H., & Lechheb, H. (2024b). Modeling the circular economy in food production: Insights from a dynamic stochastic general equilibrium analysis. Elsevier B.V. [Google Scholar] [CrossRef]
- Musso, A., Neri, S., & Stracca, L. (2011). Housing, consumption and monetary policy: How different are the US and the euro area? Journal of Banking and Finance, 35(11), 3019–3041. [Google Scholar] [CrossRef]
- Nsafoah, D., & Dery, C. (2024). Effect of conventional and unconventional monetary policy shocks on housing prices in Canada. Journal of Housing Economics, 64, 101993. [Google Scholar] [CrossRef]
- Nsafoah, D., & Hashmi, A. R. (2021). International spillovers of new monetary policy. International spillovers of conventional versus new monetary policy. Working Papers 2021-03. Department of Economics, University of Calgary. Available online: https://ideas.repec.org/p/clg/wpaper/2021-03.html (accessed on 11 March 2025).
- Ouakil, H., Moustabchir, A., Lechheb, H., & El Ouazzani, H. (2024). Fiscal policy in the face of the health crisis: A simulation using a hybrid DSGE-SIR model. African Development Review, 3(3), 425–443. [Google Scholar] [CrossRef]
- Pierre, R. A. (2018). Analyse macroéconomique et politiques de stabilisation. 546. OCP Policy Center. [Google Scholar]
- Poterba, J. M. (1984). Tax subsidies to owner-occupied housing: An asset-market approach. Quarterly Journal of Economics, 99(4), 729–752. [Google Scholar]
- Rapport Annuel Sur La Stabilité Financière. (2017). Available online: https://www.bcc.cd/surveillance-des-intermediaires-financiers/publications/rapport-annuel-sur-la-stabilite-financiere/rapport-sur-la-stabilite-financiere-2017 (accessed on 11 March 2025).
- Rossi, B. (2021). Identifying and estimating the effects of unconventional monetary policy: How to do it and what have we learned? Economic Journal, 24(1), C1–C32. [Google Scholar]
- Slaoui, Y. (2024). Dynamique de l’offre de crédits et activité économique au Maroc. Available online: www.bkam.ma (accessed on 11 March 2025).
- Taylor, J. B. (2007). Housing and monetary policy. Available online: http://www.nber.org/papers/w13682 (accessed on 11 March 2025).
Disclaimer/Publisher’s Note: The statements, opinions and data contained in all publications are solely those of the individual author(s) and contributor(s) and not of MDPI and/or the editor(s). MDPI and/or the editor(s) disclaim responsibility for any injury to people or property resulting from any ideas, methods, instructions or products referred to in the content. |
© 2025 by the authors. Licensee MDPI, Basel, Switzerland. This article is an open access article distributed under the terms and conditions of the Creative Commons Attribution (CC BY) license (https://creativecommons.org/licenses/by/4.0/).