
The Growth of Maritime Communications and Technology Related to the Trends in the Shipping Industry: A Financial Perspective

 , ,
, ,  and
and 
Abstract
1. Introduction
2. An Overview of the Maritime Industry Digitalization
2.1. Digitalization of Communication Technologies of the Maritime Industry
2.2. Financial and Business Challenges of Digitalization in the Maritime Industry
3. Methodology
3.1. Data Selection
- The rapid advancement of technology, particularly in the realm of artificial intelligence, is driving market growth by introducing new products and solutions. This includes increased availability of products such as airtime connections, expanded coverage, faster speeds, and innovative software and hardware solutions. As a result, the market itself is becoming more appealing from a marketing perspective, creating an endogenous effect that enhances its attractiveness.
- Changes in the legal framework governing maritime communications and technology could impact market growth by mandating the adoption of new technologies such as e-navigation. Moreover, additional legal requirements increase demand and subsequent revenue streams on maritime technology products, such as the direction for GMDSS requirements, which has led to the increase in the sale of GMDSS systems. As far as the directive for compulsory possessing two onboard ECDIS systems (i.e., one basic and one spare) gives rise to almost doubling the demand for ECDIS sales. This external factor could influence the market independently of the growth and financial trends of the shipping industry.
- The growth of the shipping industry, both in terms of increased revenues and the construction of new vessels, expands the market for maritime communications. At the same time, technological and regulatory factors are important for driving growth, and the financial perspective of the shipping industry plays a crucial role in establishing the conditions for the maritime communications market to thrive. Additionally, the perception that improved maritime connectivity positively impacts the value added and operational efficiency of shipping companies significantly contributes to the appeal of new connectivity products and solutions in the market.
3.2. Model and Variables

| Variable | Coding | Description |
|---|---|---|
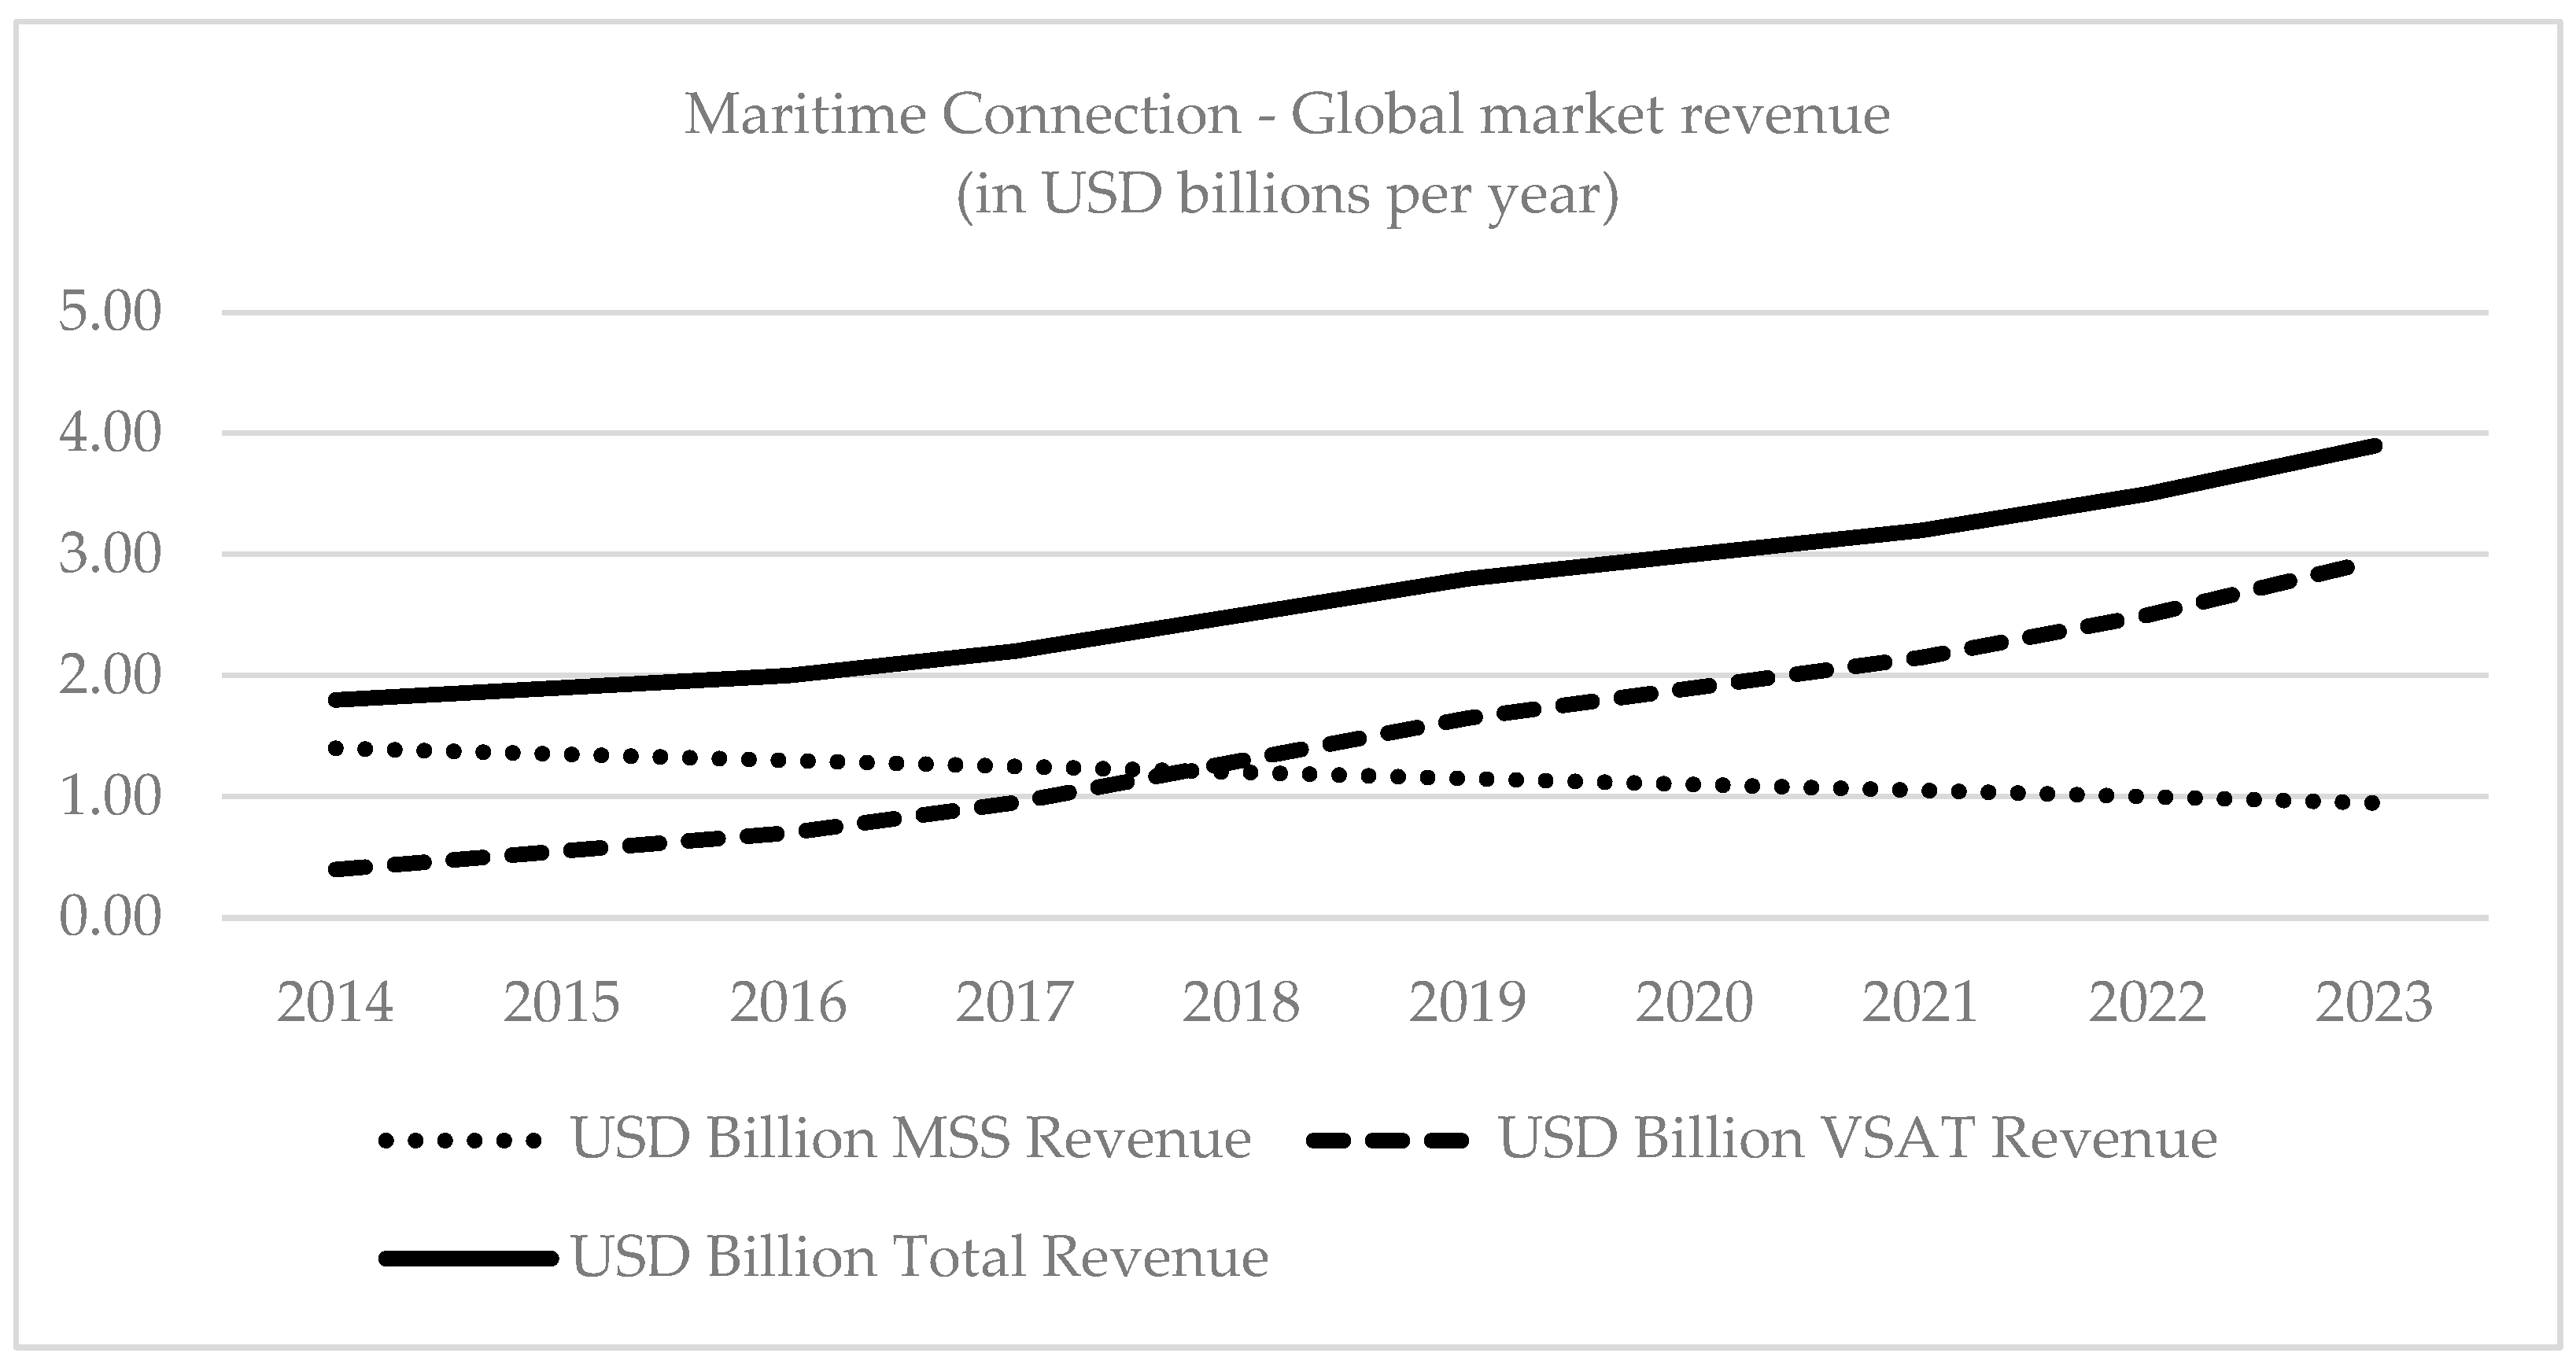
| Maritime Communication Revenue | MCREV | Maritime Communication Revenue in ‘000s USD. |
| International maritime trade | IMT | International maritime trade in billions of tons loaded. |
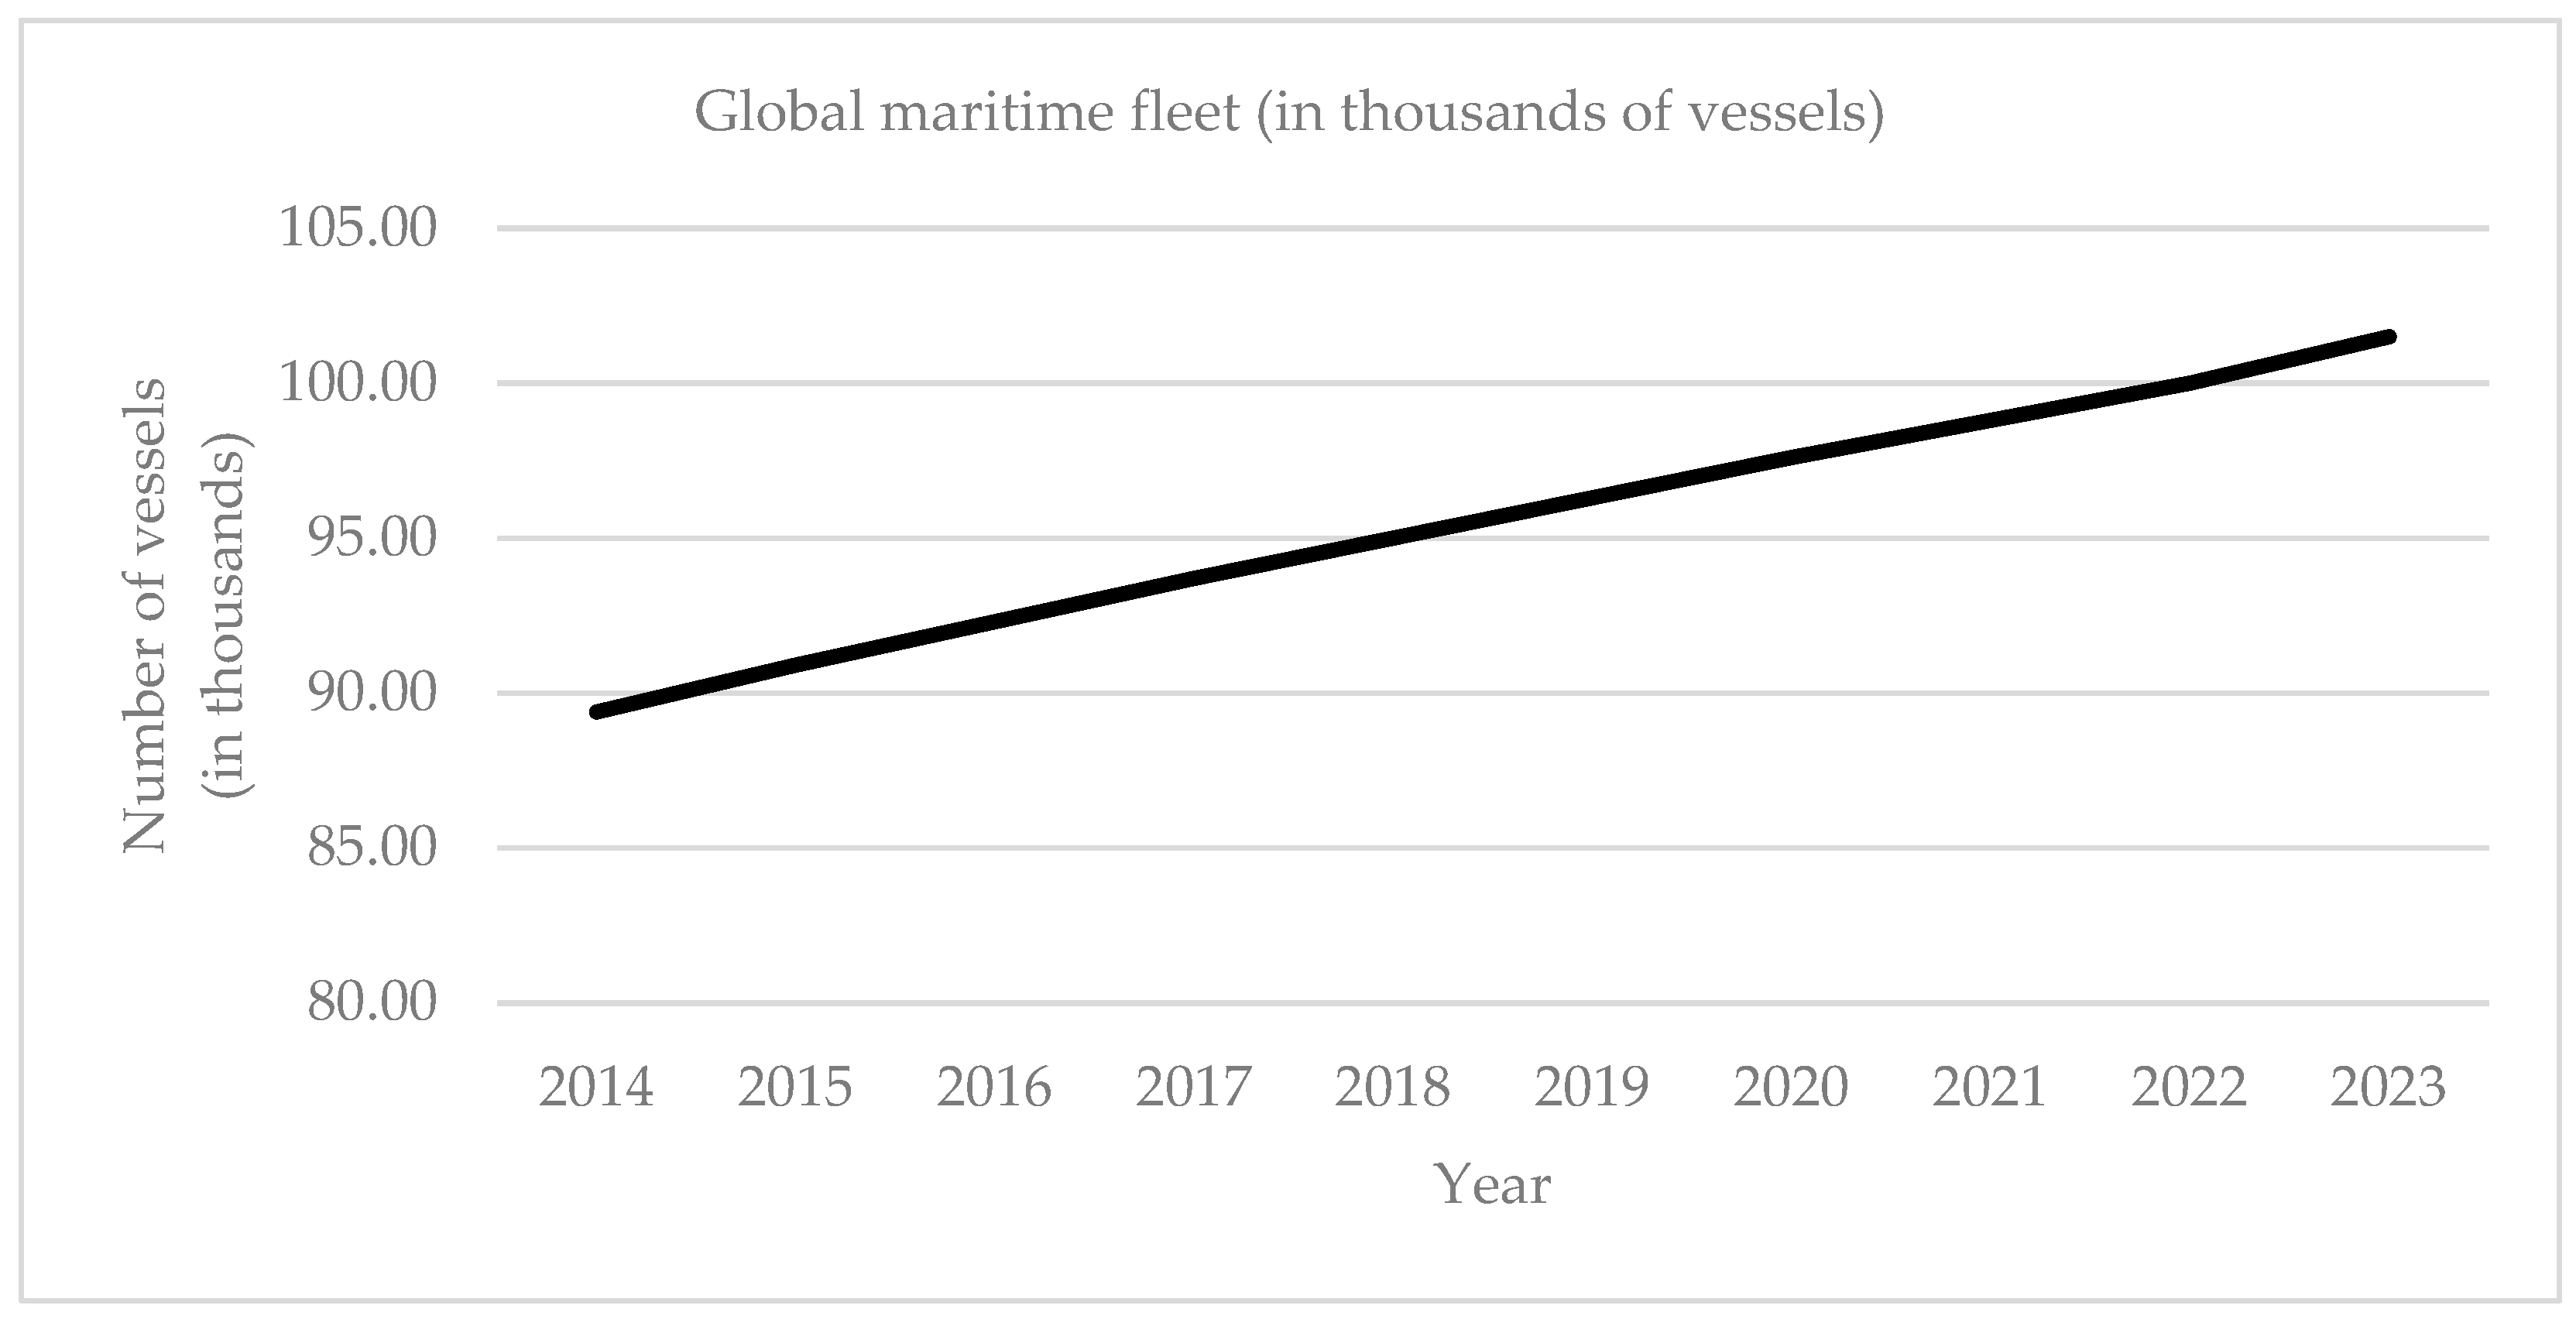
| Global maritime fleet—type A | GMFA | Global maritime fleet—type A measurement in ‘000s of vessels. |
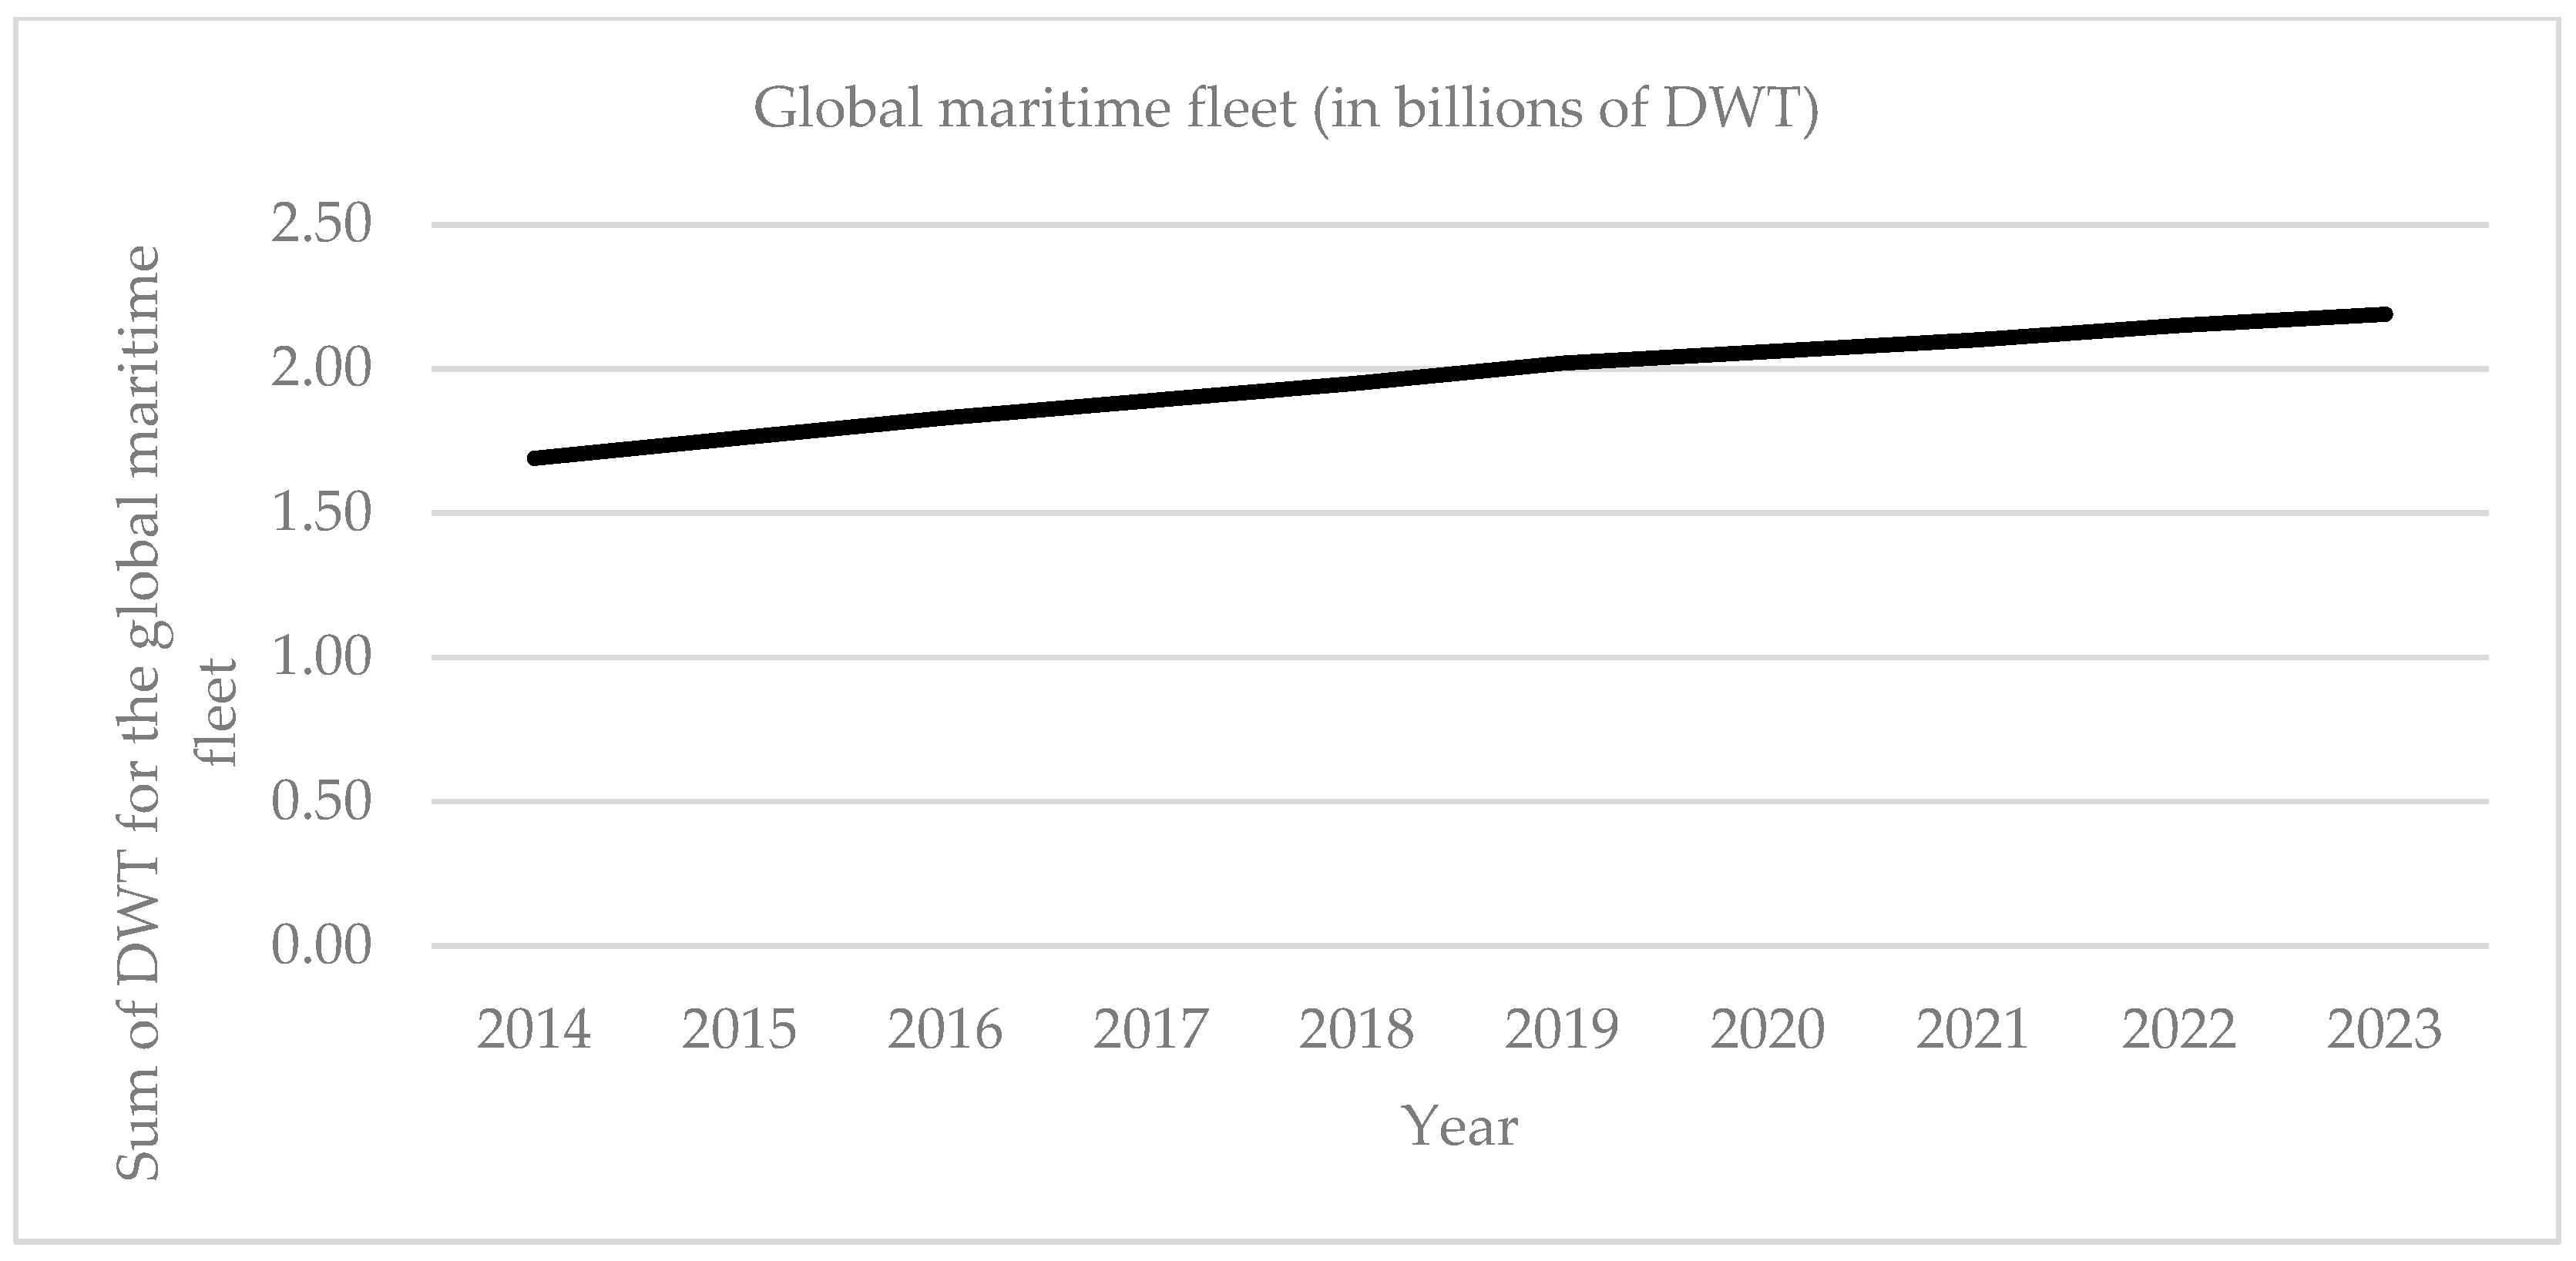
| Global maritime fleet—type B | GMFB | Global maritime fleet—type B measurement in billions of DWT1 |
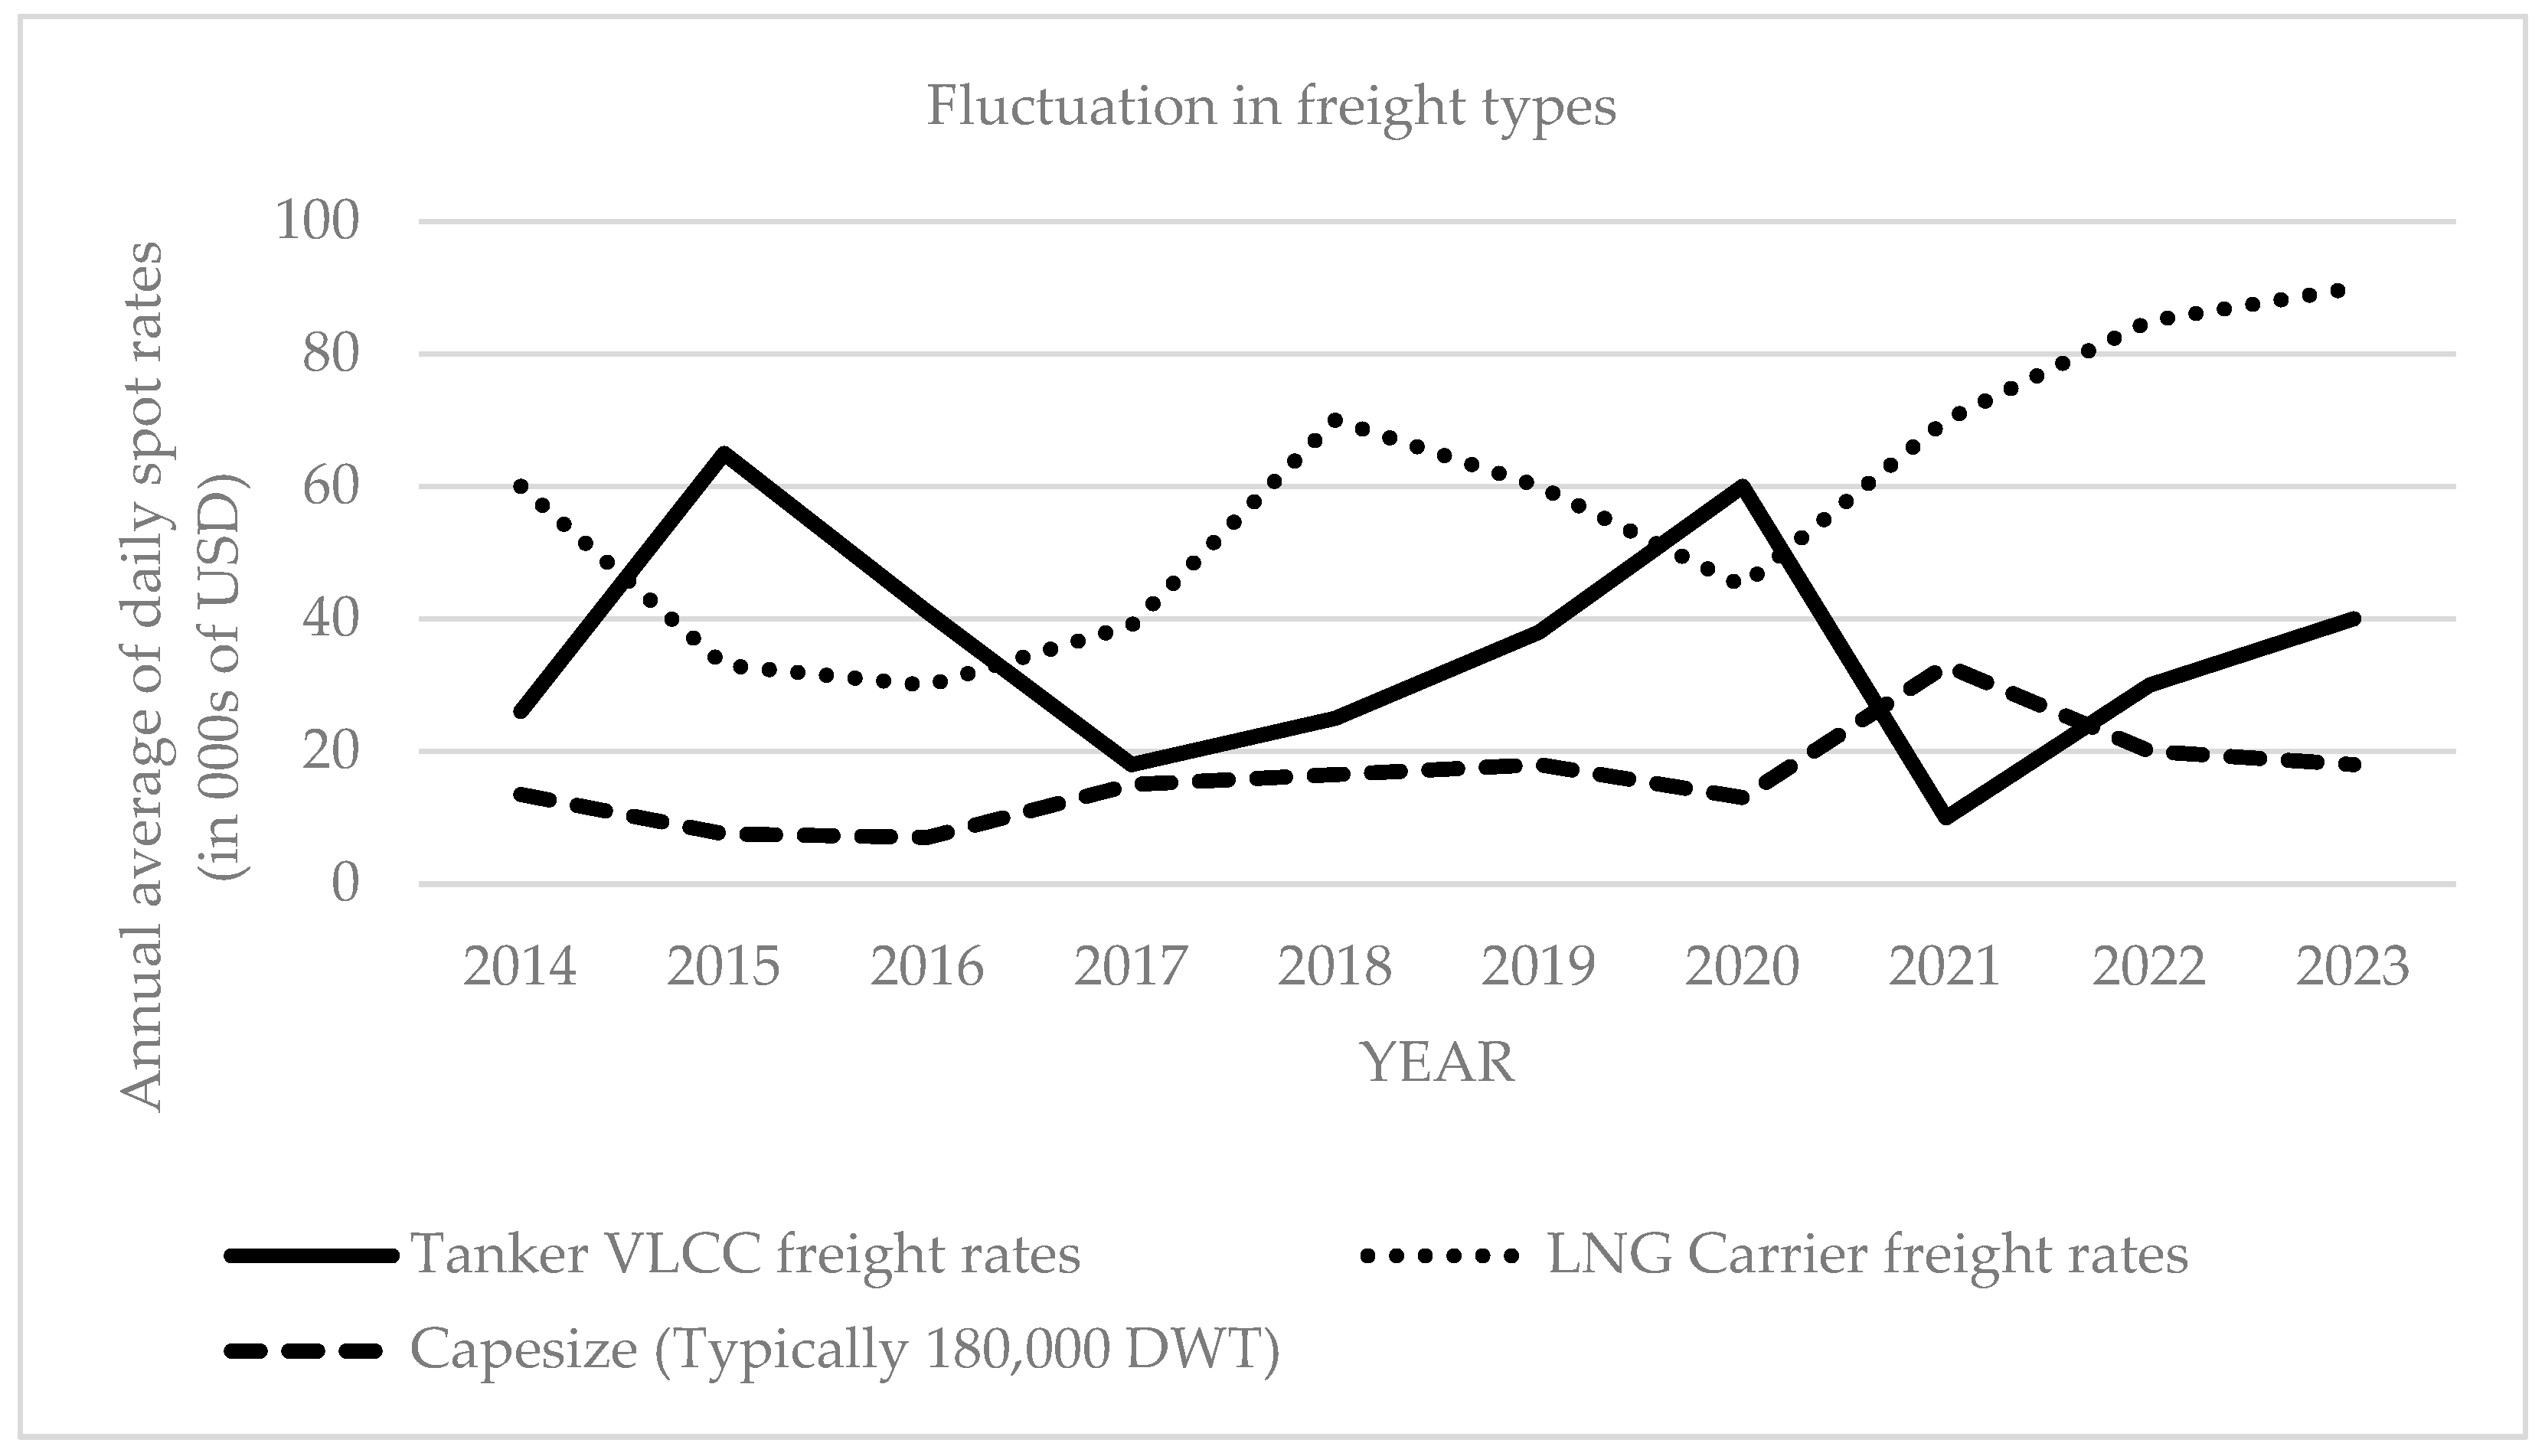
| Freight rates in tankers | FRTAN | Freight rates in tankers—estimated as annual average of daily VLCC spot rates in ‘000s USD. |
| Freight rates in LNG vessels | FRLNG | Freight rates in LNG vessels—estimated as annual average of daily LNG carrier spot rates in ‘000s USD. |
| Freight rates in dry bulk carriers of Capesize | FRDB | Freight rates in dry bulk carriers of Capesize—estimated as annual average of daily Spot Rates for dry bulk Capesize carriers in ‘000s USD. |
- The first concept delves into the volume of market activity in the shipping industry. Given the inherent limitation in collecting financial data, such as revenue and profits, due to reporting and disclosure constraints (e.g., offshore entities), we identify the figures of the international maritime trade to be more representative.
- The second concept explores the volume of market potential. Based on this notion, we assess the size of the global maritime fleet using two different measures of measurement: the absolute number of vessels and total tonnage for all active vessels.
- The third concept examines the volume of market demand. In this case, we consider freight rates, estimated as the annual average of the daily rates of each year. However, considering that freight rates vary based on vessel type, we choose to investigate the rates for the largest version of each major vessel type (e.g., tanker, LNG, dry bulk).
3.3. Data Presentation for the Main Variables
4. Results
5. Discussion and Conclusions
Author Contributions
Funding
Data Availability Statement
Conflicts of Interest
| 1 | Deadweight Tonnage. |
| 2 | For the p-values expressed as 0.000 in the table, the actual value is not zero but rather very close to it. Thus, we round it to three decimals. |
References
- Al-Hargusi, S. N. M., Al-Zaidi, S. A. K., Boeva, K., Dem’Yanova, E., & Shevchenko, D. (2024). Digital transformation of maritime cargo shipping in international business. E3S Web of Conferences, 515, 04019. [Google Scholar] [CrossRef]
- Alqurashi, F., Trichili, A., Saeed, N., Ooi, S. B., & Alouini, M. (2022). Maritime communications: A survey on enabling technologies, opportunities, and challenges. IEEE Internet of Things Journal, 10, 3525–3547. [Google Scholar] [CrossRef]
- Baltic Exchange. (2024). Data for Annual fluctuation in selected freight types for the period 2014–2023. Available online: https://www.balticexchange.com/en/data-services/market-information0.html (accessed on 10 December 2024).
- Banerjee, A., Duflo, E., & Qian, N. (2020). On the road: Access to transportation infrastructure and economic growth in China. Journal of Development Economics, 145(C), 102442. [Google Scholar] [CrossRef]
- Berg, D. (2015). Digitalization in shipping and logistics. Available online: https://www.munichre.com/en/insights/mobility-and-transport/digitalisation-shipping-logistics.html (accessed on 10 December 2024).
- Calatayud, A., Mangan, J., & Palacin, R. (2017). Connectivity to international markets: A multi-layered network approach. Journal of Transport Geography, 61(C), 61–71. [Google Scholar] [CrossRef]
- Chang, Y., & Danao, D. (2017). Green shipping practices of shipping firms. Sustainability, 9(5), 829. [Google Scholar] [CrossRef]
- Charamis, D., & Rodosthenous, M. (2022). COVID-19 impact on financial & non-financial reporting quality: Greek listed entities. Theoretical Economics Letters, 12, 1259–1279. [Google Scholar] [CrossRef]
- Chen, W., Li, C., Yu, J., Zhang, J., & Chang, F. (2021). A survey of maritime communications: From the wireless channel measurements and modeling perspective. Regional Studies in Marine Science, 48, 102031. [Google Scholar] [CrossRef]
- Clarksons. (2024). Data for annual size growth in the Global Maritime Fleet for the period 2014–2023. Available online: https://www.clarksons.net/n/#/portal (accessed on 10 December 2024).
- Daya, A. A., & Lazakis, I. (2023). Component criticality analysis for improved ship machinery reliability. Machines, 11, 737. [Google Scholar] [CrossRef]
- Disant, A., & Dias, F. (2020). Microwave propagation in maritime environments. Marine Technology Society Journal, 54(2), 17–24. [Google Scholar] [CrossRef]
- Drosos, D., Kyriakopoulos, G. L., Arabatzis, G., & Tsotsolas, N. (2020). Evaluating customer satisfaction in energy markets using a multicriteria method: The case of electricity market in Greece. Sustainability, 12(9), 3862. [Google Scholar] [CrossRef]
- Fjortoft, K. E., Kvamstad, B., & Bekkadal, F. (2009). Maritime communication to support safe navigation. International Journal on Marine Navigation and Safety of Sea Transportation, 3(1), 87–92. [Google Scholar]
- Fruth, M., & Teuteberg, F. (2017). Digitization in maritime logistics—What is there and what is missing? Cogent Business & Management, 4(1), 1411066. [Google Scholar] [CrossRef]
- Giering, J.-E., & Dyck, A. (2021). Maritime Digital Twin architecture: A concept for holistic Digital Twin application for shipbuilding and shipping. Automatisierungstechnik, 69(12), 1081–1095. [Google Scholar] [CrossRef]
- Girdzijauskas, S., Streimikiene, D., Griesiene, I., Mikalauskiene, A., & Kyriakopoulos, G. L. (2022). New approach to inflation phenomena to ensure sustainable economic growth. Sustainability, 14(1), 518. [Google Scholar] [CrossRef]
- Gkika, E. C., Anagnostopoulos, T., Ntanos, S., & Kyriakopoulos, G. L. (2020). User preferences on cloud computing and open innovation: A case study for university employees in Greece. Journal of Open Innovation: Technology, Market, and Complexity, 6(2), 41. [Google Scholar] [CrossRef]
- González Chávez, C. A., Brynolf, S., Despeisse, M., Johansson, B., Rönnbäck, A. Ö., Rösler, J., & Stahre, J. (2024). Advancing Sustainability through digital servitization: An exploratory study in the maritime shipping industry. Journal of Cleaner Production, 436, 140401. [Google Scholar] [CrossRef]
- Guo, L., & Yang, Z. (2019). Relationship between shipping accessibility and maritime transport demand: The case of mainland China. Networks and Spatial Economics, 19(18), 149–175. [Google Scholar] [CrossRef]
- Han, Z., Zhu, X., & Su, Z. (2024). Forecasting maritime and financial market trends: Leveraging CNN-LSTM models for sustainable shipping and China’s financial market integration. Sustainability, 16(22), 9853. [Google Scholar] [CrossRef]
- Ilcev, S. D. (2011). Maritime communication, navigation and surveillance. International Journal on Marine Navigation and Safety of Sea Transportation, 5(1), 12. [Google Scholar]
- International Maritime Organization (IMO). (2024a). IMO circulars related to the Global Maritime Distress and Safety System (GMDSS). Available online: https://www.imo.org/en/OurWork/Safety/Pages/IMO-circulars-related-to-the-GMDSS.aspx?r (accessed on 16 December 2024).
- International Maritime Organization (IMO). (2024b). Radiocommunications and search and rescue. Available online: https://www.imo.org/en/OurWork/Safety/Pages/RadiaCommunicationsSearchRescue-Default.aspx (accessed on 16 December 2024).
- International Maritime Organization (IMO). (2024c). Sub-committee on pollution prevention and response (PPR 12). Available online: https://www.imo.org/en/MediaCentre/MeetingSummaries/Pages/PPR-12th-session.aspx (accessed on 16 December 2024).
- Islam, M. (2024). Maritime security in a technological era: Addressing challenges in balancing technology and ethics. Mersin University Journal of maritime Faculty, 6(1), 1–16. [Google Scholar] [CrossRef]
- Jarumaneeroj, P., Ramudhin, A., & Lawton, J. B. (2023). A connectivity-based approach to evaluating port importance in the global container shipping network. Maritime Economics & Logistics, 25, 602–622. [Google Scholar]
- Kanamoto, K., Murong, L., Nakashima, M., & Shibasaki, R. (2021). Can maritime big data be applied to shipping industry analysis? Focussing on commodities and vessel sizes of dry bulk carriers. Maritime Economics & Logistics, 23, 211–236. [Google Scholar]
- Kang, K., Park, J., Kim, H., Hong, T., Ku, B., & Chang, D. (2015). Analysis of interference and availability between satellite and ground components in an integrated mobile-satellite service system. International Journal of satellite Communications and Networking, 33(4), 351–366. [Google Scholar] [CrossRef]
- Kim, J., Han, S., Lee, H., Koo, B., Nam, M., Jang, K., Lee, J., & Chung, M. (2024). Trend research on Maritime Autonomous Surface Ships (MASSs) based on shipboard electronics: Focusing on text mining and network analysis. Electronics, 13, 1902. [Google Scholar] [CrossRef]
- Koh, L. Y., Li, X., Wang, X., & Yuen, K. F. (2024). Key knowledge domains for maritime shipping executives in the digital era: A knowledge-based view approach. Technology Analysis and Strategic Management, 36(7), 1646–1663. [Google Scholar] [CrossRef]
- KPMG. (2018). Navigating the future—Changing business models shipping insights. Available online: https://assets.kpmg.com/content/dam/kpmg/gr/pdf/2019/01/gr-navigating-the-future-shipping-insights-en-2018.pdf (accessed on 15 October 2024).
- KPMG. (2024). The future of shipping. Available online: https://assets.kpmg.com/content/dam/kpmg/gr/pdf/2024/05/gr-future-of-shipping-sector-survey-2024.pdf (accessed on 10 January 2025).
- Kyriakopoulos, G. L. (2023). The contribution of Digital Transformation Industry (DTI) in micro- and macro- economy. Lecture Notes in Information Systems and Organisation 61, 101–108. [Google Scholar] [CrossRef]
- Lee, T. W., Park, N. K., & Lee, D. W. (2003). A simulation study for the logistics planning of a container terminal in view of SCM. Maritime Policy & Management, 30(3), 243–254. [Google Scholar] [CrossRef]
- Li, W., Bai, X., Yang, D., & Hou, Y. (2023). Maritime connectivity, transport infrastructure expansion and economic growth: A global perspective. Transportation Research Part A: Policy and Practice, 170(C), S0965856423000290. [Google Scholar] [CrossRef]
- Liu, J., Qu, J., Feng, Y., Zhu, Y., & Wu, Y. (2023). Improving the overall efficiency of marine power systems through co-optimization of top-bottom combined cycle by means of exhaust-gas bypass: A semi empirical function analysis method. Journal of Marine Science and Engineering, 11(6), 1215. [Google Scholar] [CrossRef]
- Lund, M., Gulland, J. E., Hareide, O. S., Josok, E., & Weum, K. (2018, May 30–June 1). Integrity of integrated navigation systems. 2018 IEEE Conference on Communications and Network Security (CNS) (pp. 1–5), Beijing, China. [Google Scholar] [CrossRef]
- Lytras, M. D., Serban, A. C., & Ntanos, S. (2025). Exploring distance learning in higher education: Satisfaction and insights from Mexico, Saudi Arabia, Romania, Turkey. Journal of Business Economics and Management, 26(1), 23030. [Google Scholar] [CrossRef]
- Makkonen, H., Nordberg-Davies, S., Saarni, J., & Huikkola, T. (2022). A contextual account of digital servitization through autonomous solutions: Aligning a digital servitization process and a maritime service ecosystem transformation to autonomous shipping. Industrial Marketing Management, 102, 546–563. [Google Scholar] [CrossRef]
- Nikghadam, S., Molkenboer, K. F., Tavasszy, L., & Rezaei, J. (2023). Information sharing to mitigate delays in port: The case of the Port of Rotterdam. Maritime Economics & Logistics, 25, 576–601. [Google Scholar]
- Notteboom, T., Rodrigue, J.-P., & De Monie, G. (2016). Organizational and geographical ramifications of the 2008–2009 financial crisis on the maritime shipping and port industries. In Integrating seaports and trade corridors (pp. 31–45). Routledge. [Google Scholar]
- Poulis, E., Poulis, K., & Dooley, L. (2011). ‘Information communication technology’ innovation in a non-high technology sector: Achieving competitive advantage in the shipping industry. The Service Industries Journal, 33(6), 594–608. [Google Scholar] [CrossRef]
- Raza, Z., Woxenius, J., Vural, C. A., & Lind, M. (2023). Digital transformation of maritime logistics: Exploring trends in the liner shipping segment. Computers in Industry, 145, 103811. [Google Scholar] [CrossRef]
- Saidi, S., Mani, V., Mefteh, H., Shahbaz, M., & Akhtar, P. (2020). Dynamic linkages between transport, logistics, foreign direct Investment, and economic growth: Empirical evidence from developing countries. Transportation Research Part A: Policy and Practice, 141(C), 277–293. [Google Scholar] [CrossRef]
- Shen, W., Yang, C., & Gao, L. (2020). Address business crisis caused by COVID-19 with collaborative intelligent manufacturing technologies. IET Collaborative Intelligent Manufacturing, 2, 96–99. [Google Scholar] [CrossRef]
- Skordoulis, M., Ntanos, S., Kyriakopoulos, G. L., Arabatzis, G., Galatsidas, S., & Chalikias, M. (2020). Environmental innovation, open innovation dynamics and competitive advantage of medium and large-sized firms. Journal of Open Innovation: Technology, Market, and Complexity, 6(4), 195. [Google Scholar] [CrossRef]
- Tok, V., & Ece, N. J. (2022). The impact of COVID-19 on maritime trade and transportation: An estimation of the maritime trade post-COVID-19. Mersin University Journal of Maritime Faculty, 4(2), 18–30. [Google Scholar] [CrossRef]
- UNTAD Datahub. (2024). Data for Annual revenue growth in the Maritime Communications sector for the period 2014–2023. Available online: https://unctadstat.unctad.org/datacentre (accessed on 10 December 2024).
- Wartsila. (2023). Debunking the mythical beasts of maritime digital transformation. Available online: https://www.wartsila.com/docs/default-source/voyage/myths-of-digital-transformation.pdf?sfvrsn=ab2c3843_3 (accessed on 24 September 2024).
- Weintrit, A. (2011). Development of the imo e-navigation concept—features maritime data structure. Communications in Computer and Information Science, 239, 151–163. [Google Scholar] [CrossRef]
- Wilk-Jakubowski, J. (2021). A review on information systems engineering using vsat networks and their development directions. Yugoslav Journal of Operations Research, 31(3), 409–428. [Google Scholar] [CrossRef]
- Wilmsmeier, G., & Hoffmann, J. (2008). Liner shipping connectivity and port infrastructure as determinants of freight rates in the caribbean. Maritime Economics & Logistics, 10(1–2), 130–151. [Google Scholar]
- Wohlleber, A. J., Bock, M., Birkel, H., & Hartmann, E. (2024). Implementing vital dynamic capabilities to succeed in digital transformation: A multiple-case study in maritime container shipping. IEEE Transactions on Engineering Management, 71, 13627–13645. [Google Scholar] [CrossRef]
- Yuen, K. F., & Thai, V. (2017). Corporate social responsibility and service quality provision in shipping firms: Financial synergies or trade-offs? Maritime Policy & Management, 44(1), 1–16. [Google Scholar]
| Maritime Communications Revenue (in Billions USD) | International Maritime Trade (Billions of Tons Loaded) | Global Maritime Fleet (No. of Vessels) | Global Maritime Fleet (DWT) | Tanker VLCC Freights (Annual Average of Daily Rates in ‘000s USD) | LNG Carrier Freights (Annual Average of Daily Rates in ‘000s USD) | Dry Bulk-Capesize Freights (Annual Average of Daily Rates in ‘000s USD) | |
|---|---|---|---|---|---|---|---|
| Variable I.D. | (1) | (2) | (3) | (4) | (5) | (6) | (7) |
| Mean | 2.680 | 10.726 | 95.550 | 1.964 | 35.300 | 58.200 | 16.150 |
| Standard Error | 0.227 | 0.173 | 1.266 | 0.053 | 5.492 | 6.656 | 2.315 |
| Median | 2.650 | 10.840 | 95.650 | 1.985 | 34.000 | 60.000 | 15.750 |
| Standard Deviation | 0.719 | 0.547 | 4.004 | 0.169 | 17.366 | 21.049 | 7.322 |
| Sample Variance | 0.517 | 0.300 | 16.029 | 0.029 | 301.567 | 443.067 | 53.614 |
| Range | 2.10 | 1.66 | 12.10 | 0.50 | 55.00 | 60.00 | 26.00 |
| Minimum | 1.80 | 9.84 | 89.40 | 1.69 | 10.00 | 30.00 | 7.00 |
| Maximum | 3.90 | 11.50 | 101.50 | 2.19 | 65.00 | 90.00 | 33.00 |
| Sum | 27 | 107 | 956 | 20 | 353 | 582 | 162 |
| Count | 10 | 10 | 10 | 10 | 10 | 10 | 10 |
| Coefficient of Variation | 26.84% | 5.10% | 4.19% | 8.60% | 49.19% | 36.17% | 45.34% |
| Maritime Communications Revenue (Billions USD) | International Maritime Trade (Billions of Tons Loaded) | Global Maritime Fleet (No. of Vessels) | Global Maritime Fleet (DWT) | Tanker VLCC Freights (Annual Average of Daily Rates in ‘000s USD) | LNG Carrier Freights (Annual Average of Daily Rates in ‘000s USD) | Dry Bulk Capesize Freights (Annual Average of Daily Rates in ‘000s USD) | |
|---|---|---|---|---|---|---|---|
| Variable I.D. | (1) | (2) | (3) | (4) | (5) | (6) | (7) |
| Intercept coefficient | −9.934 | −14.262 | −5.470 | 2.839 | 1.115 | 1.703 | |
| X variable coefficient | 1.176 | 0.177 | 4.150 | −0.005 | 0.027 | 0.060 | |
| Rsq-coeff. of determination | 80.12% | 97.42% | 94.99% | 1.19% | 61.94% | 37.90% | |
| r-correlation coefficient | 89.51% | 98.70% | 97.46% | 10.89% | 78.70% | 61.56% | |
| Adjusted R Square | 77.64% | 97.09% | 94.36% | −11.17% | 57.19% | 30.14% | |
| Standard Error | 0.340 | 0.123 | 0.171 | 0.758 | 0.471 | 0.601 | |
| p-value on Y | 0.002 *** | 0.000 *** | 0.000 *** | 0.001 *** | 0.041 ** | 0.008 *** | |
| p-value on X | 0.000 *** | 0.000 *** | 0.000 *** | 0.765 | 0.007 *** | 0.058 * | |
| t-stat on Y | −4.47 *** | −14.61 *** | −8.24 *** | 5.01 *** | 2.43 ** | 3.54 *** | |
| t-stat on X | 5.68 *** | 17.36 *** | 12.32 *** | −0.31 | 3.61 *** | 2.21 * |
| Maritime Communications Revenue (Billions USD) | International Maritime Trade (Billions of Tons Loaded) | Global Maritime Fleet (No. of Vessels) | Maritime Communications Revenue (Billions USD) | International Maritime Trade (Billions of Tons Loaded) | Global Maritime Fleet (DWT) | ||
|---|---|---|---|---|---|---|---|
| Variable I.D. | (1) | (2) | (3) | Variable I.D. | (1) | (2) | (4) |
| Intercept coefficient | −14.476 | Intercept coefficient | −4.788 | ||||
| Variable (2) coefficient | −0.158 | Variable (2) coefficient | −0.142 | ||||
| Variable (3) coefficient | 0.197 | Variable (4) coefficient | 4.580 | ||||
| Rsq-coeff. of determination | 97.62% | Rsq-coeff. of determination | 95.14% | ||||
| r-correlation coefficient | 98.81% | r-correlation coefficient | 97.54% | ||||
| Adjusted R Square | 96.95% | Adjusted R Square | 93.75% | ||||
| Standard Error | 0.126 | Standard Error | 0.180 | ||||
| F-test | 143.86 * | F-test | 68.55 * |
Disclaimer/Publisher’s Note: The statements, opinions and data contained in all publications are solely those of the individual author(s) and contributor(s) and not of MDPI and/or the editor(s). MDPI and/or the editor(s) disclaim responsibility for any injury to people or property resulting from any ideas, methods, instructions or products referred to in the content. |
© 2025 by the authors. Licensee MDPI, Basel, Switzerland. This article is an open access article distributed under the terms and conditions of the Creative Commons Attribution (CC BY) license (https://creativecommons.org/licenses/by/4.0/).
Share and Cite
Charamis, E.; Charamis, D.; Kyriakopoulos, G.L.; Ntanos, S. The Growth of Maritime Communications and Technology Related to the Trends in the Shipping Industry: A Financial Perspective. Economies 2025, 13, 99. https://doi.org/10.3390/economies13040099
Charamis E, Charamis D, Kyriakopoulos GL, Ntanos S. The Growth of Maritime Communications and Technology Related to the Trends in the Shipping Industry: A Financial Perspective. Economies. 2025; 13(4):99. https://doi.org/10.3390/economies13040099
Chicago/Turabian StyleCharamis, Eleftherios, Dimitrios Charamis, Grigorios L. Kyriakopoulos, and Stamatios Ntanos. 2025. "The Growth of Maritime Communications and Technology Related to the Trends in the Shipping Industry: A Financial Perspective" Economies 13, no. 4: 99. https://doi.org/10.3390/economies13040099
APA StyleCharamis, E., Charamis, D., Kyriakopoulos, G. L., & Ntanos, S. (2025). The Growth of Maritime Communications and Technology Related to the Trends in the Shipping Industry: A Financial Perspective. Economies, 13(4), 99. https://doi.org/10.3390/economies13040099