


Abstract
Population aging in Asia is arriving before the institutions to support it. Assessments of social protection usually treat sustainability, adequacy and fairness separately, obscuring how they trade off within one system. This study introduces NTA-SAFE, five indicators derived from the National Transfer Accounts lifecycle identity, applied to Japan, South Korea, Thailand, the Philippines and Indonesia. Base-year per capita profiles are combined with UN World Population Prospects 2024 populations through 2050, so all movement reflects age structure alone; results are reported across all five WPP series as a demographic sensitivity range. An explicit two-part rule classifies each economy by who provides net transfers to its elderly and by demographic stage. Japan and South Korea are state-led; the Philippines and Indonesia are family-asset-led, retaining the fiscal headroom of young populations. Thailand is transitional and the substantive case, carrying the demographic and fiscal exposure of a state-led system while families supply 78% of net transfer support to its elderly. Thai elderly consumption sits near working-age parity: the exposure lies not in current living standards but in the institutional basis on which they rest. Direction of change is robust in 24 of 25 country-indicator combinations. Higher benefit generosity is consistently associated with a narrower fiscal base, as a budget constraint implies, though five cases cannot establish universality. Whether family-mediated support reproduces life-course inequality into old age is a hypothesis the framework can pose but not test, the accounts carrying no distributional data. Indonesia’s classification is provisional, its profile predating the 2014 health insurance reform. NTA-SAFE is replicable wherever National Transfer Accounts exist.
1. Introduction
Asia is undergoing a demographic transformation without historical precedent in its speed relative to economic development (World Bank, 2016). By 2050, the share of the population aged 65 and older is projected to reach approximately 28% in East Asia and nearly double across Southeast Asian economies from current levels (United Nations, 2024). Japan and South Korea are already among the world’s most aged societies, while Thailand, Indonesia, and the Philippines are transitioning at a pace that leaves limited time to build the institutions required to support elderly populations. What distinguishes this transition from the European experience is the income context in which it is occurring. European welfare states were constructed when per capita incomes were substantially higher and demographic windows were more favorable. Asian economies face comparable or more severe aging at income levels that constrain both fiscal capacity and the pace at which institutions can expand (World Bank, 2016). The result is a structural mismatch between the demographic timeline and the social protection infrastructure needed to respond to it.
This mismatch creates two policy pressures that pull in opposite directions. As working-age populations shrink relative to elderly cohorts, the productive base that funds transfers contracts while the recipient population expands, so fiscal systems come under compounding pressure (Bongaarts, 2004; Cutler et al., 1990). Yet these same elderly cohorts, particularly in lower-middle-income Asian economies, currently receive negligible public transfers; they depend instead on family support and on assets accumulated over the lifecycle (Hermalin, 2002; Knodel & Chayovan, 2009). Expanding benefit coverage is socially imperative. Restraining expenditure growth is fiscally imperative. The two pull against each other.
The tension is sociological as well as fiscal. Who bears the cost of aging and who receives its protection depends on how resources are distributed across generations and on the institutions that organize that distribution. State-mediated transfers and family- or asset-mediated transfers embody different stratification logics: state-led systems tend toward universalism and decommodification, while family-led systems reproduce existing inequalities in household wealth, kin-network density, and caregiving capacity (Esping-Andersen, 1990; Gough et al., 2004). This choice, or the failure to make it, produces welfare regime typologies with distinct inequality profiles.
Existing analytical frameworks are not well suited to holding both pressures in view simultaneously. Fiscal sustainability assessments, built on support-ratio methods and long-run budget projections, address the fiscal dimension but offer limited insight into the adequacy of benefit levels (Holzmann et al., 2005; Miller, 2011). Adequacy assessments, built on replacement-rate analysis and pension coverage metrics, capture benefit generosity but do not connect to the aggregate fiscal accounts, nor to the full structure of intergenerational transfers, family transfers and asset income included, that sustains elderly consumption (European Commission, 2018; International Labour Organization, 2012). In the absence of a unified accounting framework integrating sustainability and adequacy within a single consistent metric set, cross-economy comparison of social protection performance, and identification of the specific sources of performance gaps, remain difficult.
Comparative NTA work has examined transfer systems across countries for two decades, most substantially in the edited volumes of R. D. Lee and Mason (2011). What that literature has not done is convert the lifecycle identity into a standing set of performance indicators with explicit classification rules, applied consistently across economies at different demographic stages. That is the contribution this paper attempts to make, and it is a contribution of instrumentation rather than of new accounting theory. This paper introduces the NTA-SAFE framework, a set of five indicators derived directly from the National Transfer Accounts (NTA) lifecycle identity. The NTA framework decomposes elderly consumption financing into three sources: net public transfers, net family transfers, and asset-based reallocations (R. D. Lee & Mason, 2011; Mason et al., 2009; United Nations, 2013). The SAFE indicators operationalize this decomposition into measurable dimensions of social protection performance: fiscal sustainability (Fiscal Support Ratio, FSR), benefit adequacy (Benefit Generosity Ratio, BGR), fairness in financing mix (PublicPrivate Transfer Mix, PPM), fairness in consumption outcomes (Relative Consumption Ratio, RCR), and efficiency of self-insurance (Asset Funding Ratio, AFR). All five are normalized by a common Standard Labor Income benchmark, enabling cross-country comparison across economies with different income levels and institutional configurations. The framework is applied to five countries, Thailand, Japan, South Korea, the Philippines, and Indonesia, using NTA per capita profiles calibrated to survey and national accounts data and population projections from the UN World Population Prospects 2024 median extended to 2050.
The analysis yields three welfare typologies and one substantive finding. Japan and South Korea are state-led, delivering elderly support principally through public transfers, with benefit generosity ratios of 0.369 and 0.276 against fiscal support ratios that decline as aging accelerates. The Philippines and Indonesia are family-asset-led, retaining substantial fiscal space while public transfers to the elderly are negligible or negative, so that support falls to families and private wealth. Thailand occupies a Transitional position and reveals a welfare-delivery paradox. Its fiscal support ratio of 5.978 sits within the range observed for South Korea, indicating an age structure that has already left the dividend phase, while its Public–Private Transfer Mix of 0.222 means that 77.8% of net transfer support for the Thai elderly still originates in families rather than in the state, and its benefit generosity ratio of 0.091 is a third of South Korea’s. Thailand has therefore assumed the demographic fiscal exposure of a welfare state without building the public delivery architecture that would characterize one.
The paradox concerns the institutional locus of provision rather than the level of elderly living standards. The Thai elderly consume 91.5% of the working-age per capita level, close to South Korea’s 93.3%, so no current consumption deficit is observable. What differs is the basis of that consumption, which rests on transfers from working-age relatives rather than on public entitlement or accumulated assets, and which is therefore contingent on family size, co-residence and proximity. The exposure the framework identifies is prospective, and it is the kind that indicators of current adequacy do not register.
The remainder of the paper is organized as follows. Section 2 reviews the relevant literature across three clusters: NTA and lifecycle economics, social protection assessment frameworks, and the economic implications of population aging in Asia. Section 3 presents the NTA-SAFE framework, deriving each indicator from the NTA lifecycle accounting identity and specifying its interpretation. Section 4 describes the data sources and projection methodology. Section 5 reports the results for all five countries across the five SAFE indicators and the typological classification. Section 6 discusses the policy implications of the findings and the structural nature of the sustainability-adequacy trade-off. Section 7 presents concluding remarks and directions for future research.
2. Literature Review
The NTA-SAFE framework draws on three distinct bodies of scholarship: lifecycle economics as formalized through National Transfer Accounts; evaluative frameworks for social protection systems; and the empirical literature on aging trajectories and their economic consequences in Asia. Each body contributes an indispensable analytical layer to the framework, and each reveals a distinct gap that the present study is designed to address.
2.1. National Transfer Accounts and Lifecycle Economics
The National Transfer Accounts framework operationalizes the economic lifecycle within a system consistent with national accounts principles. R. D. Lee and Mason (2011) assembled the authoritative international synthesis, demonstrating that lifecycle deficits during childhood and old age must be financed through some combination of labor income, public transfers, family transfers, and asset income. The formal accounting identity, , partitions the elderly financing gap into three channels and provides the metrological basis for cross-national comparison. Mason et al. (2009) embedded age-structured transfers explicitly within national accounts, establishing the n methodological protocol that the United Nations (2013) subsequently codified in the NTA Manual, which now governs data production across more than forty economies.
R. D. Lee (2000) grounded the lifecycle deficit concept in the broader theory of intergenerational consumption smoothing, demonstrating that transfer systems exist precisely because labor income does not coincide with consumption across the lifespan. Mason and Lee (2007) extended this insight to demographic transition dynamics, identifying two distinct demographic dividends. The first arises when a large working-age cohort generates fiscal space by supporting few dependents; Bloom and Williamson (1998) showed empirically that this mechanism accounted for a substantial share of the East Asian growth miracle of the late twentieth century. The second dividend emerges when elevated survivorship and asset accumulation among older cohorts create a capital stock that sustains consumption in retirement (R. Lee & Mason, 2006; Mason, 2005). Both dividends are contingent on institutional transfer design, which places social protection architecture at the center of demographic dividend capture and long-run welfare outcomes.
Applications of NTA methodology across Asia demonstrate that the region’s lifecycle patterns diverge substantially from European benchmarks. Ogawa et al. (2010) document elevated elderly labor force participation in Japan and South Korea, which partially offsets rising lifecycle deficits; Southeast Asian economies, by contrast, rely disproportionately on familial transfers that are structurally fragile under urbanization. Country-level NTA analyses of Thailand, the Philippines, and Indonesia confirm that limited public transfer coverage leaves elderly consumption substantially more vulnerable relative to working-age cohorts (R. D. Lee & Mason, 2011; Mason et al., 2009). Sambt et al. (2021) provide a European reference point: formal institutional systems across 25 EU economies, whether organized around public transfers (Austria) or asset-based reallocations (United Kingdom), cushion elderly lifecycle deficits to a substantially greater degree than most Asian welfare states. These applications establish that the accounting identity travels across very different institutional settings, which is the property the present study relies on.
2.2. Social Protection Assessment Frameworks
Existing social protection frameworks advance along parallel analytical lines that do not converge on a unified measurement system for Asia’s heterogeneous developing economies. Welfare typologies historically classify systems by the state-market-family mix (Esping-Andersen, 1990), a framework Gough et al. (2004) extended to developing nations as “informal security regimes,” in which family networks substitute for weak state provision. Structurally, the World Bank’s multi-pillar pension framework classifies systems into a non-contributory social pension (zero pillar), mandatory earnings-linked and defined-contribution schemes (first and second pillars), voluntary savings (third pillar), and informal family support and individual assets (fourth pillar) (Holzmann et al., 2005; World Bank, 2008). Evaluatively, Barr and Diamond (2009) treat adequacy, sustainability, and risk management as interdependent objectives, while Gruber and Wise (1999) demonstrate that system design shapes retirement incentives and fiscal trajectories. None of these models, however, generates normalized cardinal indicators for cross-country benchmarking.
Regional monitoring tools are similarly misaligned with developing contexts. The European Commission’s Pension Adequacy Reports (European Commission, 2018) and the OECD’s Pensions at a Glance series (OECD, 2023, 2024) track replacement rates, poverty risks, and fiscal projections, while the ILO Social Protection Floor Recommendation No. 202 (International Labour Organization, 2012) defines universal normative guarantees. All three frameworks presuppose widespread formal employment and high contributory coverage, an assumption that does not hold in developing Asia, where market informality constitutes a durable structural feature rather than a transitional phase (La Porta & Shleifer, 2014). Coverage-based metrics therefore systematically misrepresent elderly economic security, since the majority of workers fall outside formal pension and social health insurance systems.
Demographic transitions introduce compounding macro-fiscal pressures. Rising old-age dependency ratios inflate public pension spending (Bongaarts, 2004), erode the labor income tax base, and expand transfer obligations (Miller, 2011). Population aging further destabilizes safety-net financing through labor supply contraction, compressing the contributor base as the retiree population expands (Bloom et al., 2010). Long-term care expenditure is additionally projected to outpace pension growth, straining Asian economies that have historically delegated care to informal family channels (Colombo et al., 2011). What these frameworks share is that each was designed for a particular purpose, and each accordingly measures one dimension well and the others incidentally or not at all.
2.3. Economic Implications of Aging in Asia
Demographic transitions in East and Southeast Asia are compressed into two to three decades, leaving governments with limited fiscal capacity to construct comprehensive welfare systems (Bloom et al., 2015). This asymmetry creates a structural predicament, in that aging occurs at considerably lower income levels than was historically the case in Europe. A middle-income welfare-state trap compounds this institutional lag, as rapid aging outpaces the creation of sustainable social insurance systems (World Bank, 2016).
Thailand illustrates this asymmetry starkly. Its elderly population share is expanding more rapidly than Japan’s historical trajectory, despite a fraction of Japan’s per capita GDP (World Bank, 2016). Family networks bear the primary welfare burden, with the majority of elderly relying on children for support as public allowance programs fail to close consumption gaps (Hermalin, 2002; Knodel & Chayovan, 2009; Miller, 2011). Health financing reforms have expanded regional coverage breadth, though the long-term fiscal sustainability of these expanded schemes remains a substantial policy challenge (Tangcharoensathien et al., 2011).
Advanced Asian economies confront severe macro-fiscal threats from population decline, rising dependency ratios, and pension fund insolvency. Japan’s policy adjustments, such as the 2004 macroeconomic indexation, reveal acute trade-offs between fiscal sustainability and benefit adequacy (Ogawa et al., 2010). South Korea’s post-1997 welfare reforms established a robust pension framework, yet coverage gaps persist for non-standard and self-employed workers (Kwon, 2005). Emerging economies confront a different configuration, in that the Philippines and Indonesia face a rapidly closing demographic dividend window. Informal workers in the Philippines lack basic retirement security owing to narrow formal insurance coverage (Orbeta, 2011). Indonesia’s JKN program expanded health coverage to formal and informal workers through BPJS Health, though the status of informal workers within the scheme remained uncertain at launch (Pisani et al., 2017). Urbanization exacerbates these gaps, as household nuclearization and geographic separation weaken traditional family support networks (Hermalin, 2002).
Three more recent strands bear directly on the present study. First, the NTA literature has itself turned toward sustainability assessment: Spielauer et al. (2023) construct sustainability indicators for the economy, the public sector and families across four European economies (Austria, Finland, Spain and the United Kingdom), and find that compositional effects from educational expansion interacting with changing family structure partly offset the fiscal consequences of aging. Their design is the closest existing analogue to the framework developed here, and the contrast is instructive, since their indicators are built for economies where the public channel already dominates.
Second, the question of whether public provision displaces family support has been examined directly in the Thai case. Teerawichitchainan and Pothisiri (2021) study the expansion of Thailand’s social pension and its consequences for family support of older persons, which is precisely the substitution the Public–Private Transfer Mix is constructed to detect. Whether an expanding public channel adds to family support or crowds it out determines whether a rising PPM represents a genuine institutional shift or an accounting displacement, and this study informs our interpretation of Thailand’s trajectory in Section 5.3.2.
Third, projection work on the fiscal consequences of aging for specific programs has become considerably more granular, including Y. Kim and Woo’s (2025) projection of demographic pressure on South Korea’s national health insurance to 2042. This literature is complementary rather than competing: it models one program in depth where the present study measures the whole transfer system at lower resolution.
The regional literature therefore documents wide institutional variation without providing a common scale on which to compare it, which is the point Section 2.4 takes up.
2.4. Synthesis and Research Question
The three literatures converge on a single problem. Lifecycle accounting measures intergenerational flows precisely but was not built to evaluate them. Social protection frameworks evaluate systems but presuppose formal employment and contributory coverage, which much of developing Asia lacks. The regional literature documents institutional variation without a common scale for comparing it. What is missing is neither data nor evaluative criteria, but an instrument applying the second to the first across economies at different demographic stages.
The theoretical basis is the budget constraint on any transfer system. Samuelson (1958) and Aaron (1966) established that the implicit return in a pay-as-you-go system is governed by population and real wage growth. Diamond (1965) showed within an overlapping generations (OLG) framework that the transfer rate maximizing elderly welfare in a given period exceeds the rate maximizing steady-state utility across cohorts, and Barr and Diamond (2008) state the consequence directly: generosity and fiscal base are linked through the same identity, so raising benefits without expanding the base requires deficit financing or reductions elsewhere. Sustainability and adequacy are therefore not independent objectives but opposite sides of one constraint, which is why the SAFE indicators derive from an accounting identity rather than a composite index.
The SAFE typologies relate to the classical welfare regime literature without reproducing it. Esping-Andersen (1990) classifies systems by decommodification and stratification; Gough et al. (2004) extend the framework to developing economies as informal security regimes; and the East Asian literature debates whether the region constitutes a distinct productivist type in which social policy is subordinated to growth (Holliday, 2000). SAFE classifies more narrowly, by the measured locus of net transfers to the elderly and by demographic stage, not by decommodification, political settlement or developmental orientation. Our state-led category corresponds to neither the social-democratic nor the conservative variant, grouping Japan and South Korea by financing channel rather than by benefit structure. Our family-asset-led category corresponds closely to Gough’s informal security regimes, except that SAFE separates the family channel from the asset channel. The transitional category has no counterpart in either typology, and identifying it is this paper’s specific claim. The contribution is measurement rather than reclassification: SAFE quantifies where a system sits on axes the qualitative literature had already identified, and proposes no new regime concepts.
The family-asset-led configuration raises a further question. Where elderly support flows through families rather than public entitlement, its distribution depends on household resources, family size and geographic proximity rather than on citizenship. Three mechanisms would in principle transmit prior inequality into old age: those with fewer surviving children have fewer potential providers; those in poorer households receive from poorer providers; and migration of adult children weakens the proximity on which non-monetary support depends (Hermalin, 2002; Knodel & Chayovan, 2009). The evidence is not uniform. H. K. Kim and Lee (2025) find that familial transfers within extended households reduce consumption inequality among older Koreans, though the effect weakens as such households become less common, so family provision may compress some inequalities while reproducing others. The National Transfer Accounts cannot adjudicate this, recording flows by age but carrying no information on position in the income or wealth distribution. We therefore treat the stratification argument as a hypothesis the framework can pose rather than a result it establishes, and return to it in Section 7.
The study accordingly asks a single question. Do the social protection systems of Asian economies at different demographic stages converge on a common configuration as aging proceeds, or do their initial structures persist and diverge? The answers carry opposite policy implications. Convergence would imply that demographic pressure itself drives institutional development, so that late-transition economies can expect to arrive where early-transition economies now are. Divergence would imply that institutional structure is prior to demography and that the window for building it is finite. Answering the question requires indicators comparable across economies, derived from a common accounting identity, and projectable under a scenario holding behavior constant so that institutional structure is what remains. Section 3 develops those indicators.
3. The NTA-SAFE Framework
3.1. The Lifecycle Identity and Its Variables
The NTA-SAFE framework is built directly on the National Transfer Accounts lifecycle identity, which states that every unit of lifecycle deficit must be financed by some combination of net public transfers, net private family transfers, and asset-based reallocations:
where LCD = C − YL denotes the gap between consumption and labor income at each age. Children and the elderly consume more than they earn (LCD > 0), while working-age adults generate surpluses (LCD < 0). The mechanisms through which economies bridge these age-structured gaps determine both household welfare and the long-run sustainability of social protection systems (R. D. Lee & Mason, 2011; Mason et al., 2009). The SAFE framework operationalizes this identity into five indicators, each anchored to a specific financing channel and capturing a distinct performance dimension: Sustainability (S), Adequacy (A), Fairness in financing mix (F1), Fairness in consumption outcomes (F2), and Efficiency of self-insurance (E). Table 1 in Section 3.2 gives the NTA-SAFE indicator definitions.
Table 1.
NTA-SAFE Indicator Definitions.
3.2. The Five SAFE Indicators
The framework comprises five indicators, each anchored to a financing channel or to an outcome of the identity, and each is defined formally at the point of introduction rather than later. Sustainability is measured by the Fiscal Support Ratio, adequacy by the Benefit Generosity Ratio, fairness in the financing mix by the Public–Private Transfer Mix, fairness in consumption outcomes by the Relative Consumption Ratio, and efficiency of self-insurance by the Asset Funding Ratio. Table 1 gives the formula, the variables entering it, and the reading of each.
The FSR is conceptually related to the economic support ratio, which tracks the ratio of effective producers to effective consumers across the age distribution (Cutler et al., 1990). The SAFE framework extends this concept by grounding the numerator (labor income) and denominator (public transfer outflow) explicitly in NTA accounting flows, thereby decomposing the fiscal base into its demographic and behavioral components.
Two of the underlying variables warrant clarification, since the relationship between them bears directly on the interpretation of FSR and BGR. The superscript “+” in TG+ denotes gross public transfer outflows from the government, that is, benefits disbursed to recipients, as distinct from TGnet, which nets out the taxes elderly cohorts pay back into the public system. BGR employs net public transfers received by elderly cohorts (TGnet t); negative BGR values, as observed in the Philippines, indicate that elderly cohorts are net contributors to the public transfer system on average. FSR employs the sum of positive-valued net public transfer flows across all ages, that is, ages at which TGnet > 0, which captures the population groups that are net recipients of public transfers. This approximates, but is not algebraically identical to, gross transfer outflows from the government.
3.3. Internal Consistency and Typological Classification
The five indicators are not an arbitrary collection of social protection metrics. They are structurally linked through the NTA identity and collectively span its full financing decomposition. FSR and BGR operate on the public transfer flow TG, but from complementary vantage points: FSR assesses the revenue-side adequacy of the fiscal base, while BGR assesses the benefit-side generosity delivered to elderly recipients. Together, they characterize the public transfer system from both ends of its budget constraint.
PPM and AFR jointly explain the financing mix of the elderly lifecycle deficit. PPM captures the relative contribution of public versus private family transfers versus , while AFR measures the contribution of asset-based reallocations (RA). Because the NTA identity requires , these two indicators together account for all three financing channels proportionally. RCR then functions as an outcome validator: it tests whether the transfer system, regardless of its financing configuration, produces equitable consumption outcomes across generations.
This internal coherence distinguishes the SAFE framework from ad hoc composite indexes and from single-indicator approaches that capture only one dimension of social protection performance. No indicator is redundant; each occupies a structurally distinct position within the NTA accounting framework, and together they permit a multidimensional assessment that remains grounded in a single theoretical identity.
Typological classification proceeds from an explicit rule rather than from an overall impression of the indicator set. Two of the five indicators do the classifying, and they were selected because each identifies a distinct structural property rather than a level of performance. The Public–Private Transfer Mix identifies the modal provider of net transfers to the elderly, since it measures the public share of net transfers received by the elderly. Its threshold carries a definitional rather than an empirical meaning: at PPM = 0.50 the public and family channels contribute equally, above it the state is the majority provider, and below it the family is. The Fiscal Support Ratio identifies the demographic and fiscal stage, since it measures aggregate labor income against aggregate public transfers to net-recipient ages. Economies still inside the first demographic dividend sustain high values; economies whose dividend has closed do not. We set that threshold at FSR = 10, which separates the two dividend-phase economies in this sample from the three that have left it. Classification follows directly:
A system is state-led when PPM ≥ 0.50. When PPM < 0.50, it is family-asset-led if FSR ≥ 10 and transitional if FSR < 10.
The transitional category is therefore not a residual. It identifies economies that deliver elderly support through family and asset channels while carrying the demographic and fiscal exposure of a state-led system, which is the specific conjunction examined in Section 5.2.
Neither threshold is fitted to the data. The classification of all five economies is unchanged for any PPM threshold in the interval (0.222, 0.816] and any FSR threshold in the interval (5.978, 17.031], these bounds being the adjacent observed values in each case. The stated thresholds of 0.50 and 10 lie in the interior of both intervals rather than at an edge, so the assignment does not depend on the particular values chosen. Adding a benefit-adequacy condition of BGR ≥ 0.10 to the state-led rule leaves all five classifications unchanged, which is why BGR is reported as corroborating evidence rather than as a criterion.
The rule is a cross-classification of two binary conditions, and it is useful to see it as such. Of the four cells it defines, three are occupied: public-majority delivery with a closed dividend (Japan and South Korea), family- and asset-mediated delivery with an open dividend (the Philippines and Indonesia), and family- and asset-mediated delivery with a closed dividend (Thailand). The fourth cell, public-majority delivery while the dividend is still open, is empty. No economy in this sample built public-majority elderly transfers while its demographic dividend remained available, which is the missed-opportunity structure examined in Section 5.3.3.
The remaining three indicators do not classify. BGR, RCR and AFR record what a given configuration delivers, and Section 5 shows that economies sharing a classification can differ substantially in those outcomes. Separating the two functions is deliberate: an indicator that measures how support is organized should not be conflated with one that measures how much support arrives. Figure 1 summarizes the conceptual structure of the NTA-SAFE framework and the relationships among its five indicators.
Figure 1.
Conceptual framework.
3.4. Normalization and Cross-Country Comparability
All monetary flows are normalized by the Standard Labor Income (SLI), defined as the average per capita labor income of the 30–49 age group in each country at its NTA base year:
Dividing all per capita flows by converts each indicator value into a dimensionless ratio, removing the confounding effects of currency denomination, price level, and absolute economic development stage. This normalization convention is established in R. D. Lee and Mason (2011) and United Nations (2013) and is the standard practice in cross-national NTA analysis.
NTA base years differ across the five countries in this study: Thailand (2021), South Korea (2023), Japan (2019), the Philippines (2015), and Indonesia (2005). Cross-country comparability remains valid despite these differences because normalization is strictly within-country-year: each indicator value reflects a country’s economic and social structure relative to its own prime-age labor income standard at its own survey reference date. Comparing FSR or BGR values across countries therefore compares structural relationships, not raw monetary magnitudes.
One residual limitation warrants acknowledgment. For Indonesia, whose base year is 2005, the indicator values may not fully reflect the country’s current welfare configuration given the intervening two decades of economic growth and policy reform. This constraint applies to the cross-sectional snapshot analysis only and is addressed further in Section 6.3.
4. Data and Methods
4.1. NTA Data Sources
This study draws on National Transfer Accounts (NTA) data compiled for five Asian economies: Thailand, the Philippines, South Korea, Japan, and Indonesia. Each country dataset provides age-specific profiles of labor income (YL), consumption (C), net public transfers (TG), net private family transfers (TF), and asset-based reallocations (RA), covering the full lifecycle from birth to the maximum age available in each national dataset. Table 2 summarizes the survey years, age coverage, key variables, and institutional sources for each country.
Table 2.
NTA data sources by country.
Each country’s NTA dataset has a distinct upper age boundary , reported in Table 2, and flows above that boundary are treated as an open-ended terminal age group. The aggregate flow for all ages at or above is carried in the record, and records above it are empty. This is the standard convention for open-ended top age groups in demographic accounting, and it preserves the total: no flow is lost or duplicated.
Two consequences follow for the calculations in this paper. First, every age band used in the SAFE indicators runs to age 99 for every country, so that the terminal group is always captured on both sides of a ratio. Second, and for the same reason, the population denominator for any band containing must also run to 99, since the people represented in the terminal record exist at every age above the boundary even though their flows are reported at a single age. Applying a truncated population denominator to an untruncated flow numerator overstates per capita values, and the size of that error grows with the elderly share. We note this explicitly because it is a natural mistake to make and because the Philippines, with the lowest ceiling in the sample at age 80, is the case where it would matter most.
The terminal group limits resolution at the oldest ages, which are precisely the ages where health-related consumption concentrates. It does not bias the band aggregates used here, but it does mean that within-band composition above is unobserved.
One country-specific limitation warrants explicit acknowledgment. Indonesia’s NTA data were collected in 2005, prior to the introduction of Jaminan Kesehatan Nasional (JKN), the national health insurance scheme launched in 2014, and other major social protection reforms of the subsequent decade. As a result, the Indonesian TG profile likely understates current public transfer levels. Estimates for Indonesia should therefore be interpreted with caution, and cross-country comparisons involving Indonesia are best treated as indicative of trajectory rather than of current fiscal magnitudes.
NTA data are originally expressed in each country’s local currency units. All values are normalized by Standard Labor Income (SLI), as defined in Section 3, to enable cross-country comparison. This procedure renders every SAFE indicator dimensionless, removing the influence of currency denomination and permitting direct comparison across countries and across projection years.
Provenance and Construction of the NTA Variables
This study takes the five age profiles for each economy as published by the national teams listed in Table 2, without re-estimating any profile, imputing any missing component or adjusting any published series. What it computes are the five SAFE indicators, the projections and the sensitivity ranges, all functions of those published profiles and of UN population data. The properties of the underlying profiles are therefore inherited rather than chosen, which matters for interpreting the results.
All five national accounts follow the estimation conventions of the NTA Manual (United Nations, 2013), which is what makes them comparable. Labor income comprises earnings and the labor share of mixed income from self-employment. Consumption combines private consumption, allocated to individuals within households, with public consumption of education, health and other government services, allocated by age using program-specific rules. Public transfers are benefit inflows less the taxes and contributions each age group pays. Asset-based reallocations are the sum of asset income and dissaving.
Net private transfers warrant particular comment, since their construction bears directly on the interpretation of PPM. They combine two components estimated in different ways. Inter-household transfers, which pass between separate households and include remittances, are estimated primarily from household survey responses rather than from national accounts, and NTA assigns all such flows to the household head, so their age profile follows the head’s age. Intra-household transfers are neither recorded in national accounts nor observed in household surveys, since a respondent can report their own earnings but not the support they give to or receive from other members. NTA therefore imputes them: each member’s surplus or deficit is disposable income less private consumption, a household-specific flat rate applied to the surpluses funds the deficits, and the household head meets any remaining shortfall from asset income or dissaving (United Nations, 2013).
Transfers in kind are therefore captured where they take the form of goods and services consumed within the household, since the imputation is determined in large part by the estimated consumption of individual members rather than by cash flows, and the flow of services from owner-occupied housing is treated explicitly as an outflow from the household head and an inflow to other members. Unpaid care is not captured. The Manual states that the value of time transfers to children and the elderly, mostly by women, is not captured in NTA, and that work such as childrearing and other in-home activities that does not produce market goods or services is excluded from labor income (United Nations, 2013). The family channel measured here is therefore monetary and in-kind consumption, not time. Wealth transfers such as bequests and dowries are excluded, the accounts recording current transfers only.
Three implications follow. First, the intra-household component is derived from an algorithm applied to other estimated profiles rather than measured directly, so PPM describes how consumption is financed rather than counting observed transactions. Second, because that algorithm takes labor income, inter-household transfers, public transfers and consumption as its inputs, PPM inherits estimation error from each of them, along with the assumptions about household structure and the household head on which the allocation rests. Third, the comparability the common conventions deliver is achieved in part by standardization rather than by measurement: the Manual notes that actual, unobservable differences in sharing rules within households are not captured in NTA, and that the same sharing rules are used for all applications (United Nations, 2013). Cross-country differences in PPM therefore reflect differences in measured flows and household composition, not differences in how households are assumed to share. These are known properties of the NTA method rather than limitations specific to this study, but they warrant more caution in interpreting PPM than the directly measured components.
Negative values arise in two of the five indicators and are substantively meaningful rather than artifacts to be suppressed, so we apply no floor, truncation or sign correction anywhere in the calculation, with one exception stated below. BGR is negative when an elderly cohort pays more into the public transfer system through taxes and contributions than it receives in benefits, making the cohort a net fiscal contributor, as in the Philippines throughout the projection. PPM, the public share of net transfers reaching the elderly, is negative when the public and family components carry opposite signs, and the family component is the larger in magnitude. This arises in two distinct ways in the present sample. In the Philippines the elderly are net public contributors while receiving substantial net family support. In Indonesia the configuration is reversed: the elderly receive a small positive net public transfer while themselves being net providers of private transfers to younger household members, so that the denominator rather than the numerator carries the negative sign. The two cases are economically distinct and are interpreted separately in Section 5.1. A value below zero therefore indicates not a small public share but a public channel operating in the opposite direction to the family channel, and its magnitude is not bounded by one.
The exception is the Fiscal Support Ratio, whose denominator sums public transfers only over ages at which the net flow is positive. That restriction identifies the ages at which the public sector is a net provider, which is the quantity the ratio is intended to capture, and applies to FSR alone. BGR uses net public transfers without restriction, so the two indicators answer different questions: FSR asks what fiscal base supports the transfers being paid out, BGR what an elderly cohort nets against prime-age earnings.
Negative values do not affect the typological classification. The rule in Section 3.3 uses PPM against a threshold of 0.50 and FSR against a threshold of 10. A negative PPM falls below 0.50 exactly as a small positive value does, so the sign changes the indicator’s interpretation without changing the assignment. BGR, the other indicator taking negative values, is not a classifying variable.
4.2. Population Data and Projection Base
Population data for all five countries are drawn from the United Nations World Population Prospects 2024 (United Nations, 2024), which provides single-year age-specific population counts for each country from 1950 through 2100. The main analysis employs the medium variant, representing the central projection conditional on median assumptions for future fertility, mortality, and international migration. Section 4.3.2 introduces four probabilistic bounding variants for the demographic sensitivity analysis: Lower 80 and Upper 80 (the 10th and 90th percentiles of the WPP 2024 probabilistic projection distribution) and Lower 95 and Upper 95 (the 2.5th and 97.5th percentiles). These bound the median trajectory at the 80% and 95% (Raftery et al., 2014; United Nations, 2024). Section 4.3.2 sets out why we report them as demographic sensitivity ranges rather than as confidence intervals. Projected population structures are extracted for 2021, 2025, 2030, 2035, 2040, 2045, and 2050, a range spanning near-term policy relevance and the medium-run demographic transition.
Per capita NTA profiles are constructed by dividing each country’s aggregate NTA flow for a given age by the corresponding UN WPP population count for the same age and base year:
where c denotes country, a denotes single year of age, and is the NTA survey year for country c. Anchoring the denominator to UN WPP population counts at the base year ensures that the per capita profiles and the projected population series share a consistent demographic accounting framework. This compatibility is essential for producing internally coherent projected aggregates across all five countries.
4.3. Projection Methodology
4.3.1. Fixed Age Profile Projection (Main Analysis)
The primary projection approach holds per capita NTA profiles constant at their base-year values and varies only the population age structure across time (Miller, 2011; United Nations, 2013). Projected aggregate flows for each country c, NTA variable v, and projection year t are computed as follows:
where v denotes the NTA variable, is the maximum age in the NTA dataset for country c, and is the UN WPP projected population for country c, age a, and year t.
Under this specification, all variation in SAFE indicators across projection years arises exclusively from shifts in the age structure of each country’s population. Economic behavior, institutional policy, and aggregate productivity are held constant. This design choice is deliberate: by fixing behavioral and policy parameters, the fixed-profile projection isolates the pure demographic contribution to social protection sustainability, disentangling it from concurrent economic or policy changes (Prskawetz & Sambt, 2014). SAFE indicators (defined in Section 3) are then computed from the resulting projected aggregates.
4.3.2. Demographic Sensitivity Analysis
The main analysis relies on the WPP 2024 median variant, which represents the central demographic scenario conditional on median assumptions for future fertility, mortality, and migration. Future population age structures are uncertain, and that uncertainty propagates into every SAFE indicator, since each is computed from population-weighted age aggregates. This section quantifies the sensitivity of the results to demographic assumptions by recomputing all five indicators under the four probabilistic bounding variants released alongside the median series.
The WPP 2024 probabilistic projections are produced using a Bayesian model that characterizes future total fertility rates, life expectancy at birth, and net migration as probabilistic quantities, each governed by a posterior predictive distribution estimated from historical country-level time series (Raftery et al., 2014; United Nations, 2024). Sampling from these joint distributions yields a large ensemble of plausible population trajectories, which the UN summarizes into four bounding variants:
Lower 80 and Upper 80 are the 10th and 90th percentiles of the projected population distribution, and Lower 95 and Upper 95 are the 2.5th and 97.5th percentiles. These bounds capture uncertainty in fertility, mortality and migration at the single-year-of-age level for each country from 2024 to 2100. They are percentile summaries of population, not individual sampled trajectories.
SAFE indicators under each bounding variant are computed by applying the fixed-profile projection formula with the corresponding population series substituted for the median, rather than by simulation from the underlying trajectory ensemble:
where denotes the population variant and all other notation follows Section 4.3.1. Per capita NTA profiles remain fixed at base-year values; only the population age structure varies across variants. The resulting range of SAFE indicator values at each projection year constitutes the 80% and 95% confidence intervals for each indicator.
We report the resulting spread as a demographic sensitivity range rather than as a confidence interval, and the distinction is substantive. The bounding variants are percentile envelopes of population, and each SAFE indicator is a ratio that depends on the age composition of the population rather than on its level. Applying a percentile envelope to a nonlinear ratio does not return the corresponding percentile of that ratio, and the mapping from variant to indicator is not guaranteed to be monotonic. In this application it is not. Across the 675 country-indicator-year cells with full variant coverage, the range spanned by the two 95% variants fails to contain the range spanned by the two 80% variants in 45 cells. The deviations are small, at most 2.7% of the corresponding medium-variant value, but a wider nominal interval that does not contain a narrower one cannot be read as a nested probability interval.
The medium variant is itself not a percentile. From the 2024 revision it uses the mean rather than the median of the Bayesian posterior for total fertility and sex-specific life expectancy at birth (United Nations, 2024), making it a deterministic projection on mean inputs rather than a quantile of the ensemble. A mean holds no fixed position relative to percentile bounds, so the medium path and the bounding variants are summaries of different kinds rather than a central estimate and its interval.
The mechanism is a composition effect operating through the child population. Fertility assumptions move the number of children far more than the number of elderly over a thirty-year horizon, and public transfers flow to both. For South Korea in 2045, positive public transfers to children range across the four variants by a factor of 2.6, against 1.2 for the elderly. A low-fertility variant therefore contracts the transfer denominator through the child channel while expanding it through the elderly channel, so the fiscal support ratio need not move monotonically with the variant label. Genuine probabilistic intervals for a ratio of this kind would require the full trajectory ensemble underlying the WPP projections rather than its published percentile summaries.
We therefore report the range across all five population series at each point and assess robustness by testing whether each conclusion holds under every variant rather than by interval coverage. Direction of change is robust in 24 of the 25 country-indicator combinations over 2024 to 2050, the exception being Thailand’s fiscal support ratio, discussed in Section 5.3.2. Key ranges at 2030 and 2050 appear in Section 5.3, and full ranges for all indicators and economies in Appendix A.2.
4.3.3. Backcast Validation
South Korea permits internal validation of the projection method, since NTA profiles are available both for 2010, the earliest year of available microdata, and for 2023. Holding the 2010 per capita profiles fixed and applying observed population change, all five SAFE indicators are projected forward to 2023 and compared against the values derived directly from the 2023 profiles. The exercise decomposes the total change over the thirteen-year interval into a demographic component, which the fixed-profile method reproduces by construction, and a residual attributable to drift in the profiles themselves. The demographic component is small for every indicator, and the residual is larger, substantially so for the Public–Private Transfer Mix. The backcast therefore supports the method’s treatment of demographic change while quantifying the limits of holding profiles fixed over long horizons, a point taken up in Section 6.3. Full results and the decomposition are presented in Appendix A.3.
5. Results
5.1. Cross-Country SAFE Profiles: Three Welfare Model Typologies
The five economies sort into three welfare typologies that differ in two respects: which institution is the modal provider of net transfers to the elderly, and how far each economy has progressed through its demographic transition. These typologies correspond broadly to regime distinctions identified in the comparative welfare state literature (Esping-Andersen, 1990; Gough et al., 2004), grounded here in NTA lifecycle accounting rather than in institutional classification alone. State-led systems deliver elderly support principally through public transfers and carry the fiscal cost of doing so. Family-asset-led systems deliver support principally through families and private wealth while retaining the fiscal headroom of a young age structure. The transitional case combines family-led delivery with a demographic profile that has already left the dividend phase. Section 3.3 states the classification rule; this section reports the values it operates on.
Table 3 reports the baseline SAFE profiles and Figure 2 displays them. Japan and South Korea form the state-led group. Japan’s Fiscal Support Ratio of 3.378 is the lowest in the sample, reflecting an elderly-heavy age structure that places sustained pressure on the working-age tax base. Its Benefit Generosity Ratio of 0.369 and Public–Private Transfer Mix of 1.040 establish that the state is, on net, a transfer source to this cohort rather than a tax collector from it. An AFR of 0.529 and an RCR of 1.366 indicate that Japanese elderly both self-insure through asset income and consume more per capita than working-age adults. South Korea shares the architecture at an earlier demographic stage: an FSR of 5.371 reflects a still-favorable age structure, while a BGR of 0.276 and a PPM of 0.816 establish public transfers as the dominant channel of elderly support, with 81.6% of net elderly transfers flowing from public sources.
Table 3.
Baseline SAFE indicators by country; base-year profiles evaluated at 2021 population.
Figure 2.
NTA-SAFE indicator profiles by country, base-year profiles evaluated at 2021 population. Note: Each axis is min–max normalized across the five economies, so that the economy with the lowest value on an indicator plot at 0 and the economy with the highest plots at 1. The plotted values are therefore positions within the observed range and are not the indicator values themselves, which are given in Table 3.
The family-asset-led group comprises the Philippines and Indonesia. Both carry Fiscal Support Ratios far above those of the state-led economies, at 17.031 and 18.047, sustained by young age structures with large working-age cohorts relative to elderly dependents. Public transfers to the elderly are negligible or negative. The Philippines records a BGR of −0.091, meaning that Filipino elderly pay more into the public transfer system than they receive from it and are, on net, fiscal contributors rather than beneficiaries. Indonesia’s BGR of 0.008 is positive but economically indistinguishable from zero. The negative PPM values of −1.652 and −0.051 arise in different ways. Filipino elderly pay net public transfers while receiving substantial net family transfers, so the public channel runs against the family one. The Indonesian elderly receive a small net public transfer but are themselves net providers of private transfers, financing their own consumption from assets and passing resources to younger household members. In neither economy do state programs carry elderly support (Gough et al., 2004). Asset funding ratios of 0.910 and 1.434 complete the picture: elderly Indonesians finance their lifecycle deficit primarily through asset income, with an AFR above unity meaning that asset income alone covers all consumption in excess of labor income.
Consumption outcomes within this group diverge, and the divergence is instructive. Indonesian elderly consume 84.1% of the working-age per capita level, whereas Filipino elderly consume 31.3% more than working-age adults. The Philippine figure is not an artifact of the age ceiling in the underlying data: the 65–74 subgroup alone, which lies well below that ceiling, already records a ratio of 1.253, rising to 1.487 above age 75. Philippine per capita consumption rises monotonically with age from the mid-twenties onward, a profile shape it shares with Japan and not with the other three economies.
Two mechanisms documented in the Philippine NTA literature account for it: private health expenditure rises steeply at older ages, and overseas workers’ remittances constitute a substantial and age-targeted transfer channel into elderly (Racelis et al., 2015). The Philippine case therefore illustrates that a family-asset-led financing structure does not by itself imply low elderly consumption. Where private channels are strong, they can sustain consumption above working-age parity while the state remains a net extractor.
Thailand occupies the transitional position. Its FSR of 5.978 sits within the range observed for South Korea, indicating an age structure that has already left the dividend phase that sustains the family-asset-led group. Its delivery indicators, however, align with that group rather than with its demographic peers: a BGR of 0.091 is a third of South Korea’s 0.276 and a quarter of Japan’s 0.369, and a PPM of 0.222 means that 77.8% of net transfer support to the Thai elderly originates in families rather than in the state. Thailand has therefore assumed the demographic fiscal exposure of a middle-income welfare state without having built the public delivery architecture that would characterize one. Section 5.2 examines what this configuration does, and does not, imply for elderly welfare.
5.2. The Welfare-Delivery Paradox: Thailand as a Case Study
Thailand has assumed the demographic fiscal exposure of a welfare state while continuing to deliver elderly support through the channels of an informal one. This configuration, which we term the welfare-delivery paradox, is visible only when the financing structure is examined alongside the fiscal position. A sustainability assessment based on the Fiscal Support Ratio alone, which is the conventional lens in the aging literature, would place Thailand close to South Korea and register nothing unusual.
The public commitment gap is the first component. Thailand’s BGR of 0.091 is 33% of South Korea’s 0.276 and 25% of Japan’s 0.369. Expressed in the units of the indicator, the Thai state transfers approximately nine cents to an elderly person for each dollar of prime-age labor income, against 28 cents in South Korea and 37 cents in Japan. The gap is one of degree rather than of kind, since Thailand does operate elderly transfer programs, but the depth of commitment is a fraction of that of its demographic peers.
The delivery channel is the second and more consequential component. A PPM of 0.222 means that 77.8% of net transfer support reaching Thai elderly originates in families rather than in the state. Thailand’s public transfer architecture has not displaced the informal family economy; it has added a thin fiscal layer on top of it without altering the underlying support structure (Knodel & Chayovan, 2009). Japan and South Korea, at PPM values of 1.040 and 0.816, have completed the transition to state-mediated delivery. Thailand has not, and its PPM sits closer to Indonesia’s than to South Korea’s.
Consumption outcomes, however, do not currently register this gap. The Thai elderly consume 91.5% of the working-age per capita level—statistically indistinguishable from South Korea’s 93.3% and above Indonesia’s 84.1% (Figure 3). The private channels are, for the present, doing the work that public transfers do elsewhere. No current consumption deficit is observable in aggregate, and the paradox is correspondingly not a claim about how much the Thai elderly consume today.
Figure 3.
Relative Consumption Ratio (RCR); base-year profiles evaluated at 2021 population.
What the configuration does imply is a difference in the basis of entitlement, and therefore in exposure to future change. Asset self-insurance offers Thailand less cushion than it offers the family-asset-led economies: an AFR of 0.351 means asset income covers 35.1% of the gap between elderly labor income and consumption, against 0.910 in the Philippines and 1.434 in Indonesia (Figure 4). Thai elderly consumption is therefore sustained neither by public entitlement nor by accumulated private wealth, but predominantly by transfers from working-age family members. Support of that form is contingent on family size, co-residence and proximity, all of which are contracting under urbanization and fertility decline (Hermalin, 2002). The vulnerability the SAFE profile identifies is prospective rather than current: Thailand relies on a delivery mechanism that its own demographic transition is dismantling, and has not built the public alternative that its fiscal exposure would already support.
Figure 4.
Asset Funding Ratio (AFR); base-year profiles evaluated at 2021 population.
5.3. Projection to 2050: Three Diverging Trajectories
Held at base-year per capita profiles and subjected to UN WPP 2024 demographic projections, the five economies diverge along three distinct trajectories by 2050. These trajectories do not converge toward a common equilibrium; the structural differences embedded in base-year welfare architectures compound over the projection horizon. Table 4 and Figure 5 report projected SAFE indicator values at key years from 2025 to 2050 for all five countries under the median population variant.
Table 4.
Projected SAFE indicators at key years, 2025–2050 (median, UN WPP 2024).
Figure 5.
Projected SAFE indicators with population projection uncertainty, 2021–2050.
Table 5 reports the sensitivity of the two fiscal indicators to demographic assumptions at two horizons. Ranges widen with distance from the base year, and are widest for the Philippines and Indonesia, where fertility uncertainty is greatest and the projection horizon extends furthest beyond the observed period. Benefit generosity is comparatively insensitive across variants, because both its numerator and its denominator respond to the same underlying population, whereas the fiscal support ratio is not.
Table 5.
Demographic sensitivity ranges for FSR and BGR, 2030 and 2050.
5.3.1. South Korea’s Convergence Toward Japan and Japan’s Continued Deterioration
South Korea is on course to reach Japan’s current fiscal configuration within three decades. Its FSR declines from 5.371 in 2021 to 4.836 by 2030 and 2.974 by 2050, passing Japan’s 2021 level of 3.378 before mid-century. The speed of this compression reflects South Korea’s unusually rapid demographic transition: the old-age dependency ratio rises faster than in any other economy in the sample, so the working-age base erodes at the same time as the benefit-receiving cohort expands.
On the benefit side, BGR rises from 0.276 in 2021 to 0.305 by 2045 before easing to 0.291 by 2050. The trajectory is materially flatter than the fiscal one. Under fixed profiles the public transfer schedule does not change, so BGR moves only through shifts in the relative size of the elderly and prime-age populations, and those shifts partly offset one another. The substantive point is not that Korean generosity grows but that a benefit level already close to Japan’s must be financed from a fiscal base that contracts by 45% over the horizon.
Consumption outcomes remain broadly stable. South Korean RCR moves from 0.933 in 2021 to 0.862 by 2050, and at no point in the projection does it reach parity with working-age consumption. Under fixed per capita profiles a per capita consumption ratio should indeed be close to flat, since the profile itself does not change and only the internal age composition of each band moves. The projected trajectory behaves as the method implies.
Japan follows the same path from a more advanced position. FSR falls from 3.378 in 2021 to 2.746 by 2040 and 2.444 by 2050, a cumulative decline of 27.7%. RCR remains close to 1.37 throughout, and AFR is stable at approximately 0.50, indicating that asset income provides a consistent rather than a growing buffer. The defining pressure in mature state-led systems is therefore fiscal rather than distributional: elderly consumption holds its relative position while the base financing it contracts.
5.3.2. Thailand’s Persistent Delivery Gap
Thailand’s fiscal position improves before it deteriorates, but the timing of the turning point is not well identified. Under the median, FSR rises from 5.978 in 2021 to a peak of 6.213 in 2030 before declining to 5.984 in 2040 and 5.411 by 2050. The pattern of a peak followed by decline holds under all five population variants. Its timing does not: the peak occurs as early as 2024 under the high-population variant and as late as 2042 under the low-population variant, and under both low-fertility variants the 2050 value remains above the 2024 level. Section 4.3.2 explains the mechanism, which is that lower fertility reduces the child population, and therefore the public transfers flowing to children, faster than it increases the elderly population over a thirty-year horizon.
The policy reading must be correspondingly weaker than a specific target date would suggest. What the projection supports is that a period of relatively favorable fiscal conditions exists and closes within the horizon, not that reform must be completed by a particular year. A window of approximately nine years closing in 2030 can be read off the median alone, but that reading does not survive the variant comparison, and we do not advance it.
Benefit generosity does not converge on the state-led economies at any point. Thailand’s BGR moves from 0.091 in 2021 to 0.108 by 2050, remaining below South Korea’s 2021 level of 0.276 throughout. The modest increase reflects the changing relative size of the elderly and prime-age populations applied to a fixed transfer schedule, not any improvement in policy. Under the fixed-profile assumption, no policy improvement is possible by construction, and the projection should be read as showing what demography alone delivers, which in this case is very little.
The delivery channel is equally static. PPM drifts from 0.222 to 0.251, so that by mid-century 74.9% of net elderly support in Thailand still originates in families. AFR declines from 0.351 to 0.312 as the growing elderly cohort spreads a fixed asset income across more people. RCR is close to flat, easing from 0.915 to 0.875. The projection therefore shows Thai elderly consumption holding near working-age parity while the institutional basis of that consumption remains private and the fiscal capacity to substitute for it erodes. The delivery gap does not close under demographic pressure alone, and nothing in the demographic path creates the public architecture that the fiscal exposure would support.
5.3.3. Philippines and Indonesia: Fiscal Buffer Without Welfare Development
The Philippines and Indonesia accumulate substantial fiscal space over the projection horizon, a direct expression of the first demographic dividend (Bloom & Williamson, 1998) still operating in both economies. Philippine FSR rises from 17.031 in 2021 to 22.502 in 2030 and 30.107 by 2050, an increase of 76.8% over three decades driven by continued expansion of the working-age population relative to the elderly. Indonesian FSR increases from 18.047 to 20.442 in 2030 and 23.428 by 2050. Both trajectories rest on age structures that have not yet entered the compression phase through which Japan, South Korea and Thailand are already moving.
These are also the two economies whose projections are least well determined. In 2050 the Philippine FSR ranges from 25.2 to 40.6 across the five population variants and the Indonesian from 18.8 to 31.2, against a range of 2.3 to 2.7 for Japan. Fertility uncertainty dominates in both cases, and it acts on the child population, which is large in both economies, and which absorbs public transfers through education. The direction of travel is nonetheless robust: FSR rises under every variant in both economies. What is uncertain is the magnitude of the fiscal space accumulated, not its existence.
Indonesian results in this subsection carry the additional qualification set out in Section 6.3. The Indonesian profile is anchored in 2005 and predates the introduction of national health insurance in 2014, so the near absence of public elderly transfers it records should be read as provisional and as characterizing the pre-reform configuration rather than the present one.
The welfare delivery picture is categorically different. The Philippine BGR moves from −0.091 in 2021 to −0.080 by 2050, so Filipino elderly remain net contributors to the public transfer system across the entire horizon rather than becoming net recipients. Indonesia’s BGR holds close to zero throughout, at 0.008 in 2021 and 0.009 by 2050. Neither economy converts its fiscal dividend into public elderly transfers under fixed policy assumptions, which is the counterfactual the projection is designed to isolate.
Asset self-insurance remains the primary support mechanism in both economies, with gradual erosion. Philippine AFR declines from 0.910 to 0.877 and Indonesian AFR from 1.434 to 1.378, the latter remaining above unity throughout, meaning Indonesian elderly asset income continues to exceed the lifecycle consumption deficit in per capita terms even in 2050. Philippine PPM moves from −1.652 toward −1.028, a slow drift toward zero that reflects the growing elderly share altering the balance of public flows, though the sign remains negative throughout.
Consumption outcomes within this group remain far apart and show no tendency to converge. Philippine elderly consumption holds between 1.30 and 1.34 times the working-age level across the horizon, while Indonesia’s holds at approximately 0.84. Two economies sharing a financing structure, a demographic stage and a near-total absence of public elderly transfers therefore sustain materially different consumption outcomes for their older populations. This is consistent with the framework rather than anomalous within it: PPM and FSR identify how support is organized and at what demographic stage, whereas RCR records what the arrangement delivers. Common institutional form does not imply common outcome, and the Philippine case indicates that private channels, where dense enough, can sustain elderly consumption above parity without any state contribution.
The fiscal dividend these economies are accumulating represents a window for institutional investment in formal welfare infrastructure that has a defined, if uncertain, closing date. For the Philippines, FSR growth decelerates measurably after 2045, signaling that the demographic dividend is approaching its terminal phase more quickly than in Indonesia, where FSR growth remains more sustained through 2050. The transition from family-asset-led to a more formally institutionalized welfare system requires lead times of decades; the trajectory data indicate that the Philippines in particular faces a narrowing interval between now and the point at which demographic conditions can no longer underwrite institutional construction.
6. Discussion
6.1. Theoretical Implications
Section 2.4 sets out the budget constraint that links generosity to fiscal base, and the SAFE indicators are designed to make that link observable. Within the overlapping generations framework the sustainability-adequacy trade-off is not a policy failure that better governance can dissolve but an arithmetic property of a transfer system operating under a budget constraint. The claim is a derivation from the accounting identity rather than a generalization from evidence, and the two should be distinguished: the five economies studied here illustrate the trade-off and are consistent with it, but a sample of this size cannot establish that it holds universally. Barr and Diamond (2008) formalized this as a structural result: generosity (measured here by BGR) and fiscal base (measured by FSR) are connected through the same budget identity, so that raising benefit levels without expanding the tax base or increasing contributor density requires either deficit financing or a reduction in other public expenditures. The cross-economy variation documented in this study, from Japan’s BGR of 0.369 to Thailand’s 0.091, does not reflect different political preferences alone; it reflects where each economy sits on the feasibility frontier defined by its demographic structure, labor market formality, and accumulated fiscal capacity.
This theoretical grounding distinguishes the SAFE framework from existing multi-dimensional assessment architectures. The ILO World Social Protection Report (International Labour Organization, 2021) and the European Commission’s Pension Adequacy monitoring (European Commission, 2018) represent the most institutionally developed frameworks for evaluating social protection systems across multiple dimensions, yet neither grounds its indicators in a unified lifecycle accounting identity. In composite index approaches, indicator selection remains theoretically arbitrary, and cross-indicator aggregation can obscure the mechanical relationships between dimensions. The SAFE framework’s internal consistency via the NTA identity (LCD = TGnet + TFnet + RA) ensures that no indicator moves independently of the others: a change in public transfer generosity necessarily registers in FSR, PPM, and RCR simultaneously, preserving the logical coherence of the diagnostic. The framework thus occupies a distinct methodological space from both the institutional typologies of Esping-Andersen (1990) and Gough et al. (2004), which classify welfare state regimes without measuring quantitative distance from normative benchmarks, and from composite indices that aggregate heterogeneous indicators without a unifying accounting structure.
The welfare-delivery paradox identified in Thailand’s profile, a high fiscal support ratio coexisting with markedly low benefit delivery, is not necessarily specific to Thailand, though the basis for saying so is theoretical rather than empirical. The configuration follows from the budget identity itself: an economy that expands public transfer commitments during demographic transition without corresponding revenue reform or productivity growth is exposed to a growing denominator of fiscal obligation alongside a constrained numerator of benefit delivery. On that reasoning the configuration is a structural risk for economies at this stage of transition rather than a Thai idiosyncrasy, but the five-country sample cannot establish how commonly it arises, and testing that would require additional transitional economies with comparable SAFE profiles. International Labour Organization (2021) reporting indicates that middle-income countries carry a wide gap between fiscal commitment and effective benefit delivery, a pattern consistent with their having crossed the threshold of formal system creation without yet achieving the revenue depth to fund those systems adequately. The SAFE framework, by making this gap measurable through the BGR-FSR joint distribution, is designed to detect this configuration before it becomes fiscally entrenched. The Philippines and Indonesia, with FSR values already above 17 and projections exceeding 23 and 30 by 2050 respectively, are accumulating fiscal obligations at a rate that will compress future policy space unless benefit architecture is restructured in advance.
6.2. Policy Implications by Welfare Model
6.2.1. State-Led Systems: Japan and South Korea
Japan and South Korea confront a version of the sustainability challenge that Barr and Diamond (2008) identify as the central dilemma for mature PAYG systems. Parametric reforms, including adjustments to contribution rates, retirement age, and benefit indexation, can extend fiscal sustainability but cannot eliminate the structural trade-off. Structural reforms, such as a transition to notional defined contribution or funded components, can instead shift the feasibility frontier, at a fiscal cost managed through phased implementation and substantial political capital. Japan’s 2004 macroeconomic indexation reform illustrates the parametric route: it introduced a sliding-scale adjustment linking benefit growth automatically to life expectancy and the size of the contribution base, achieving long-term financial sustainability by automating benefit adjustment to demographic change and restoring younger generations’ trust in the pension (Ogawa et al., 2011; World Bank, 2016).
South Korea confronts a more acute form of this problem on a compressed timeline. Its FSR declines from 5.371 in 2021 to 2.974 by 2050, a contraction of 45%, while BGR remains close to its current level throughout, rising only from 0.276 to 0.291 (Section 5.3.1). The fiscal base financing an already substantial benefit level is therefore contracting steadily. No single threshold year marks a watershed; rather, the window for reform narrows with each year of deferral. The active debate in South Korea over notional defined contribution architecture is well timed in relation to that window, but the actuarial implications of transitioning from the current defined-benefit structure require careful management of transition-generation obligations (Barr & Diamond, 2008).
The sociological dimension of this fiscal-welfare squeeze is structural: parametric reforms that compress benefit generosity without expanding alternative pillars of retirement income tend to intensify stratification within the elderly cohort itself, since those with occupational pensions or private savings can absorb the reduction while those dependent exclusively on public transfers face effective welfare contraction. The intergenerational solidarity compact embedded in PAYG systems thus risks fracturing not only between age cohorts but within the elderly population along prior labor market fault lines, deepening the stratification consequences of fiscal adjustment.
6.2.2. Family-Asset-Led Systems: The Philippines and Indonesia
The ILO’s World Social Protection Report documents that only 46.9% of the global population is effectively covered by at least one social protection benefit. In Southeast Asia, the coverage gap ranks among the widest globally, concentrated in the informal-sector majority that the Philippines and Indonesia must reach if any contributory system is to achieve fiscal depth (International Labour Organization, 2021). Informal employment declines only gradually with development and remains a persistent structural feature of middle-income economies in the interim, sustained by productivity differentials between formal and informal sectors (La Porta & Shleifer, 2014). For the Philippines and Indonesia, this implies that conventional contributory pension architectures will structurally exclude their largest labor market segment.
The demographic dividend fiscal window, the period during which FSR remains high and the working-age share is at its peak, constitutes these economies’ primary financing opportunity for building non-contributory or semi-contributory social protection before demographic transition erodes that fiscal capacity (Asher & Zen, 2015). Evidence from Brazil, Mexico, and the Philippines’ own 4Ps conditional cash transfer program suggests that non-contributory schemes for the elderly poor can be scaled within the fiscal space the dividend creates, consistent with the International Labour Organization (2012) Social Protection Floor as the normative minimum. Long-term care demand, however, grows super-linearly with elderly population share (Colombo et al., 2011): absent institutional infrastructure established well before the demographic peak, the Philippines and Indonesia will confront a demand surge without the capacity to meet it. Both countries’ high AFR values (Philippines 0.910, Indonesia 1.434) reflect heavy reliance on family and private asset financing. This configuration is efficient under current demographic structures but becomes fragile as household size contracts, geographic mobility increases, and the old-age support ratio declines (Hermalin, 2002; R. D. Lee & Mason, 2011).
Deferred institutionalization carries a sociological cost. It perpetuates what Gough et al. (2004) term informal security regimes, in which welfare outcomes depend not on social rights but on the contingencies of family network density, household wealth, and geographic proximity to adult children. Such regimes are structurally inegalitarian: they systematically disadvantage elderly individuals in households with fewer adult children, fewer accumulated assets, or kin networks disrupted by migration and urbanization, reinforcing pre-existing social inequalities rather than attenuating them.
6.2.3. The Transitional Case: Thailand
Thailand’s BGR of 0.091 means that public transfers deliver approximately nine cents to an elderly person for every dollar of prime-age labor income, against 28 cents in South Korea and 37 cents in Japan. Measured against the International Labour Organization (2012) Social Protection Floor normative minimum, which establishes basic income security for older persons as a universal standard, Thailand’s current benefit level falls well short of adequacy.
The Old-Age Allowance, providing 600 to 1000 THB per month on an age-tiered basis (600 THB at 60–69, 700 at 70–79, 800 at 80–89, 1000 at 90 and above), is near-universal rather than means-tested: eligibility requires only Thai nationality and being aged 60 or above, and excludes solely those already receiving a government pension or comparable state benefit (Department of Older Persons, 2026; Teerawichitchainan & Pothisiri, 2021). This produces a BGR of 0.091 once other public transfers are included. Full convergence to South Korea’s BGR of 0.276 would require roughly a three-fold increase in per capita transfer value relative to prime-age earnings and is not proposed here as a near-term target. A more defensible intermediate benchmark is BGR 0.15 to 0.18 by 2035: this leaves Thailand well below South Korea’s current level but roughly doubles the present benefit-to-earnings ratio, a magnitude of adjustment achievable through the revenue and enrollment measures set out below without the fiscal commitment that full convergence implies (OECD, 2023; World Bank, 2008).
Two design questions should be distinguished at this point, since BGR speaks to one and not the other. As a ratio of means, BGR measures the depth of provision, which is the dimension on which Thailand is furthest from its demographic peers and the dimension this framework is built to track. How that provision is distributed within the elderly population is a separate question, and one the National Transfer Accounts cannot address, since they carry no information on position in the income distribution. Evidence that bears on it exists: Teerawichitchainan and Pothisiri (2021) report that older Thais relying principally on the allowance record lower income adequacy than others. Raising the depth of provision and targeting it are therefore complementary reforms rather than substitutes, and the sequencing argument below concerns the first.
Thailand’s projected FSR peaking at 6.213 in 2030 before declining to 5.411 by 2050 signals a narrowing fiscal window: the working-age base will be proportionally smaller, making the revenue expansion required for benefit adequacy progressively more costly. The sequencing implication can be made specific. Base broadening, rather than a rate increase, is the more defensible revenue instrument: closing value-added tax exemptions currently applied to agricultural and informal-sector transactions, and widening the personal income tax base to capture informal-sector earnings presently outside the contributory net, both raise revenue without the distributional and political costs of raising the VAT rate itself, and both enlarge the same informal-sector base from which a reformed National Savings Fund would draw contributions. Thailand’s experience with the Universal Coverage (UC) Scheme, in which general tax financing enabled the rapid scale-up of health benefits, offers a transferable model for sequenced welfare expansion (Tangcharoensathien et al., 2011).
On the asset side, Thailand’s AFR of 0.351 reflects incomplete provident fund coverage; the National Savings Fund, designed to extend voluntary savings to informal workers, has underperformed enrollment projections under its current opt-in design. Converting enrollment from opt-in to automatic, with an opt-out provision preserving worker choice, is the most direct policy lever available: automatic enrollment has substantially raised participation in comparable voluntary schemes elsewhere, including the United Kingdom’s National Employment Savings Trust and New Zealand’s KiwiSaver, by removing the inertia that opt-in design leaves unaddressed, and it would raise AFR and reduce the dependence of Thai elderly consumption on family transfers rather than on own assets (World Bank, 2016). Thailand’s Universal Coverage Scheme represents a significant institutional achievement in extending social rights in healthcare, but coverage breadth in health does not translate into income adequacy in retirement: elderly households dependent primarily on family transfers and a nominal old-age allowance remain stratified by the resource capacity of their kin networks rather than guaranteed by citizenship entitlements. The sociological significance of closing the BGR gap is therefore not only distributive but institutional: it marks the transition from welfare outcomes determined by family structure to outcomes anchored in social rights, the defining shift from informal security regime to state-led welfare architecture (Gough et al., 2004).
6.2.4. SAFE as a Monitoring Instrument
The indicators are inexpensive to recompute. Once national accounts publish an updated profile, the five ratios and their sensitivity ranges follow from two inputs, the profile and a population series, and require no estimation step. This makes annual or biennial updating practical in a way that a full modeling exercise would not be, and it suggests three uses beyond the comparative analysis presented here.
The first is separating structural change from demographic drift. Under fixed profiles, movement in an indicator reflects age structure alone. Recomputing with an updated profile and differencing against the fixed-profile projection for the same year isolates what changed because policy or behavior changed, rather than because the population aged. The backcast in Appendix A.3 is this operation performed retrospectively for South Korea, and the same decomposition applied prospectively would tell a finance ministry whether a reform had altered the transfer system or whether the observed movement was demographic in origin.
The second is early identification of the transitional configuration. The classification rule of Section 3.3 uses two indicators and two thresholds, so an economy’s position relative to those thresholds can be tracked directly. The configuration this paper identifies in Thailand, family-majority delivery combined with a closed demographic dividend, is one an economy enters gradually and, on the evidence assembled here, without any single indicator signaling the transition. FSR alone would not have flagged it. Monitoring PPM against FSR would.
The third is bounding the reform window. Section 5.3.2 shows that the timing of Thailand’s fiscal peak is not well identified, ranging from 2024 to 2042 across demographic variants, which is a more useful statement for planning than a single date would be. Recomputing the range as each new WPP revision appears would narrow it as the projection horizon shortens, and a monitoring system reporting the range rather than the central path would communicate what is and is not known about the timing of fiscal pressure.
Two conditions limit this. Updating requires national NTA production to continue, which is not assured in every economy, and the profile vintages in this study, spanning 2005 to 2023, indicate that production is irregular. The value of SAFE as a monitoring instrument is therefore contingent on the underlying accounts being maintained, which is itself a policy choice.
6.3. Limitations
Four limitations qualify the interpretation of these findings.
The first is inherent to the fixed-profile methodology. Holding per capita age profiles constant isolates the demographic contribution to indicator change, which is the analytical purpose of the exercise, but policy change, productivity growth and behavioral adaptation will all alter actual trajectories over a thirty-year horizon. Quantitative projections beyond ten to fifteen years should therefore be read as illustrative scenarios rather than as forecasts. The backcast reported in Appendix A.3 provides a direct test of how much this matters. Projecting South Korea’s 2010 profiles forward to 2023 and comparing against observed 2023 values, profile drift over thirteen years is +0.057 for BGR and +0.065 for RCR, against a demographic component an order of magnitude smaller. Drift in PPM is larger at 0.152, reflecting the maturation of the National Pension Scheme over that period, and it is on this component that the fixed-profile assumption is weakest. The demographic sensitivity analysis of Section 4.3.2 shows that direction of change is robust in 24 of the 25 country-indicator combinations across all five population variants. Precision nonetheless declines as structural change accumulates, and the ranges are widest for the Philippines and Indonesia, where fertility uncertainty is greatest.
The second limitation concerns Indonesia’s base year, anchored in 2005 and predating both the introduction of Jaminan Kesehatan Nasional in 2014 and the subsequent expansion of social protection (Pisani et al., 2017). The 2005 profile almost certainly understates current public transfer flows to the elderly, so Indonesia’s BGR is understated relative to present conditions. JKN had extended public health coverage to 223 million members by 2020, more than 82% of the population (International Labour Organization, 2021), implying a material increase in public transfer inflows to older cohorts. We therefore treat Indonesia’s classification as provisional and state so in the abstract and conclusion.
The direction of each shift can nonetheless be assessed, and the three indicators would not move together. BGR would rise, since JKN channels public health transfers directly to older cohorts and the 2005 value of 0.008 leaves almost no room for movement in the opposite direction. Household survey evidence associates JKN membership with a lower probability of incurring out-of-pocket health payments and with smaller payments where they occur (Maulana et al., 2022). PPM would move away from the state-led threshold rather than toward it: the net private transfer of the Indonesian elderly is negative and exceeds their net public transfer in magnitude, so the ratio is decreasing in its public component, and an expanding public channel pushes it further below zero. FSR is the one indicator whose direction cannot be signed. Its denominator consists overwhelmingly of transfers to children rather than to the elderly, and JKN covers all ages, so post-2014 data would raise the denominator mainly through the child component while labor income grew substantially over the same period. Updated data would therefore sharpen Indonesia’s position rather than overturn it.
The provisional status can be made precise. The classification rule of Section 3.3 uses two indicators and two thresholds, so the distance to reclassification can be stated rather than left as a qualitative caveat. Indonesia is family-asset-led because PPM of −0.051 falls below 0.50 and FSR of 18.047 exceeds 10. Movement to the transitional category would require FSR to fall below 10, a decline of 45%, which for a ratio of labor income to public transfer outflows implies that those outflows would have had to grow roughly 80% faster than labor income since 2005. Indonesia’s negative PPM arises not because the state extracts from the elderly but because the Indonesian elderly are themselves net providers of private transfers: they receive a small positive net public transfer while transferring more to younger household members than they receive, so the denominator of the ratio is negative. Movement to the state-led category would require net public transfers to the elderly to exceed that net private outflow, a more than twentyfold increase on their current level, at which point PPM turns positive and rises above one rather than passing through 0.50. Updated data would plausibly move Indonesia toward the second of these, since JKN operates on the transfer channel that PPM measures, whereas the FSR condition is demographic, and Indonesia moves further from it over the projection horizon as FSR rises to 23.4 by 2050. Neither threshold is close, and the FSR condition in particular lies well beyond the range that updated data could plausibly reach.
The third limitation generalizes the second. The framework is applicable wherever NTA data exist, but its output is only as current as the profiles it is given, and profile vintages in this study range from 2005 to 2023. Two consequences follow. Cross-country comparison assumes that structural relationships captured at different survey dates remain comparable, which is defensible for slow-moving institutional features and weaker for any economy that has undertaken major reform since its survey. Applications of SAFE should therefore report profile vintage alongside every result and treat economies with pre-reform profiles as provisional, as we do for Indonesia here. A related constraint is the upper age boundary of the source data, which ranges from 80 in the Philippines to 99 in Thailand, so that flows above each boundary are carried in the terminal age cell rather than distributed across single years. This is handled consistently in our calculations but limits the resolution available at the oldest ages, which are precisely the ages where health-related consumption is concentrated.
The fourth limitation is the synthetic-cohort structure of the fixed-profile analysis. Fixed per capita age profiles treat the cross-sectional age structure as a stable representation of lifecycle behavior, but cohort-specific changes in retirement timing, savings rates, and health expenditure patterns alter actual profiles over time. Cohort simulation methods, which track specific birth cohorts through time rather than aggregating across synthetic cross-sections, represent a natural methodological extension; Prskawetz and Sambt (2014) identify constructing time-varying age profiles as a priority for future NTA research. These methods require longitudinal microdata that are not uniformly available across all five economies.
7. Conclusions
Asia’s demographic transition is outpacing the institutional development required to support it, and the resulting strains are not visible through any single indicator. This paper introduced NTA-SAFE, a framework of five indicators derived from the National Transfer Accounts’ lifecycle identity, and applied it to five economies spanning the range of demographic stages. An explicit classification rule sorts them by the modal provider of net transfers to the elderly and by the stage of their demographic transition, and each of the three resulting types carries a distinct warning. State-led systems have achieved breadth in public provision and now face a contracting base from which to finance it. Family-asset-led systems retain large fiscal buffers while delivering almost no formal welfare, so that on unchanged policy their demographic dividend passes without institutional capture. No economy in this sample built public-majority elderly transfers while its dividend remained open, and that empty combination is itself a finding.
The transitional case is the most instructive. Thailand carries the demographic and fiscal exposure of a state-led system while its elderly still depend on families for 78% of net transfer support. Consumption outcomes give no current warning, since the Thai elderly consume close to the working-age per capita level. What differs is the basis of that consumption. It rests on transfers from working-age relatives rather than on public entitlement or accumulated assets, and family size, co-residence and proximity are all contracting. The exposure the framework identifies is therefore prospective, and it is precisely the kind that indicators of current adequacy do not register.
Across these five economies, benefit generosity and the breadth of the fiscal base move against one another, as the budget constraint set out in Section 2.4 implies. We describe this as a pattern consistent with the theory rather than as a demonstration of its universality, which five cases cannot establish.
The methodological contribution rests on the internal consistency the NTA identity enforces, which ensures that no indicator moves independently of the others and distinguishes NTA-SAFE from composite indices assembled without an accounting constraint. The framework is replicable wherever National Transfer Accounts exist, across more than forty economies (United Nations, 2013), subject to an important qualification. Its output is only as current as the profiles it is given. Vintages in this study span 2005 to 2023, Indonesia’s classification is provisional because its profile predates the 2014 introduction of national health insurance, and any application should report profile vintage alongside its results.
Beyond measurement, the typologies raise a question the framework can pose but not answer. State-led systems organize elderly welfare as a social right, whereas family-asset-led systems distribute it according to household wealth and kin network density. Whether the second reproduces life-course inequality into old age is a plausible hypothesis and an important one, but testing it requires distributional data on income and wealth among the elderly that the National Transfer Accounts do not carry. We advance it as a direction for research rather than as a result of this study.
Four extensions follow. Cohort simulation would replace the fixed profile assumption (Prskawetz & Sambt, 2014). A health-adjusted consumption ratio would separate age-varying need from age-varying consumption (Deaton, 2003). Linking SAFE indicators to distributional microdata would allow the stratification hypothesis to be tested rather than asserted. Application to economies entering transition at lower income levels, including Vietnam, Myanmar and Bangladesh, would extend the comparative range. The indicators are inexpensive to update once profiles exist, which makes annual recomputation a realistic basis for monitoring rather than a one-off exercise.
Author Contributions
Conceptualization, M.L.-a. and P.S.; methodology, M.L.-a. and P.S.; software, M.L.-a.; validation, M.L.-a. and P.S.; formal analysis, M.L.-a. and P.S.; investigation, M.L.-a.; resources, M.L.-a.; data curation, M.L.-a.; writing—original draft preparation, M.L.-a. and P.S.; writing—review and editing, M.L.-a. and P.S.; visualization, P.S.; supervision, P.S.; project administration, P.S.; funding acquisition, M.L.-a. All authors have read and agreed to the published version of the manuscript.
Funding
This research was funded by the Department of Economics, Faculty of Economics, Kasetsart University, through a research grant awarded to M.L. (Research Project No. 4/2026).
Institutional Review Board Statement
Not applicable.
Informed Consent Statement
Not applicable.
Data Availability Statement
The data that support the findings of this study are available from the corresponding author upon reasonable request.
Conflicts of Interest
The authors declare no conflict of interest.
Abbreviations
The following abbreviations are used in this manuscript
| AFR | Asset Funding Ratio |
| BGR | Benefit Generosity Ratio |
| BPJS | Badan Penyelenggara Jaminan Sosial |
| FSR | Fiscal Support Ratio |
| ILO | International Labour Organization |
| JKN | Jaminan Kesehatan Nasional |
| LCD | Lifecycle Deficit |
| NTA | National Transfer Accounts |
| OECD | Organisation for Economic Co-operation and Development |
| OLG | Overlapping Generations |
| PAYG | Pay-As-You-Go |
| PPM | Public–Private Transfer Mix |
| RA | Asset-based reallocations |
| RCR | Relative Consumption Ratio |
| SAFE | Sustainability, Adequacy, Fairness, and Efficiency |
| TFnet | Net private family transfers |
| TGnet | Net public transfers |
| UC | Universal Coverage Scheme |
| WPP | World Population Prospects |
| YL | Labor income |
Appendix A
Appendix A.1. Full Median SAFE Indicator Projections, 2021–2050
| Year | Japan (2019) | South Korea (2023) | Thailand (2021) | Philippines (2015) | Indonesia (2005) |
| Panel A: Fiscal Support Ratio (FSR) | |||||
| 2021 | 3.378 | 5.371 | 5.978 | 17.031 | 18.047 |
| 2022 | 3.348 | 5.325 | 6.034 | 17.497 | 18.208 |
| 2023 | 3.328 | 5.271 | 6.084 | 17.984 | 18.412 |
| 2024 | 3.301 | 5.203 | 6.120 | 18.514 | 18.650 |
| 2025 | 3.268 | 5.136 | 6.141 | 19.101 | 18.917 |
| 2026 | 3.246 | 5.065 | 6.161 | 19.730 | 19.202 |
| 2027 | 3.235 | 4.966 | 6.179 | 20.391 | 19.500 |
| 2028 | 3.228 | 4.912 | 6.195 | 21.076 | 19.808 |
| 2029 | 3.184 | 4.892 | 6.207 | 21.782 | 20.124 |
| 2030 | 3.114 | 4.836 | 6.213 | 22.502 | 20.442 |
| 2031 | 3.073 | 4.749 | 6.213 | 23.228 | 20.750 |
| 2032 | 3.056 | 4.611 | 6.207 | 23.954 | 21.032 |
| 2033 | 3.031 | 4.486 | 6.196 | 24.669 | 21.287 |
| 2034 | 3.032 | 4.398 | 6.182 | 25.360 | 21.518 |
| 2035 | 3.037 | 4.303 | 6.164 | 26.017 | 21.728 |
| 2036 | 2.910 | 4.203 | 6.140 | 26.631 | 21.917 |
| 2037 | 2.783 | 4.052 | 6.111 | 27.190 | 22.088 |
| 2038 | 2.748 | 3.920 | 6.075 | 27.676 | 22.243 |
| 2039 | 2.745 | 3.806 | 6.032 | 28.075 | 22.384 |
| 2040 | 2.746 | 3.661 | 5.984 | 28.379 | 22.511 |
| 2041 | 2.734 | 3.556 | 5.930 | 28.594 | 22.626 |
| 2042 | 2.721 | 3.469 | 5.873 | 28.756 | 22.732 |
| 2043 | 2.702 | 3.381 | 5.812 | 28.901 | 22.830 |
| 2044 | 2.680 | 3.296 | 5.751 | 29.044 | 22.920 |
| 2045 | 2.639 | 3.199 | 5.690 | 29.190 | 23.004 |
| 2046 | 2.598 | 3.129 | 5.630 | 29.343 | 23.086 |
| 2047 | 2.570 | 3.099 | 5.572 | 29.509 | 23.167 |
| 2048 | 2.526 | 3.070 | 5.516 | 29.690 | 23.249 |
| 2049 | 2.477 | 3.031 | 5.462 | 29.889 | 23.335 |
| 2050 | 2.444 | 2.974 | 5.411 | 30.107 | 23.428 |
| Panel B: Benefit Generosity Ratio (BGR) | |||||
| 2021 | 0.369 | 0.276 | 0.091 | −0.091 | 0.008 |
| 2022 | 0.374 | 0.274 | 0.091 | −0.092 | 0.007 |
| 2023 | 0.379 | 0.274 | 0.091 | −0.091 | 0.007 |
| 2024 | 0.383 | 0.273 | 0.091 | −0.091 | 0.007 |
| 2025 | 0.387 | 0.271 | 0.091 | −0.091 | 0.007 |
| 2026 | 0.390 | 0.269 | 0.091 | −0.090 | 0.007 |
| 2027 | 0.391 | 0.272 | 0.092 | −0.090 | 0.007 |
| 2028 | 0.390 | 0.271 | 0.092 | −0.089 | 0.007 |
| 2029 | 0.396 | 0.268 | 0.093 | −0.089 | 0.007 |
| 2030 | 0.405 | 0.268 | 0.093 | −0.088 | 0.007 |
| 2031 | 0.410 | 0.270 | 0.094 | −0.087 | 0.007 |
| 2032 | 0.409 | 0.276 | 0.094 | −0.087 | 0.007 |
| 2033 | 0.408 | 0.280 | 0.095 | −0.086 | 0.008 |
| 2034 | 0.401 | 0.280 | 0.096 | −0.085 | 0.008 |
| 2035 | 0.393 | 0.280 | 0.096 | −0.085 | 0.008 |
| 2036 | 0.408 | 0.280 | 0.097 | −0.084 | 0.008 |
| 2037 | 0.423 | 0.285 | 0.098 | −0.084 | 0.008 |
| 2038 | 0.420 | 0.288 | 0.099 | −0.083 | 0.008 |
| 2039 | 0.410 | 0.290 | 0.100 | −0.083 | 0.008 |
| 2040 | 0.400 | 0.296 | 0.101 | −0.082 | 0.008 |
| 2041 | 0.394 | 0.299 | 0.102 | −0.082 | 0.008 |
| 2042 | 0.389 | 0.300 | 0.103 | −0.081 | 0.008 |
| 2043 | 0.385 | 0.302 | 0.103 | −0.081 | 0.008 |
| 2044 | 0.383 | 0.303 | 0.104 | −0.081 | 0.008 |
| 2045 | 0.385 | 0.305 | 0.105 | −0.081 | 0.008 |
| 2046 | 0.387 | 0.304 | 0.106 | −0.081 | 0.008 |
| 2047 | 0.388 | 0.299 | 0.106 | −0.081 | 0.008 |
| 2048 | 0.392 | 0.294 | 0.107 | −0.081 | 0.008 |
| 2049 | 0.398 | 0.291 | 0.107 | −0.080 | 0.008 |
| 2050 | 0.402 | 0.291 | 0.108 | −0.080 | 0.009 |
| Panel C: Public–Private Transfer Mix (PPM) | |||||
| 2021 | 1.040 | 0.816 | 0.222 | −1.652 | −0.051 |
| 2022 | 1.037 | 0.816 | 0.222 | −1.692 | −0.050 |
| 2023 | 1.035 | 0.816 | 0.222 | −1.689 | −0.049 |
| 2024 | 1.033 | 0.815 | 0.222 | −1.669 | −0.048 |
| 2025 | 1.031 | 0.815 | 0.222 | −1.617 | −0.048 |
| 2026 | 1.029 | 0.814 | 0.223 | −1.550 | −0.048 |
| 2027 | 1.028 | 0.813 | 0.223 | −1.476 | −0.048 |
| 2028 | 1.028 | 0.814 | 0.224 | −1.397 | −0.048 |
| 2029 | 1.025 | 0.816 | 0.224 | −1.333 | −0.048 |
| 2030 | 1.021 | 0.817 | 0.225 | −1.300 | −0.048 |
| 2031 | 1.019 | 0.817 | 0.226 | −1.277 | −0.049 |
| 2032 | 1.019 | 0.816 | 0.227 | −1.248 | −0.049 |
| 2033 | 1.018 | 0.816 | 0.228 | −1.218 | −0.050 |
| 2034 | 1.020 | 0.816 | 0.229 | −1.188 | −0.050 |
| 2035 | 1.022 | 0.817 | 0.230 | −1.161 | −0.051 |
| 2036 | 1.016 | 0.818 | 0.231 | −1.140 | −0.052 |
| 2037 | 1.010 | 0.817 | 0.233 | −1.122 | −0.053 |
| 2038 | 1.011 | 0.816 | 0.234 | −1.099 | −0.054 |
| 2039 | 1.014 | 0.816 | 0.236 | −1.077 | −0.055 |
| 2040 | 1.017 | 0.815 | 0.237 | −1.060 | −0.056 |
| 2041 | 1.020 | 0.814 | 0.239 | −1.049 | −0.057 |
| 2042 | 1.022 | 0.814 | 0.240 | −1.041 | −0.058 |
| 2043 | 1.024 | 0.814 | 0.242 | −1.038 | −0.059 |
| 2044 | 1.026 | 0.813 | 0.243 | −1.035 | −0.060 |
| 2045 | 1.026 | 0.811 | 0.245 | −1.036 | −0.061 |
| 2046 | 1.025 | 0.810 | 0.246 | −1.042 | −0.062 |
| 2047 | 1.025 | 0.811 | 0.247 | −1.045 | −0.063 |
| 2048 | 1.023 | 0.812 | 0.248 | −1.041 | −0.063 |
| 2049 | 1.021 | 0.812 | 0.249 | −1.034 | −0.064 |
| 2050 | 1.020 | 0.812 | 0.251 | −1.028 | −0.066 |
| Panel D: Relative Consumption Ratio (RCR) | |||||
| 2021 | 1.366 | 0.933 | 0.915 | 1.313 | 0.841 |
| 2022 | 1.370 | 0.932 | 0.915 | 1.313 | 0.841 |
| 2023 | 1.372 | 0.933 | 0.915 | 1.310 | 0.842 |
| 2024 | 1.374 | 0.932 | 0.915 | 1.309 | 0.842 |
| 2025 | 1.376 | 0.929 | 0.915 | 1.313 | 0.842 |
| 2026 | 1.374 | 0.927 | 0.914 | 1.319 | 0.842 |
| 2027 | 1.369 | 0.931 | 0.914 | 1.327 | 0.842 |
| 2028 | 1.362 | 0.924 | 0.913 | 1.337 | 0.842 |
| 2029 | 1.368 | 0.910 | 0.913 | 1.344 | 0.842 |
| 2030 | 1.385 | 0.903 | 0.912 | 1.343 | 0.842 |
| 2031 | 1.390 | 0.902 | 0.910 | 1.339 | 0.842 |
| 2032 | 1.384 | 0.910 | 0.909 | 1.337 | 0.842 |
| 2033 | 1.381 | 0.915 | 0.908 | 1.336 | 0.842 |
| 2034 | 1.366 | 0.911 | 0.906 | 1.337 | 0.842 |
| 2035 | 1.349 | 0.907 | 0.905 | 1.337 | 0.842 |
| 2036 | 1.383 | 0.904 | 0.903 | 1.336 | 0.841 |
| 2037 | 1.419 | 0.910 | 0.901 | 1.334 | 0.841 |
| 2038 | 1.415 | 0.913 | 0.900 | 1.333 | 0.841 |
| 2039 | 1.397 | 0.912 | 0.898 | 1.333 | 0.840 |
| 2040 | 1.378 | 0.920 | 0.895 | 1.331 | 0.840 |
| 2041 | 1.365 | 0.919 | 0.893 | 1.327 | 0.840 |
| 2042 | 1.355 | 0.915 | 0.891 | 1.322 | 0.840 |
| 2043 | 1.347 | 0.912 | 0.889 | 1.318 | 0.839 |
| 2044 | 1.340 | 0.909 | 0.887 | 1.315 | 0.839 |
| 2045 | 1.343 | 0.910 | 0.885 | 1.312 | 0.839 |
| 2046 | 1.347 | 0.905 | 0.883 | 1.308 | 0.838 |
| 2047 | 1.347 | 0.890 | 0.881 | 1.304 | 0.838 |
| 2048 | 1.356 | 0.876 | 0.879 | 1.302 | 0.838 |
| 2049 | 1.367 | 0.866 | 0.877 | 1.301 | 0.837 |
| 2050 | 1.372 | 0.862 | 0.875 | 1.300 | 0.837 |
| Panel E: Asset Funding Ratio (AFR) | |||||
| 2021 | 0.529 | 0.265 | 0.351 | 0.910 | 1.434 |
| 2022 | 0.525 | 0.267 | 0.351 | 0.912 | 1.440 |
| 2023 | 0.522 | 0.269 | 0.351 | 0.911 | 1.443 |
| 2024 | 0.519 | 0.269 | 0.351 | 0.911 | 1.446 |
| 2025 | 0.515 | 0.270 | 0.350 | 0.909 | 1.448 |
| 2026 | 0.512 | 0.271 | 0.350 | 0.906 | 1.450 |
| 2027 | 0.511 | 0.269 | 0.349 | 0.903 | 1.451 |
| 2028 | 0.510 | 0.268 | 0.348 | 0.899 | 1.451 |
| 2029 | 0.506 | 0.269 | 0.347 | 0.896 | 1.451 |
| 2030 | 0.501 | 0.268 | 0.346 | 0.894 | 1.450 |
| 2031 | 0.498 | 0.265 | 0.344 | 0.893 | 1.449 |
| 2032 | 0.497 | 0.260 | 0.343 | 0.891 | 1.448 |
| 2033 | 0.497 | 0.256 | 0.341 | 0.889 | 1.446 |
| 2034 | 0.500 | 0.256 | 0.340 | 0.888 | 1.443 |
| 2035 | 0.504 | 0.255 | 0.338 | 0.886 | 1.440 |
| 2036 | 0.496 | 0.254 | 0.336 | 0.885 | 1.436 |
| 2037 | 0.488 | 0.250 | 0.334 | 0.884 | 1.432 |
| 2038 | 0.489 | 0.247 | 0.332 | 0.882 | 1.428 |
| 2039 | 0.494 | 0.245 | 0.330 | 0.881 | 1.423 |
| 2040 | 0.499 | 0.240 | 0.328 | 0.879 | 1.418 |
| 2041 | 0.502 | 0.237 | 0.326 | 0.879 | 1.413 |
| 2042 | 0.506 | 0.235 | 0.324 | 0.878 | 1.409 |
| 2043 | 0.508 | 0.232 | 0.322 | 0.878 | 1.405 |
| 2044 | 0.510 | 0.230 | 0.321 | 0.878 | 1.401 |
| 2045 | 0.509 | 0.227 | 0.319 | 0.878 | 1.397 |
| 2046 | 0.508 | 0.226 | 0.318 | 0.878 | 1.393 |
| 2047 | 0.507 | 0.227 | 0.316 | 0.878 | 1.390 |
| 2048 | 0.505 | 0.228 | 0.315 | 0.878 | 1.386 |
| 2049 | 0.501 | 0.228 | 0.314 | 0.878 | 1.382 |
| 2050 | 0.499 | 0.226 | 0.312 | 0.877 | 1.378 |
Appendix A.2. SAFE Indicator Demographic Sensitivity Ranges at Key Years, 2025–2050 (WPP 2024 Probabilistic Population Bounds)
| Year | Japan (2019) | South Korea (2023) | Thailand (2021) | Philippines (2015) | Indonesia (2005) |
| Panel A: Fiscal Support Ratio (FSR) | |||||
| 95% Lower Bound | |||||
| 2025 | 3.290 | 5.151 | 6.205 | 19.278 | 19.048 |
| 2030 | 3.228 | 4.881 | 6.562 | 23.813 | 21.174 |
| 2035 | 3.239 | 4.385 | 6.982 | 30.024 | 24.739 |
| 2040 | 3.005 | 3.734 | 7.283 | 36.145 | 28.759 |
| 2045 | 2.917 | 3.193 | 7.236 | 39.173 | 30.711 |
| 2050 | 2.701 | 2.825 | 6.966 | 40.625 | 31.245 |
| 80% Lower Bound | |||||
| 2025 | 3.282 | 5.146 | 6.190 | 19.216 | 19.001 |
| 2030 | 3.187 | 4.876 | 6.440 | 23.300 | 20.895 |
| 2035 | 3.170 | 4.395 | 6.645 | 28.318 | 23.545 |
| 2040 | 2.920 | 3.753 | 6.695 | 32.572 | 26.090 |
| 2045 | 2.824 | 3.238 | 6.505 | 34.514 | 27.332 |
| 2050 | 2.618 | 2.935 | 6.216 | 35.779 | 27.883 |
| Median | |||||
| 2025 | 3.268 | 5.136 | 6.141 | 19.101 | 18.917 |
| 2030 | 3.114 | 4.836 | 6.213 | 22.502 | 20.442 |
| 2035 | 3.037 | 4.303 | 6.164 | 26.017 | 21.728 |
| 2040 | 2.746 | 3.661 | 5.984 | 28.379 | 22.511 |
| 2045 | 2.639 | 3.199 | 5.690 | 29.190 | 23.004 |
| 2050 | 2.444 | 2.974 | 5.411 | 30.107 | 23.428 |
| 80% Upper Bound | |||||
| 2025 | 3.255 | 5.126 | 6.117 | 18.987 | 18.841 |
| 2030 | 3.049 | 4.804 | 6.036 | 21.775 | 20.035 |
| 2035 | 2.926 | 4.225 | 5.797 | 24.194 | 20.202 |
| 2040 | 2.602 | 3.576 | 5.469 | 25.371 | 19.845 |
| 2045 | 2.488 | 3.148 | 5.111 | 25.721 | 19.963 |
| 2050 | 2.304 | 2.973 | 4.844 | 26.667 | 20.438 |
| 95% Upper Bound | |||||
| 2025 | 3.249 | 5.122 | 6.100 | 18.925 | 18.802 |
| 2030 | 3.021 | 4.794 | 5.943 | 21.370 | 19.824 |
| 2035 | 2.882 | 4.209 | 5.623 | 23.285 | 19.450 |
| 2040 | 2.553 | 3.577 | 5.266 | 24.107 | 18.547 |
| 2045 | 2.438 | 3.188 | 4.898 | 24.252 | 18.397 |
| 2050 | 2.261 | 3.053 | 4.646 | 25.199 | 18.800 |
| Panel B: Benefit Generosity Ratio (BGR) | |||||
| 95% Lower Bound | |||||
| 2025 | 0.387 | 0.270 | 0.091 | −0.091 | 0.007 |
| 2030 | 0.401 | 0.267 | 0.093 | −0.088 | 0.007 |
| 2035 | 0.386 | 0.278 | 0.095 | −0.085 | 0.008 |
| 2040 | 0.388 | 0.293 | 0.099 | −0.084 | 0.008 |
| 2045 | 0.373 | 0.304 | 0.102 | −0.083 | 0.008 |
| 2050 | 0.388 | 0.293 | 0.104 | −0.083 | 0.008 |
| 80% Lower Bound | |||||
| 2025 | 0.387 | 0.270 | 0.091 | −0.091 | 0.007 |
| 2030 | 0.402 | 0.267 | 0.093 | −0.088 | 0.007 |
| 2035 | 0.388 | 0.279 | 0.096 | −0.085 | 0.008 |
| 2040 | 0.392 | 0.295 | 0.099 | −0.083 | 0.008 |
| 2045 | 0.377 | 0.305 | 0.103 | −0.082 | 0.008 |
| 2050 | 0.393 | 0.293 | 0.106 | −0.082 | 0.008 |
| Median | |||||
| 2025 | 0.387 | 0.271 | 0.091 | −0.091 | 0.007 |
| 2030 | 0.405 | 0.268 | 0.093 | −0.088 | 0.007 |
| 2035 | 0.393 | 0.280 | 0.096 | −0.085 | 0.008 |
| 2040 | 0.400 | 0.296 | 0.101 | −0.082 | 0.008 |
| 2045 | 0.385 | 0.305 | 0.105 | −0.081 | 0.008 |
| 2050 | 0.402 | 0.291 | 0.108 | −0.080 | 0.009 |
| 80% Upper Bound | |||||
| 2025 | 0.388 | 0.271 | 0.091 | −0.091 | 0.007 |
| 2030 | 0.407 | 0.268 | 0.094 | −0.088 | 0.007 |
| 2035 | 0.397 | 0.281 | 0.097 | −0.084 | 0.008 |
| 2040 | 0.408 | 0.297 | 0.102 | −0.081 | 0.008 |
| 2045 | 0.391 | 0.305 | 0.107 | −0.079 | 0.009 |
| 2050 | 0.409 | 0.288 | 0.110 | −0.077 | 0.009 |
| 95% Upper Bound | |||||
| 2025 | 0.388 | 0.271 | 0.091 | −0.091 | 0.007 |
| 2030 | 0.409 | 0.268 | 0.094 | −0.087 | 0.007 |
| 2035 | 0.399 | 0.281 | 0.097 | −0.083 | 0.008 |
| 2040 | 0.411 | 0.298 | 0.103 | −0.080 | 0.008 |
| 2045 | 0.394 | 0.305 | 0.108 | −0.077 | 0.009 |
| 2050 | 0.412 | 0.287 | 0.111 | −0.076 | 0.009 |
| Panel C: Public–Private Transfer Mix (PPM) | |||||
| 95% Lower Bound | |||||
| 2025 | 1.031 | 0.815 | 0.222 | −1.619 | −0.048 |
| 2030 | 1.024 | 0.817 | 0.224 | −1.316 | −0.047 |
| 2035 | 1.027 | 0.817 | 0.228 | −1.196 | −0.049 |
| 2040 | 1.024 | 0.816 | 0.234 | −1.111 | −0.053 |
| 2045 | 1.034 | 0.812 | 0.240 | −1.107 | −0.057 |
| 2050 | 1.029 | 0.814 | 0.244 | −1.122 | −0.060 |
| 80% Lower Bound | |||||
| 2025 | 1.031 | 0.815 | 0.222 | −1.619 | −0.048 |
| 2030 | 1.023 | 0.817 | 0.224 | −1.311 | −0.048 |
| 2035 | 1.025 | 0.817 | 0.229 | −1.183 | −0.050 |
| 2040 | 1.022 | 0.815 | 0.235 | −1.095 | −0.054 |
| 2045 | 1.031 | 0.812 | 0.242 | −1.089 | −0.058 |
| 2050 | 1.026 | 0.813 | 0.247 | −1.099 | −0.061 |
| Median | |||||
| 2025 | 1.031 | 0.815 | 0.222 | −1.617 | −0.048 |
| 2030 | 1.021 | 0.817 | 0.225 | −1.300 | −0.048 |
| 2035 | 1.022 | 0.817 | 0.230 | −1.161 | −0.051 |
| 2040 | 1.017 | 0.815 | 0.237 | −1.060 | −0.056 |
| 2045 | 1.026 | 0.811 | 0.245 | −1.036 | −0.061 |
| 2050 | 1.020 | 0.812 | 0.251 | −1.028 | −0.066 |
| 80% Upper Bound | |||||
| 2025 | 1.030 | 0.815 | 0.222 | −1.614 | −0.048 |
| 2030 | 1.020 | 0.817 | 0.226 | −1.281 | −0.049 |
| 2035 | 1.020 | 0.817 | 0.231 | −1.125 | −0.053 |
| 2040 | 1.013 | 0.814 | 0.239 | −1.012 | −0.059 |
| 2045 | 1.020 | 0.811 | 0.247 | −0.974 | −0.065 |
| 2050 | 1.014 | 0.812 | 0.254 | −0.949 | −0.072 |
| 95% Upper Bound | |||||
| 2025 | 1.030 | 0.815 | 0.222 | −1.612 | −0.048 |
| 2030 | 1.019 | 0.817 | 0.226 | −1.268 | −0.049 |
| 2035 | 1.018 | 0.816 | 0.232 | −1.105 | −0.054 |
| 2040 | 1.011 | 0.814 | 0.240 | −0.986 | −0.060 |
| 2045 | 1.018 | 0.810 | 0.249 | −0.941 | −0.068 |
| 2050 | 1.012 | 0.811 | 0.256 | −0.914 | −0.075 |
| Panel D: Relative Consumption Ratio (RCR) | |||||
| 95% Lower Bound | |||||
| 2025 | 1.376 | 0.929 | 0.915 | 1.313 | 0.842 |
| 2030 | 1.383 | 0.906 | 0.913 | 1.342 | 0.843 |
| 2035 | 1.346 | 0.913 | 0.907 | 1.335 | 0.842 |
| 2040 | 1.372 | 0.929 | 0.899 | 1.330 | 0.841 |
| 2045 | 1.340 | 0.924 | 0.890 | 1.315 | 0.841 |
| 2050 | 1.365 | 0.885 | 0.883 | 1.304 | 0.839 |
| 80% Lower Bound | |||||
| 2025 | 1.376 | 0.929 | 0.915 | 1.313 | 0.842 |
| 2030 | 1.384 | 0.905 | 0.913 | 1.343 | 0.843 |
| 2035 | 1.348 | 0.911 | 0.906 | 1.336 | 0.842 |
| 2040 | 1.375 | 0.927 | 0.898 | 1.331 | 0.841 |
| 2045 | 1.342 | 0.920 | 0.888 | 1.315 | 0.840 |
| 2050 | 1.369 | 0.878 | 0.880 | 1.304 | 0.839 |
| Median | |||||
| 2025 | 1.376 | 0.929 | 0.915 | 1.313 | 0.842 |
| 2030 | 1.385 | 0.903 | 0.912 | 1.343 | 0.842 |
| 2035 | 1.349 | 0.907 | 0.905 | 1.337 | 0.842 |
| 2040 | 1.378 | 0.920 | 0.895 | 1.331 | 0.840 |
| 2045 | 1.343 | 0.910 | 0.885 | 1.312 | 0.839 |
| 2050 | 1.372 | 0.862 | 0.875 | 1.300 | 0.837 |
| 80% Upper Bound | |||||
| 2025 | 1.376 | 0.928 | 0.914 | 1.313 | 0.842 |
| 2030 | 1.387 | 0.901 | 0.911 | 1.344 | 0.842 |
| 2035 | 1.350 | 0.903 | 0.903 | 1.337 | 0.841 |
| 2040 | 1.381 | 0.914 | 0.893 | 1.328 | 0.838 |
| 2045 | 1.340 | 0.899 | 0.881 | 1.306 | 0.837 |
| 2050 | 1.371 | 0.843 | 0.870 | 1.291 | 0.834 |
| 95% Upper Bound | |||||
| 2025 | 1.376 | 0.928 | 0.914 | 1.313 | 0.842 |
| 2030 | 1.387 | 0.900 | 0.910 | 1.344 | 0.842 |
| 2035 | 1.350 | 0.900 | 0.902 | 1.337 | 0.840 |
| 2040 | 1.382 | 0.909 | 0.892 | 1.327 | 0.838 |
| 2045 | 1.338 | 0.893 | 0.880 | 1.302 | 0.835 |
| 2050 | 1.370 | 0.835 | 0.868 | 1.284 | 0.832 |
| Panel E: Asset Funding Ratio (AFR) | |||||
| 95% Lower Bound | |||||
| 2025 | 0.516 | 0.270 | 0.351 | 0.909 | 1.449 |
| 2030 | 0.505 | 0.269 | 0.347 | 0.895 | 1.455 |
| 2035 | 0.511 | 0.257 | 0.340 | 0.888 | 1.448 |
| 2040 | 0.510 | 0.244 | 0.332 | 0.883 | 1.431 |
| 2045 | 0.521 | 0.232 | 0.325 | 0.883 | 1.416 |
| 2050 | 0.512 | 0.231 | 0.319 | 0.884 | 1.403 |
| 80% Lower Bound | |||||
| 2025 | 0.516 | 0.270 | 0.350 | 0.909 | 1.448 |
| 2030 | 0.504 | 0.269 | 0.346 | 0.895 | 1.453 |
| 2035 | 0.508 | 0.257 | 0.340 | 0.887 | 1.446 |
| 2040 | 0.507 | 0.243 | 0.330 | 0.882 | 1.428 |
| 2045 | 0.517 | 0.230 | 0.323 | 0.881 | 1.411 |
| 2050 | 0.508 | 0.229 | 0.317 | 0.882 | 1.396 |
| Median | |||||
| 2025 | 0.515 | 0.270 | 0.350 | 0.909 | 1.448 |
| 2030 | 0.501 | 0.268 | 0.346 | 0.894 | 1.450 |
| 2035 | 0.504 | 0.255 | 0.338 | 0.886 | 1.440 |
| 2040 | 0.499 | 0.240 | 0.328 | 0.879 | 1.418 |
| 2045 | 0.509 | 0.227 | 0.319 | 0.878 | 1.397 |
| 2050 | 0.499 | 0.226 | 0.312 | 0.877 | 1.378 |
| 80% Upper Bound | |||||
| 2025 | 0.515 | 0.270 | 0.350 | 0.909 | 1.447 |
| 2030 | 0.499 | 0.267 | 0.345 | 0.893 | 1.447 |
| 2035 | 0.499 | 0.253 | 0.337 | 0.884 | 1.432 |
| 2040 | 0.492 | 0.238 | 0.326 | 0.876 | 1.406 |
| 2045 | 0.501 | 0.224 | 0.316 | 0.873 | 1.380 |
| 2050 | 0.490 | 0.223 | 0.308 | 0.871 | 1.355 |
| 95% Upper Bound | |||||
| 2025 | 0.515 | 0.270 | 0.350 | 0.908 | 1.447 |
| 2030 | 0.498 | 0.266 | 0.344 | 0.892 | 1.444 |
| 2035 | 0.497 | 0.252 | 0.336 | 0.882 | 1.427 |
| 2040 | 0.488 | 0.237 | 0.324 | 0.874 | 1.399 |
| 2045 | 0.497 | 0.223 | 0.314 | 0.871 | 1.370 |
| 2050 | 0.486 | 0.222 | 0.305 | 0.868 | 1.344 |
Appendix A.3. Backcast Validation of the Fixed-Profile Projection Framework
- Objective and Scope
This appendix assesses the internal validity of the fixed-profile projection framework (Section 4.3.1) for South Korea. Per-capita NTA profiles are fixed at 2010, the earliest available National Transfer Accounts Network, WPP 2024 historical population estimates are applied for 2010–2024, and the five SAFE indicators are computed for each year. Projected 2023 values are compared against observed 2023 values derived from the 2023 NTA profiles, isolating the demographic contribution from profile drift due to economic and policy changes over the period.
- Data and Method
Per-capita NTA profiles for South Korea at 2010 were obtained from National Transfer Accounts Network and cover single years of age 0–99 across five components: labor income (YL), net public transfers (TGnet), net private transfers (TFnet), asset-based reallocations (RA), and consumption (C). Fixed-profile aggregate projections for 2011–2024 were computed as
where is the 2010 per-capita value at single age a and is the WPP 2024 Median population estimate at age a in year t. A consistency check confirmed that exactly for all ages and NTA components, verifying correct implementation.
SAFE indicators were computed from the projected aggregates following the formulas in Table A1. Age-group per-capita values required for BGR and RCR were obtained as population-weighted means:
- Results
Table A1.
SAFE Indicators for South Korea: Backcast vs. Observed, 2010–2023.
Three implications follow for the forward projections in Section 5.
First, the projection engine is internally consistent: the consistency check confirms that Level 1 aggregate trajectories track population change exactly.
Second, profile drift accumulates over time. The 13-year horizon (2010–2023) spans a period of substantial pension expansion (evidenced by the PPM profile drift of 0.152) and rapid nominal wage growth that together amplify profile-change effects relative to shorter horizons. Forward projections from 2023 begin from a more mature baseline: the National Pension Scheme has now operated for 35 years, with benefit entitlements more fully accumulated, reducing the rate of further PPM drift. Whether nominal wage growth also moderates post-2023 cannot be established from current data, but the pension-maturation effect alone justifies greater confidence in the 2023 baseline relative to 2010.
Third, the typological conclusions in Section 5 are robust. The 2023 observed values (FSR 5.271, BGR 0.274, PPM 0.816, RCR 0.933, AFR 0.269) anchoring the forward projections derive from observed NTA data, not from the fixed-profile model. Profile drift widens uncertainty around projected trajectories but does not alter the baseline positions from which they originate, nor the qualitative direction of demographic pressure.
References
- Aaron, H. (1966). The social insurance paradox. Canadian Journal of Economics and Political Science, 32(3), 371–374. [Google Scholar] [CrossRef] [Scilit] [PubMed]
- Asher, M. G., & Zen, F. (2015). Social protection in ASEAN: Challenges and initiatives for Post-2015. ERIA. [Google Scholar]
- Barr, N., & Diamond, P. (2008). Reforming pensions: Principles and policy choices. Oxford University Press. [Google Scholar] [CrossRef] [Scilit]
- Barr, N., & Diamond, P. (2009). Pension reform: A short guide. Oxford University Press. [Google Scholar] [CrossRef] [Scilit]
- Bloom, D. E., Canning, D., & Fink, G. (2010). Implications of population ageing for economic growth. Oxford Review of Economic Policy, 26(4), 583–612. [Google Scholar] [CrossRef] [Scilit]
- Bloom, D. E., Chatterji, S., Kowal, P., Lloyd-Sherlock, P., McKee, M., Rechel, B., Rosenberg, L., & Smith, J. P. (2015). Macroeconomic implications of population ageing and selected policy responses. The Lancet, 385(9968), 649–657. [Google Scholar] [CrossRef] [Scilit] [PubMed]
- Bloom, D. E., & Williamson, J. G. (1998). Demographic transitions and economic miracles in emerging Asia. The World Bank Economic Review, 12(3), 419–455. [Google Scholar] [CrossRef] [Scilit]
- Bongaarts, J. (2004). Population aging and the rising cost of public pensions. Population and Development Review, 30(1), 1–23. [Google Scholar] [CrossRef] [Scilit]
- Colombo, F., Llena-Nozal, A., Mercier, J., & Tjadens, F. (2011). Help wanted? Providing and paying for long-term care. OECD. [Google Scholar] [CrossRef] [Scilit]
- Cutler, D. M., Poterba, J. M., Sheiner, L. M., Summers, L. H., & Akerlof, G. A. (1990). An aging society: Opportunity or challenge? Brookings Papers on Economic Activity, 1990(1), 1. [Google Scholar] [CrossRef] [Scilit]
- Deaton, A. (2003). Health, inequality, and economic development. Journal of Economic Literature, 41(1), 113–158. [Google Scholar] [CrossRef] [Scilit]
- Department of Older Persons. (2026). การรับเบี้ยผู้สูงอายุ [Old age allowance]. Available online: https://www.dop.go.th/enai/faq/view=967 (accessed on 22 June 2026).
- Diamond, P. A. (1965). National debt in a neoclassical growth model. JSTOR. [Google Scholar]
- Esping-Andersen, G. (1990). The three worlds of welfare capitalism. Princeton University Press. [Google Scholar]
- European Commission. (2018). The 2018 pension adequacy report: Current and future income adequacy in old age in the EU (Vol. I). Publications Office of the European Union. [Google Scholar]
- Gough, I., Wood, G., Barrientos, A., Bevan, P., Davis, P., & Room, G. (2004). Insecurity and welfare regimes in Asia, Africa and Latin America. Cambridge University Press. [Google Scholar] [CrossRef] [Scilit]
- Gruber, J., & Wise, D. A. (1999). Social security and retirement around the world. University of Chicago Press. [Google Scholar]
- Hermalin, A. (2002). The well-being of the elderly in Asia. University of Michigan Press. [Google Scholar] [CrossRef] [Scilit]
- Holliday, I. (2000). Productivist welfare capitalism: Social policy in East Asia. Political Studies, 48(4), 706–723. [Google Scholar] [CrossRef] [Scilit]
- Holzmann, R., Hinz, R. P., & von Gersdorff, H. (2005). Old-age income support in the 21st century: An international perspective on pension systems and reform. World Bank. [Google Scholar]
- International Labour Organization. (2012). Recommendation concerning national floors of social protection (No. 202). Available online: https://normlex.ilo.org/dyn/nrmlx_en/f?p=NORMLEXPUB:12100:0::NO::P12100_INSTRUMENT_ID:3065524 (accessed on 15 May 2026).
- International Labour Organization. (2021). World social protection report 2020–22: Social protection at the crossroads-in pursuit of a better future. International Labour Organisation (ILO). [Google Scholar]
- Japan National Institute of Population and Social Security Research. (n.d.). National transfer accounts reports. National Institute of Population and Social Security Research.
- Kim, H. K., & Lee, S. H. (2025). Population aging, living arrangements, and inequality: The role of familial transfers in South Korea. The Journal of the Economics of Ageing, 31, 100577. [Google Scholar] [CrossRef] [Scilit]
- Kim, Y., & Woo, K. (2025). The bill of aging: Fiscal projections of demographic changes on South Korea’s national health insurance, 2023–2042. Health Economics Review, 15(1), 97. [Google Scholar] [CrossRef] [Scilit] [PubMed]
- Knodel, J., & Chayovan, N. (2009). Older persons in Thailand: A demographic, social and economic profile. Ageing International, 33(1–4), 3–14. [Google Scholar] [CrossRef] [Scilit]
- Kwon, H. (2005). Transforming the developmental welfare state in East Asia. Development and Change, 36(3), 477–497. [Google Scholar] [CrossRef] [Scilit]
- La Porta, R., & Shleifer, A. (2014). Informality and development. Journal of Economic Perspectives, 28(3), 109–126. [Google Scholar] [CrossRef] [Scilit]
- Lee, R., & Mason, A. (2006). What is the demographic dividend? (Vol. 43). Available online: https://www.imf.org/external/pubs/ft/fandd/2006/09/basics.htm (accessed on 5 May 2026).
- Lee, R. D. (2000). Intergenerational transfers and the economic life cycle: A cross-cultural perspective. In Sharing the wealth (pp. 17–56). Oxford University Press. [Google Scholar] [CrossRef] [Scilit]
- Lee, R. D., & Mason, A. (2011). Population aging and the generational economy: A global perspective. Edward Elgar. [Google Scholar]
- Mason, A. (2005). Demographic transition and demographic dividends in developed and developing countries. In United Nations expert group meeting on social and economic implications of changing population age structures (pp. 81–101). United Nations. [Google Scholar]
- Mason, A., & Lee, R. (2007). Transfers, capital and consumption over the demographic transition. In Population aging, intergenerational transfers and the macroeconomy. Edward Elgar Publishing. [Google Scholar] [CrossRef] [Scilit]
- Mason, A., Lee, R., Tung, A.-C., Lai, M.-S., & Miller, T. (2009). Population aging and intergenerational transfers. In Developments in the economics of aging (pp. 89–122). University of Chicago Press. [Google Scholar] [CrossRef] [Scilit]
- Maulana, N., Soewondo, P., Adani, N., Limasalle, P., & Pattnaik, A. (2022). How Jaminan Kesehatan Nasional (JKN) coverage influences out-of-pocket (OOP) payments by vulnerable populations in Indonesia. PLoS Global Public Health, 2(7), e0000203. [Google Scholar] [CrossRef] [Scilit] [PubMed]
- Miller, T. (2011). The rise of the intergenerational state: Aging and development. In Population aging and the generational economy. Edward Elgar Publishing. [Google Scholar] [CrossRef] [Scilit]
- Ministry of Data and Statistics. (n.d.). National transfer accounts and demographic statistics. Available online: https://mods.go.kr/menu.es?mid=a20210040000 (accessed on 27 May 2026).
- National Economic and Social Development Council. (n.d.). National accounts of Thailand. Available online: https://www.nesdc.go.th/en/info/national-accounts/ (accessed on 27 May 2026).
- National Transfer Accounts Network. (n.d.-a). Indonesia. Available online: https://www.ntaccounts.org/web/nta/show (accessed on 27 May 2026).
- National Transfer Accounts Network. (n.d.-b). Philippines. Available online: https://www.ntaccounts.org/web/nta/show (accessed on 27 May 2026).
- OECD. (2023). Pensions at a glance 2023. OECD Publishing. [Google Scholar] [CrossRef] [Scilit]
- OECD. (2024). Pensions at a glance Asia/Pacific 2024. OECD. [Google Scholar] [CrossRef] [Scilit]
- Ogawa, N., Mason, A., Chawla, A., & Matsukura, R. (2010). Japan’s unprecedented aging and changing intergenerational transfers. In The economic consequences of demographic change in East Asia (pp. 131–160). University of Chicago Press. [Google Scholar] [CrossRef] [Scilit][Green Version]
- Ogawa, N., Matsukura, R., & Chawla, A. (2011). The elderly as latent assets in aging Japan. In R. Lee, & A. Mason (Eds.), Population aging and the generational economy: A global perspective (pp. 475–487). Edward Elgar Publishing. [Google Scholar]
- Orbeta, A. C., Jr. (2011). Social protection in the Philippines: Current state and challenges. Available online: http://www.pids.gov.ph (accessed on 2 May 2026).
- Pisani, E., Olivier Kok, M., & Nugroho, K. (2017). Indonesia’s road to universal health coverage: A political journey. Health Policy and Planning, 32, 267–276. [Google Scholar] [CrossRef] [Scilit] [PubMed]
- Prskawetz, A., & Sambt, J. (2014). Economic support ratios and the demographic dividend in Europe. Demographic Research, 30, 963–1010. [Google Scholar] [CrossRef] [Scilit]
- Racelis, R. H., Abrigo, M. R. M., & Salas, J. M. I. (2015). Financing consumption over the lifecycle and overseas workers’ remittances: Findings from the 1999 and 2007 Philippine national transfer accounts. The Journal of the Economics of Ageing, 5, 69–78. [Google Scholar] [CrossRef] [Scilit]
- Raftery, A. E., Alkema, L., & Gerland, P. (2014). Bayesian population projections for the United Nations. Statistical Science, 29(1), 58–68. [Google Scholar] [CrossRef] [Scilit] [PubMed]
- Sambt, J., Hammer, B., & Istenič, T. (2021). The European national transfer accounts: Data and applications. Economic and Business Review, 23(3), 184–193. [Google Scholar] [CrossRef] [Scilit]
- Samuelson, P. A. (1958). An exact consumption-loan model of interest with or without the social contrivance of money. Journal of Political Economy, 66(6), 467–482. [Google Scholar] [CrossRef] [Scilit]
- Spielauer, M., Horvath, T., Fink, M., Abio, G., Souto, G., Patxot, C., & Istenič, T. (2023). The effect of educational expansion and family change on the sustainability of public and private transfers. The Journal of the Economics of Ageing, 25, 100455. [Google Scholar] [CrossRef] [Scilit]
- Tangcharoensathien, V., Patcharanarumol, W., Ir, P., Aljunid, S. M., Mukti, A. G., Akkhavong, K., Banzon, E., Huong, D. B., Thabrany, H., & Mills, A. (2011). Health-financing reforms in southeast Asia: Challenges in achieving universal coverage. The Lancet, 377(9768), 863–873. [Google Scholar] [CrossRef] [Scilit] [PubMed]
- Teerawichitchainan, B., & Pothisiri, W. (2021). Expansion of Thailand’s social pension policy and its implications for family support for older persons. International Journal of Social Welfare, 30(4), 428–442. [Google Scholar] [CrossRef] [Scilit]
- United Nations. (2013). National transfer accounts manual: Measuring and analysing the generational economy. United Nations. [Google Scholar]
- United Nations. (2024). World population prospects 2024: Summary of results. Department of Economic and Social Affairs Population Division. [Google Scholar]
- World Bank. (2008). The World Bank pension conceptual framework background. Available online: https://openknowledge.worldbank.org/entities/publication/17e9d04b-0936-5cfa-8d6e-3cf3bc208b50 (accessed on 2 May 2026).
- World Bank. (2016). Live long and prosper: Aging in east Asia and Pacific. World Bank Group. [Google Scholar] [CrossRef] [Scilit]
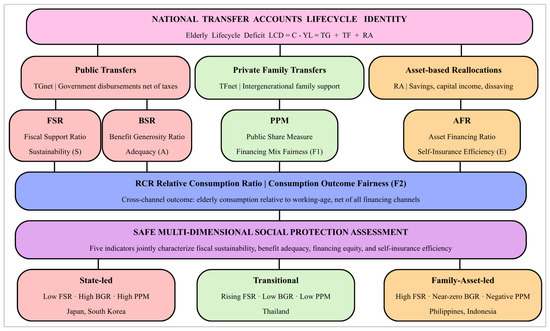
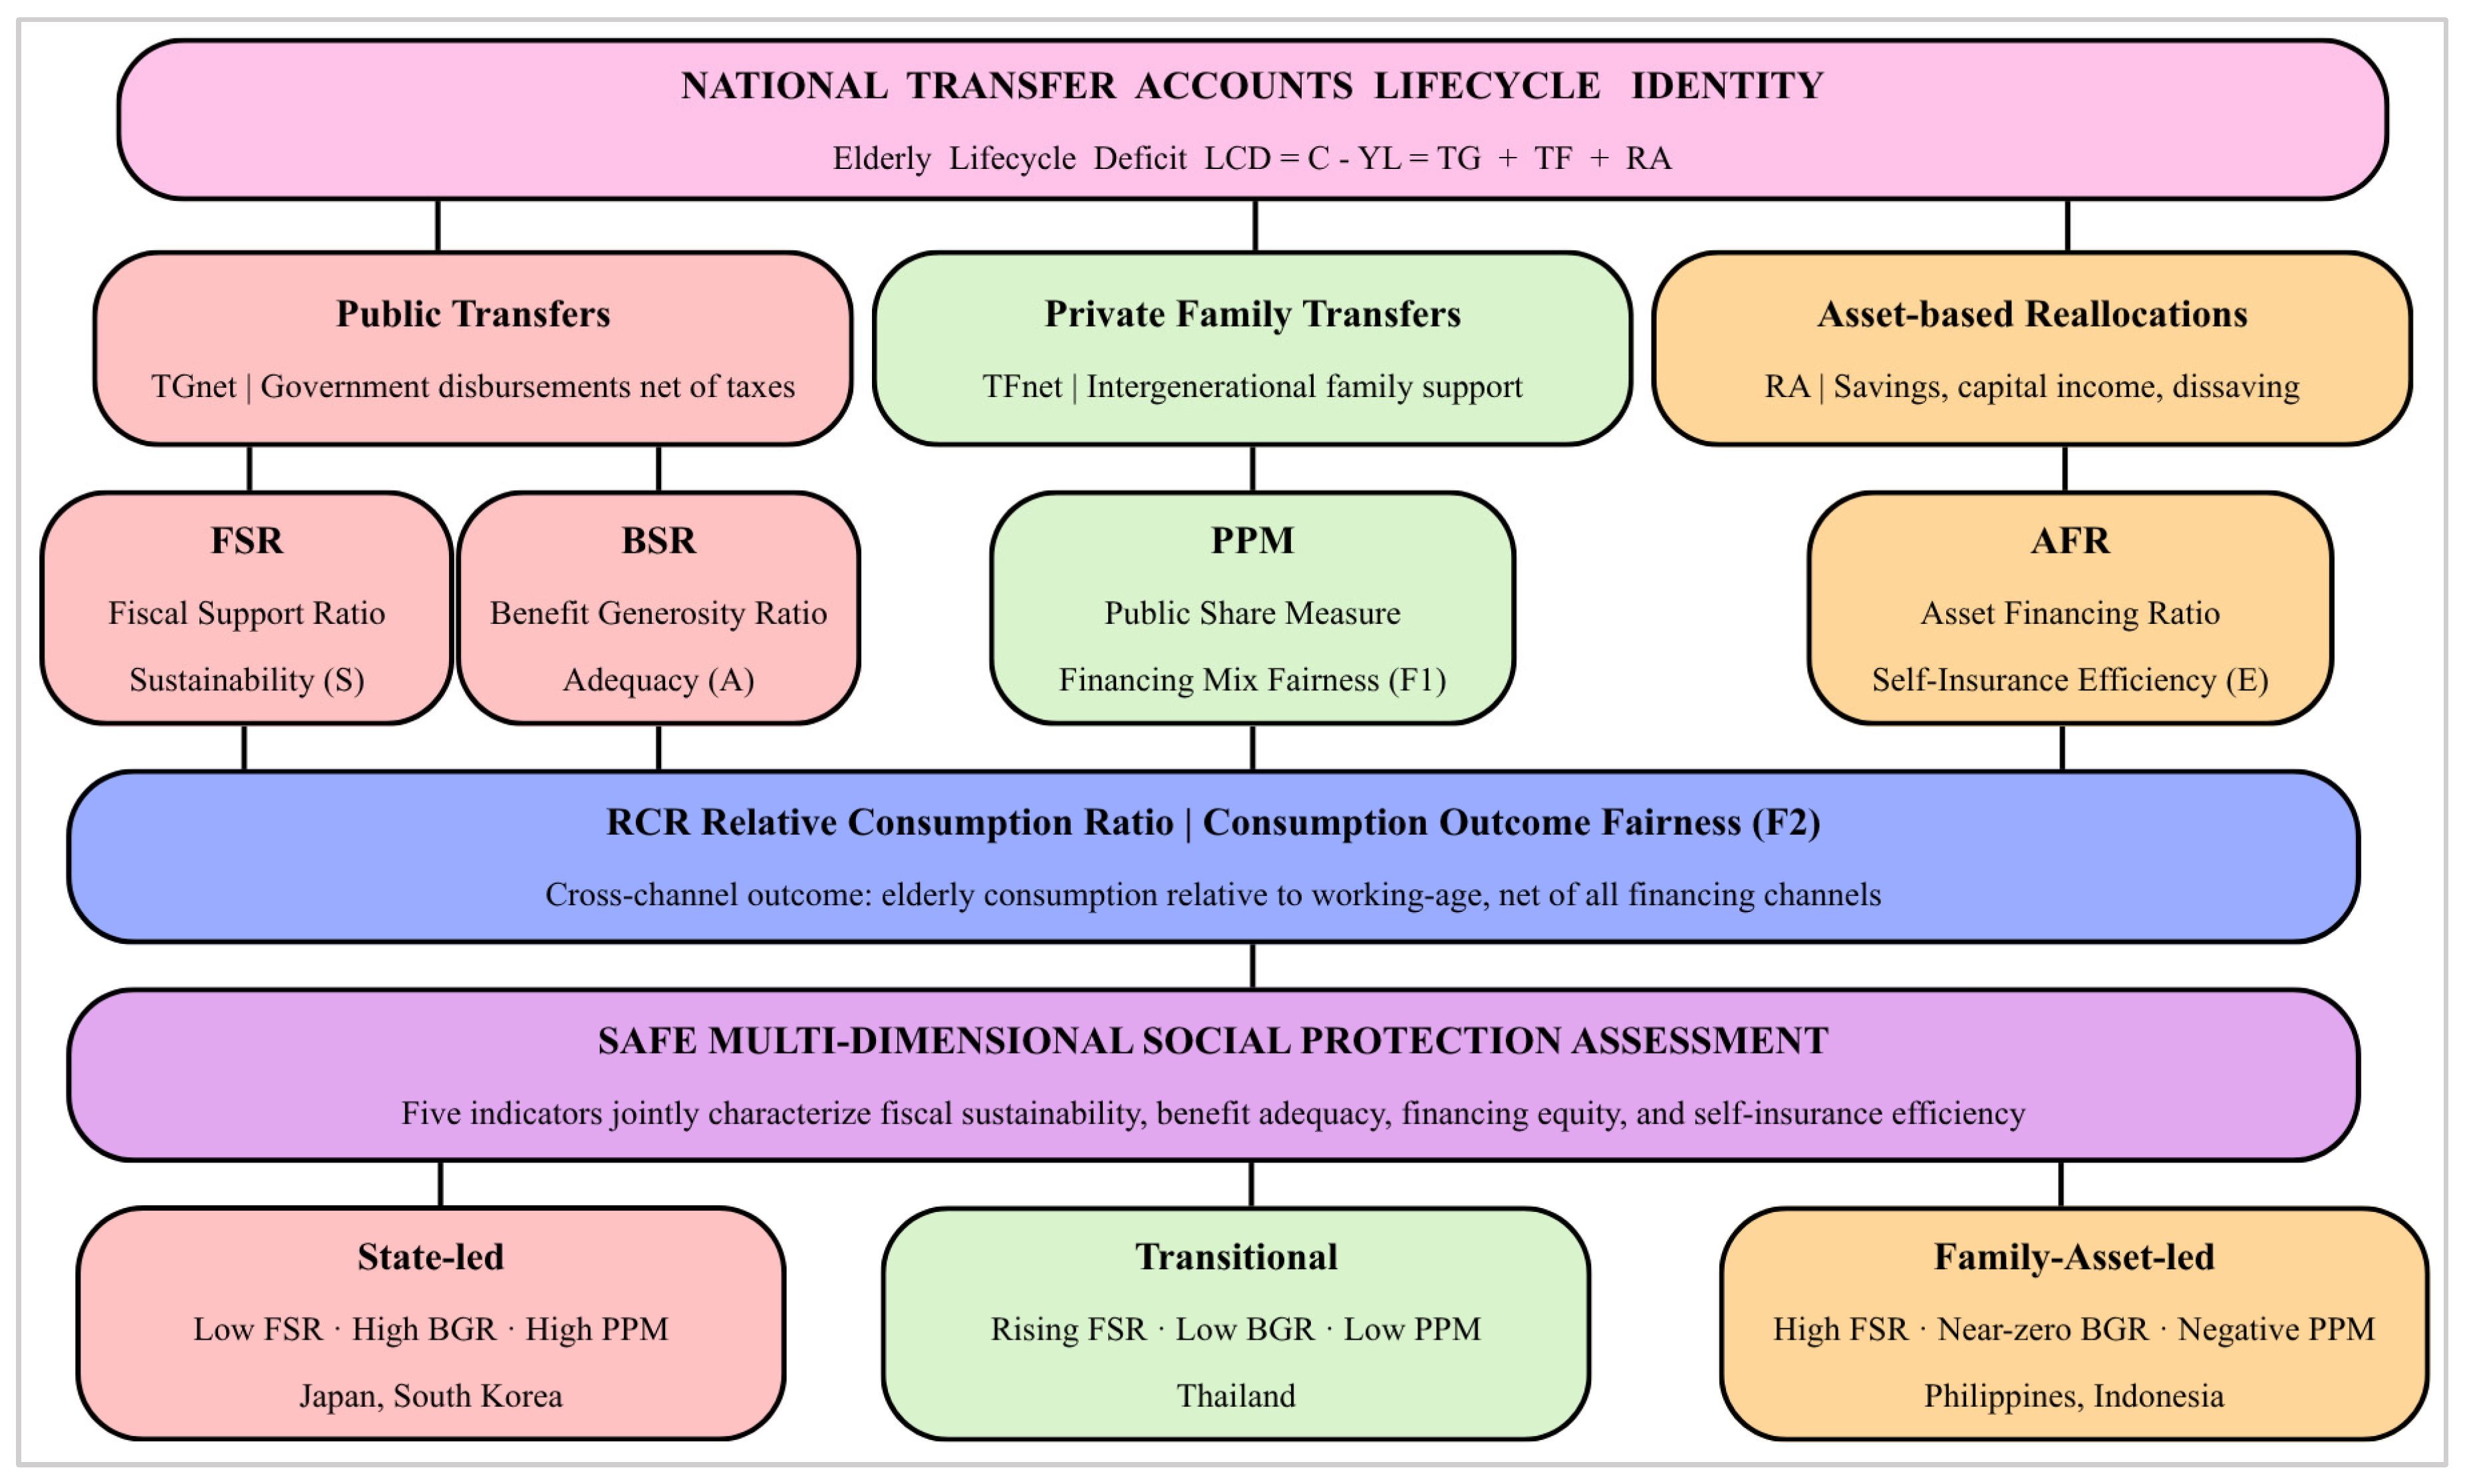
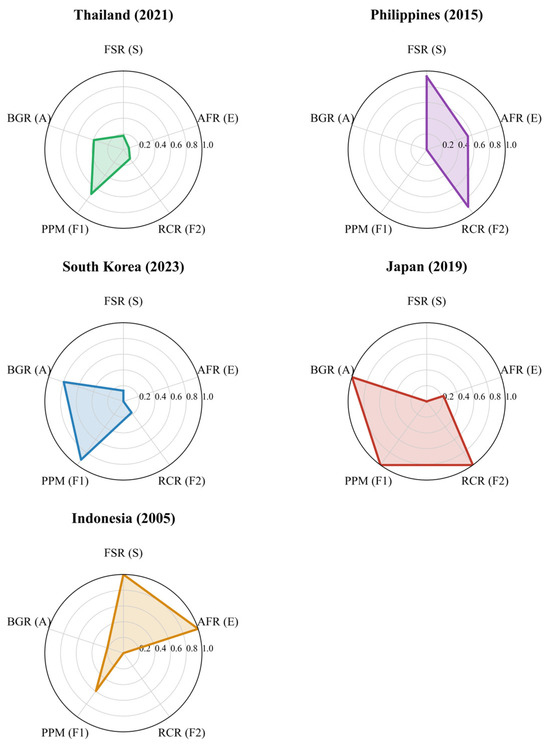
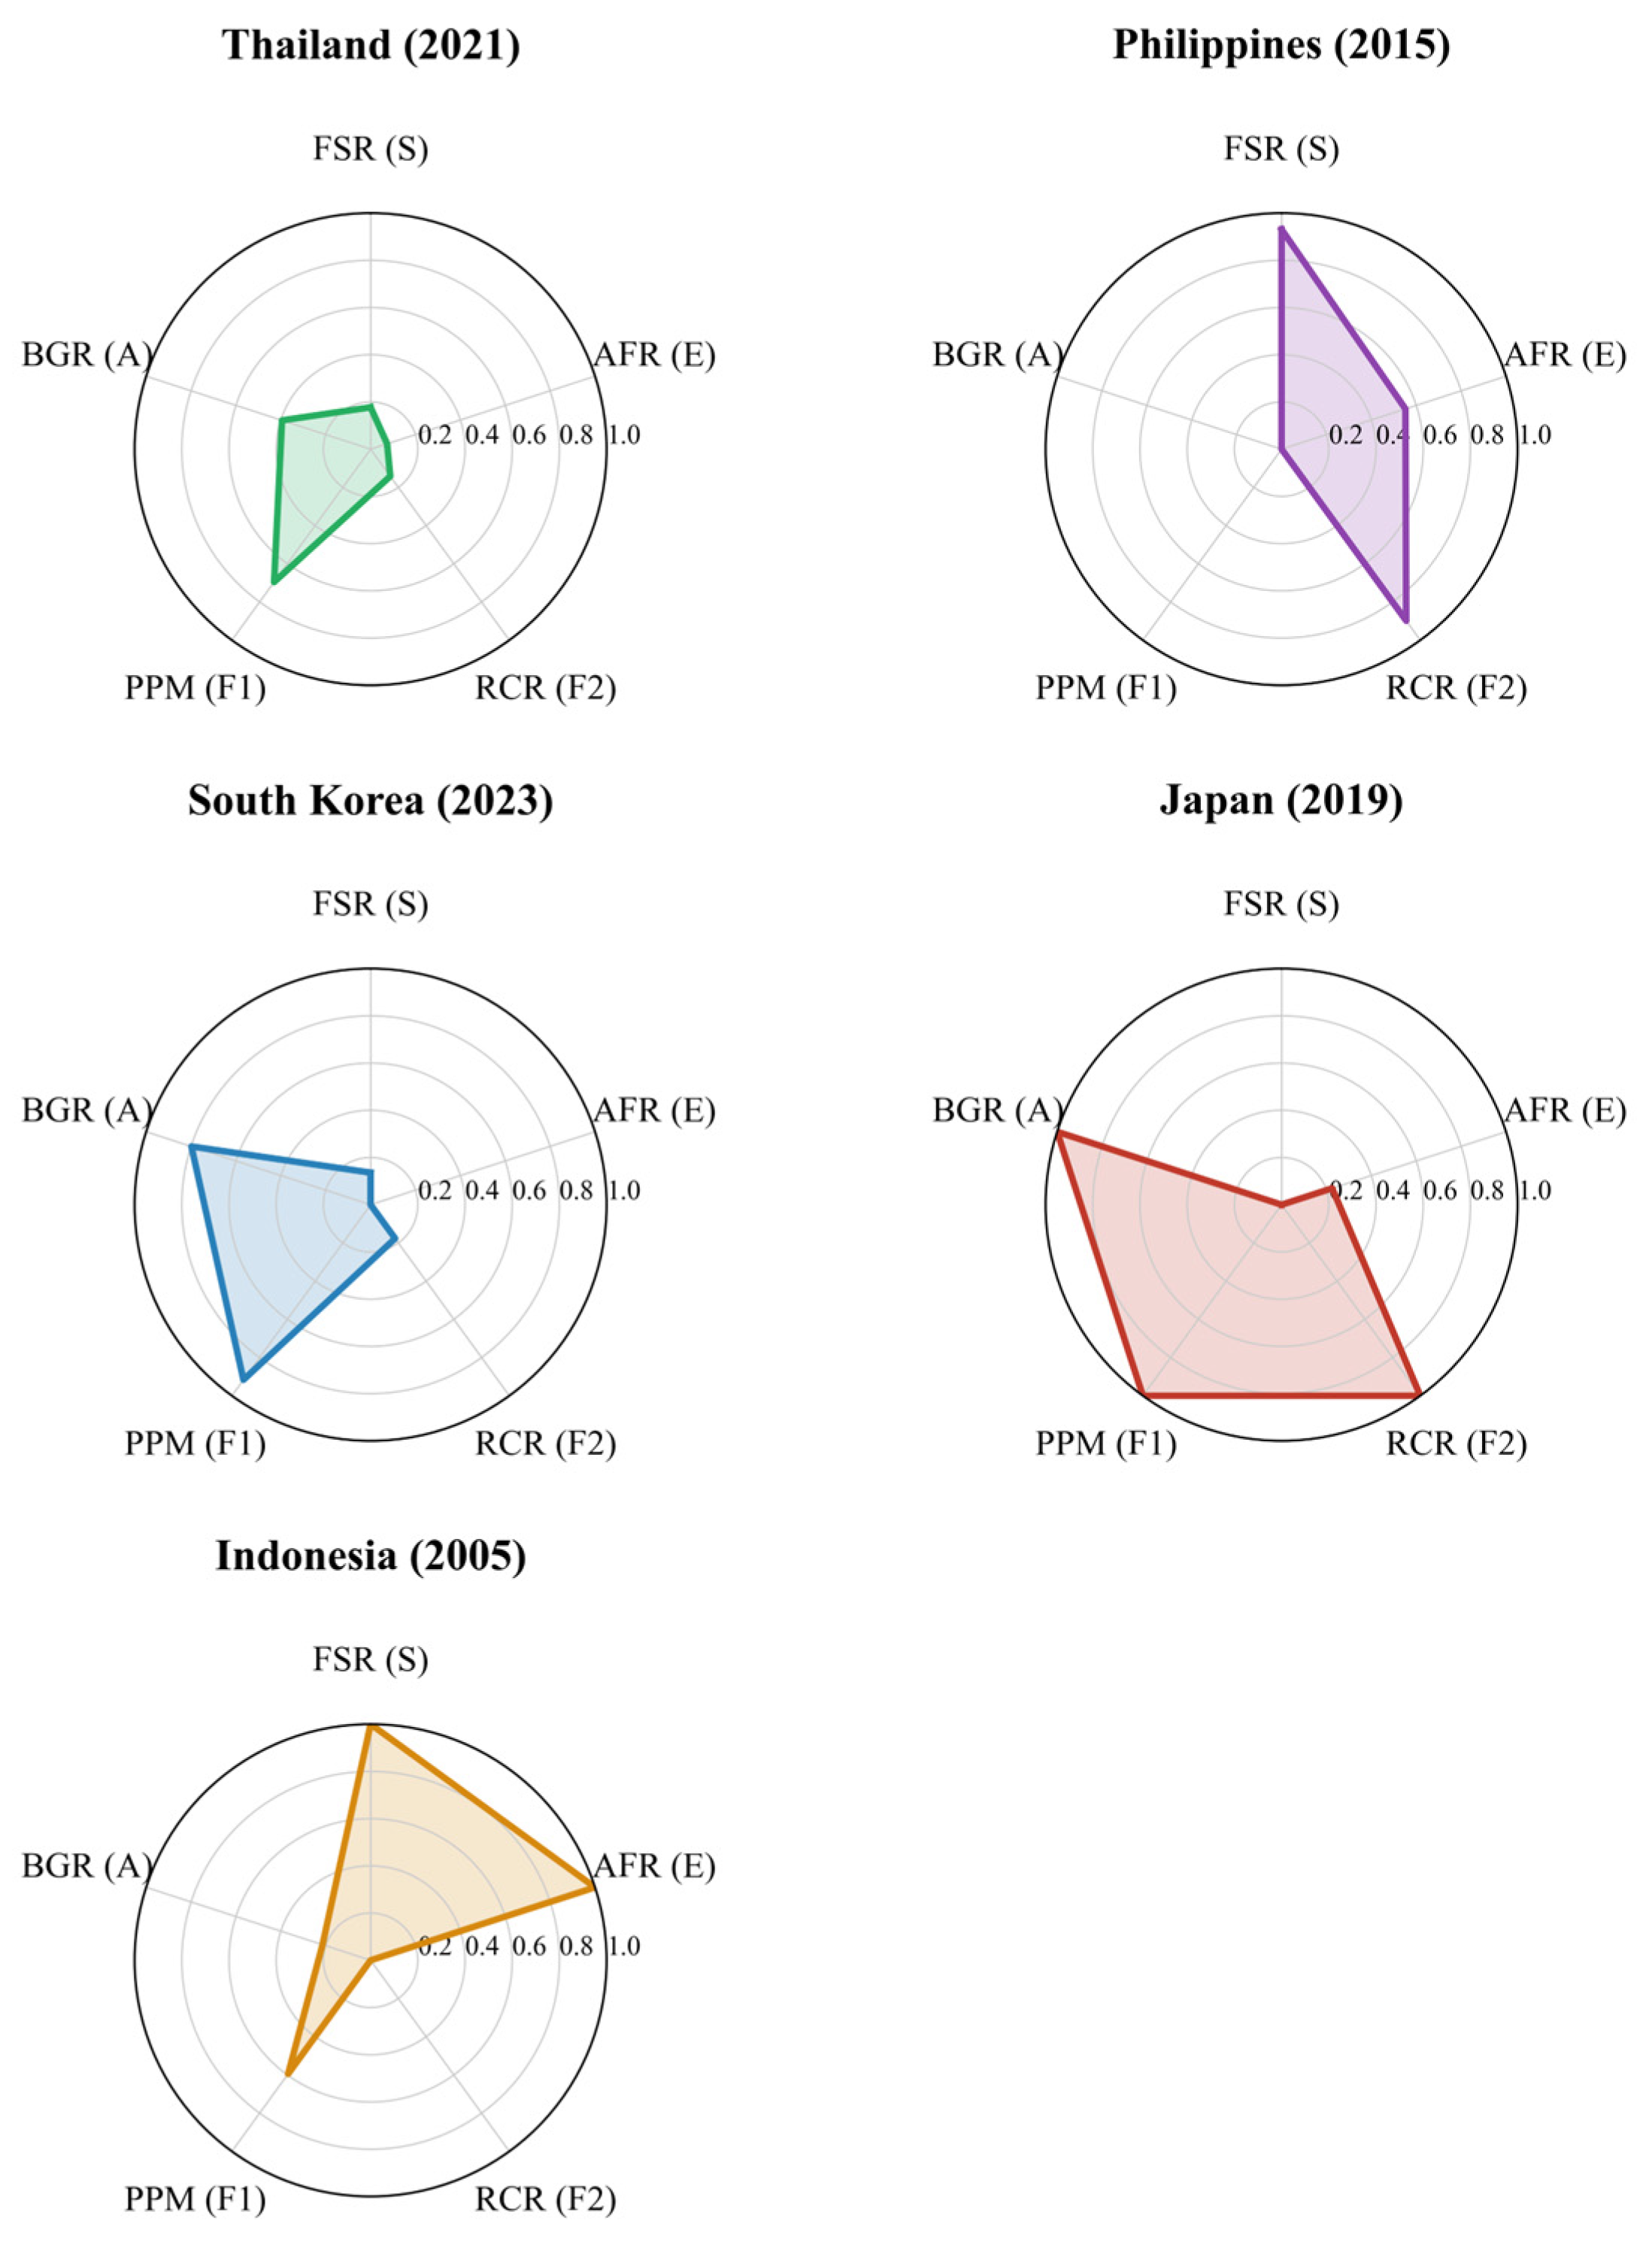
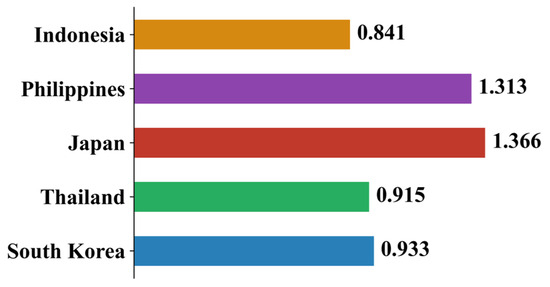
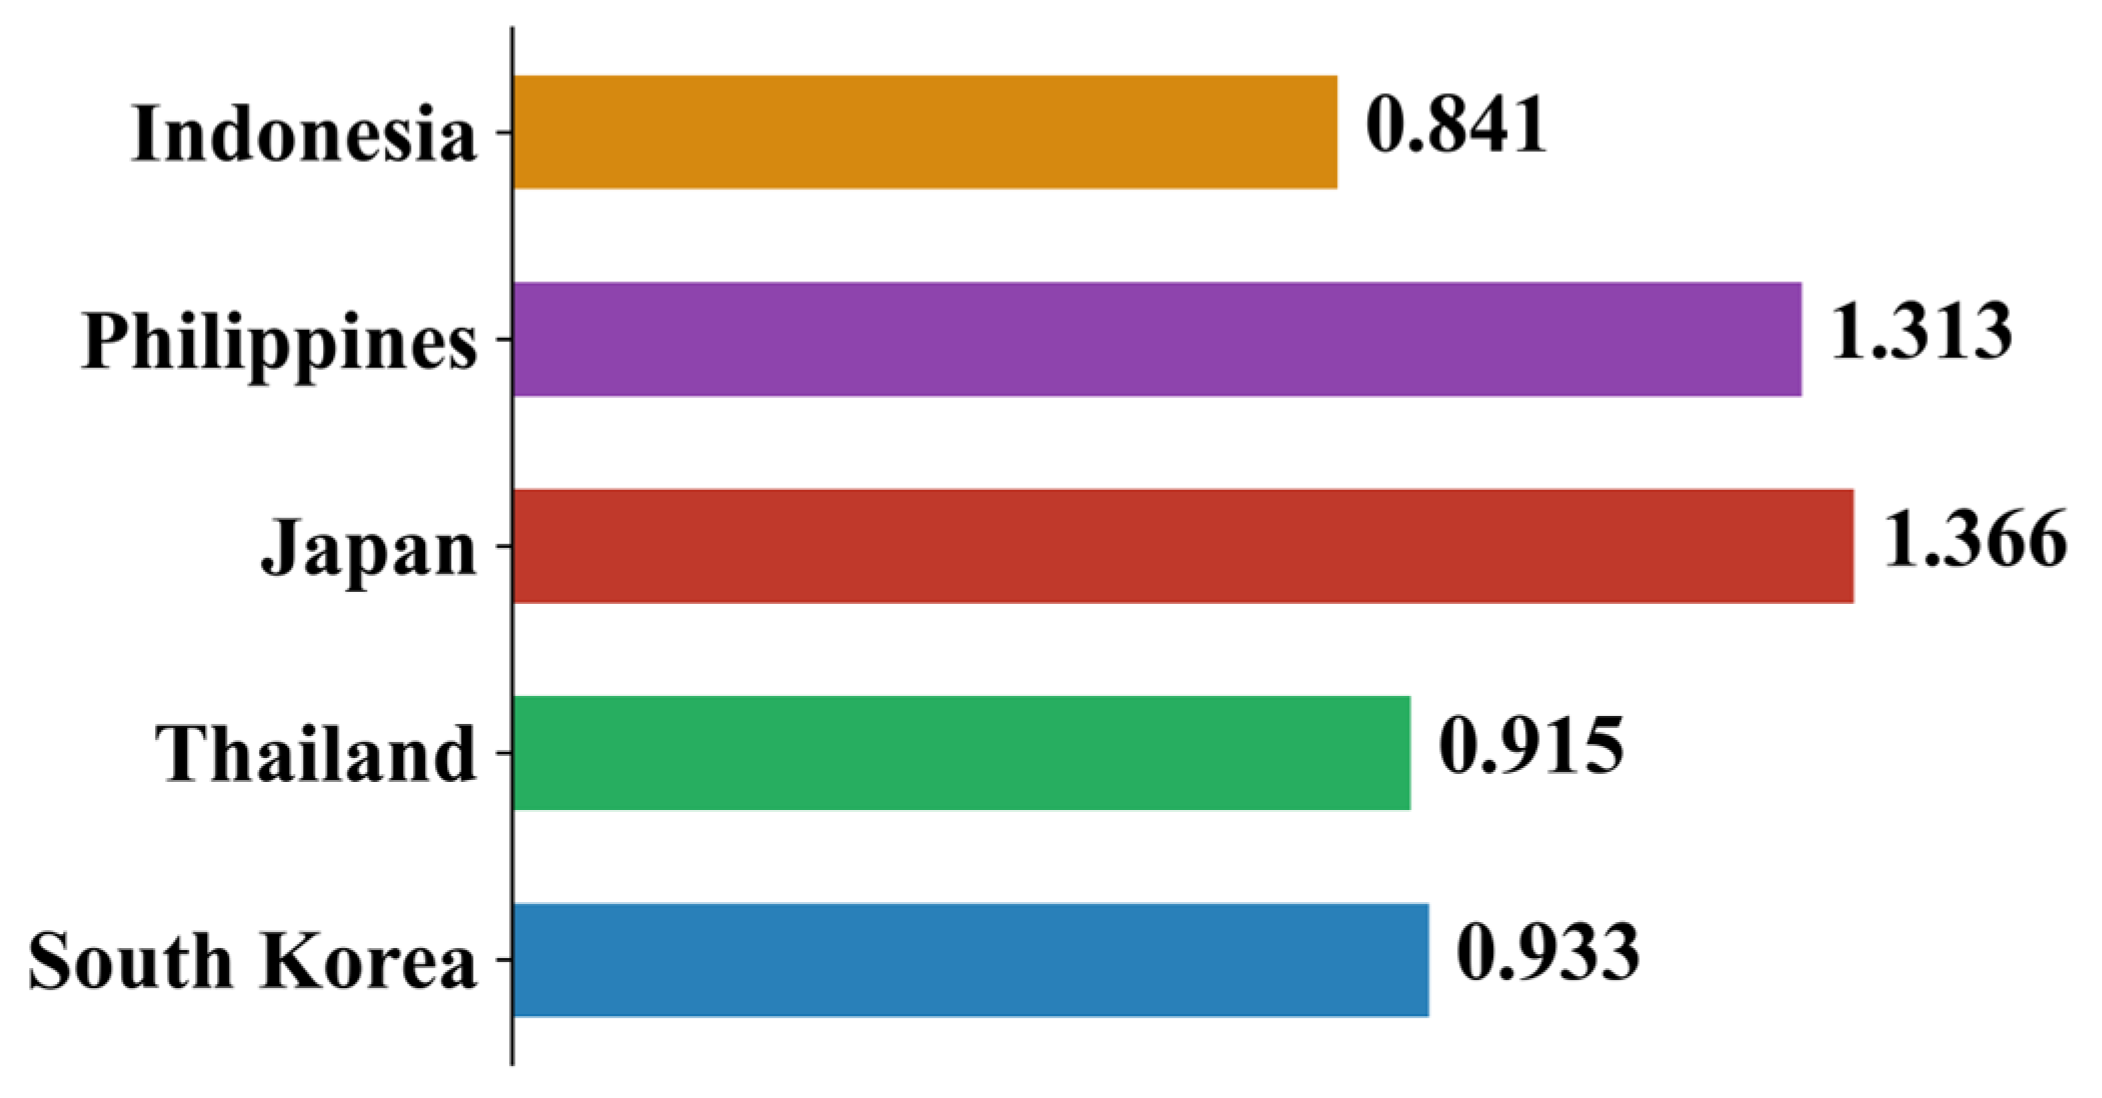
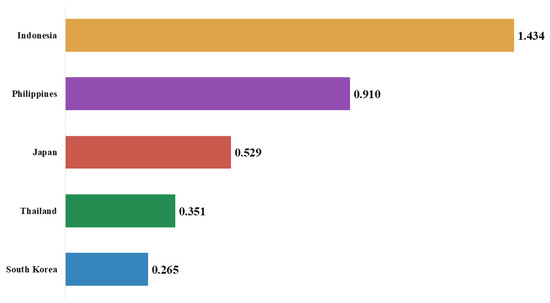
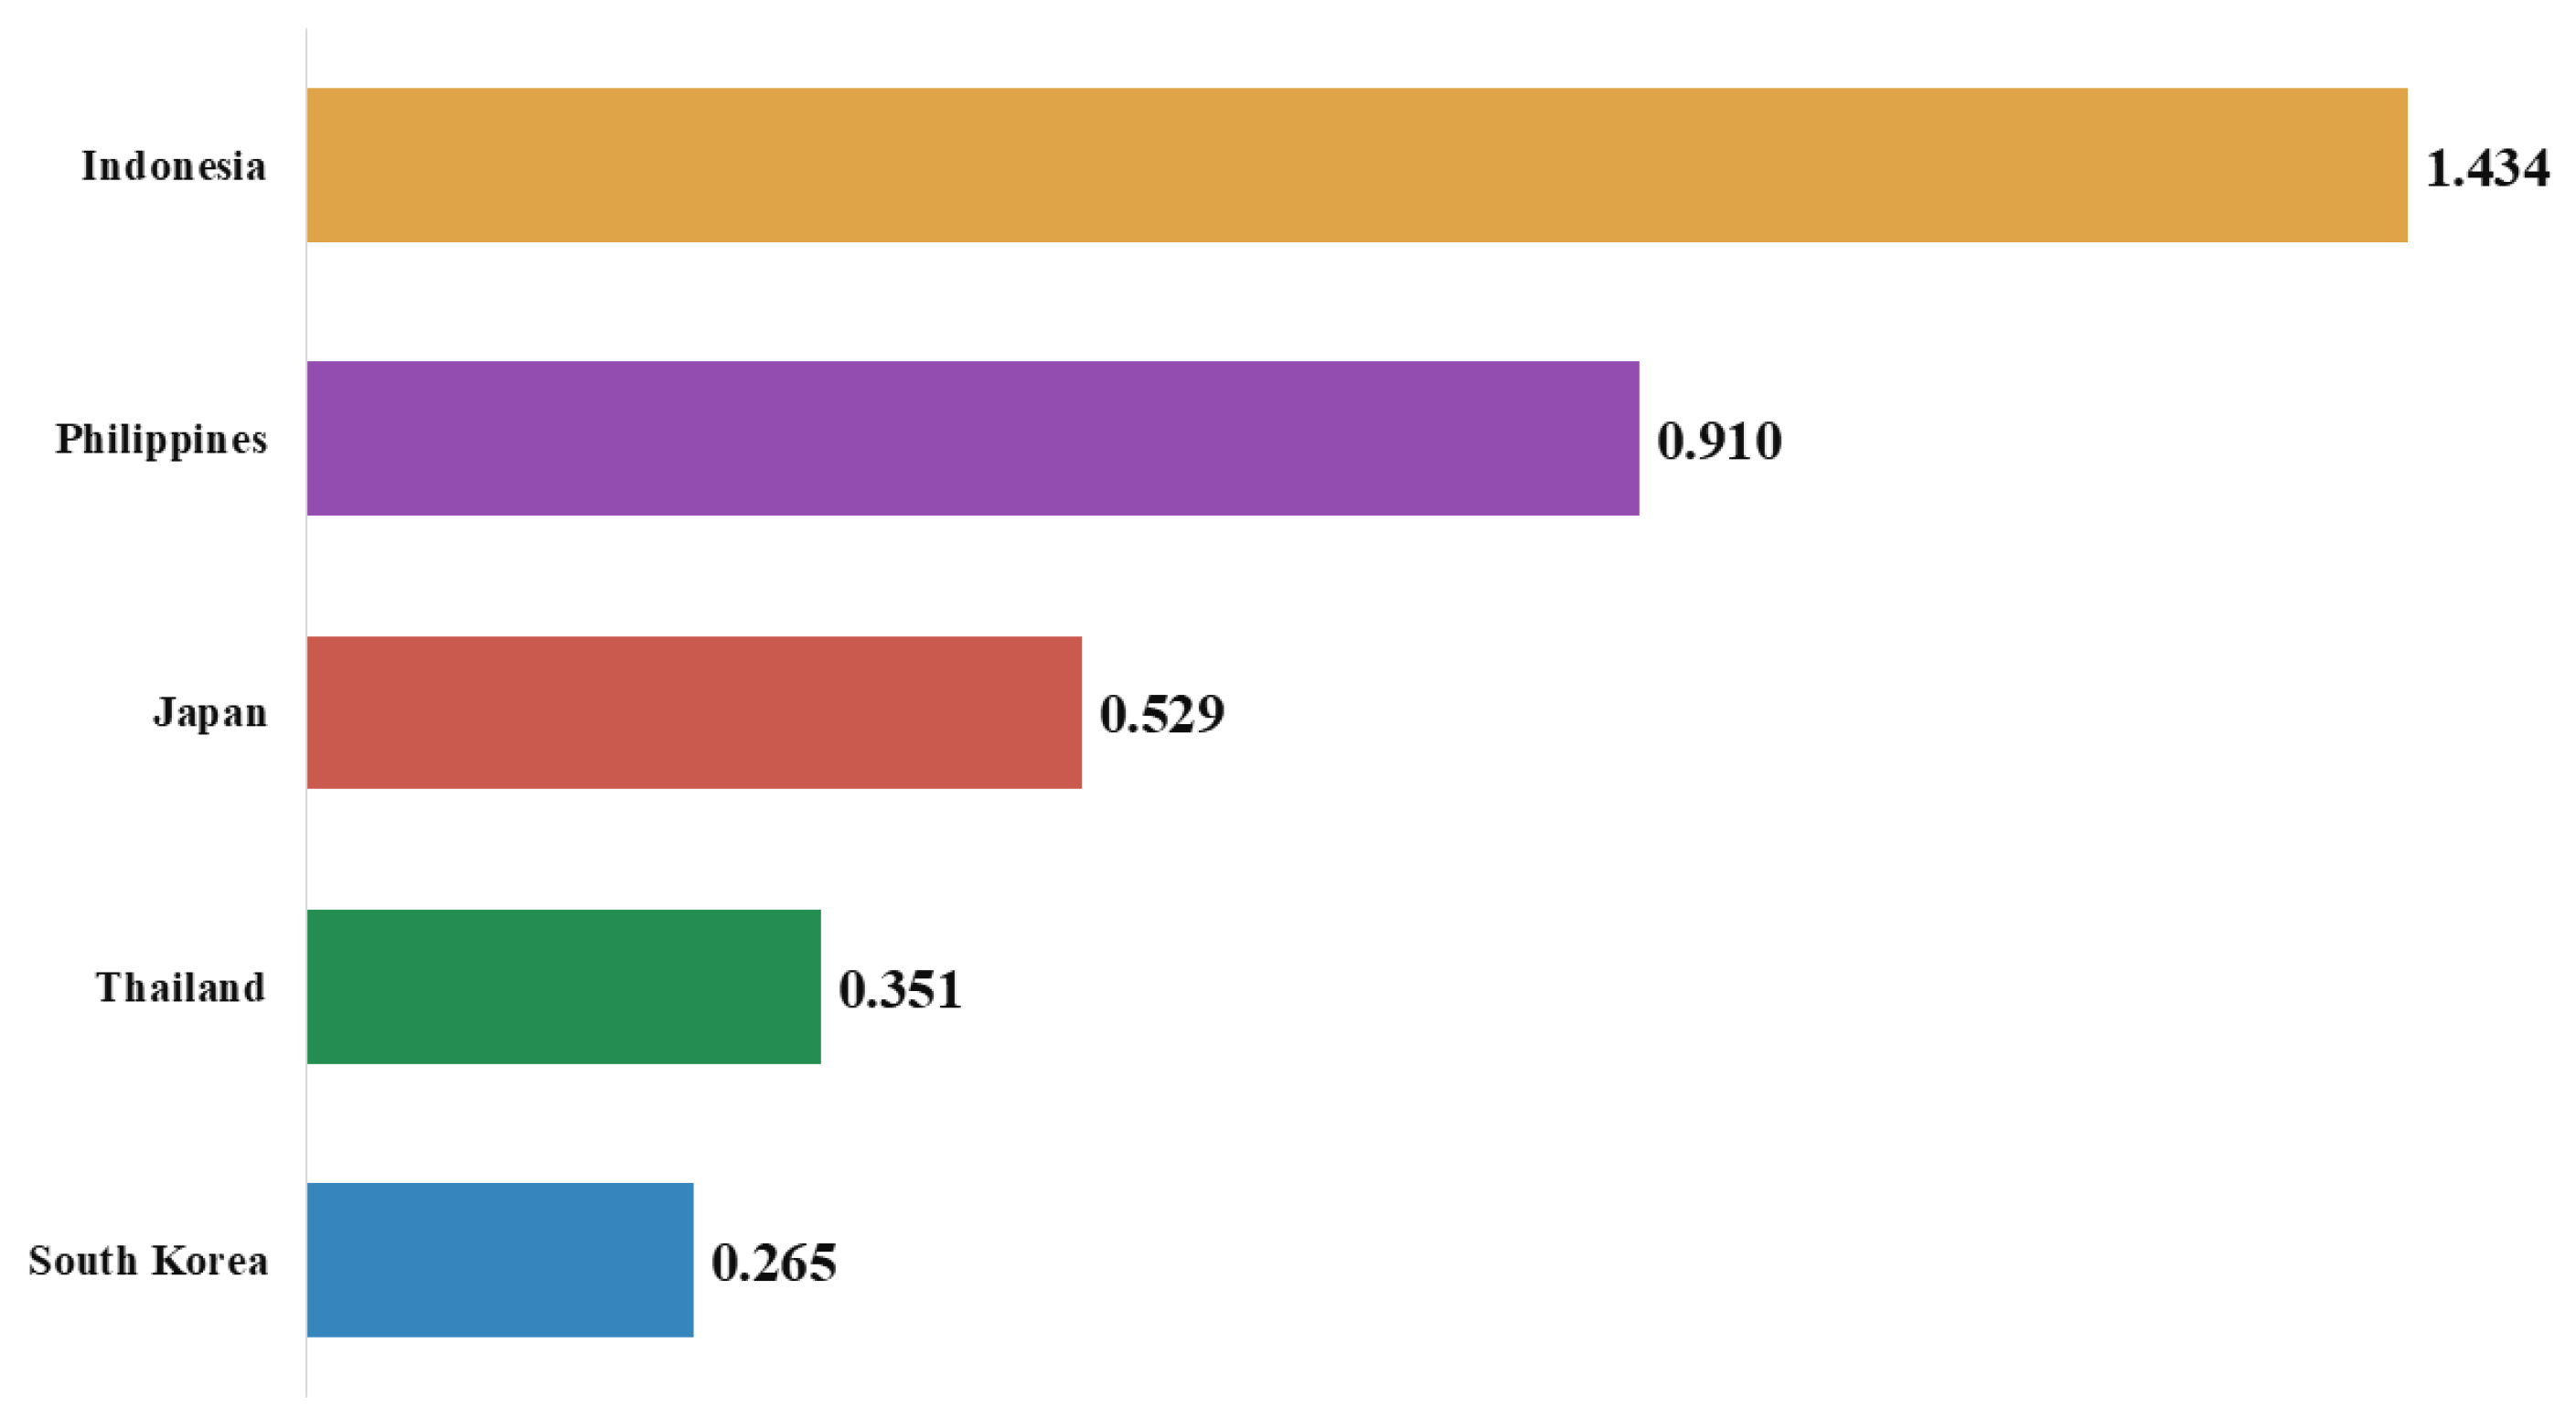
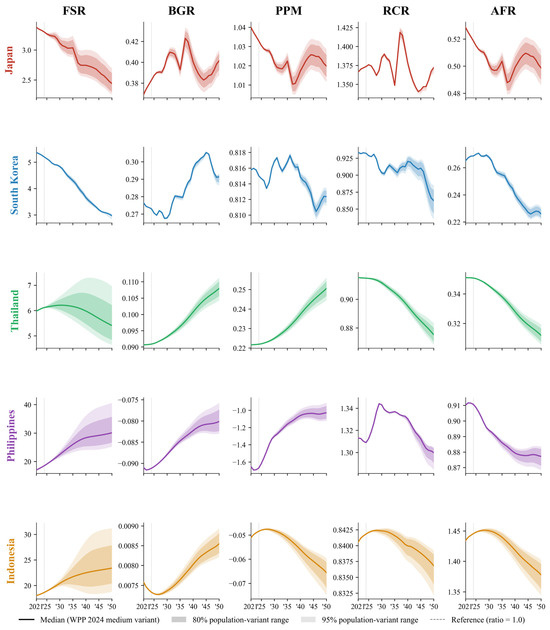
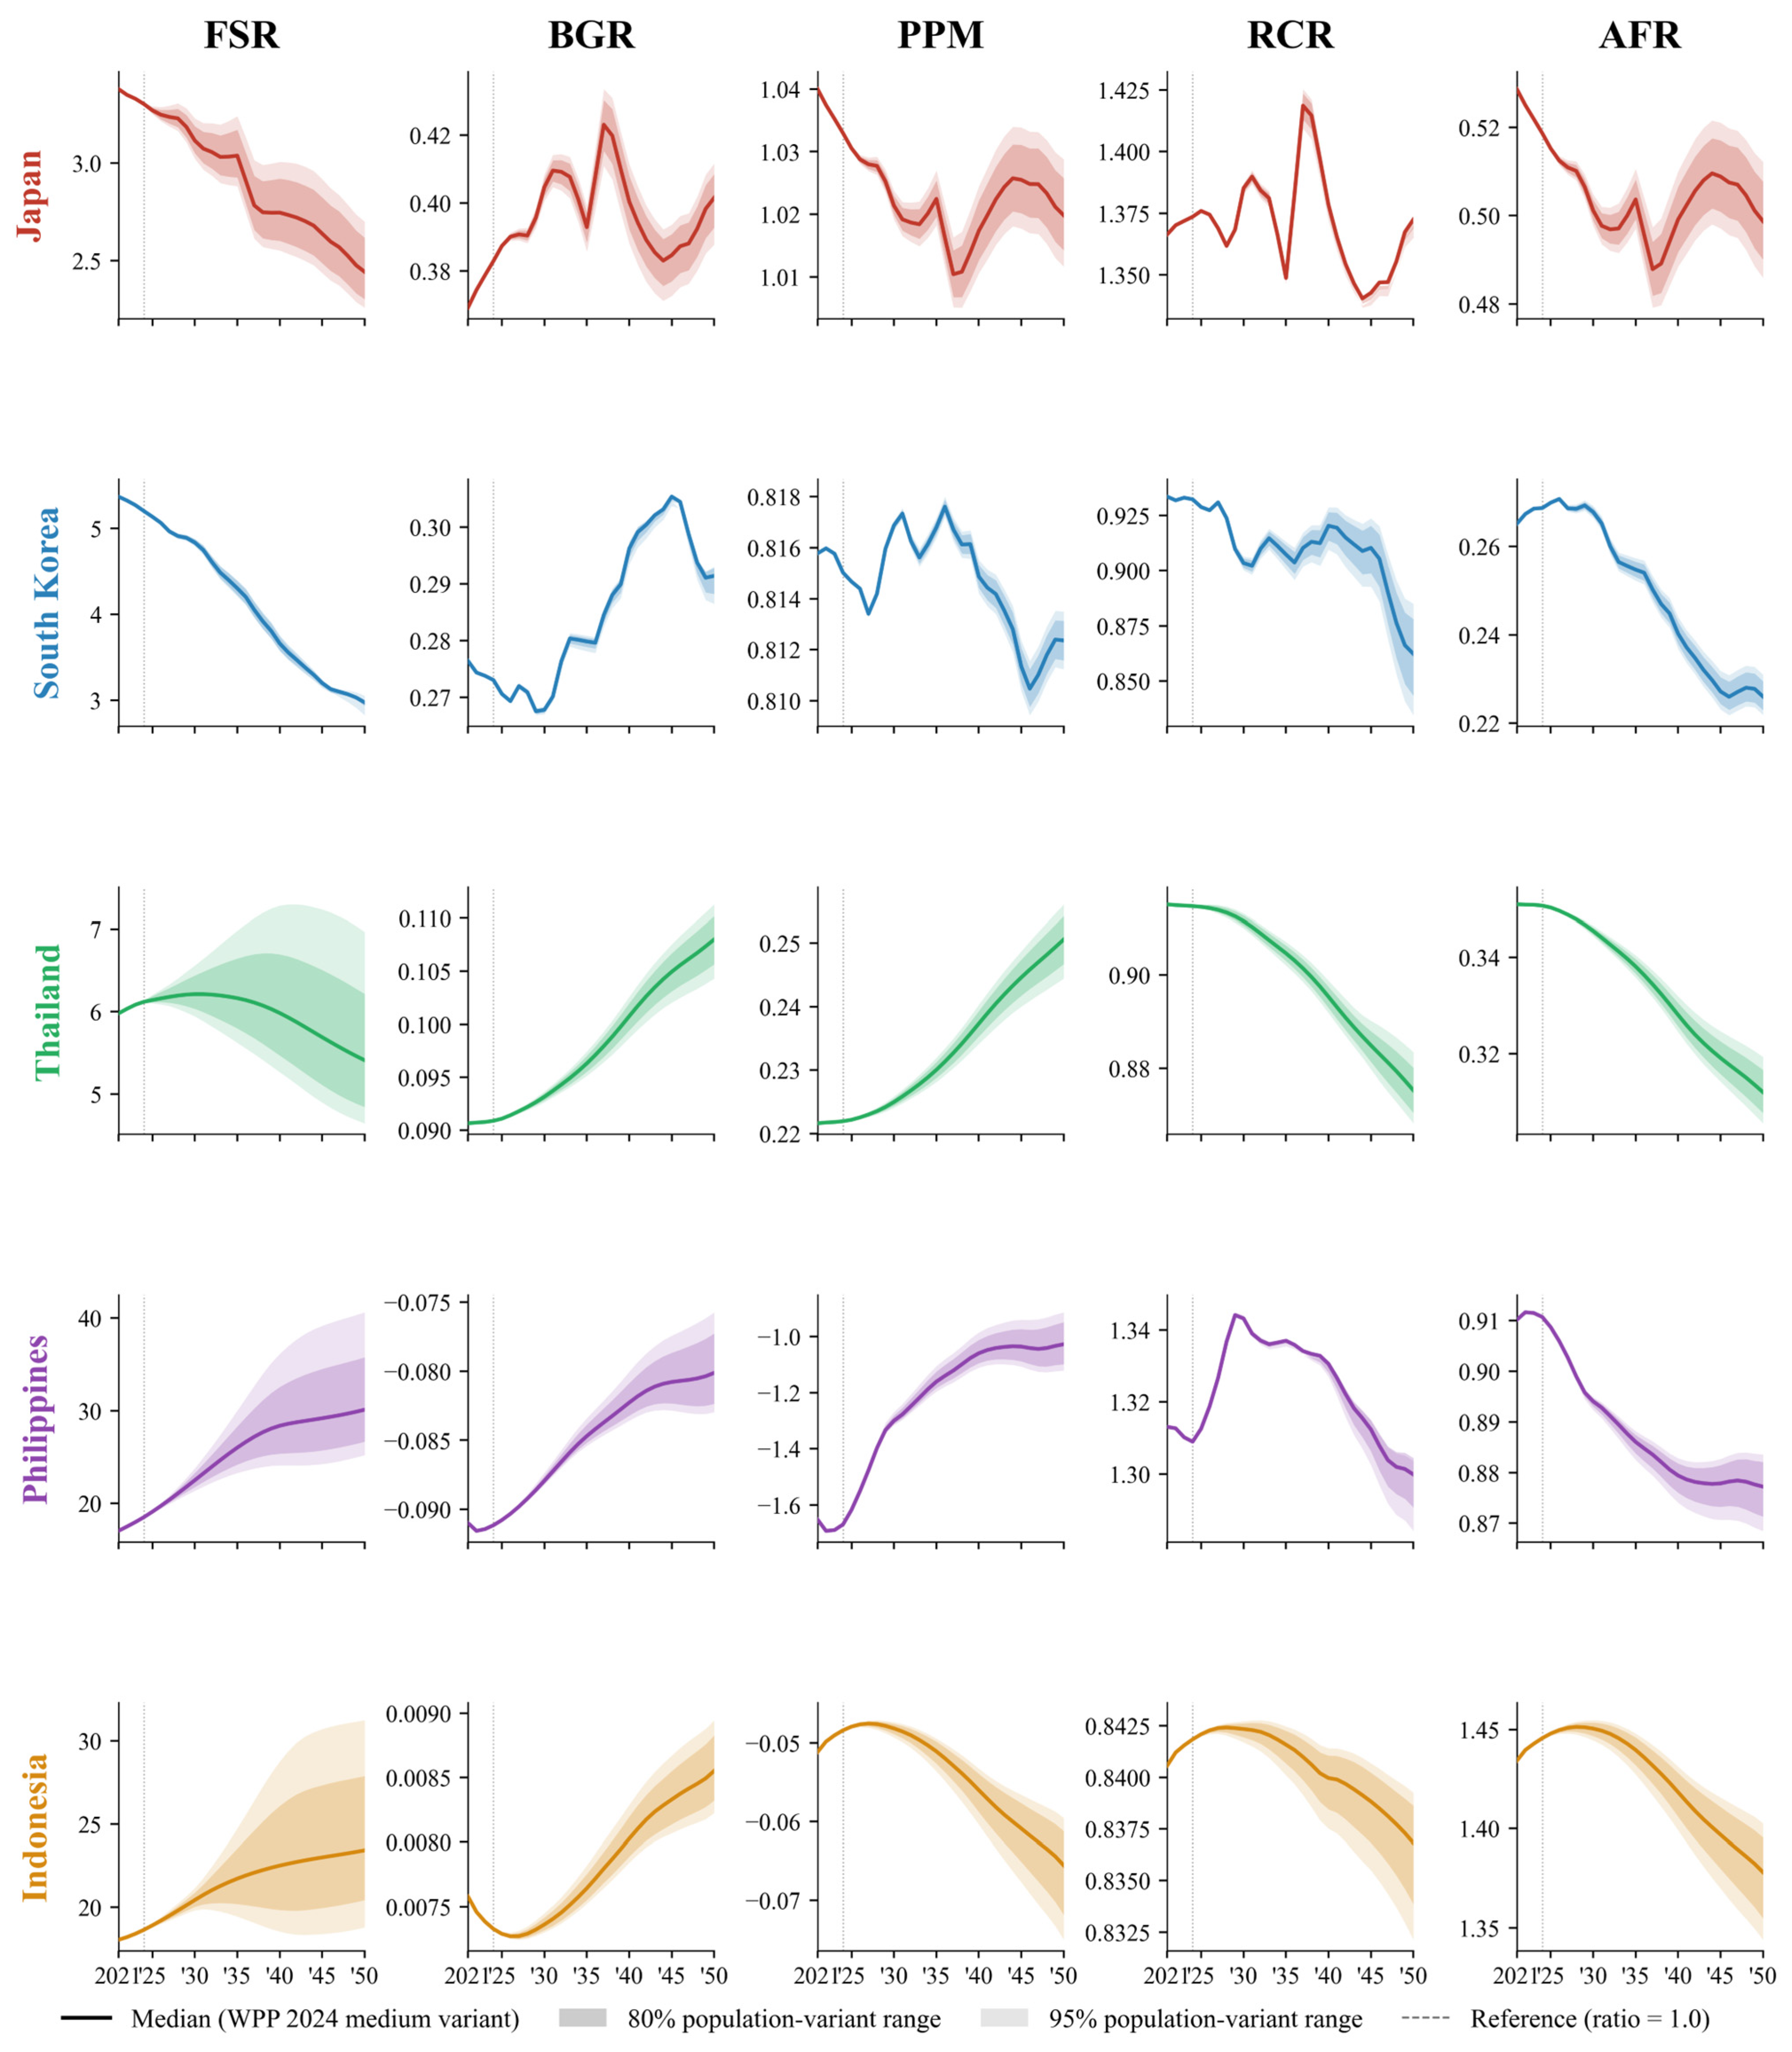

Disclaimer/Publisher’s Note: The statements, opinions and data contained in all publications are solely those of the individual author(s) and contributor(s) and not of MDPI and/or the editor(s). MDPI and/or the editor(s) disclaim responsibility for any injury to people or property resulting from any ideas, methods, instructions or products referred to in the content. |
© 2026 by the authors. Licensee MDPI, Basel, Switzerland. This article is an open access article distributed under the terms and conditions of the Creative Commons Attribution (CC BY) license.