1. Introduction
In the absence of an adequate health insurance system in many developing countries, illness exposes households to the risk of financial catastrophe and in the extreme case to poverty. Illness could cause severe financial hardship directly via healthcare payments and indirectly due to lost income from inability to work. Households could use savings, borrow or sell assets to cope with health shocks. However, households with tight financial constraints may have no option but to cut spending on necessary goods to cover health expenses. To obtain adequate healthcare, many households rely on out-of-pocket healthcare expenditures (OOP), which increase the risk of becoming impoverished if the OOP were substantial and for prolonged periods. Excessive reliance on OOP may increase inequalities in access to healthcare and could also increase intergenerational inequality if the households’ ability to invest in their children’s health and education is reduced (Xu
et al., 2007 [
1]; Alam and Mahal, 2014 [
2]).
Households with no health insurance coverage use OOP to cover health expenses that could drive them into a financial catastrophe and reduce their economic welfare. It has been documented that the impoverishment
1 due to health expenditure is more prevalent among the poor, which constitutes a major challenge to poverty alleviation efforts in many countries.
2There is limited evidence on the magnitude of catastrophic health payments and the poverty impact of OOP in the Arab world. Very few studies have explored the catastrophic and impoverishing effect of health expenditure in the Arab region (see, for example, Abou-Ali, 2007 [
3]; Elgazzar
et al., 2010 [
4]; Mataria
et al., 2010 [
5]; Rashad and Sharaf, 2015 [
6]).
This paper adds to the extant literature by providing empirical evidence on the extent of catastrophic health payments and the effect of OOP on impoverishment, in three Arab countries, namely Egypt, Jordan, and Palestine, on which limited research has been conducted.
3This paper aims to assess the degree by which households are financially protected against the medical payments associated with healthcare use, across the three Arab countries, between the years 1998 and 2011.
The paper is organized as follows:
Section 2 presents a brief review of the related literature.
Section 3 provides an overview on the structure of the healthcare systems in the countries under investigation. The data are described in
Section 4. The empirical methodology of the paper is presented in
Section 5 and the obtained results are discussed in
Section 6.
Section 7 summarizes the findings of the paper and discusses some policy recommendations.
Section 8 concludes the paper.
2. Literature Review
There is substantial literature on the economic consequences of health shocks.
4 For example, Wagstaff (2007) [
7] found evidence in Vietnam that health shocks, including the death of a working-age household member and hospitalization, negatively affect earned income, increase medical spending, especially for the uninsured, and reduce per capita food consumption within households.
A growing number of studies examined the prevalence of catastrophic health payments, and assessed the poverty impact of OOP in a wide range of countries, during different periods, and using different econometric methodologies. There is substantial evidence that out-of-pocket patient payments may push households into poverty (Van Doorslaer
et al., 2006 [
8]; Xu
et al., 2007 [
1]; Bredenkamp
et al., 2011 [
9]; Shahrawat and Rao, 2012 [
10]; Arsenijevic
et al., 2013 [
11]; Van Minh
et al., 2013 [
12]; Narcı
et al., 2015 [
13]). For example, Arsenijevic
et al. (2013) [
11] found that OOP have a catastrophic effect on poor households in Serbia. In particular, they found that households that are above the absolute, relative and subjective poverty lines, respectively, after the subtraction of out-of-pocket payments fall below these poverty lines. They also found that the probability of catastrophic out-of-pocket patient payments is higher in rural areas, in larger households, and among chronically sick household members. In another study, Van Minh
et al. (2013) [
12] examined the catastrophic and poverty impacts of OOP in Vietnam and found that between 2002 and 2010, 4% to 5% of households have incurred catastrophic health expenditure, and between 3% to 4% of households have been impoverished because of health expenditure. Shahrawat and Rao (2012) [
10] found that 5% of the households in India suffer from catastrophic health expenditures and that the poverty deepening impact of OOP was at a maximum in people below the poverty line compared to those above. They also found that medicines and outpatient care constitute the main share of total OOP and hence the insurance schemes that cover only hospital expenses, like those existing nationally in India, will fail to adequately protect the poor against impoverishment due to spending on health. In a recent study, Narcı
et al. (2015) [
13] reported an increase in catastrophe and poverty in Turkey due to OOP during the period 2004 to 2010.
In a cross-country study of 11 Asian countries, Van Doorslaer
et al. (2006) [
8] examined whether OOP exacerbate poverty. They found that poverty estimates after accounting for OOP were much higher than the conventional estimates, ranging from an additional 1.2% of the population in Vietnam to 3.8% in Bangladesh. In another cross-country study of Western Balkan countries, Bredenkamp
et al. (2011) [
9] found evidence that health expenditure contributes substantially to household impoverishment in Albania, Bosnia and Herzegovina, Montenegro, Serbia and Kosovo, which increases the prevalence of poverty and push poor households into deeper poverty.
Previous studies mostly agree that reducing reliance on OOP in financing healthcare significantly protects households from financial catastrophe resulting from illness. For example, Xu
et al. (2007) [
1] examined the determinants of catastrophic health expenditure in 59 countries and found that the proportion of government health spending to total health spending, opposed to OOP share of total health spending, is the main factor explaining the prevalence of catastrophic health expenditures across countries.
Poor households develop strategies to cope with health shocks. These strategies aim to sustain the economic viability of the household. There are strategies that deal with mobilizing funds to meet direct costs such as borrowing or selling assets. Other strategies deal with indirect cost such as intra-household labor substitution. The ability of households to deal with health shocks depends on their assets portfolio, in addition to the type, severity, duration of illness and the family members affected.
Leive and Xu (2008) [
14] examined how households in 15 African countries characterized by low government health spending and lack of health insurance, cope with health shocks.
5 In 12 countries, high inpatient spending increased the likelihood of borrowing or selling assets. They also found that the high-income quintiles were less likely to use coping strategies relative to the poorest households. In addition, urban households were less likely to use coping strategies than rural households.
There is limited evidence on the magnitude of catastrophic health payments and the poverty impact of OOP in the Arab world. Among the few studies that explored the catastrophic and impoverishing effect of health expenditure in the Arab region, see, for example, Abou-Ali, 2007 [
3], Elgazzar
et al., 2010 [
4] and Mataria
et al., 2010 [
5]. In a cross-country study, Elgazzar
et al. (2010) [
4] examined the extent of out-of-pocket expenditures and their effects on living standards in six Middle East and North African countries including Yemen, the West Bank and Gaza, Egypt, Iran, Tunisia, and Lebanon. They found that OOP constitute 49% of total national healthcare on average and that households pay an average of 6% of their total household expenditure on health. Seven to thirteen percent of households face catastrophic health expenditures and poverty rates tend to increase by up to 20% after accounting for healthcare. They also found that lower-income and rural households face greater financial risk. In another study, Mataria
et al. (2010) [
5] examined the incidence and intensity of catastrophic and impoverishing healthcare payments borne by Palestinian households between 1998 and 2007. They found a low incidence of catastrophic health payments with only 1% of the surveyed households spent more than 40% of their total household expenditures (net of food expenses) on healthcare in 1998; however, the percentage was almost doubled in 2007. They also found an increase in the percentage of households who fell into deep poverty from 11.8% in 1998 to 12.5% in 2006.
3. An Overview of the Structure of Healthcare System in Egypt, Jordan, and Palestine
Egypt, Jordan, and Palestine are three Arab countries with a total population of 93 million individuals. Egypt is the largest Arab country with a population of 82 million. It is a lower middle-income country with a large number of poor people. According to the World Health Organization (WHO), the share of government in total health spending has declined from 41.7% in 2010 to 37% in 2011, putting more of the burden on households. OOP accounts for 60% of total health spending in Egypt.
The healthcare system in Egypt is quite complex with a large number of entities, both public and private, involved in the management, financing, and provision of healthcare services. These include several ministries, NGO, faith-based charity organizations and private health facilities. The public sector includes the different ministries that provide healthcare service, such as the Ministry of Health, Ministry of Higher Education, Ministry of Defense and Ministry of Interior. Along with ministries, the public sector also includes the Health Insurance Organization and the Curative Care Organization. These institutions are financially independent organizations under the authority of the Ministry of Health. The private sector includes for-profit hospitals, clinics, and pharmacies while the civil society consists of Non-Governmental-Organizations (NGOs). The Ministry of Finance is the major funding source for healthcare activities at different ministries. For instance, it funds 93% of the Ministry of Health’s activities. The Ministry of Health provides a wide range of health services to all citizens at highly subsidized rates. In addition, public health insurance exists under the Health Insurance Organization. In 2013, the Health Insurance Organization covered 57% of the population. The coverage includes school students, infants, pensioners, and widows, in addition to employees through the employment-based scheme. It raises funds from beneficiaries’ payments, the Ministry of Finance and users’ fees. Over 90% of pharmaceuticals consumption in Egypt is met through domestic production. Spending on pharmaceuticals accounts for one-third of all health spending, of which around 85% is a private expenditure. Publicly produced medicines are heavily subsidized, and Egypt is a major producer of vaccines in the Middle East. Despite the concerted governmental efforts in implementing universal healthcare coverage, the OOP payments accounted for 60% of the health spending in Egypt. The Seventh round of the Egyptian Family Observatory Survey revealed that 80% of the households have at least one member covered by public health insurance. However, the survey pointed out that only 25% of households are benefiting from the public insurance, due to the low quality of services and excessive red tape. This suggests that health shocks may push non-poor into poverty, and exacerbate the poverty of the poor (Information and Decision Support Center, 2010 [
15]).
Palestine is a country with 4.2 million individuals and is a lower middle-income country. Similar to Egypt, 37% of total health financing comes from the Palestinian Ministry of Health. The Palestinian–Israeli conflict has influenced the development of the health system in Palestine. Shortly after the birth of Palestinian National Authority (PA) with Oslo accord in 1994, the Palestinian Ministry of Health was established. The healthcare providers in Palestine could be classified into four groups; the Palestinian Ministry of Health, private for profit sector, NGOs and United Nations Relief and Works Agency (Mataria
et al., 2010 [
5]). Additionally, Palestine has a compulsory governmental health insurance for public employees, pensioners and their dependents and coverage is voluntary for private sector employees. After Gaza war in 2007, the government introduced free health insurance system covering all Gaza residents. However, only half of the residents in the West Bank are covered by the health insurance system.
Table 1.
Government share in health spending in Egypt, Jordan, and Palestine.
Table 1.
Government share in health spending in Egypt, Jordan, and Palestine.
| Indicator | Egypt | Jordan | Palestine |
|---|
| GDP per capita (current US$) in 2011 | 2816.7 | 4666 | 2655 |
| Health expenditure per capita (current US$) in 2011 | 142 | 391 | 248 |
| Health expenditure, public (% of total health expenditure) | 40.7 | 64.8 | 37 |
The healthcare system in Palestine has been facing several challenges that affected the coverage and the quality of the provided healthcare services. The mobility restrictions in both the West Bank and Gaza, and the permit regime limit access to the specialized hospitals in East Jerusalem, Israel, and Jordan. Accordingly, the Palestinian Ministry of Health faces substantial difficulties in providing healthcare services to people living in rural areas of the West Bank, so-called “Area C”. The health system in Gaza has been negatively affected by the blockade since 2006 and by the political divide between the West Bank and Gaza. This is in addition to the repeated power cuts and the unstable power supply, which affects medical care and causes shortages of essential drugs, inadequate maintenance capacity and spare parts shortages, all of which deteriorates the functionality of medical equipment (WHO, 2011 [
17]).
Unlike Egypt, Jordan is a much smaller country with a population of 6.2 million. It is an upper middle-income country. The World Bank ranked Jordan as the leader in the Arab region and the fifth in the world in medical tourism, which generates over $1.5 billion in revenues annually. Jordan’s rate of healthcare expenditure is the third highest in the region and is growing at an annual rate of about 7%. There are 104 hospitals that serve the Jordanian population, and 250,000 patients from neighboring countries annually. Statistics show that 10% of Jordan’s GDP is allocated toward healthcare. The healthcare system in Jordan is facing several challenges stemming from the absence of universal health coverage, fragmentation of service provision and funding mechanisms, the relatively high healthcare expenditure and the high rate of migrants and refugees’ arrival.
The Jordanian government share in total health spending has increased rapidly in the last ten years from 45% in 2000 reaching 68% in 2011. In Jordan, there are two major public healthcare providers: the Ministry of Health and the Royal Medical Services. They provide their services at heavily subsidized rates to all citizens irrespective of their income level. The Ministry of Health provides its services to all citizens and it operates 30 hospitals while the Royal Medical Services provides its services to armed forces and their dependents through eleven hospitals. The Jordanian National Health Accounts suggests that 75% of the population was covered by some form of health insurance in the year 2008. The largest insurer in Jordan is the Civil Health Insurance followed by the Military Medical Insurance.
Statistics shows that a significant fraction of healthcare expenditures in Egypt, Jordan, and Palestine are financed by OOP. According to the 2008 Egyptian National Health Accounts, OOP accounted for 60% of the total health spending. In Palestine, the OOP share in total health spending is 43.1% in the year 2011, while in Jordan OOP accounted for 42.3% of total health expenditure in the year 2008.
Table 2 breaks down OOP for Egypt and Jordan based on the National Health Accounts of the two countries.
6 It is evident from
Table 2 that in Egypt, expenditure on private clinics constitutes the major component of OOP with 38.4% of total OOP expenditures followed by Pharmaceuticals (33.1%), while expenditure on hospitals, both public and private, represents only 17.3% of the total OOP. In Jordan, expenditures on pharmaceuticals represent almost half of the total OOP, and expenditure on hospitals, both public and private, represents 44% of the total OOP. Unlike Egypt, expenditures on private clinics in Jordan represent a small fraction of OOP with only 6% of the total OOP as opposed to 38.4% in the case of Egypt.
Table 2.
The Distribution of OOP.
Table 2.
The Distribution of OOP.
| Indicator | Egypt | Jordan |
|---|
| Private Hospitals (%) | 8.2 | 22 |
| Private Clinics (%) | 38.4 | 6 |
| Public Hospitals (%) | 9.1 | 22 |
| Pharmaceuticals (%) | 33.1 | 48 |
| Others (%) | 11.2 | 2 |
4. Data
This paper uses data from three, nationally representative, Household Income and Expenditure Surveys. For Egypt, we use the Household Income, Expenditure and Consumption Survey (HIECS) for 2010/2011 [
20]. The survey is conducted by the Central Agency for Public Mobilization and Statistics (CAPMAS) and covers 26,500 households across Egypt. HIECS is the only source of poverty measurement in Egypt and is conducted every two years. Access to the survey was provided by the Economic Research Forum (Economic Research Forum and Central Agency for Public Mobilization and Statistics, 2013 [
20]). HIECS collects data for all categories of household expenditure in addition to information on employment status, educational status, marital status and other socio-economic variables.
For Jordan, we used Jordan Household Expenditure and Income Survey for 2010 [
21], conducted by the Department of Statistics of the Hashemite Kingdom of Jordan. The survey includes data on 13,866 households and we get access to the survey data from the Economic Research Forum (Economic Research Forum and the Department of Statistics of The Hashemite Kingdom of Jordan, 2013 [
21]). The survey collects information on dwelling characteristics, demographic characteristics, assets ownership, sources of earning (income from employment, rent, transfer payments,
etc.), and all different categories of expenditure including health payments.
For Palestine, Expenditure and Consumption Survey 2010 [
22] is used. The sample size is 3757 households, 2574 households in West Bank and 1183 households in Gaza Strip. The survey collects information on spending, socioeconomic and demographic characteristics of households. The survey is conducted by the Palestinian Central Bureau of Statistics (PCBS). The survey data were provided by the Economic Research Forum (Economic Research Forum and the Palestinian Central Bureau of Statistics, 2013 [
22]).
The three datasets are harmonized and cleaned by the Economic Research Forum. To measure catastrophic payments for healthcare and impoverishment, three variables are needed: the total level of spending on health, the level of total expenditure of household, and the total non-food expenditure level. The three variables of interest are standardized and harmonized across the three surveys by the Economic Research Forum. The variables of health spending include spending on medical products, appliances and equipment, outpatient services, and hospital services. Payments for health insurances are excluded. Total expenditure variable is the summation of all expenditure and non-food expenditure is the total expenditure minus spending on food, however, alcoholic and tobacco expenditures are included here.
5. Methodology
The OOP for healthcare is considered catastrophic if its fraction of total expenditure exceeds a pre-specified level, usually 10% of total expenditure (Van Doorslaer
et al., 2007 [
23]). Other researchers consider OOP on health services to be catastrophic if it exceeds 40% of non-food expenditure, as non-food spending is a better indicator of living standard, especially in low-income countries (Xu
et al., 2003 [
24]; O’Donnell
et al., 2008 [
25]). The intuition behind these methods is that OOP for healthcare should not exceed a given threshold, otherwise the health payments would be disruptive and households would have to cut their spending on necessities to pay for healthcare services. In this paper, we measure the catastrophic payments for healthcare using these two threshold benchmarks.
7Similar to the poverty headcount, the incidence of catastrophic payment could be measured by Equation (1):
where
is the sample size, and
= 1 if the ratio of health payment to total household expenditure, given by
, exceeds the threshold
and equals zero otherwise. However, this measure captures the prevalence, but not the severity of catastrophic payment, by how far the ratio of total health payments to total household spending exceeds the chosen threshold. Therefore, similar to the poverty gap, the catastrophic payment overshoot captures the severity of catastrophic payments as in Equation (2):
where
. Moreover, the mean positive overshoot (
), which is calculated in Equation (3), is used to reflect the overshoot relative to households encountering catastrophic payments:
To get more insight into the severity of the catastrophic health payments problem, it is important to examine the distribution of catastrophic payments by income level. The above measures of incidence and overshoot do not reveal whether it is poor households or rich households that are encountering catastrophic health payments. If the assumption of a diminishing marginal utility holds for income, then the lost utility resulting from illness expenses would be much greater for poor households than for the better off. In this regard, we use the concentration index in revealing whether the better off households or the poor households are more likely to exceed the payment threshold. The concentration index is analogous to the Gini coefficient; its value depends on the area between the 45-degree line (line of equality) and the concentration curve, which provides the distribution of catastrophic payment in relation to a measure of living standard. Similar to the Gini coefficient, the absolute value of concentration index varies between zero and one, where zero indicates perfect equality and one indicates perfect inequality. A positive (negative) concentration index suggests that the better off (the poor) are more likely to exceed the threshold. The concentration index (C) is calculated as in Equation (4):
where
is the catastrophic payments headcount and
is its mean, while
is a measure of living standard. Therefore, the concentration index depends on the covariance between catastrophic payments headcount and its association with the measure of living standard.
The effect of healthcare payments on poverty estimates, both poverty headcount and poverty gap is measured using the methodology of O’Donnell
et al. (2008) [
25]:
Equation (5) measures the poverty headcount , in which is the household size, and is the number of households in the sample. equals one if and equals zero otherwise, where is the per-capita spending by household and is the poverty line.
The conventional poverty gap is calculated using Equation (6):
where
. The effect of health payments on poverty headcount and poverty gap is captured by replacing
with
, where
if
and equals zero otherwise. By replacing
with
, where
is the per capita health spending by household
. Then we compare between
and
and between
and
to demonstrate the effect of health payments. We also measure the normalized poverty gap (NG) gross of health payments and net of health payments, which could be calculated by Equation (7):
In order to measure the effect of health payments on poverty, we need the poverty lines for the three countries. A Poverty line could be either absolute or relative. In this paper, we used the World Bank absolute poverty lines, $1.90 per head per day (PPP) and $3.10 per head per day (PPP). These two poverty lines are considered extreme poverty lines and they do not have a special allowance for healthcare needs. Thus, measuring poverty after taking out health payments from total spending using these lines does not require reducing these poverty lines.
8 6. Results
Table 3 presents the prevalence, intensity and distribution of catastrophic health payments in the three countries at different threshold levels: as a percent of total expenditure and non-food expenditure. The empirical results suggest that the size of catastrophic health payments varies considerably across the three countries. At the 10% threshold, in Egypt, more than one-fifth of the population are encountering catastrophic health payments, which is relatively high compared to catastrophic payments in middle- and low-income countries like Bangladesh and India (Van Doorslaer
et al., 2007 [
23]). At the 25% of non-food expenditure threshold, more than one-fifth of the Egyptian population is also exceeding the threshold. At the 40% of non-food expenditure threshold, the proportion of households encountering financial catastrophe goes down to 7.1%.
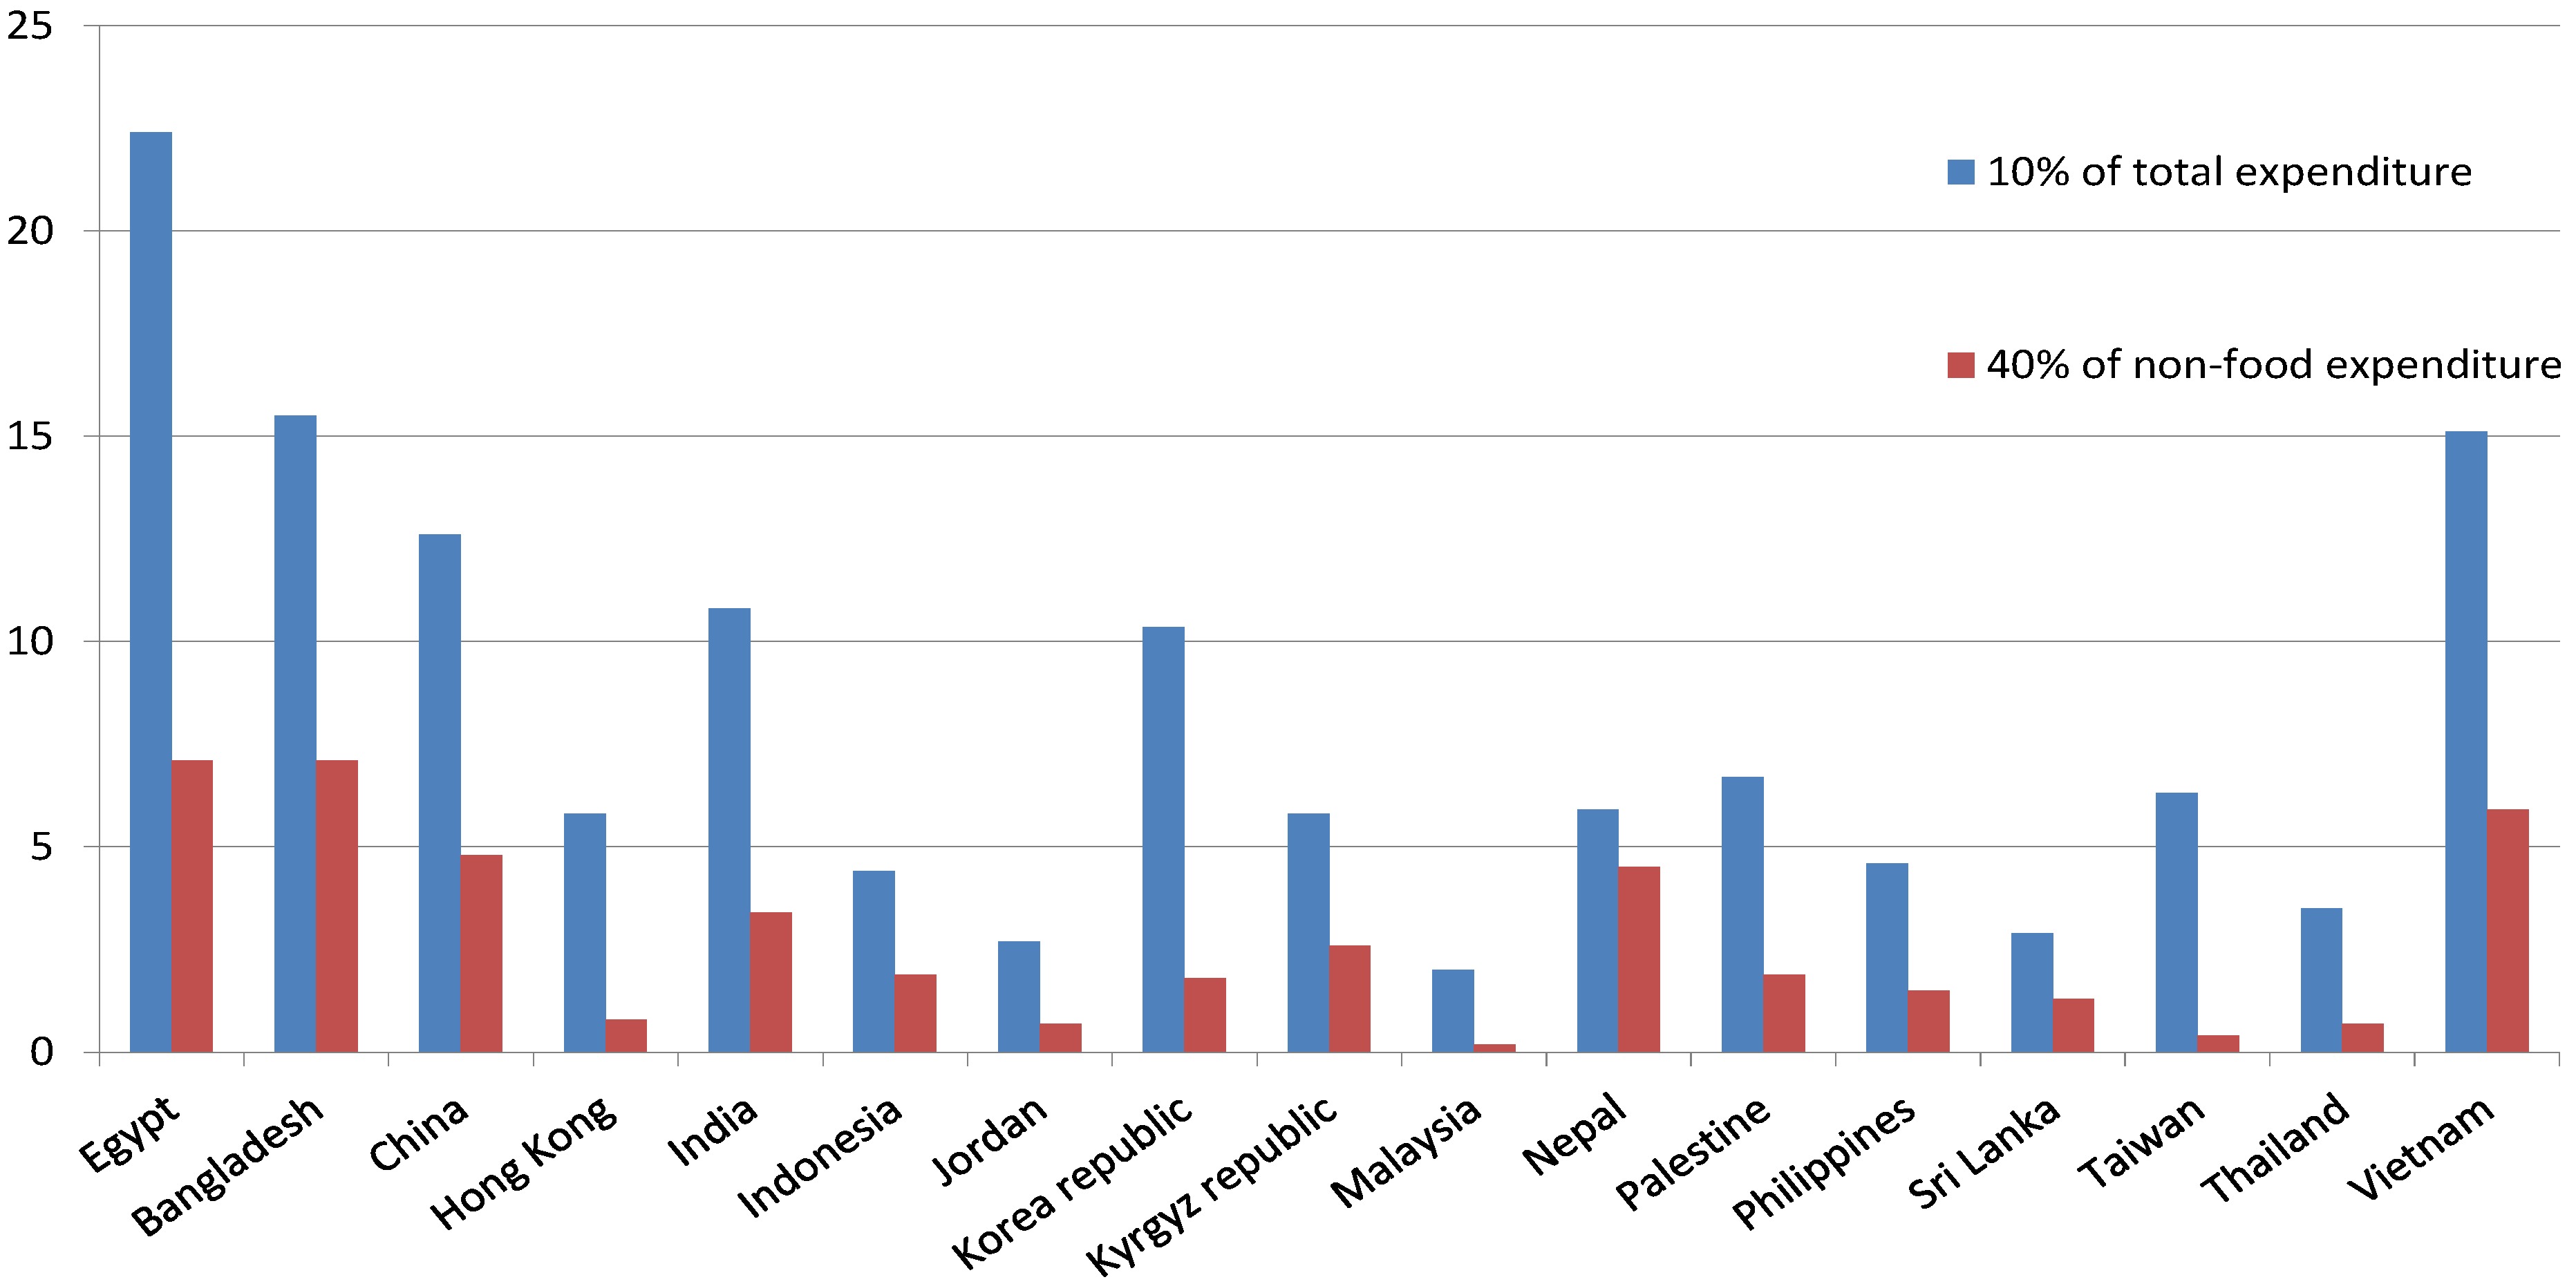
Figure 1 displays the catastrophic health payments across a group of countries and shows that Egypt, compared to other low- and middle-income countries, has one of the highest incidence of catastrophic payments. On the other hand, Jordan and Palestine have a much lower incidence of catastrophic health payments compared to Egypt and other countries such as Bangladesh, India, Vietnam, and China.
Figure 1.
Incidence of catastrophic health payments across countries. Source: Authors’ compilation based on the data from Van Doorslaer
et al. (2007) [
23].
Figure 1.
Incidence of catastrophic health payments across countries. Source: Authors’ compilation based on the data from Van Doorslaer
et al. (2007) [
23].
Estimates show that the incidence of catastrophic health payment is much lower in Jordan and Palestine when compared to Egypt. In Jordan, OOP for healthcare do not cause disruption to many households, as only 2.7% of the households are encountering catastrophic payments at the 10% threshold, and 0.7% at the 40% of the non-food-expenditure threshold. In Palestine, 6.7% of the population is encountering catastrophic health payments at the 10% threshold and approximately 2% at the 40% of the non-food-expenditure threshold.
Table 3 also presents the estimated concentration index for the three countries. A positive concentration index indicates a greater tendency for the better off households to cross the threshold. For the three countries, the value of the concentration indices is positive at different thresholds, suggesting that the problem of catastrophic health payments is less common among poor households, as the better off are more likely to cross the threshold based on the concentration index values.
Results show that Jordan has the highest values of the concentration index, followed by Egypt and then Palestine. This suggests that the incidence of the catastrophic health payments is highly concentrated among the better off in Jordan, and to a lesser degree in Egypt, while Palestine has a more equitable burden of the catastrophic health payments among the poor and rich as its concentration is very close to zero.
Table 3.
Incidence, intensity, and distribution of catastrophic health payments.
Table 3.
Incidence, intensity, and distribution of catastrophic health payments.
| | | | Using Total Expenditure | Using Non-Food Expenditure |
|---|
| Egypt | Year | Threshold | 10% | 25% | 40% | 10% | 25% | 40% |
| 2010 | Headcount (H) | 22.4 | 3.4 | 0.6 | 57.7 | 20.9 | 7.1 |
| 2010 | Overshoot (O) | 1.7 | 0.3 | 0.1 | 8.2 | 2.8 | 0.8 |
| 2010 | Mean Positive Overshoot | 7.7 | 9.1 | 10.1 | 14.3 | 13.3 | 11.9 |
| 2010 | Concentration Index | 0.183 | 0.448 | 0.646 | 0.037 | 0.135 | 0.313 |
| 2005 | Headcount (H) | 5.5 | 0.6 | 0.1 | 27.6 | 5.0 | 1.4 |
| 2005 | Overshoot (O) | 0.4 | 0.1 | 0.0 | 2.4 | 0.6 | 0.2 |
| 2005 | Mean Positive Overshoot | 6.4 | 9.9 | 10.5 | 8.9 | 11.6 | 11.5 |
| 2005 | Concentration Index | 0.306 | 0.585 | 0.759 | 0.053 | 0.247 | 0.369 |
| 2000 | Headcount (H) | 5.3 | 0.5 | 0.1 | 19.3 | 2.6 | 0.6 |
| 2000 | Overshoot (O) | 0.3 | 0.0 | 0.0 | 1.4 | 0.3 | 0.1 |
| 2000 | Mean Positive Overshoot | 6.1 | 10.0 | 10.1 | 7.3 | 10.3 | 11.3 |
| 2000 | Concentration Index | 0.266 | 0.458 | 0.636 | 0.070 | 0.243 | 0.376 |
| Jordan | 2010 | Headcount (H) | 2.7 | 0.4 | 0.1 | 9.8 | 1.7 | 0.7 |
| 2010 | Overshoot (O) | 0.7 | 0.2 | 0.1 | 1.0 | 0.3 | 0.1 |
| 2010 | Mean Positive Overshoot | 7.6 | 11.3 | 14.3 | 10.0 | 16.4 | 15.2 |
| 2010 | Concentration Index | 0.450 | 0.482 | 0.963 | 0.276 | 0.560 | 0.543 |
| 2006 | Headcount (H) | 4.9 | 0.5 | 0.3 | 13.0 | 2.5 | 0.8 |
| 2006 | Overshoot (O) | 0.4 | 0.1 | 0.0 | 1.3 | 0.3 | 0.1 |
| 2006 | Mean Positive Overshoot | 7.5 | 18.6 | 16.4 | 10.2 | 14.1 | 16.0 |
| 2006 | Concentration Index | 0.235 | 0.597 | 0.674 | 0.122 | 0.401 | 0.554 |
| 2002 | Headcount (H) | 2.6 | 0.4 | 0.3 | 11.3 | 2.1 | 1.0 |
| 2002 | Overshoot (O) | 0.2 | 0.1 | 0.0 | 1.1 | 0.3 | 0.1 |
| 2002 | Mean Positive Overshoot | 8.8 | 15.0 | 8.4 | 9.6 | 14.1 | 11.1 |
| 2002 | Concentration Index | 0.367 | 0.480 | 0.412 | 0.133 | 0.327 | 0.405 |
| Palestine | 2010 | Headcount (H) | 6.7 | 1.2 | 0.5 | 18.7 | 4.8 | 1.9 |
| 2010 | Overshoot (O) | 0.7 | 0.2 | 0.1 | 2.3 | 0.8 | 0.3 |
| 2010 | Mean Positive Overshoot | 9.9 | 17.1 | 17.2 | 12.1 | 16.0 | 15.0 |
| 2010 | Concentration Index | 0.075 | 0.507 | 0.755 | 0.002 | 0.079 | 0.241 |
| 2006 | Headcount (H) | 8.1 | 1.4 | 0.5 | 22.1 | 6.0 | 2.4 |
| 2006 | Overshoot (O) | 0.8 | 0.2 | 0.1 | 2.7 | 1.0 | 0.4 |
| 2006 | Mean Positive Overshoot | 9.5 | 18.0 | 19.9 | 12.4 | 16.4 | 16.2 |
| 2006 | Concentration Index | 0.097 | 0.420 | 0.314 | 0.003 | 0.039 | 0.156 |
| 1998 | Headcount (H) | 6.3 | 1.2 | 0.3 | 21.7 | 5.8 | 2.3 |
| 1998 | Overshoot (O) | 0.6 | 0.2 | 0.1 | 2.6 | 0.9 | 0.3 |
| 1998 | Mean Positive Overshoot | 9.2 | 13.1 | 17.2 | 12.0 | 15.0 | 14.1 |
| 1998 | Concentration Index | 0.109 | 0.259 | 0.621 | 0.006 | 0.042 | -0.034 |
To get more insight into how the incidence, intensity and distribution of catastrophic payment have evolved over time, we also presented these statistics for the last two rounds of the surveys data in the three countries. The incidence of the catastrophic health payments in Egypt has, in general, an upward trend, increasing from 5.3% in the year 2000, at the 10% threshold of total expenditure, to 5.5% (2005) and 22.4% (2010). This upward trend was evident across the different thresholds. In Jordan, though the prevalence of the catastrophic health payments has increased from 2.6% in 2002 to 4.9% in 2006, the rate has dropped by almost half of that value, reaching 2.7% in 2010. A similar pattern was evident in Palestine, with an increased prevalence of the catastrophic health payments from 6.3% in 1998 to 8.1% in 2006, which then dropped to 6.7% in 2010. As for the trend in the distribution of the catastrophic health payments, in Egypt, though the values of the concentration indexes were all positive, the magnitude has declined over time across the different thresholds. For example, at the 10% of the total expenditure threshold, the concentration index has dropped from 0.26 in the year 2000 to 0.183 in 2010. This indicates that the burden of the catastrophic health payments is more evenly distributed among poor and rich households. In Jordon, the concentration index has increased from 0.36 in 2002 to 0.45 in 2010, which indicates an increased concentration of the catastrophic health payments among the better off households. In Palestine, the trend in the concentration index was mixed depending on the threshold level. For example, at the 10% of total expenditure threshold, the concentration index decreased from 0.109 in 1998 to 0.075 in 2010, while, at the 25% threshold, it increased from 0.259 to 0.507 during the same period.
For the intensity of the catastrophic health payments, as reflected by the mean positive overshoot, at the 10% of the total expenditure threshold, household in Egypt who have catastrophic payments allocated on average 17.7% of their total spending on health. The intensity of the catastrophic health payments in Egypt shows an increasing trend over time, while in Jordan, the intensity has, in general, decreased. For instance at the 10% threshold level it decreased from 8.8% in 2002 to 7.6% in 2010. In Palestine, at the 10% of total expenditure threshold, households who have catastrophic payments spent on average 19.5% on healthcare. The intensity of the catastrophic health payments also has an increasing trend in Palestine.
Table 4 depicts the impoverishment impact of OOP at two extreme poverty measures over time in Egypt. The effect of OOP on the extreme poverty estimates has been found to be trivial in the case of Jordan as well as in Palestine. Based on 2011 prices,
Table 4 uses the two World Bank updated poverty lines: $1.90 and $3.10 per day.
Table 4 shows the trend in the impoverishment impact of the medical payments during the period 1999 to 2011, based on the two key poverty lines. Irrespective of the poverty line used, the table displays that the level of extreme poverty in Egypt has fallen over time, and similarly the percentage of households who are pushed into poverty after paying for healthcare. Despite the decline in the level of poverty estimates before and after healthcare payments, the impoverishment impact of OOP has increased between 1999 and 2011, irrespective of the poverty line used. For instance, the poverty rate of $3.10 per day in 1999/2000 has increased by about 15%, while in 2010/2011 has increased by about 25%. Similarly, the estimated poverty gap has increased by 15% in the year 1999 and by 33% in 2011. Thus, OOP has a higher impoverishment impact in the year 2011 compared to the year 1999.
In the year 2011, 0.6% of the households are in poverty, when households are evaluated based on total spending using the $1.90 per day line. However, when OOP are deducted from total household spending, the percentage of households who are in poverty increased to 1%. Therefore, around 0.2% of the population is not regarded as living below the poverty line. This implies a 66% increase in the poverty headcount measure.
Table 4 also shows an additional increase in the poverty gap by 0.50 Egyptian pounds, while the normalized poverty gap has not changed. This suggests that OOP have brought some households into poverty, but they have a trivial impact on intensifying poverty. Results based on the $3.10 poverty line suggests that 2.7% of the population in Egypt are impovershed because of the health payments, and the OOP have deepened the poverty gap and the normalized poverty gap by about 12 Egypt pounds, and by 0.6%, respectively.
Table 4.
Measures of poverty in Egypt based on consumption gross and net of spending on healthcare.
Table 4.
Measures of poverty in Egypt based on consumption gross and net of spending on healthcare.
| | Impoverishment at $1.90 per day | Impoverishment at $3.10 per day |
|---|
| | Gross of health payments | Net of health payments | Gross of health payments | Net of health payments |
|---|
| Egypt 1999/2000 |
| Poverty headcount | 1.0 | 1.2 | 14.6 | 16.5 |
| Poverty gap | 0.6 | 0.7 | 23.1 | 27.1 |
| Normalized poverty gap | 0.1 | 0.1 | 2.5 | 2.9 |
| Egypt 2004/2005 |
| Poverty headcount | 0.4 | 0.4 | 7.4 | 8.5 |
| Poverty gap | 0.3 | 0.4 | 12.5 | 14.8 |
| Normalized poverty gap | 0.0 | 0.1 | 1.1 | 1.3 |
| Egypt 2010/2011 |
| Poverty headcount | 0.6 | 1.0 | 10.6 | 13.3 |
| Poverty gap | 1.3 | 1.8 | 42.6 | 56.5 |
| Normalized poverty gap | 0.1 | 0.1 | 1.8 | 2.4 |
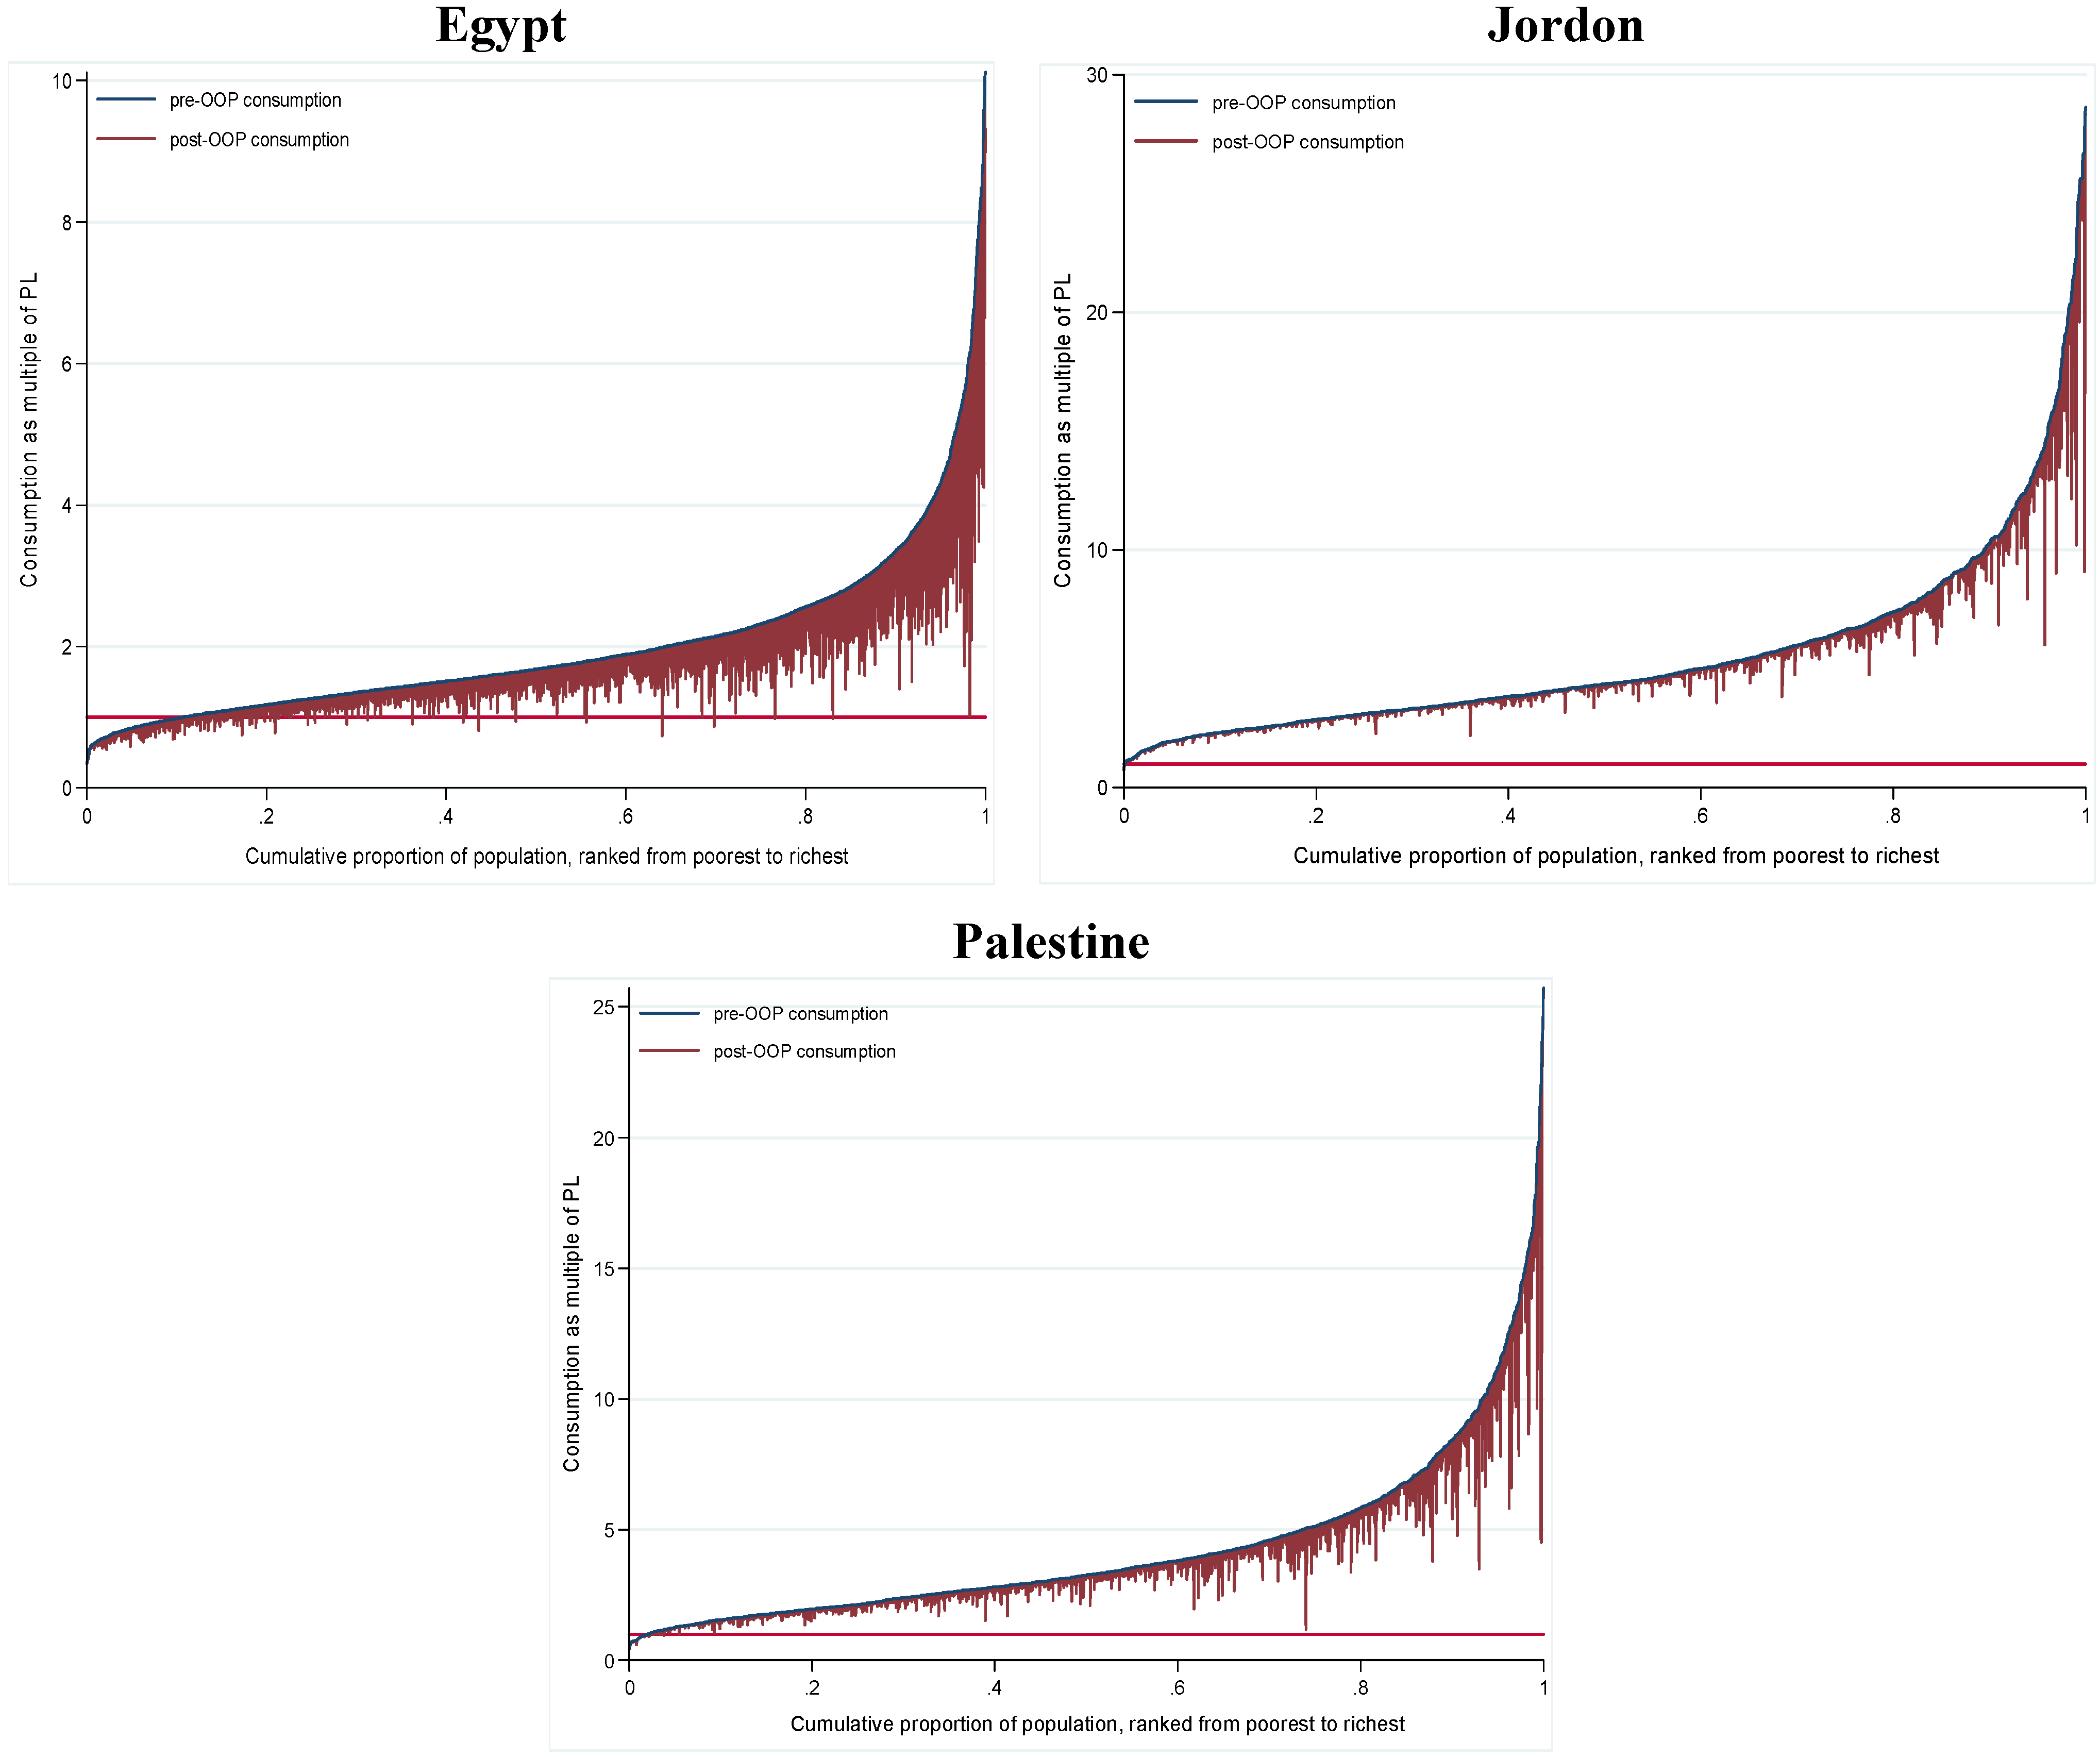
Figure 2 illustrates the impact of OOP on Pen’s Parade of the household consumption expenditure in Egypt, Jordan and Palestine.
9 Household consumption is expressed here as multiples of the $3.10 poverty line. For each household, the vertical bar, or “paint drop”, show the degree to which OOP lower consumption. If the vertical bar crosses the poverty line for a certain household, then this household is brought into poverty because of OOP.
The graph suggests that OOP are the largest among the better off households. However, it is mainly households that live near poverty that are the ones pushed into deprivation. The figure also suggests that even households near the top of income distribution could also end up in poverty because of OOP, as a considerable fraction of the better off is impoverished because of the OOP.
However, in Jordan and Palestine, although OPP lowered the consumption of several middle-income and upper-income households, which indicates a reduction in their economic well being, none of these households is brought into poverty because of the OPP.
Figure 2.
Impact of out-of-pocket health payments (OOP) on Pen’s Parade of the Household Consumption in Egypt, Jordan, and Palestine at 2010. Source: Authors’ compilations based on data from [
20,
28,
31].
Figure 2.
Impact of out-of-pocket health payments (OOP) on Pen’s Parade of the Household Consumption in Egypt, Jordan, and Palestine at 2010. Source: Authors’ compilations based on data from [
20,
28,
31].
7. Discussion and policy Implications
This paper investigated the trend in the extent of catastrophic health payments, and assessed the impoverishment impact of OOP healthcare payments in Egypt, Jordan, and Palestine. The incidence, intensity and distribution of catastrophic health payment were measured by the commonly used methodology in the literature. In this paper, we hypothesized that the conventional methods of measuring poverty, which do not take into account the non-discretionary health spending, underestimate the size of poverty and its severity. Accordingly, we reassessed the measures of poverty in Egypt, at several points of time, using two international poverty lines ($1.90 (PPP) and $3.10 (PPP) per head per day) developed by the World Bank. We find that a considerable percentage of households in Egypt are subject to extreme poverty because of OOP. Moreover, the impoverishment effect of OOP is larger in the year 2011 than in previous periods. We find that there is a negligible to none, effect of OOP on poverty measures in Jordan and Palestine during the study period.
The World Bank has developed two international poverty lines ($1.90 (PPP) per head per day and $3.10 (PPP) per head per day) that are widely used in measuring and comparing poverty across the world. However, these two poverty lines do not adequately incorporate the cost of health needs. They have no special allowance for healthcare needs, as they are a measurement of extreme poverty. Illness can force households to increase their health spending by cutting its food spending below the subsistence level and such household would be counted as non-poor as its total spending exceeds the threshold. Van Doorslaer
et al. (2006) [
8] considered that 78 million persons in Asia are not classified as poor, however, their level of spending are below $1 per head per day after taking out non-discretionary health payments. Therefore, measuring poverty after taking out non-discretionary health payment could be more revealing than the conventional method of measuring poverty (O’Donnell
et al., 2008 [
25]). The findings of the current study support this argument. In addition, this paper provides additional evidence that the share of government spending in total health spending, as opposed to the share of OOP in total health spending, is a key determinant of the prevalence of catastrophic health payments across countries. In Jordan, where the government spends more than 25% of GDP on human capital and funds 68% of total health spending, less than 1% of the population is encountering catastrophic payments for healthcare and 0.1% has impoverishment impact. While in Egypt, where the government is one of the lowest spenders on healthcare compared to middle income countries and OOP are the major funding source of health spending, 22% of households are encountering catastrophic health payments.
One limitation of the current study that arises from non-availability of data is its cross-sectional nature. This limits our ability to examine how the problem of catastrophic health payments and the poverty impact of OOP evolve over time. The availability of longitudinal data in the future would stimulate further research to study the dynamics of the problem under investigation, which will help design more effective policies to tackle the problem. However, in the current study, we tried to get an idea on the evolution of the catastrophic payment incidence and the impoverishment impact of OOP by providing an aggregate time series on financial protection indicators using different rounds of the surveys.
There are other limitations that are directly related to the used methodology. One of these limitations is that the focus is only on OOP, where the lost earnings resulting from the inability to work due to illness, injury or death are not captured, despite the fact that they may be more critical to household welfare (Gertler and Gruber 2002 [
36]). However, the objective of this paper was to assess the degree of financial protection regarding healthcare payments across the three countries, and the lost earnings are not related to the health financing system itself, but to the whole social safety net. Additionally, the used methodology assumes that OOP are involuntary payments that consequently hinder households from using these funds to boost their welfare. With some exceptions, healthcare payments do not usually result from a planned choice by patients; instead, they are usually driven by unanticipated health shocks. In this context, healthcare expenditures cannot be viewed as a regular consumption spending that contributes to household’s utility. Consequently, it sounds reasonable to assume that healthcare payments are non-discretionary payments. Moreover, the adopted approach assumes that households use current income to finance health payment. If households borrow or use savings to finance healthcare payments and smooth current consumption at the expense of future consumption, the assumption that households are necessary impoverished by health payments will no longer stand. The study approach focuses on those who actually pay for healthcare, and ignores those who might be discouraged from using healthcare due to high medical fees. Consequently, the results of the current study could underestimate the impact of health payments on household welfare, and the actual burden of healthcare payments could be larger than the estimates of the current study. Despite these limitations, large healthcare user fees in comparison to household income remain insightful for revealing at least a part of the catastrophic financial consequences of health shocks.
Given that health shocks increase households’ vulnerability and disrupt their livelihood, government intervention is required to correct market failure and to provide health and social protection for the poor. Xu
et al. (2007) [
1] stressed on the importance of government health financing in protecting households from financial catastrophe. They studied the relationship between the incidence of catastrophic expenditure and the size of public health spending in 59 countries. They found a negative correlation between the extent of catastrophic expenditure and the size of public health spending.
The key policy implication of this study is that reducing reliance on OOP in financing healthcare, increasing public health investments, and moving toward universal health coverage should be at the core of any poverty reduction policy to protect vulnerable households from the catastrophic economic consequences of illness. OOP are likely to aggravate the extent of poverty and hence poverty reduction policies should take them into account.


