
Socio-Economic Implications of Drought in the Agricultural Sector and the State Economy

Abstract
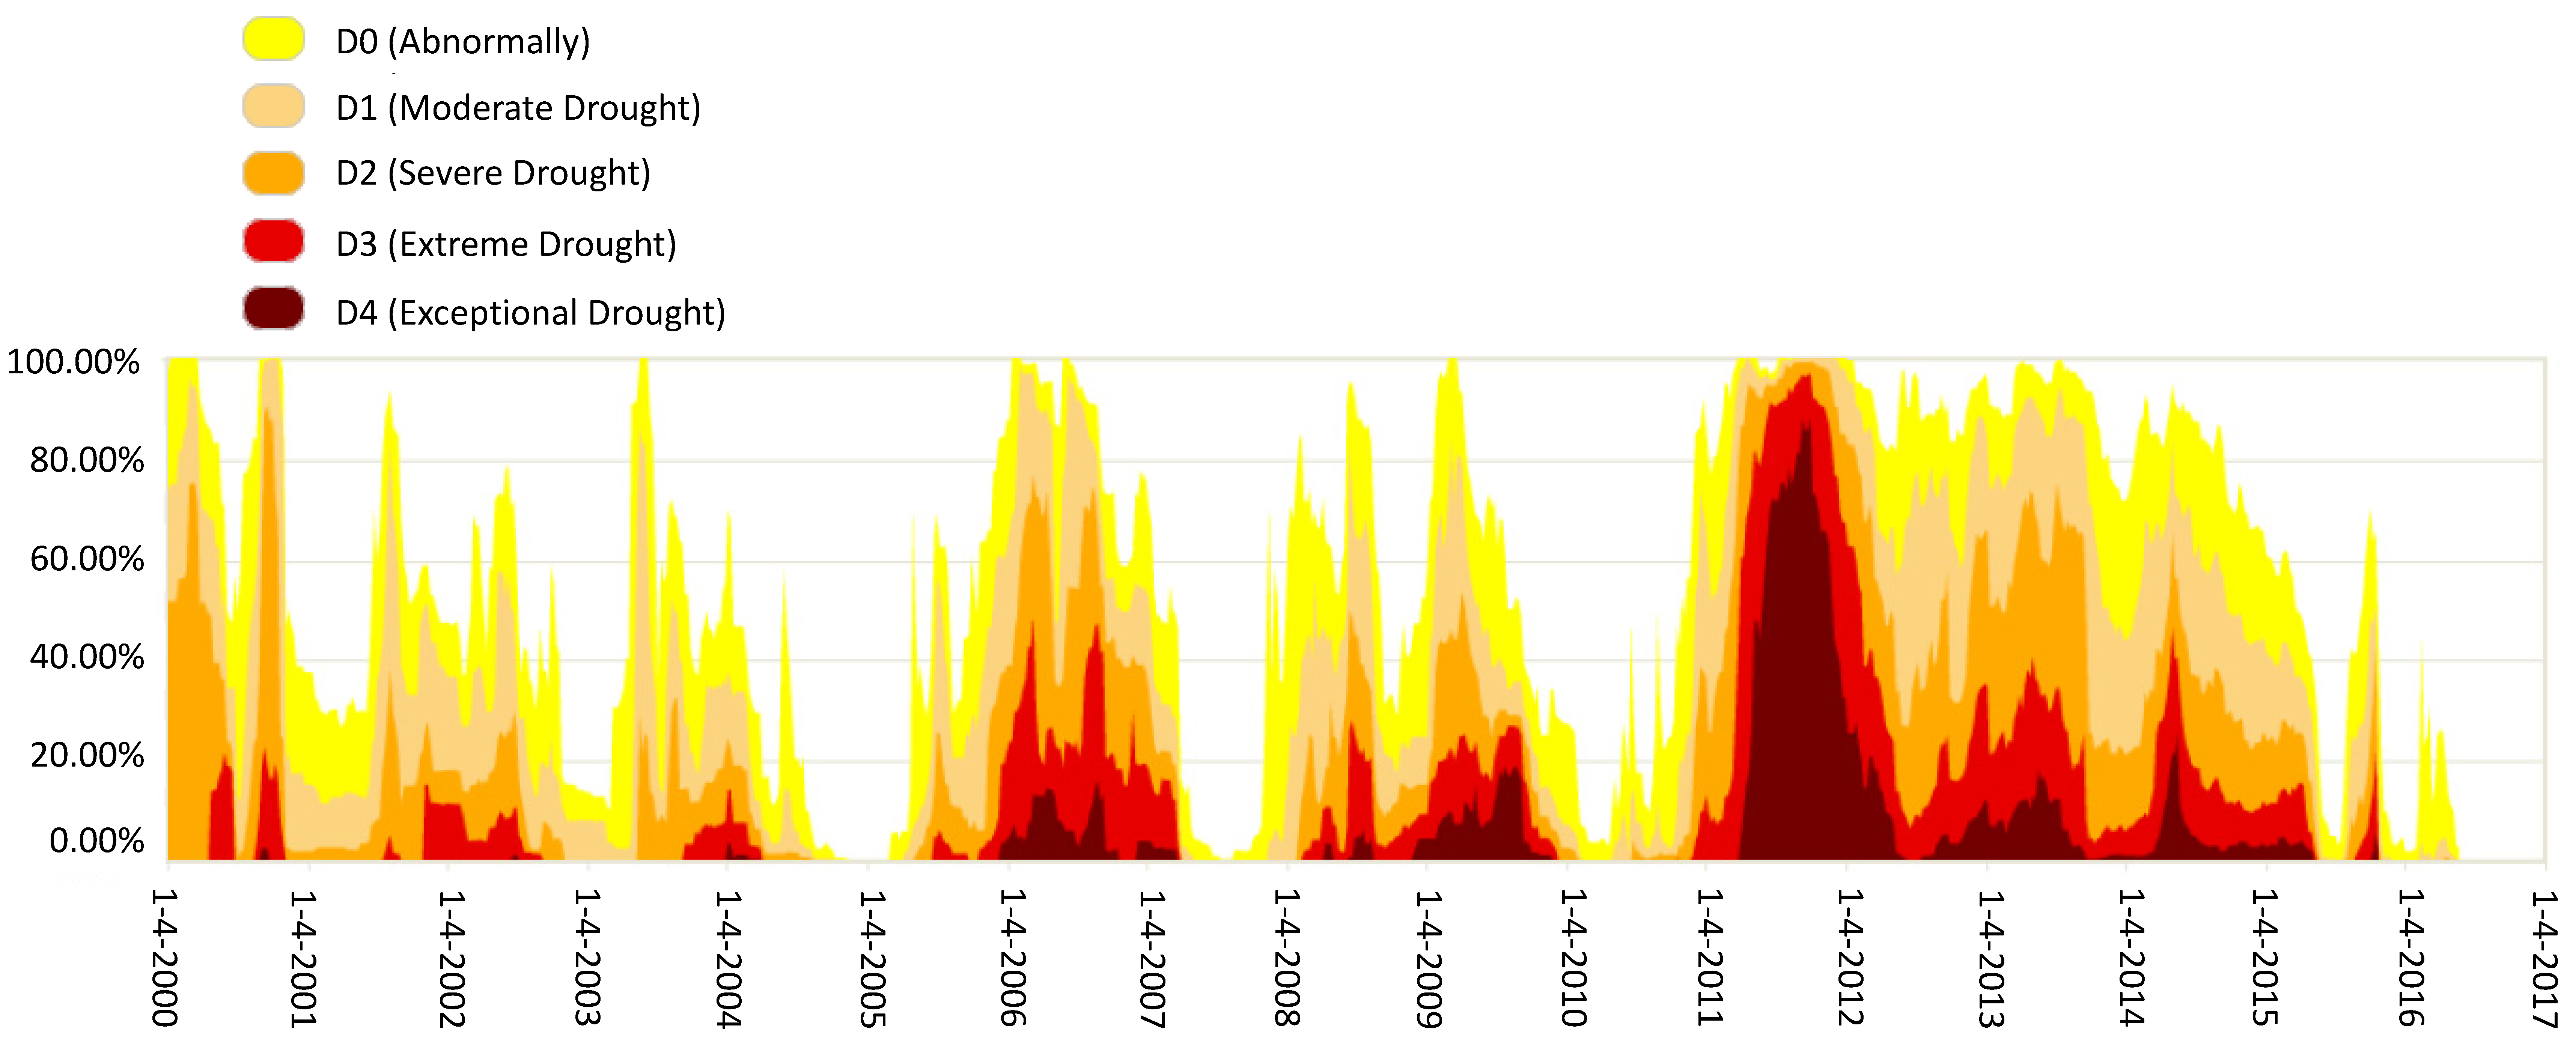
:1. Introduction
2. Problem Setting and Research Objective
- (a)
- Direct effects on livestock, cotton, sorghum, wheat, corn, hay, and timber production,
- (b)
- Indirect effects on other related sectors providing materials and production factors for the agricultural sector, and
- (c)
- Induced effects denoting changes in household incomes due to changes in agricultural sector employment or employment in related sectors.
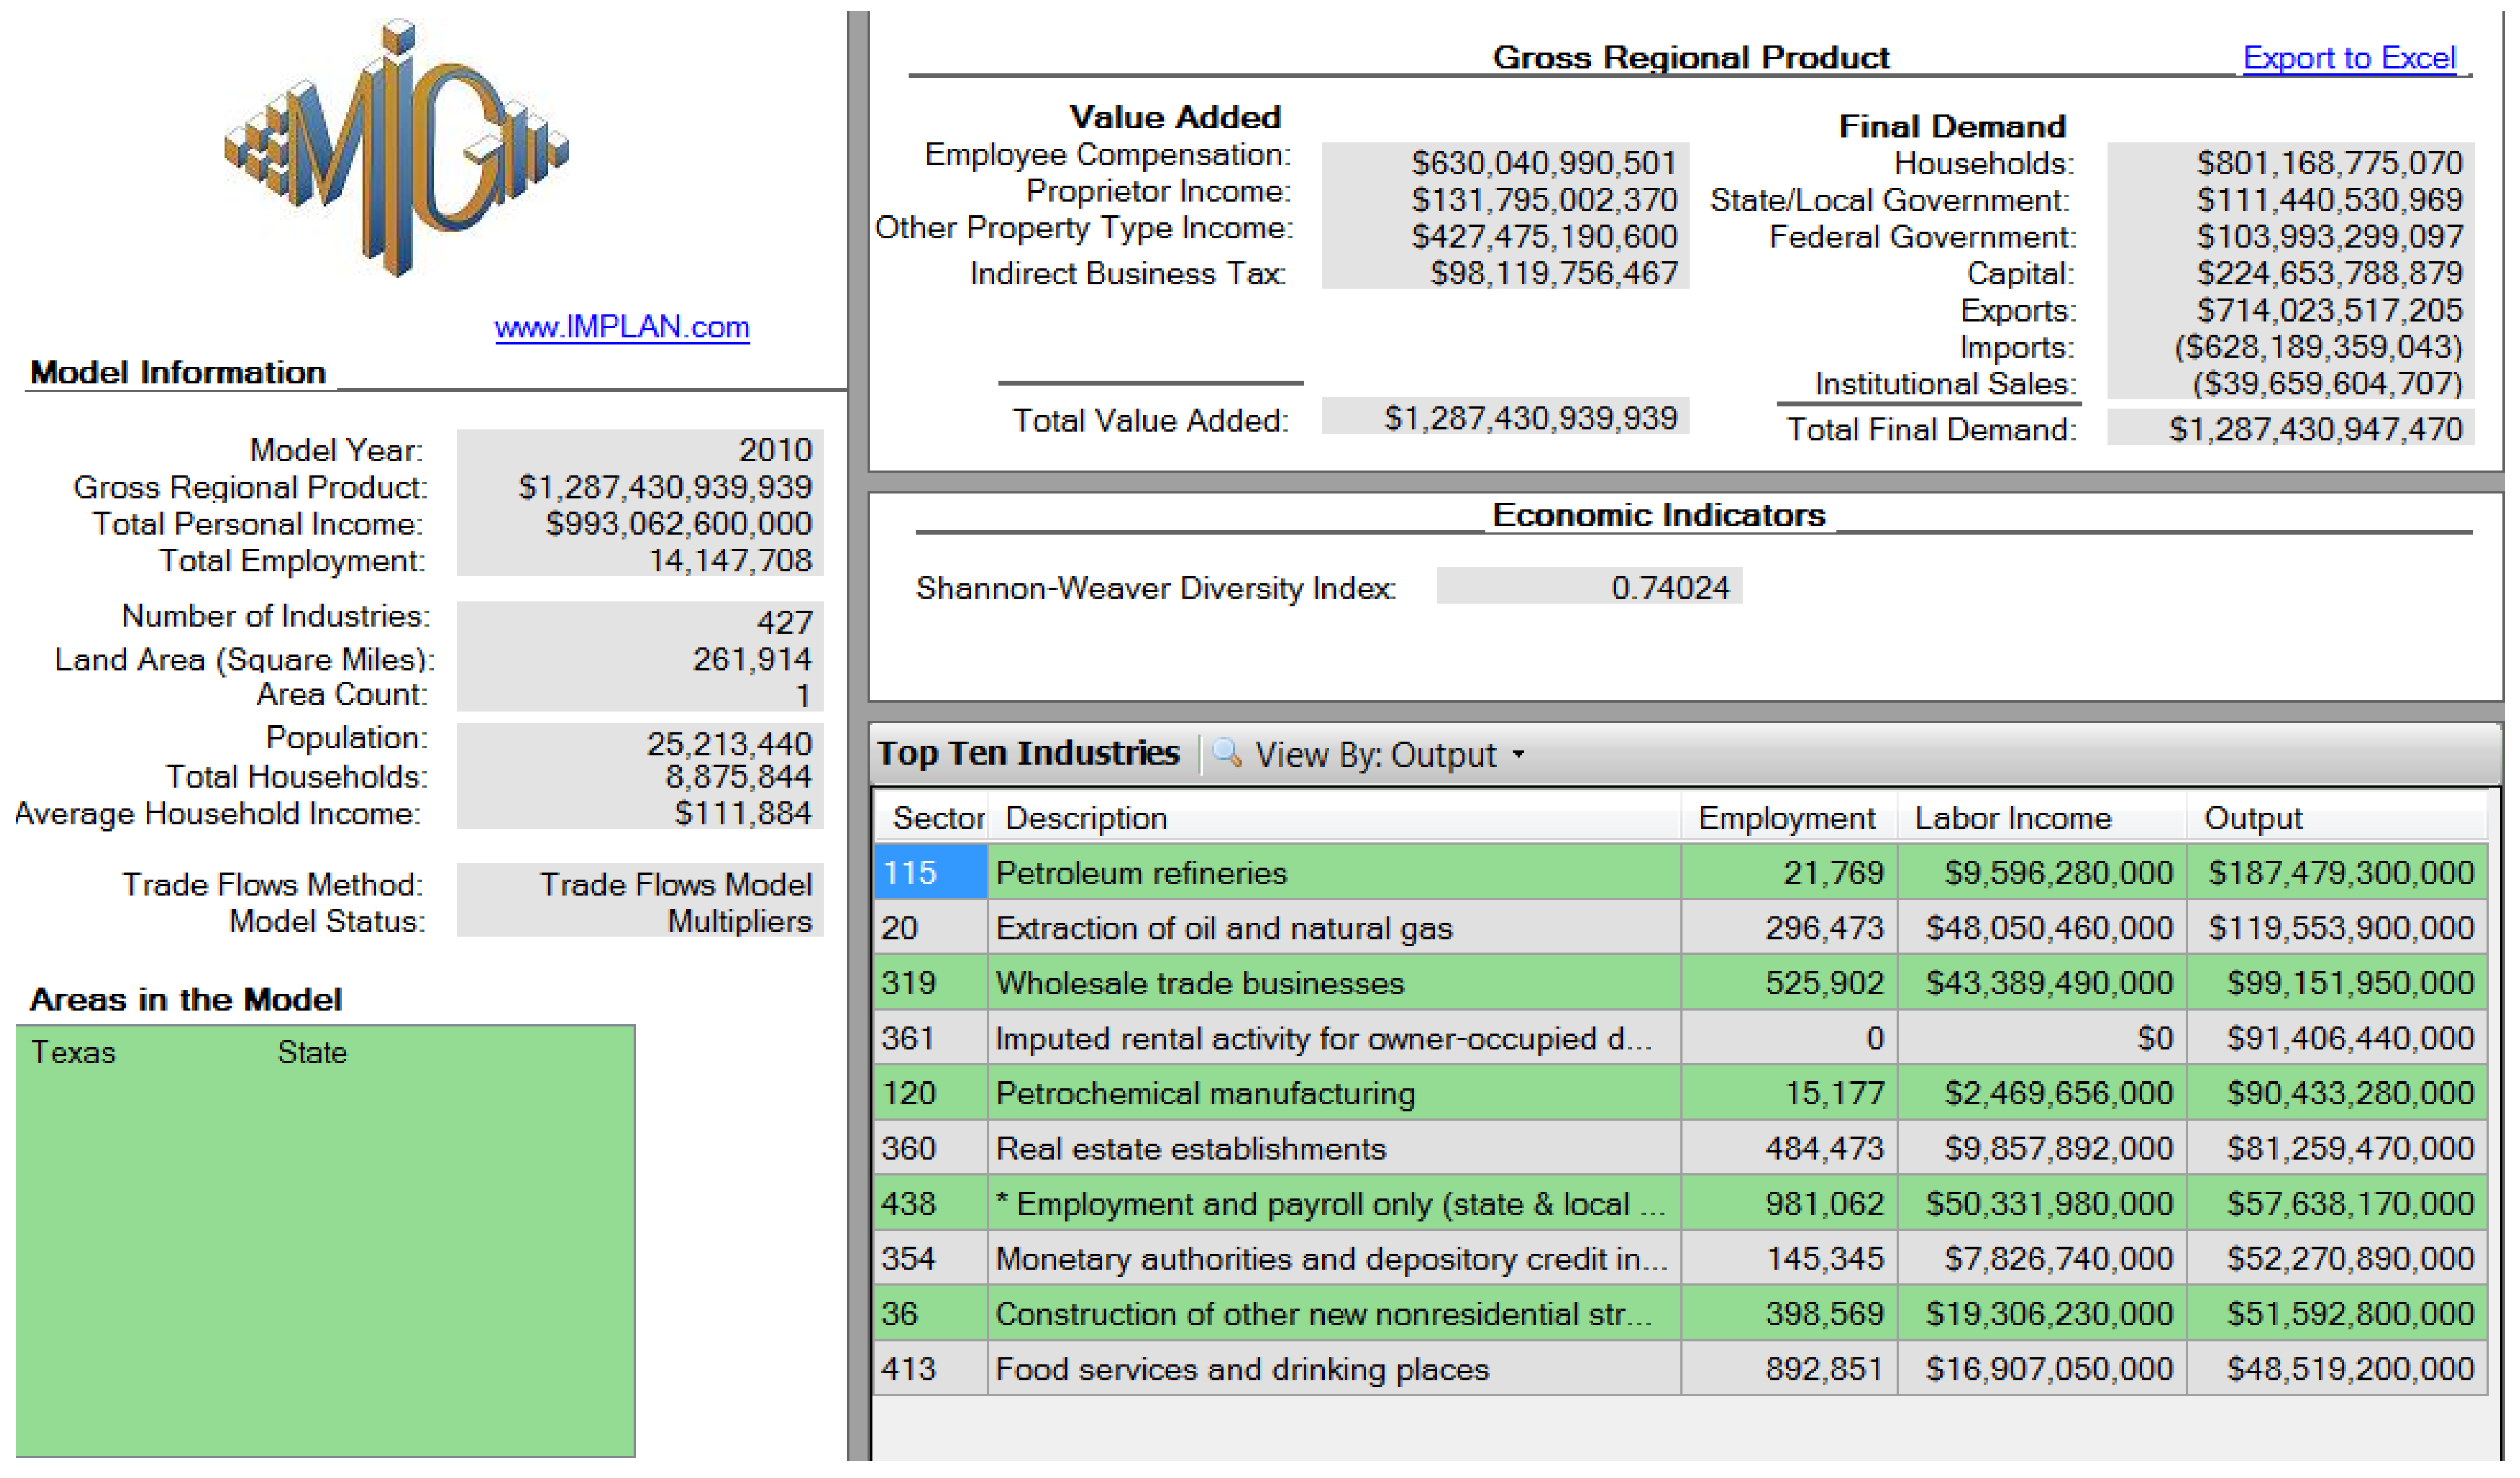
3. Methodology and Data
- —technical coefficient
- —demand for output from industry i by industry j
- —value of goods produced by industry j
- X—n × 1 vector of gross output (sales matrix)
- Y—n × 1 vector of final demand
- A—n × n matrix of input coefficients aij with n sectors in the economy (coefficient matrix)
- I—identity matrix
- N—total employment
- —direct employment coefficient (calculated from estimates of employment and output).
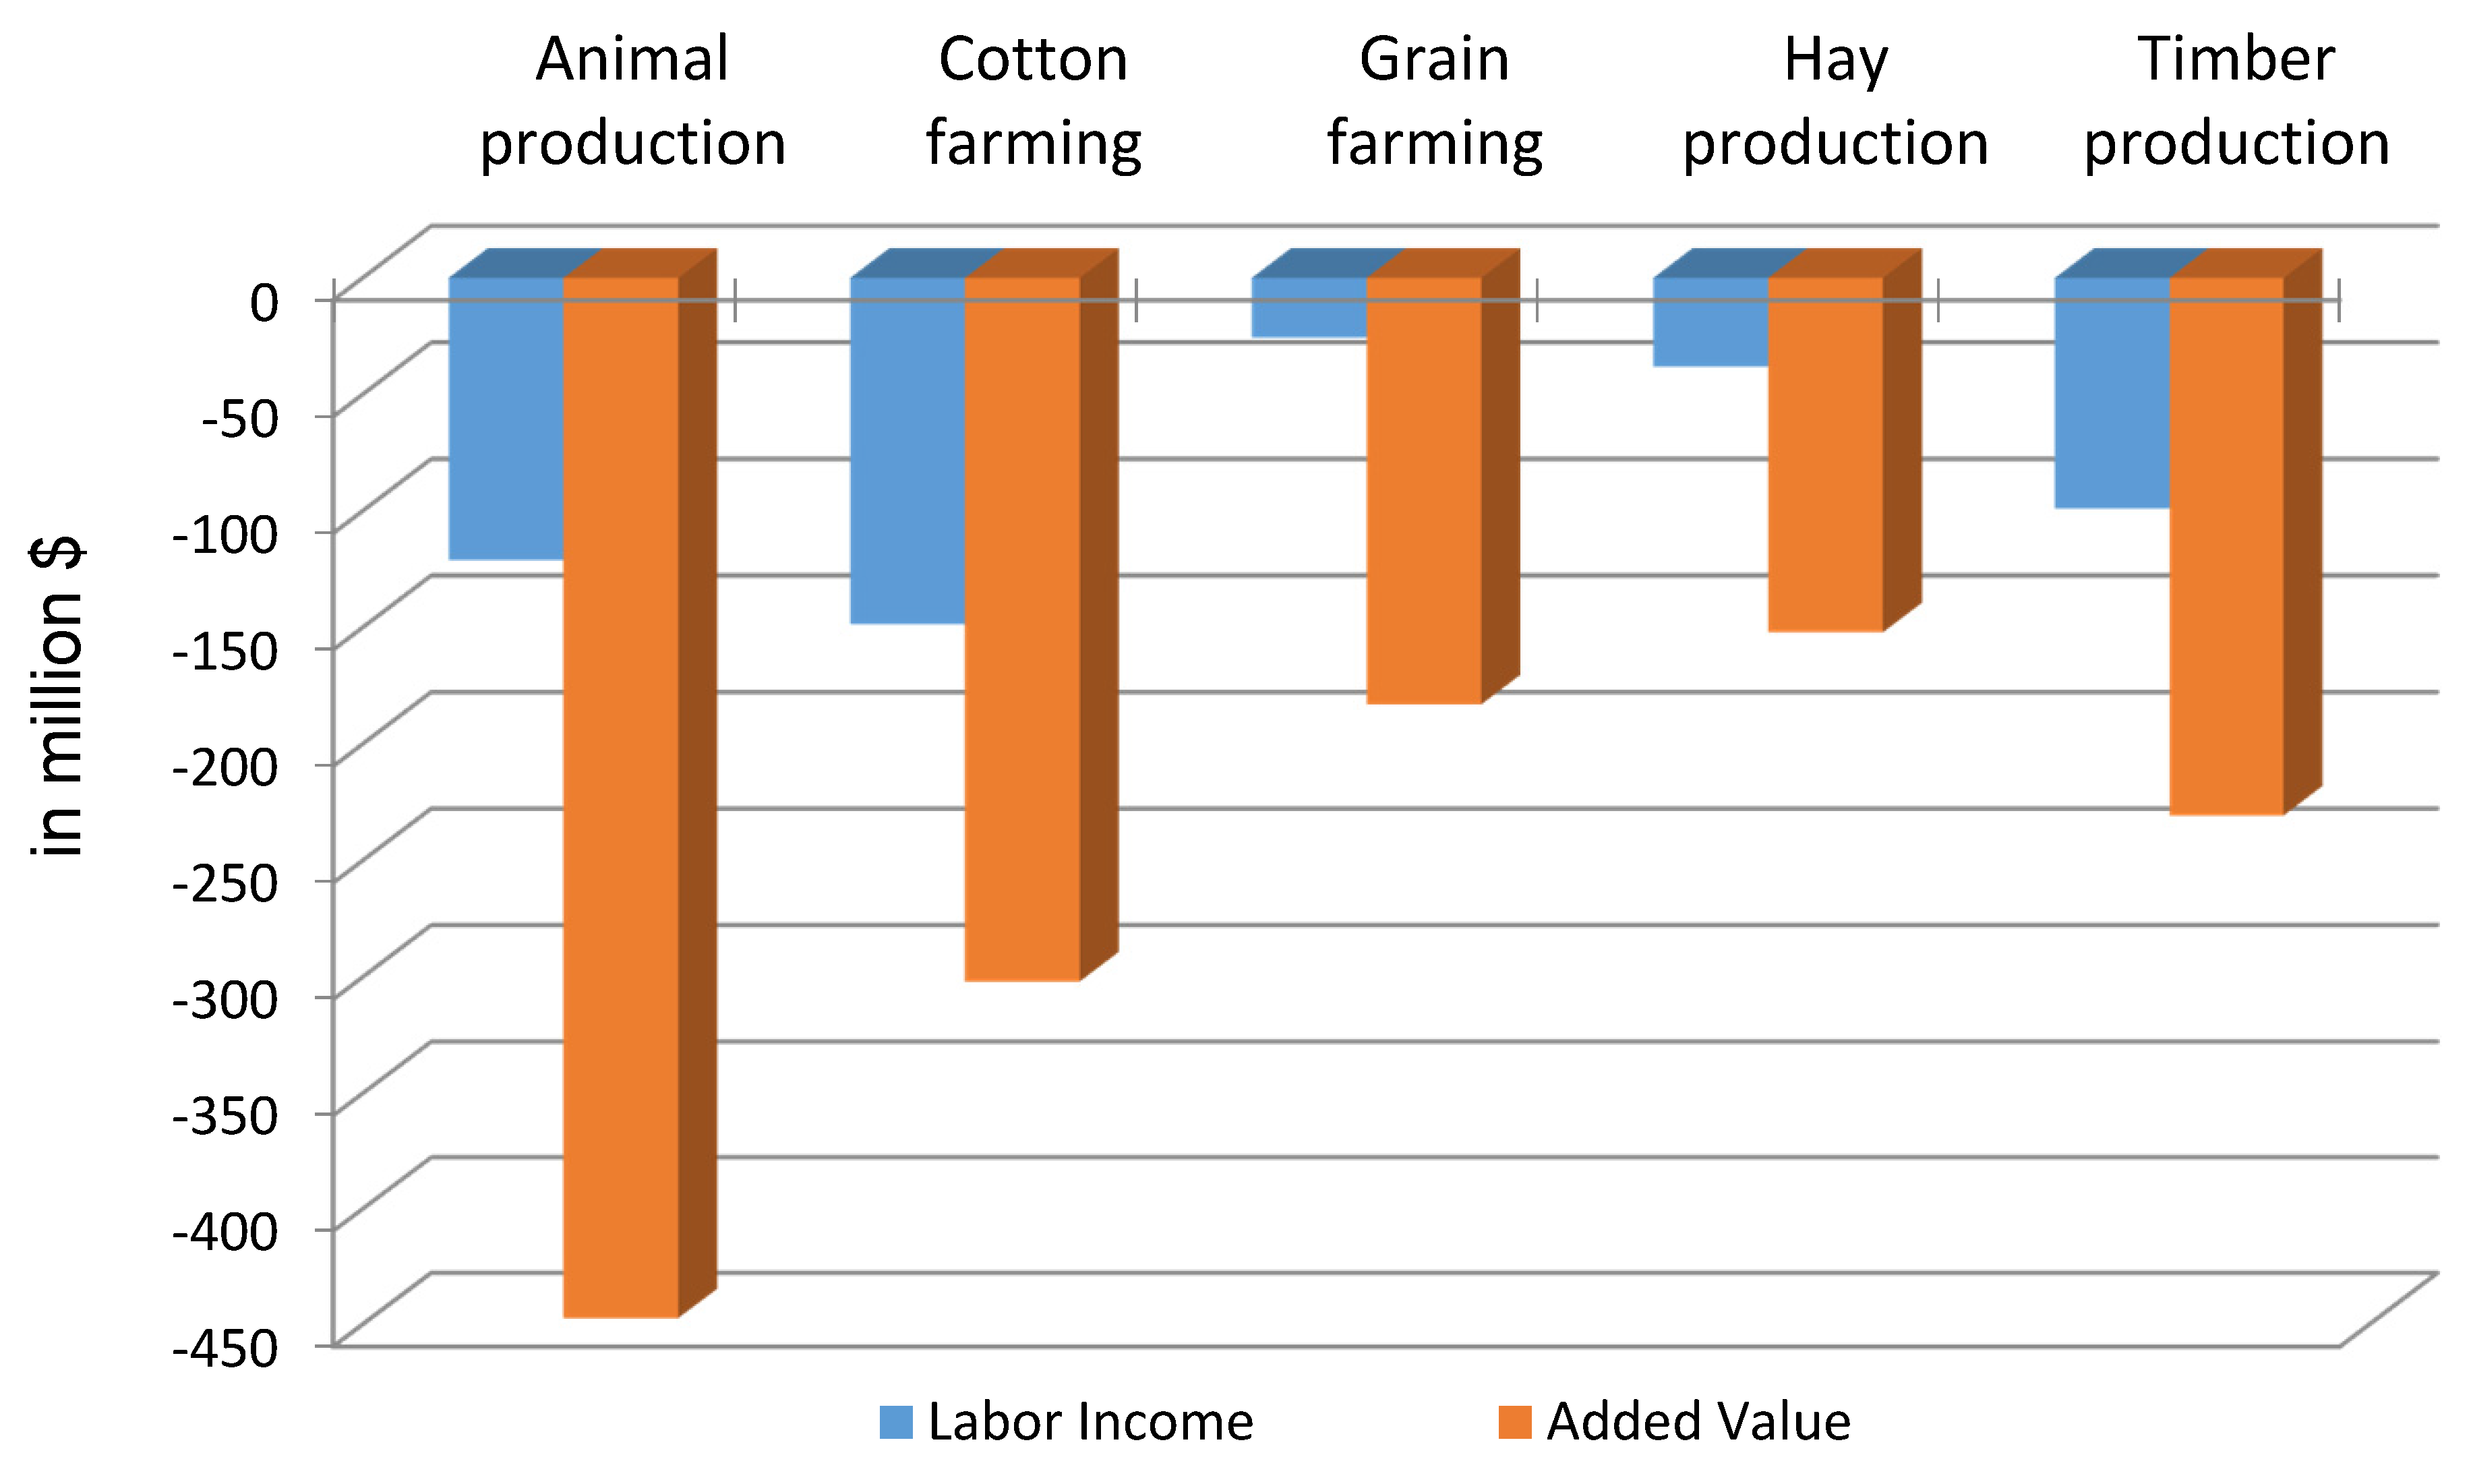
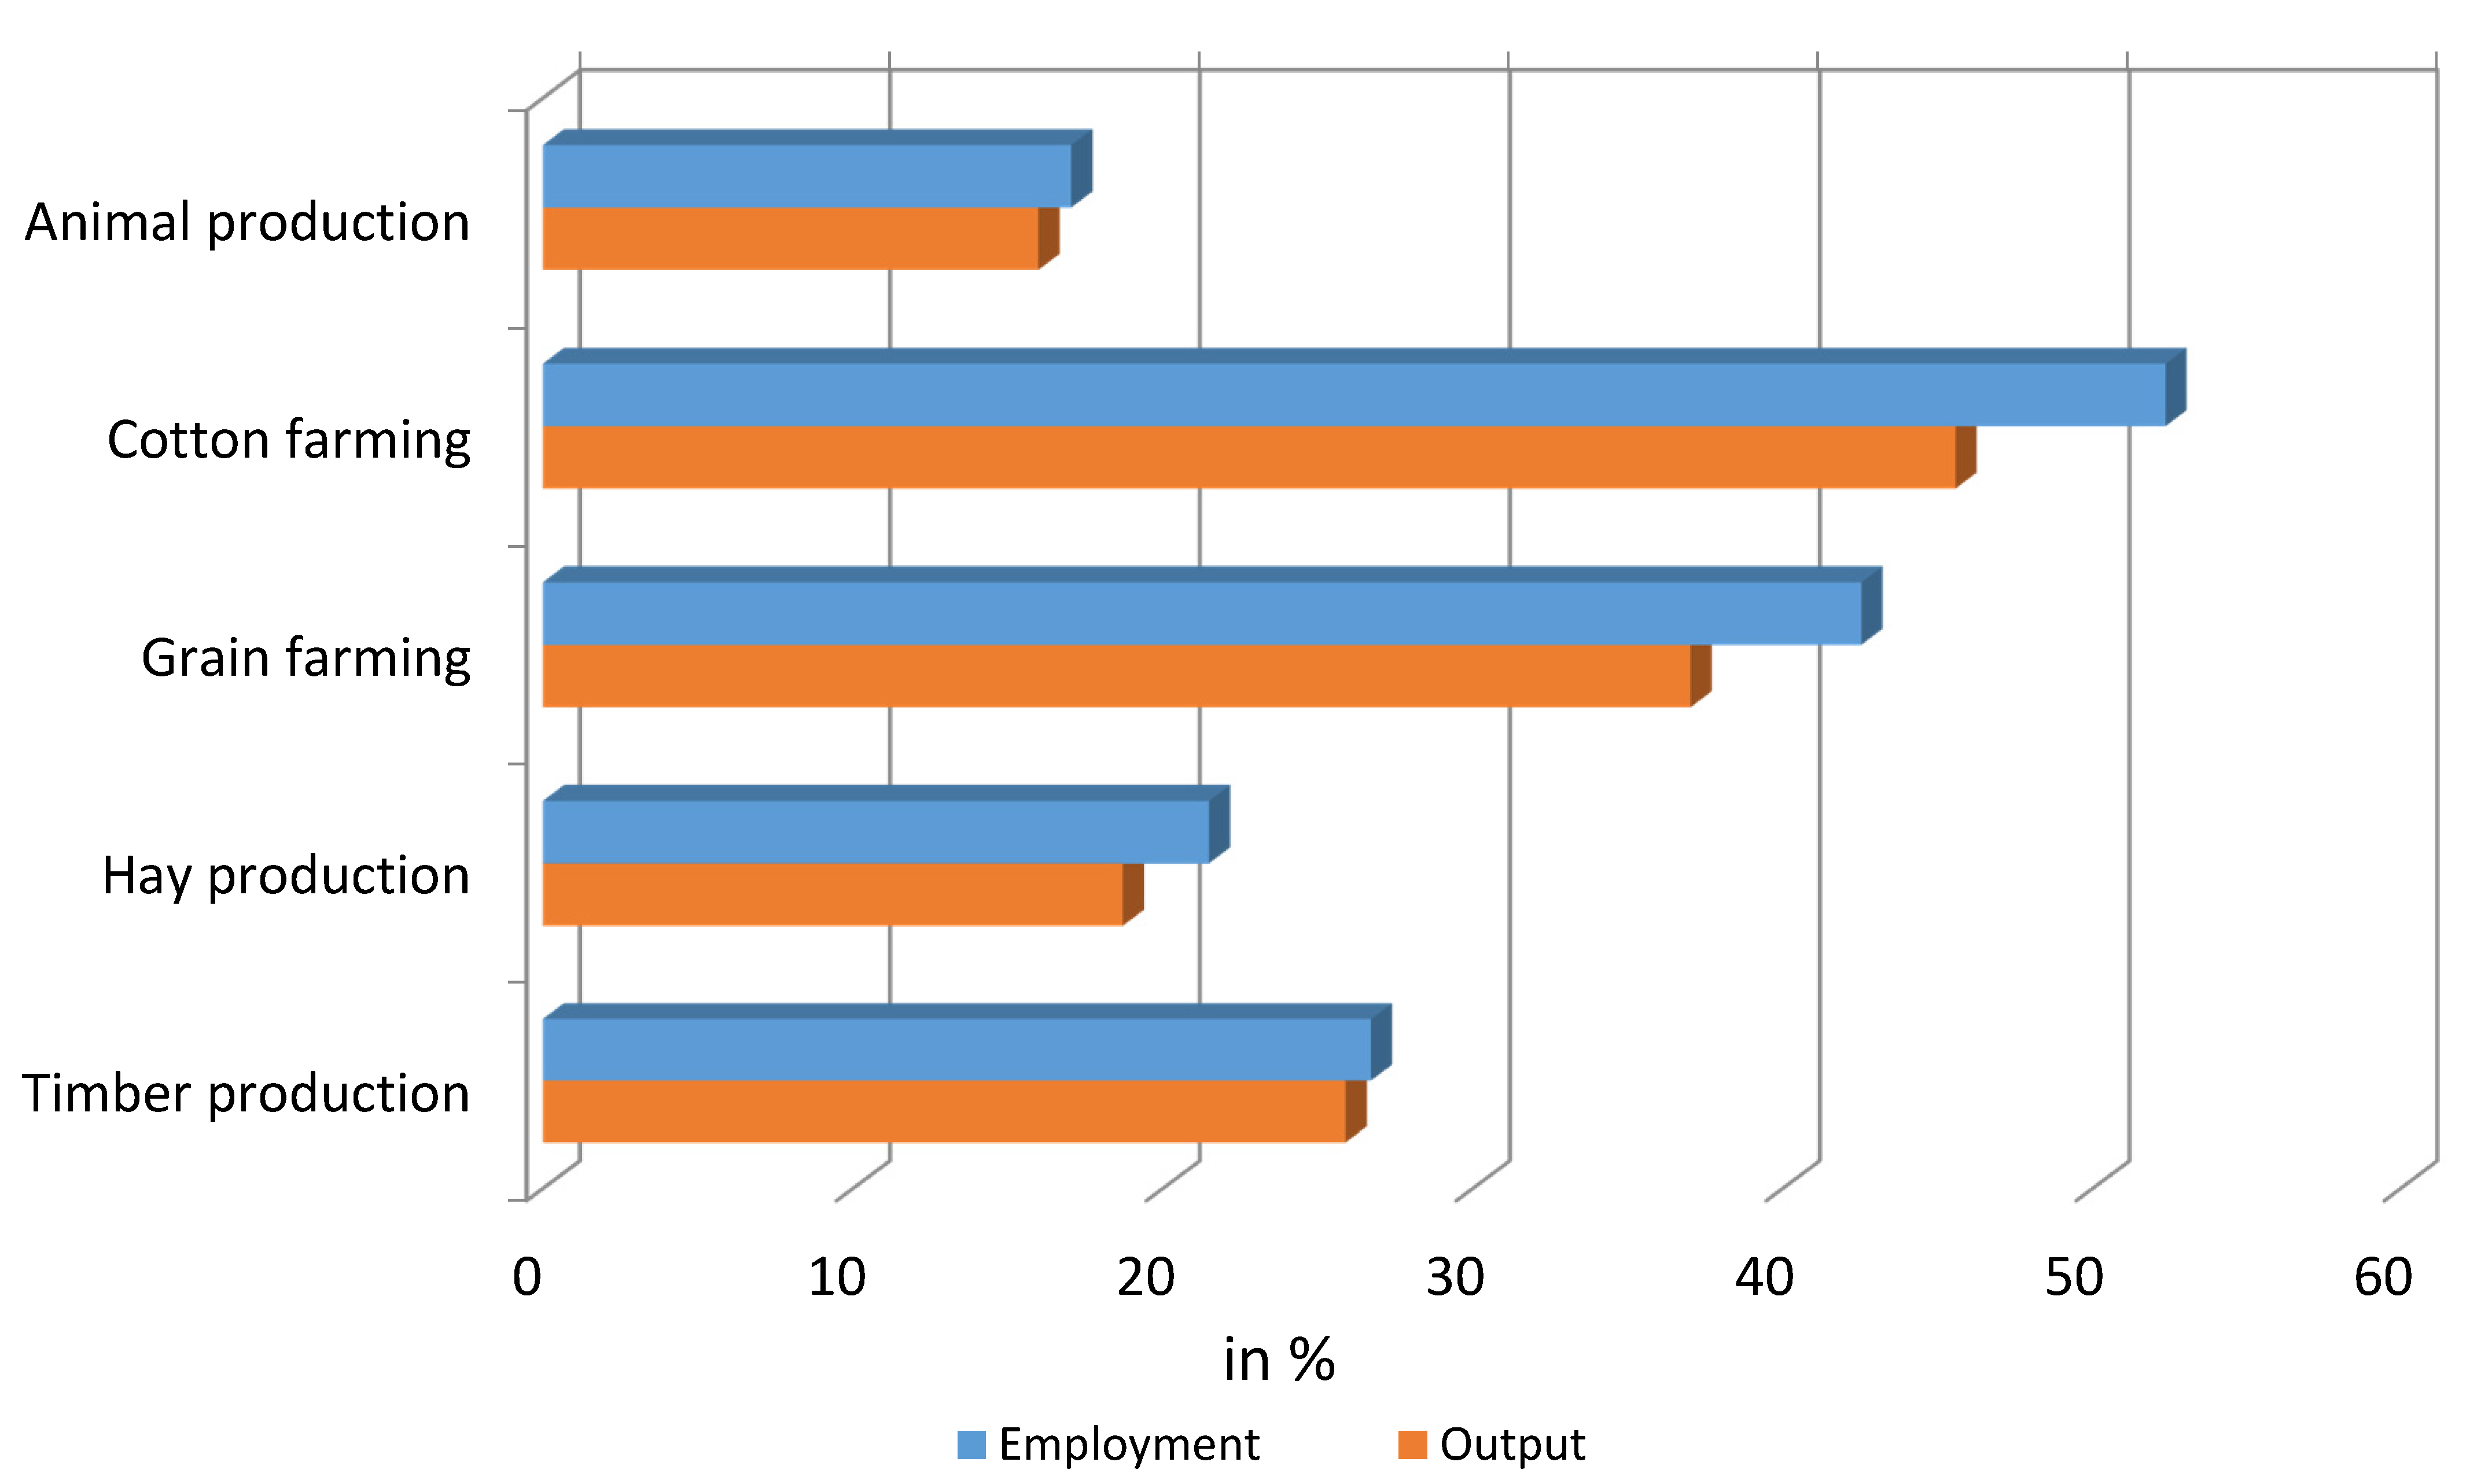
4. Results and Discussion
5. Summary and Conclusions
Acknowledgments
Conflicts of Interest
References
- S. Combs. The Impact of the 2011 Drought and Beyond; Austin, TX, USA: Texas Comptroller of Public Accounts, 2012.
- B. Fannin. “Updated 2011 Texas Agricultural Drought Losses Total $7.62 Billion.” Texas A&M AgriLife Today. Available online: http://today.agrilife.org/2012/03/21/updated-2011-texas-agricultural-drought-losses-total-7-62-billion/ (accessed on 21 March 2012).
- B. Guerrero. The Impact of Agricultural Drought Losses on the Texas Economy. Briefing Paper Updated 4/2/2012; College Station, TX, USA: AgriLife Extension, Texas A&M University, 2012. [Google Scholar]
- BEA (Bureau of Economic Analysis). Regional Data for Texas; Washington, DC, USA: US Department of Commerce, BEA, 2016.
- Field To Market Alliance. “Agricultural Contribution to National and State GDP.” Available online: https://www.fieldtomarket.org/report/national-2/PNT_NatReport_Socioeconomic_AgriContributionToNatlAndStateGDP.pdf (accessed on 29 May 2016).
- TWDB (Texas Water Development Board). Water for Texas 2012 State Water Plan; Austin, TX, USA: TWDB, 2012.
- TDA (Texas Department of Agriculture). Texas Agriculture Facts; Austin, TX, USA: TDA, 2013.
- LCRA (Lower Colorado River Association). “Customers with Contracts for “Firm” Raw Water Supplies from LCRA.” 2011. Available online: http://www.lcra.org/water/water-supply/water-supply-contracts/Documents/firm_contracts.pdf (accessed on 15 April 2015).
- ClimateWatch. “Brazos River Runs Dry during Texas Drought. ” Available online: https://www.climate.gov/news-features/featured-images/brazos-river-runs-dry-during-texas-drought (accessed on 17 September 2015).
- StateImpact. “By the Numbers: Texas’ Long Heat Wave.” Available online: https://stateimpact.npr.org/texas/2012/11/08/by-the-numbers-texas-long-heat-wave/ (accessed on 23 August 2016).
- National Drought Mitigation Center. “U.S. Drought Monitor Statistics Graph—Texas.” Available online: http://droughtmonitor.unl.edu/MapsAndData/Graph.aspx (accessed on 29 May 2016).
- K. Venkataraman, S. Tummuri, A. Medina, and J. Perry. “21st century drought outlook for major climate divisions of Texas based on CMIP5 multimodel ensemble: Implications for water resource management.” J. Hydrol. 534 (2016): 300–316. [Google Scholar] [CrossRef]
- S.A. Miller, and G.C. Shank. “Influence of severe drought conditions on chromophoric dissolved organic matter dynamics in south Texas coastal waters.” Estuar. Coast. Shelf Sci. 117 (2013): 219–226. [Google Scholar] [CrossRef]
- V. Acosta-Martinez, J. Moore-Kucera, J. Cotton, T. Gardner, and D. Wester. “Soil enzyme activities during the 2011 Texas record drought/heat wave and implications to biogeochemical cycling and organic matter dynamics.” Appl. Soil Ecol. 75 (2014): 43–51. [Google Scholar] [CrossRef]
- B. Lebreton, J. Beseres Pollack, B. Blomberg, T.A. Palmer, L. Adams, G. Guillou, and P.A. Montagna. “Origin, composition and quality of suspended particulate organic matter in relation to freshwater inflow in a South Texas estuary.” Estuar. Coast. Shelf Sci. 170 (2016): 70–82. [Google Scholar] [CrossRef]
- A.M. Schwantes, J.J. Swenson, and R.B. Jackson. “Quantifying drought-induced tree mortality in the open canopy woodlands of central Texas.” Remote Sens. Environ. 181 (2016): 54–64. [Google Scholar] [CrossRef]
- S. Amossen. “State Drought Losses Have Significant Impact on Overall Economy.” Available online: http://potter.agrilife.org/files/2011/04/drought-loss-economy-impact.pdf (accessed on 19 August 2016).
- H. Chu, J. Chen, J.F. Gottgens, A.R. Desai, Z. Ouyang, and S.S. Qian. “Response and biophysical regulation of carbon dioxide fluxes to climate variability and anomaly in contrasting ecosystems in northwestern Ohio, USA.” Agric. For. Meteorol. 220 (2016): 50–68. [Google Scholar] [CrossRef]
- C. Jiang, D. Li, D. Wang, and L. Zhang. “Quantification and assessment of changes in ecosystem service in the Three-River Headwaters Region, China as a result of climate variability and land cover change.” Ecol. Indic 66 (2016): 199–211. [Google Scholar] [CrossRef]
- A.A. Gohar, and A. Cashman. “A methodology to assess the impact of climate variability and change on water resources, food security and economic welfare.” Agric. Syst. 147 (2016): 51–64. [Google Scholar] [CrossRef]
- M. Jahn. “Economics of extreme weather events: Terminology and regional impact models.” Weather Clim Extrem. 10 (2015): 29–39. [Google Scholar] [CrossRef]
- M. Mastrorillo, R. Licker, P. Bohra-Mishra, G. Fagiolo, L.D. Estes, and M. Oppenheimer. “The influence of climate variability on internal migration flows in South Africa.” Glob. Environ. Chang. 39 (2016): 155–169. [Google Scholar] [CrossRef]
- T. Wossen, and T. Berger. “Climate variability, food security and poverty: Agent-based assessment of policy options for farm households in Northern Ghana.” Environ. Sci. Policy 47 (2015): 95–107. [Google Scholar] [CrossRef]
- TWDB. “Historical Water Use Estimates. Annual Statewide Water Use.” Austin, TX, USA: TWDB, 2015. Available online: http://www.twdb.texas.gov/waterplanning/waterusesurvey/estimates/ (accessed on 29 May 2016). [Google Scholar]
- Minnesota IMPLAN Group. IMPLAN Professional, version 3.0; Stillwater, MN, USA: IMPLAN Group, 2009.
- US Census Bureau. “North American Industry Classification System. ” Available online: http://www.census.gov/eos/www/naics/ (accessed on 29 May 2016).
- S. Liang, Z. Qi, S. Qu, J. Zhu, A.S.F. Chiu, X. Jia, and M. Xu. “Scaling of global input–output networks.” Phys. A Stat. Mech. Its Appl. 452 (2016): 311–319. [Google Scholar] [CrossRef]
- J. Song, W. Yang, Z. Li, Y. Higano, and X. Wang. “Discovering the energy, economic and environmental potentials of urban wastes: An input–output model for a metropolis case.” Energy Convers. Manag. 114 (2016): 168–179. [Google Scholar] [CrossRef]
- X. Tao, P. Wang, and B. Zhu. “Provincial green economic efficiency of China: A non-separable input–output SBM approach.” Appl. Energy 171 (2016): 58–66. [Google Scholar] [CrossRef]
- X. Wang, K. Huang, Y. Yu, T. Hu, and Y. Xu. “An input–output structural decomposition analysis of changes in sectoral water footprint in China.” Ecol. Indic. 69 (2016): 26–34. [Google Scholar] [CrossRef]
- J. Yan, T. Zhao, and J. Kang. “Sensitivity analysis of technology and supply change for CO2 emission intensity of energy-intensive industries based on input–output model.” Appl. Energy 171 (2016): 456–467. [Google Scholar] [CrossRef]
- D.M. Yazan, V.A. Romano, and V. Albino. “The design of industrial symbiosis: An input–output approach.” J. Clean. Prod. 129 (2016): 537–547. [Google Scholar] [CrossRef]
- B.L. Guerrero. “Renewable Energy and Agriculture.” Ph.D. Thesis, Texas A&M University, College Station, TX, USA, 2010. [Google Scholar]
- R. Miller, and P. Blair. Input-Output Analysis, 2nd ed. Cambridge, UK: Cambridge University Press, 2009. [Google Scholar]
- R.A. Chase, P.J. Bourque, and R.S. Conway Jr. The 1987 Washington State Input-Output Study; Washington, DC, USA: Washington State Office of Financial Management, 1993.
- F. Duchin, and S.H. Levineb. “Sectors May Use Multiple Technologies Simultaneously: The Rectangular Choice-Of-Technology Model with Binding Factor Constraints.” Econ. Syst. Res. 23 (2011): 281–302. [Google Scholar] [CrossRef]
- A.I.J.M. Van Dijk, H.E. Beck, R.S. Crosbie, R.A.M. De Jeu, Y.Y. Liu, G.M. Podger, B. Timbal, and N.R. Viney. “The Millennium Drought in southeast Australia (2001–2009): Natural and human causes and implications for water resources, ecosystems, economy, and society.” Water Resour. Res. 49 (2013): 1040–1057. [Google Scholar] [CrossRef]
- N.R. Bond, P.S. Lake, and A.H. Arthington. “The impacts of drought on freshwater ecosystems: An Australian perspective.” Hydrobiologia 600 (2008): 3–16. [Google Scholar] [CrossRef]
- M. Kirby, R. Bark, J. Connor, M.E. Qureshi, and S. Keyworth. “Sustainable irrigation: How did irrigated agriculture in Australia’s Murray–Darling Basin adapt in the Millennium Drought? ” Agric. Water Manag. 145 (2014): 154–162. [Google Scholar] [CrossRef]
- D.A. Wilhite, M.V.K. Sivakumar, and R. Pulwarty. “Managing drought risk in a changing climate: The role of national drought policy.” Weather Clim. Extrem. 3 (2014): 4–13. [Google Scholar] [CrossRef]
- R.C. Stone. “Constructing a framework for national drought policy: The way forward—The way Australia developed and implemented the national drought policy.” Weather Clim. Extrem. 3 (2014): 117–125. [Google Scholar] [CrossRef]
- 1One acre-foot = 325,851 gallons = 1233.5 m3


| Sector | Production Losses (Billion $) |
|---|---|
| Livestock (beef, poultry, dairy) | 3.230 |
| Cotton | 2.200 |
| Hay | 0.750 |
| Corn | 0.736 |
| Timber | 0.669 |
| Sorghum | 0.385 |
| Wheat | 0.314 |
| NAICS Classification | Sector Description | Notes |
|---|---|---|
| 111140 | Wheat farming | Establishments primarily engaged in growing wheat and/or producing wheat seeds |
| 111150 | Corn farming | Establishments primarily engaged in growing corn (except sweet corn) and/or producing corn seeds |
| 111199 | All other grain farming | Establishments primarily engaged in growing grains and/or producing grain(s) seeds (except wheat, corn, rice, and oilseed(s) and grain(s) combinations: barley farming, sorghum farming, oat farming, wild rice farming, rye farming) |
| 111920 | Cotton farming | Establishments primarily engaged in growing cotton (field and seed production, cottonseed farming) |
| 111940 | Hay farming | Establishments primarily engaged in growing hay, alfalfa, clover, and/or mixed hay |
| 112111 | Beef cattle ranching and farming | Establishments primarily engaged in raising cattle (including cattle for dairy herd replacements, calf e.g., feeder, stocker, veal production, cattle farming and ranching) |
| 112120 | Dairy cattle and milk production | Establishments primarily engaged in milking dairy cattle |
| 112990 | All other animal production | Establishments primarily engaged in: (1) raising animals (except cattle, hogs and pigs, poultry, sheep and goats, aquaculture, apiculture, horses and other equines; and fur-bearing animals including rabbits); or (2) raising a combination of animals, with no one animal or family of animals accounting for one-half of the establishment’s agricultural production (i.e., value of animals for market) |
| Impact Type | Employment (Number of Jobs) | Labor Income (million $) | Value Added (million $) | Output (million $) |
|---|---|---|---|---|
| Direct Effect | −106,437 | −679.8 | −2,076.3 | −8,284.0 |
| Indirect Effect | −42,305 | −1,567.8 | −3,197.8 | −6,349.2 |
| Induced Effect | −18,152 | −784.8 | −1,449.7 | −2,354.1 |
| Total Effect | −166,895 | −3,032.5 | −6,723.8 | −16,987.3 |
| Sector | Output | Employment | Labor Income | Value Added |
|---|---|---|---|---|
| Animal production | −1,879,060,031.0 | −21,536.1 | −121,140,146.3 | −467,285,634.0 |
| Cotton farming | −1,182,467,677.1 | −9,575.1 | −148,549,278.8 | −301,873,250.1 |
| Grain farming | −744,123,868.3 | −23,735.4 | −25,727,207.8 | −183,031,797.1 |
| Real estate establishments | −636,770,117.9 | −3,124.3 | −71,726,939.7 | −525,831,927.7 |
| All other crop farming | −404,231,345.9 | −3,276.0 | −38,022,754.4 | −152,115,509.7 |
| Monetary authorities | −371,945,465.9 | −900.5 | −54,709,361.1 | −170,040,444.4 |
| Greenhouse, nursery, floriculture | −358,650,052.4 | −4,252.0 | −99,070,457.4 | −230,717,436.6 |
| Petroleum refineries | −269,598,753.9 | −28.6 | −14,201,177.9 | −63,928,043.4 |
| Support activities for agriculture and forestry | −241,595,456.6 | −6,588.7 | −211,986,277.3 | −207,506,141.4 |
| Other animal food manufacturing | −217,507,893.2 | −227.8 | −13,278,861.9 | −34,796,398.8 |
© 2016 by the author; licensee MDPI, Basel, Switzerland. This article is an open access article distributed under the terms and conditions of the Creative Commons Attribution (CC-BY) license (http://creativecommons.org/licenses/by/4.0/).
Share and Cite
Ziolkowska, J.R. Socio-Economic Implications of Drought in the Agricultural Sector and the State Economy. Economies 2016, 4, 19. https://doi.org/10.3390/economies4030019
Ziolkowska JR. Socio-Economic Implications of Drought in the Agricultural Sector and the State Economy. Economies. 2016; 4(3):19. https://doi.org/10.3390/economies4030019
Chicago/Turabian StyleZiolkowska, Jadwiga R. 2016. "Socio-Economic Implications of Drought in the Agricultural Sector and the State Economy" Economies 4, no. 3: 19. https://doi.org/10.3390/economies4030019
APA StyleZiolkowska, J. R. (2016). Socio-Economic Implications of Drought in the Agricultural Sector and the State Economy. Economies, 4(3), 19. https://doi.org/10.3390/economies4030019