1. Introduction
Mineral resources can provide opportunities for economic development. For many low-income and developing countries, natural-resource revenues have been an important source of the government income (
Berg et al. 2013), though all face similar constraints: the level of infrastructure is poor and domestic capital scarcity can lead into huge borrowing constraints. The minerals price increase in the global market or new mineral discoveries could generate significant fiscal income that, if well managed, could finance public and foreign investment and enhance economic development.
Mongolia is one of the 29 resource-rich developing countries identified by the International Monetary Fund (
Ghura and Pattillo 2012), and exploration of copper and coal deposits are generating substantial additional revenue. Fiscal revenues from mining represent 21 percent of government income in 2010, a figure rose to 24 percent in 2018 (
National Statistics Office of Mongolia 2018). These extra financial resources should ease government budgetary constraints and support an increase in public and infrastructure investment and job creations. Despite its abundant natural resources, Mongolia is still a low-middle income country characterized by weak infrastructure and the predominance in external debt.
The most common problems associated with expanding extractive resources are weak management capacity and absorption of revenues. These risks are linked to real-exchange-rate appreciation and a loss of competitiveness of tradable sectors outside of natural resources, which is called the Dutch disease effect (
Corden and Neary 1982). The infrastructure gap and domestic capital scarcity in developing countries contribute hugely to low factor productivity. The industries that produce tradable commodities not linked to the natural resources (agriculture and manufacturing) can serve not only the engine of sustainable long-term economic growth but also as a buffer for short-term volatility generate by movement in the price of mineral products (
Fisher et al. 2011).
Mikesell (
1997) stated that in the “resource curse” condition, the real exchange rate appreciated tends to relative prices of tradable products (manufactured goods and agricultural products) relative to prices of non-tradable (construction and services), so that labor and capital are withdrawn from the tradable sector and flow into non-tradable sector.
The CGE model is one of the useful tools to analyze the impact of resource booms.
Qiang (
1999) and
Clements et al. (
1997) used the CGE models to evaluate the impact of the mining and mineral processing in Western Australia on employment and the macro-economy. The analysis of both mining and mineral processing projects have substantial knock-on benefits within the Western Australian economy.
Chand and Levantis (
2000) use a CGE model to investigate the mineral boom in Papua New Guinea and the result shows that the mineral boom has a negative impact on the economy.
Bandara (
1991) investigated the Dutch disease by developing a three-sector CGE model following the “core model” from
Corden (
1984) and
Corden and Neary (
1982). The research confirms that the CGE model is well suited to analyzing Dutch disease-type effects. Using a dynamic CGE for Uganda,
Bategeka and Matovu (
2011) found important productivity gains in the extractive sector, which led to a significant reduction in poverty in rural areas.
Wiebelt et al. (
2011) analyzed Uganda’s different spending strategies for oil revenues and highlighted the fact that poverty reduction and economic benefits in agriculture increased.
Go et al. (
2016) used a dynamic CGE model for Niger to evaluate the implications of spending options and they evaluated various spending scenarios under a range of resource-revenue-management strategies.
There is a growing number of researches that employed the CGE model to make economic analyses in Mongolia.
Corong et al. (
2011) had applied a single country CGE model known as the Mon-CGE model to assess the impact of introducing an Energy Master-Plan within a project by the Asian Development Bank (ADB).
Fisher et al. (
2011) utilized a global recursive dynamic CGE model (MINCGEM) to examine the impact of developing the Oyu Tolgoi copper and gold deposit on the key Mongolian macroeconomic variables focusing on alternative uses of government revenue generated by the project. As a result, in 2020, the OT project would increase the economy by 35%; the average economic growth during 2013–2020 has proposed to be 11.7%. The domestic exchange rate would be firm and in 2020, 50 percent of the Mongolian total export would be composed of OT products.
Byambasuren et al. (
2015) also employed the MINCGEM to analyze the effect of public investment in a power plant and copper refinery.
Galindev et al. (
2016) developed a static CGE model of the Mongolian economy in order to analyze the short-term effects of current changes in the mining sector. They found that an increase in the stock of capital in the Tavan Tolgoi coal mine led to increased value-added, production, employment and exports, which in turn positively affected Mongolia’s GDP, investments and level of exports.
Lkhanaajav (
2017) used Centre of Policy Studies (COP)-style CGE models (ORANIMON and MONAGE) and, through historical and decomposition simulations identified the sources of economic growth and structural changes in Mongolia between 2005 and 2012. So far, a number of studies make use of CGE Models to evaluate the economy-wide effects of the ongoing trade liberalization and simulations of the future effects of a specified set of policy changes in Mongolia.
Batnasan (
2013) had conducted research on Mongolia’s mining-based development and trade policy as applying a CGE model.
Shagdar and Nyamdaa (
2017) utilized a standard Global Trade Analysis Project (GTAP) model and database to consider the effects of changes in Mongolia’s import tariff on the domestic economy.
Shagdar and Nakajima (
2018) utilized the latest version on the GTAP 9.0a database to illustrate the economic effects of free trade agreements among Northeast Asian countries.
The few studies that have investigated the problem at the macro level have applied static techniques to investigate the relationship. Static modeling techniques analyze the contribution of productivity but ignore the effect of policy changes on these contributions in the post-implementation years. This article argues that the effect on productivity may occur with a time lag, making dynamic modeling a more appropriate approach. This approach assesses the effect on an annual basis and allows for more effective monitoring and analysis of the effect of policy changes.
Sangare and Maisonnave (
2018) utilized PEP-t-1 model to analyze public-spending options from mining and oil resources and its impact on Niger’s economy. They added a productivity factor related to the stock of infrastructure to the function and their research result found out that investment in road infrastructure benefits to the economy in the long run.
Mabugu et al. (
2013) show that an expansive fiscal policy would have a temporary impact on the GDP of South Africa but would transform into higher debt relative to GDP.
Njoya and Seetaram (
2018) conducted research on how investment in the tourism sector can contribute to eliminating poverty in Kenya using the CGE model.
Lemelin (
2014) also used a dynamic CGE model to estimate the household saving rate in South Africa. These studies all used PEP-t-1 model in resource-abundant countries, and motivated us to use a similar model in our research.
Using a dynamic computable general equilibrium (CGE) model calibrated on a 2014 Social Accounting Matrix, this paper examines the potential impact on Mongolia’s economy if extraction revenues were directed to the tradable sectors such as coal, agriculture, and manufacturing. Because a dynamic CGE makes it possible to account for actions and redistribution efforts across sectors over time, and it is an appropriate tool for capturing the long-term effects and implications of a reinvestment policy. We aim at providing useful information which can provide important insights on the policymakers.
The remainder of the paper is organized as follows.
Section 2 presents the data and the model, while
Section 3 presents the scenarios and empirical results. At last,
Section 4 presents the conclusion and policy recommendations. To the best our knowledge, no published study has empirically analyzed the macroeconomic effects of multi scenarios in Mongolia using a dynamic computable general equilibrium model.
2. Methodology
We used a dynamic CGE model to analyze the potential impact of resource booms on the Mongolian economy. The PEP-1-t model is developed by
Decaluwé et al. (
2013) and it is designed for the study of a national economy accommodating with the country’s social accounting matrix (SAM). Though the authors fully described their model, we provide the main characteristics of the model. The PEP-1-t model distinguished several categories of workers and capital. Moreover, the aggregate output of each industry consists of several products, consistent with rectangular input-output tables. Each period is solving as static equilibrium, subject to the variables inherited from the preceding period. The dynamic equations define how the variables that link each period to the next to evolve between periods. It is a neo-classical growth model in which the steady growth rate of the economy is solely determined by the population growth rate augmented by the Harrod-neutral technological progress. Mongolian population is assumed to grow at a rate of 0.018 per year in the model as following the World Bank database projection of annual growth rate is approximately 1.8%. The model uses a production function with constant returns to scale and includes a two-level production process. At the first level, production is modeled by a Leontief-type production function composed of a value-added and intermediate consumption. At the second level, value-added is formalized by a production function with constant elasticity of substitution (CES) between composite labor and composite capital.
SAM is adopted from the Economic Research Institute of Mongolia. Drawing from the SAM, the model includes twenty-three commodities, two production factors (capital and labor), four institutions (household, firms, government, and rest of the world), and two savings-investment accounts (gross fixed capital formation and changes in inventories). Government income is derived from direct taxes (paid by households and firms), indirect taxes (commodity sales, sectors, and tariffs), and various transfer payments and over 55 percent of government revenues come from direct taxes and import duties. The government spends nearly 50 percent of its income on goods and services that accounts for about 13 percent of GDP (
Table 1). Specifically, the government spends almost 22.3% for public administration, 13% for education and 7.5% for health sectors. The government transfers 31.2 percent its income to households, respectively that are social security fund, social assistant fund, reimbursement, repression reimbursement, and other current transfers appear on the government expenditure.
Households derive their income from labor income (wages), capital income, and transfers from other institutions. Almost 80 percent of the household income comes from labor and capital which includes 35 percent of the labor income. Households save about 20 percent of their income. Firms drive their income from capital income and transfers from the government. They pay direct taxes (corporate taxes), transfers to the government including dividends, interest and fines, rent, navigation fees, profits from state-owned enterprises and save the remainder. The rest of the world receives revenues from country’s imports and transfers from the other institutions makes payments for country’s exports and transfers to the other institutions and contributes to the loanable funds in the country’s financial market.
The agriculture, metal-ores, and trade sectors account for the highest value-added shares, namely 19.6 percent, 15.2 percent, and 13.8 percent respectively. The coal and metal-ores sectors produce 1.5 percent and 13.8 percent of total value-added, 1.5 percent and 15.5 percent of total composite capital income, and 2.0 percent and 10.5 percent of total labor income respectively. Mining commodities particularly coal and metal ores account for 75 percent of exports while manufacturing commodities represent the highest share of imports (around 80 percent) (
Table 2).
The model closure is standard. The exchange rate is the numeraire and according to the small-country assumption, that world prices are exogenous. We also presume that Mongolia faces a finite elasticity for export demand, however, and therefore needs to be more competitive to increase market share. The current account balance is fixed exogenously and grows at the same rate as population. The same applies to the labor supply, government savings, and public investment. Labor is mobile across sectors while capital is sector specific. Mongolian producers either sell on the domestic market or export to foreign markets, and the model assumes an imperfect substitution between supply for domestic and export destinations. Mongolian consumers can buy commodities that are produced locally or those that are imported, following the Armington assumption.
3. Scenarios and Results of Simulations
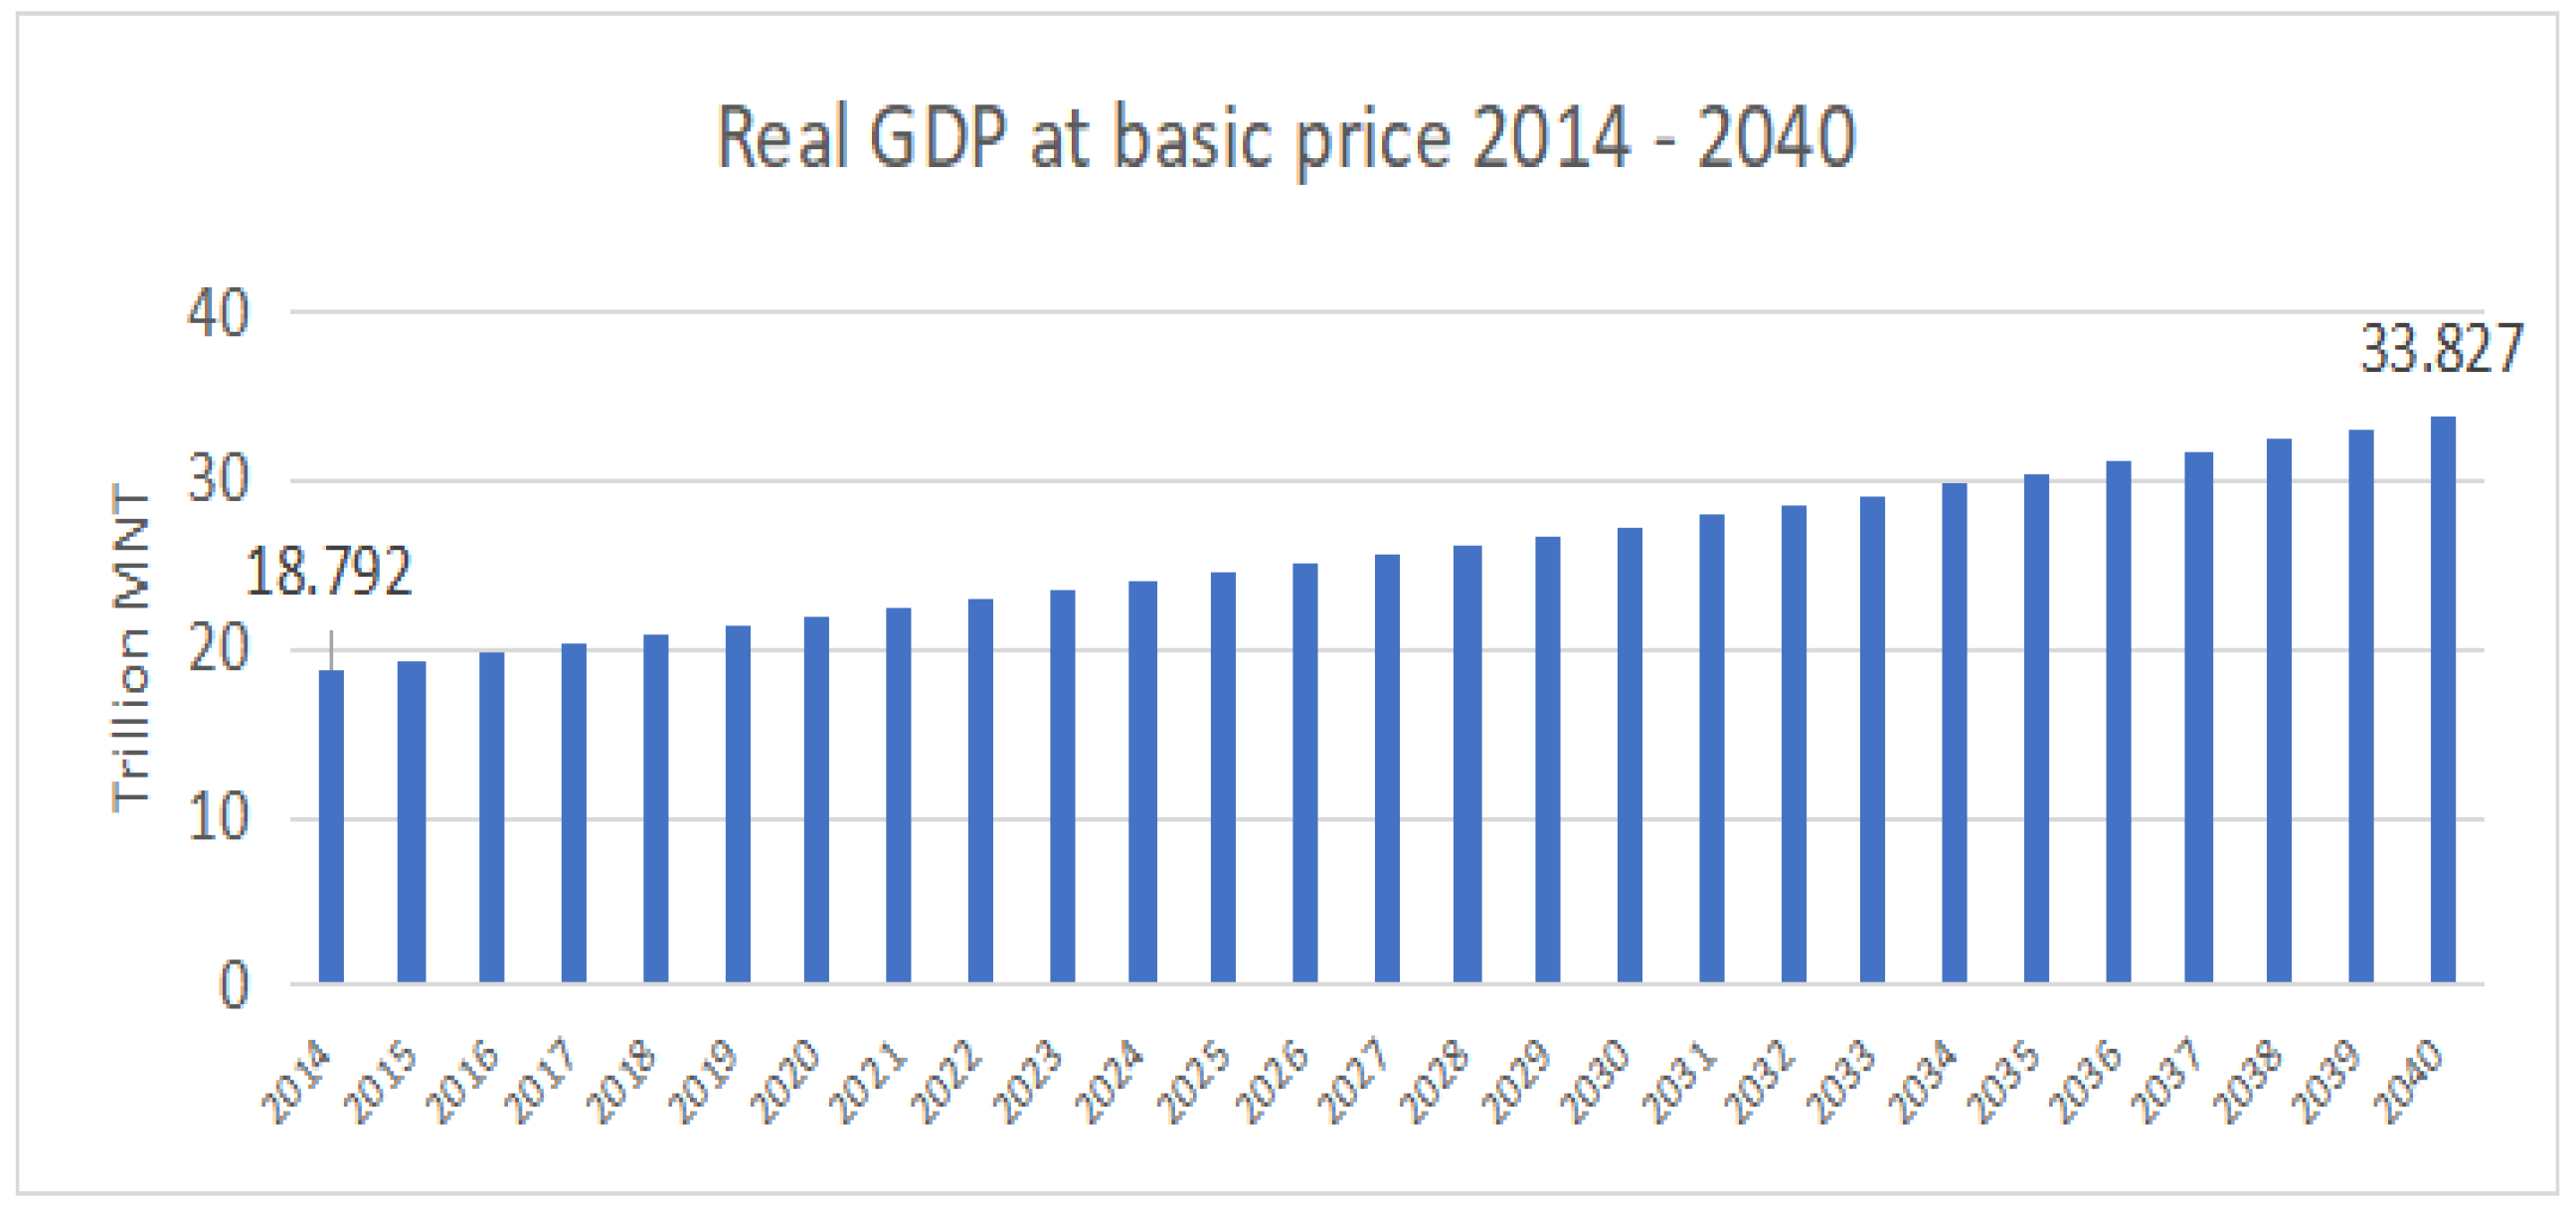
There are three sets of scenarios: simulations about the increase in productivity, a decrease in main export commodity price in the global market and the combination of the first two sets of scenarios. The business as usual scenario (BAU) runs over a 27-year span, to horizon 2040 and we assume that there are no big investment projects consisting and economic activity is flowing normally. In the baseline scenario, Mongolian real GDP at basic price is projected to increase from 18.7 trillion MNT in 2014 to 33.8 trillion MNT in 2040 (MNT refers to Mongolian national currency, tugrug, and one US dollar is equal to 1805 MNT at June 2014), as presented in
Figure 1.
In the BAU scenario, the real household consumption on commodities is projected to increase from 11.2 trillion MNT in 2014 to over 18.6 trillion MNT in 2040 (
Figure 2).
The simulation results are reported in terms of macroeconomic indicators including GDP at basic prices, household consumption reaction, the reaction on wage rate and sectoral impacts in terms of total output in main economic sectors. The changes in real GDP at basic prices determines the purchasing power net of price changes for a given year. The impact on Real household consumption is often viewed as a central measure of an economy’s productive success. The effect on wage rate is an important factor for both microeconomics and macroeconomic indicators. Lastly, the impact on the total output of a particular five sectors: Agriculture, Metal ore, Manufacturing, Construction, and Trade.
3.1. The First Set of Scenario
3.1.1. Introduction
Total factor productivity (TFP) is an index of overall productivity of the economy, and in fact, technical progress in the economy is measured by the annual increase in total factor productivity. This means the country’s economic growth depends on the increase in factor inputs and technological progress that is taking place in the economy. For developing countries, such as Mongolia, the increase in the total factor productivity mainly results from foreign direct investments (FDI).
Chand and Levantis (
2000) stated that the foreign direct investment from any advanced countries partnered with advanced technology, expertise and know-how are essential for economic sustainable development.
We used recently observed variations as a good approximation of the types of shocks Mongolia continue to face in the future.
Table 3 describes the first set of scenarios and our first simulation is to test a 10 percent increase in the productivity of agriculture, manufacturing, mining coal and mining service sectors. We assumed that the total factor productivity increases in these sectors due to the Chinese economy rapidly developing and shifting, especially its technology innovations in the production sectors.
Mikesell (
1997) stated that the effect of the exchange rate appreciation and the migration of labor results in reducing the competitiveness of non-booming export sectors such as agriculture and manufacturing. This literature confirms that Mongolian agriculture and manufacturing sectors are lagging behind because of the mining boom. Traditionally, the agriculture sector has been an effective sector as mining in Mongolia in many years. It consists of about 14 percent of GDP composition.
However, due to the mining boom and lack of modern technology some part is still nomadic husbandry. The agriculture sector has great potential to grow because Mongolia has a great amount of farming land as well as the manufacturing sector. Mongolia is trendy by its organic products such as cashmere, wool, textile, and organic health products in the global market. In order to diversify economic performance, our study has selected the agriculture and manufacturing sectors. Likewise, we assumed that coal mining and mineral service sector has great potential to grow and easily with adopt advanced technological innovation and increase their productivity.
3.1.2. Scenario Results
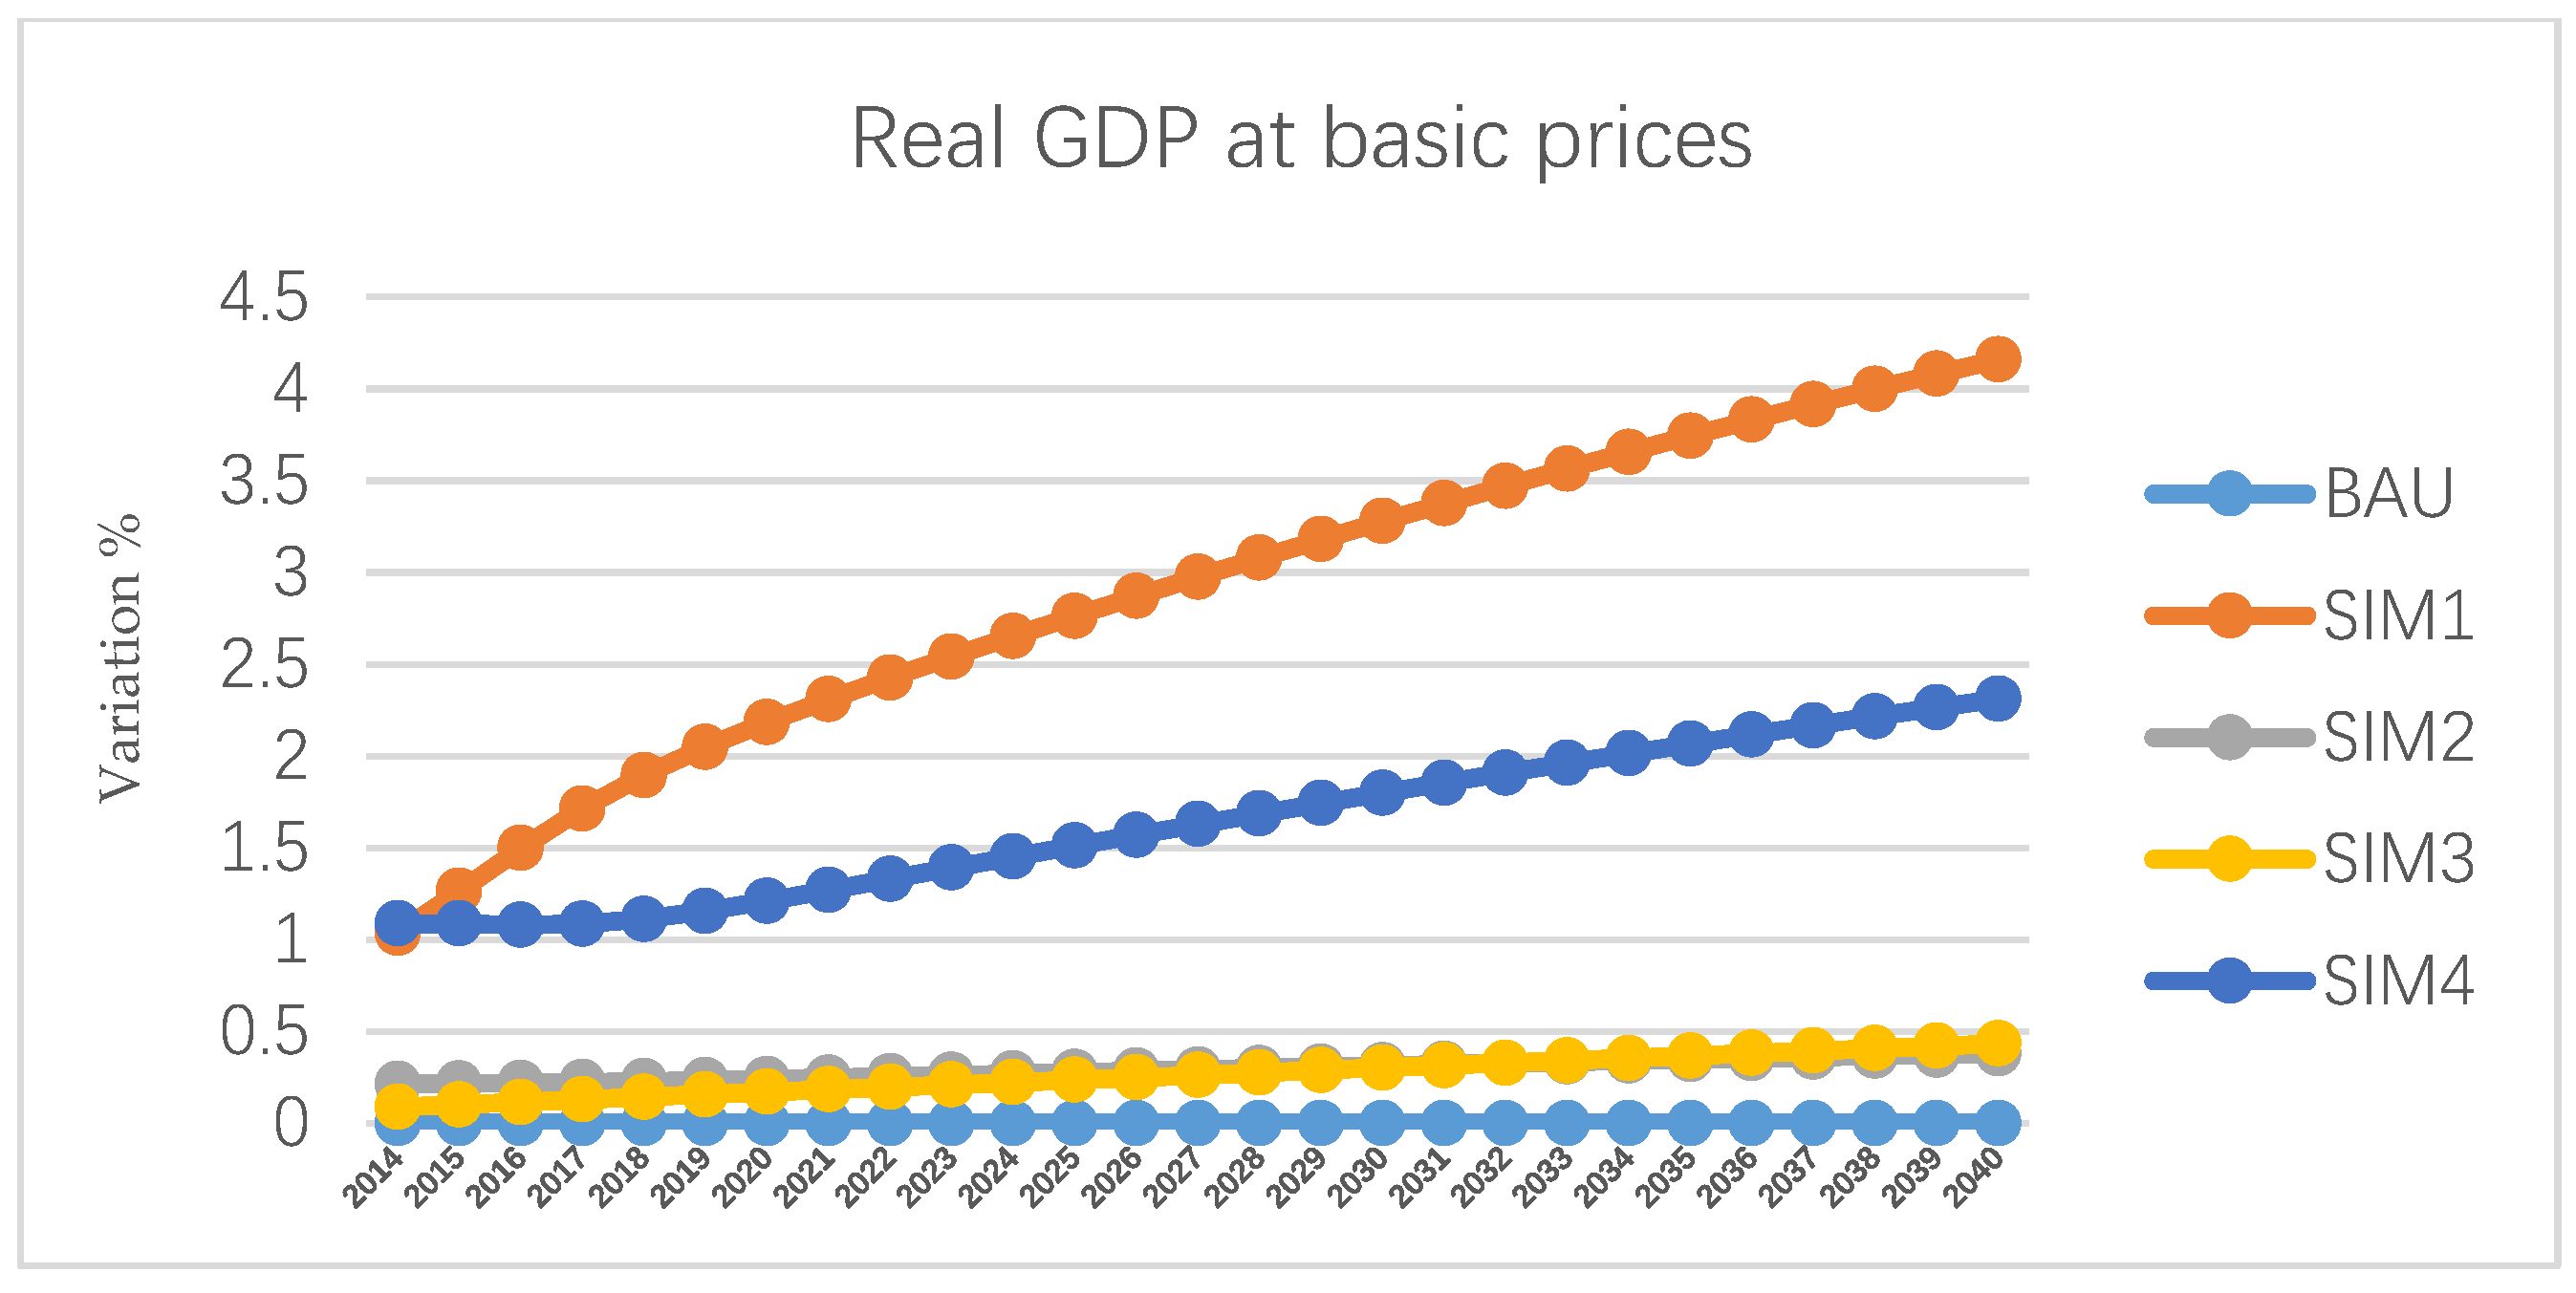
Agriculture, coal mining, mineral service and manufacturing sector’s increase in productivity were compared to the reference scenario. As a calculation, Simulation 1 has the biggest impact on real GDP of basic prices.
Figure 3 displays the evolution of real GDP at basic prices for each of the four scenarios. We also expected that the agriculture sector experiences the largest changes because agriculture is also the main sector in the Mongolian economy besides mining sectors. The 10 percent increase in TFP of the agriculture sector would receive 28.2 trillion MNT in 2030 and 35.2 trillion MNT in 2040 which is greater by 2 trillion MNT that of the baseline scenario.
The following 10 percent increase in TFP of the manufacturing sector has the second greatest impact of 1.8 percent greater in 2030 and 2.3 percent greater than of baseline scenario. This implies that the manufacturing sector observes and dissolves technology development quickly, and can positively affect to the entire economy. The increase in the productivity of the manufacturing and agriculture sectors result in alternative solutions to diversify the economy in order to avoid Dutch disease.
When TFP in the agriculture sector increases, household consumption has a positive impact on demand for all commodities, i.e., mainly agricultural commodities, real estate, and services, and therefore, on production, but not on construction, because households do not buy construction commodities as a final product. Household savings and direct taxes would increase as well. The productivity of coal sectors increases, and as a consequence, the real household consumption of coal increases. When TFP in manufacturing sectors increases, household consumption of manufacturing and real estate commodities increase gradually (
Table 4).
To analyze the wage rate, we compared changes in the wage rates of different scenarios over a certain time period. Simulations 1 and 4 have the greatest positive impact on the wage rate, as shown
Table 5. This means an increase in the productivity of agriculture and manufacturing sectors will affect increases in wages.
In order to analyze simulation effects on sectoral total output, we selected the main five economic sectors that have a great impact on the Mongolian economy (
Figure 4). For the agriculture sector output, SIM1 have a greater effect in short-term (2020) of 3.9 bln.MNT production and SIM1 also has long-term (2040) greater effect of 5.9 bln.MNT. For metal ore output, SIM3 has a greater short-term effect of 8.1 bln.MNT and SIM1 has a greater long-term effect of 13.5 bln.MNT. For the manufacturing sector, SIM4 has a greater short-term effect of 7.2 bln.MNT and SIM4 have a long-term effect of 11.2 bln.MNT. For construction and trade sector, SIM1 has both short and long-term effect.
The total output of the economic sectors influences firm productivity within the sectors, consequently leading to changes in the firm’s income. It would also indirectly increase taxes, dividends and firm savings as well. Government income increases slightly, driven by the increase in direct taxes from households and firms.
As a result of the first set of simulations, we conclude that the increase in productivity leads to value-added production, the employment rate in the certain economic sector and also impact positively on overall economic growth. Simulation 1 gave outstanding positive results compared to the other three simulations. It is important for Mongolian policymakers to implement policies to promote and encourage partnering with more advanced technology, know-how and technological experience of foreign firms and investors from more advanced and developed countries and work on boosting TFP in non-booming sectors such as agriculture and manufacturing.
3.2. The Second Set of Scenario
3.2.1. Introduction
Given the importance of mining in Mongolia, the second “counter-factual” simulation consists of a permanent 10 percent drop in the (exogenous) international price of minerals. This scenario is an attempt to assess the vulnerability of the Mongolian economy to highly volatile international prices. Our main assumption is that starting from the year 2020, the coal and mineral-ore price on the world market will decrease by 10 percent due to the global challenge of managing carbon emission. This scenario is an attempt to assess the vulnerability of the Mongolian economy to highly volatile international prices.
In the meantime, 2012–2015 witnessed the beginning of a slowdown in China, which placed downward pressure on global commodity prices, thus limiting the profitability of Mongolian mineral resources. We will check Mongolian economic dependency on global mineral price fluctuations. We will see how the drop of the coal and mineral-ore price on global market would affect to the whole economy and assume that coal has a greater effect than metal-ore because it is one of the main export commodities of Mongolia.
Table 6 describes the second set of scenarios.
3.2.2. Scenario Results
A 10 percent reduction in the international price of coal and metal-ores (both import and exports) produces harsh effects on the Mongolian economy. As presented in
Figure 5, in the simulation 5, the price of the coal in the world market decreases by 10 percent starting from 2020 and consequently it results into 0.062 percent decrease in GDP of 2020, 0.04 percent in 2030 and 0.03 percent in 2040 as compared with the basic year scenario.
Simulation 6 shows a 10 percent decrease of metal-ore price in the global market and there is a minor overall adverse impact on the real GDP at the basic price of 0.058 percent drop in 2020, 0.2 percent in 2030 and 0.16 percent in 2040 (
Figure 5). Mongolia is a mineral exporting country and therefore any changes in mineral metal price in the world market would affect its household consumption potential. As expected, in both scenarios, due to the mineral price drop in the global market, household consumption got a negative impact on demand for all commodities. Especially in the simulation 6, the decrease in the metal-ore price has decreased the real household consumption greatly (
Table 7).
In SIM 5, the wage rate is affected negatively when the coal price shock started in 2020, and consequently, the wage rate revolved positively (
Table 8). During SIM 6, the metal-ore price shock quite severely affected by the wage rate (−5.7) in 2010 and eventually, the wage rate variation dropped but still negative until 2040.
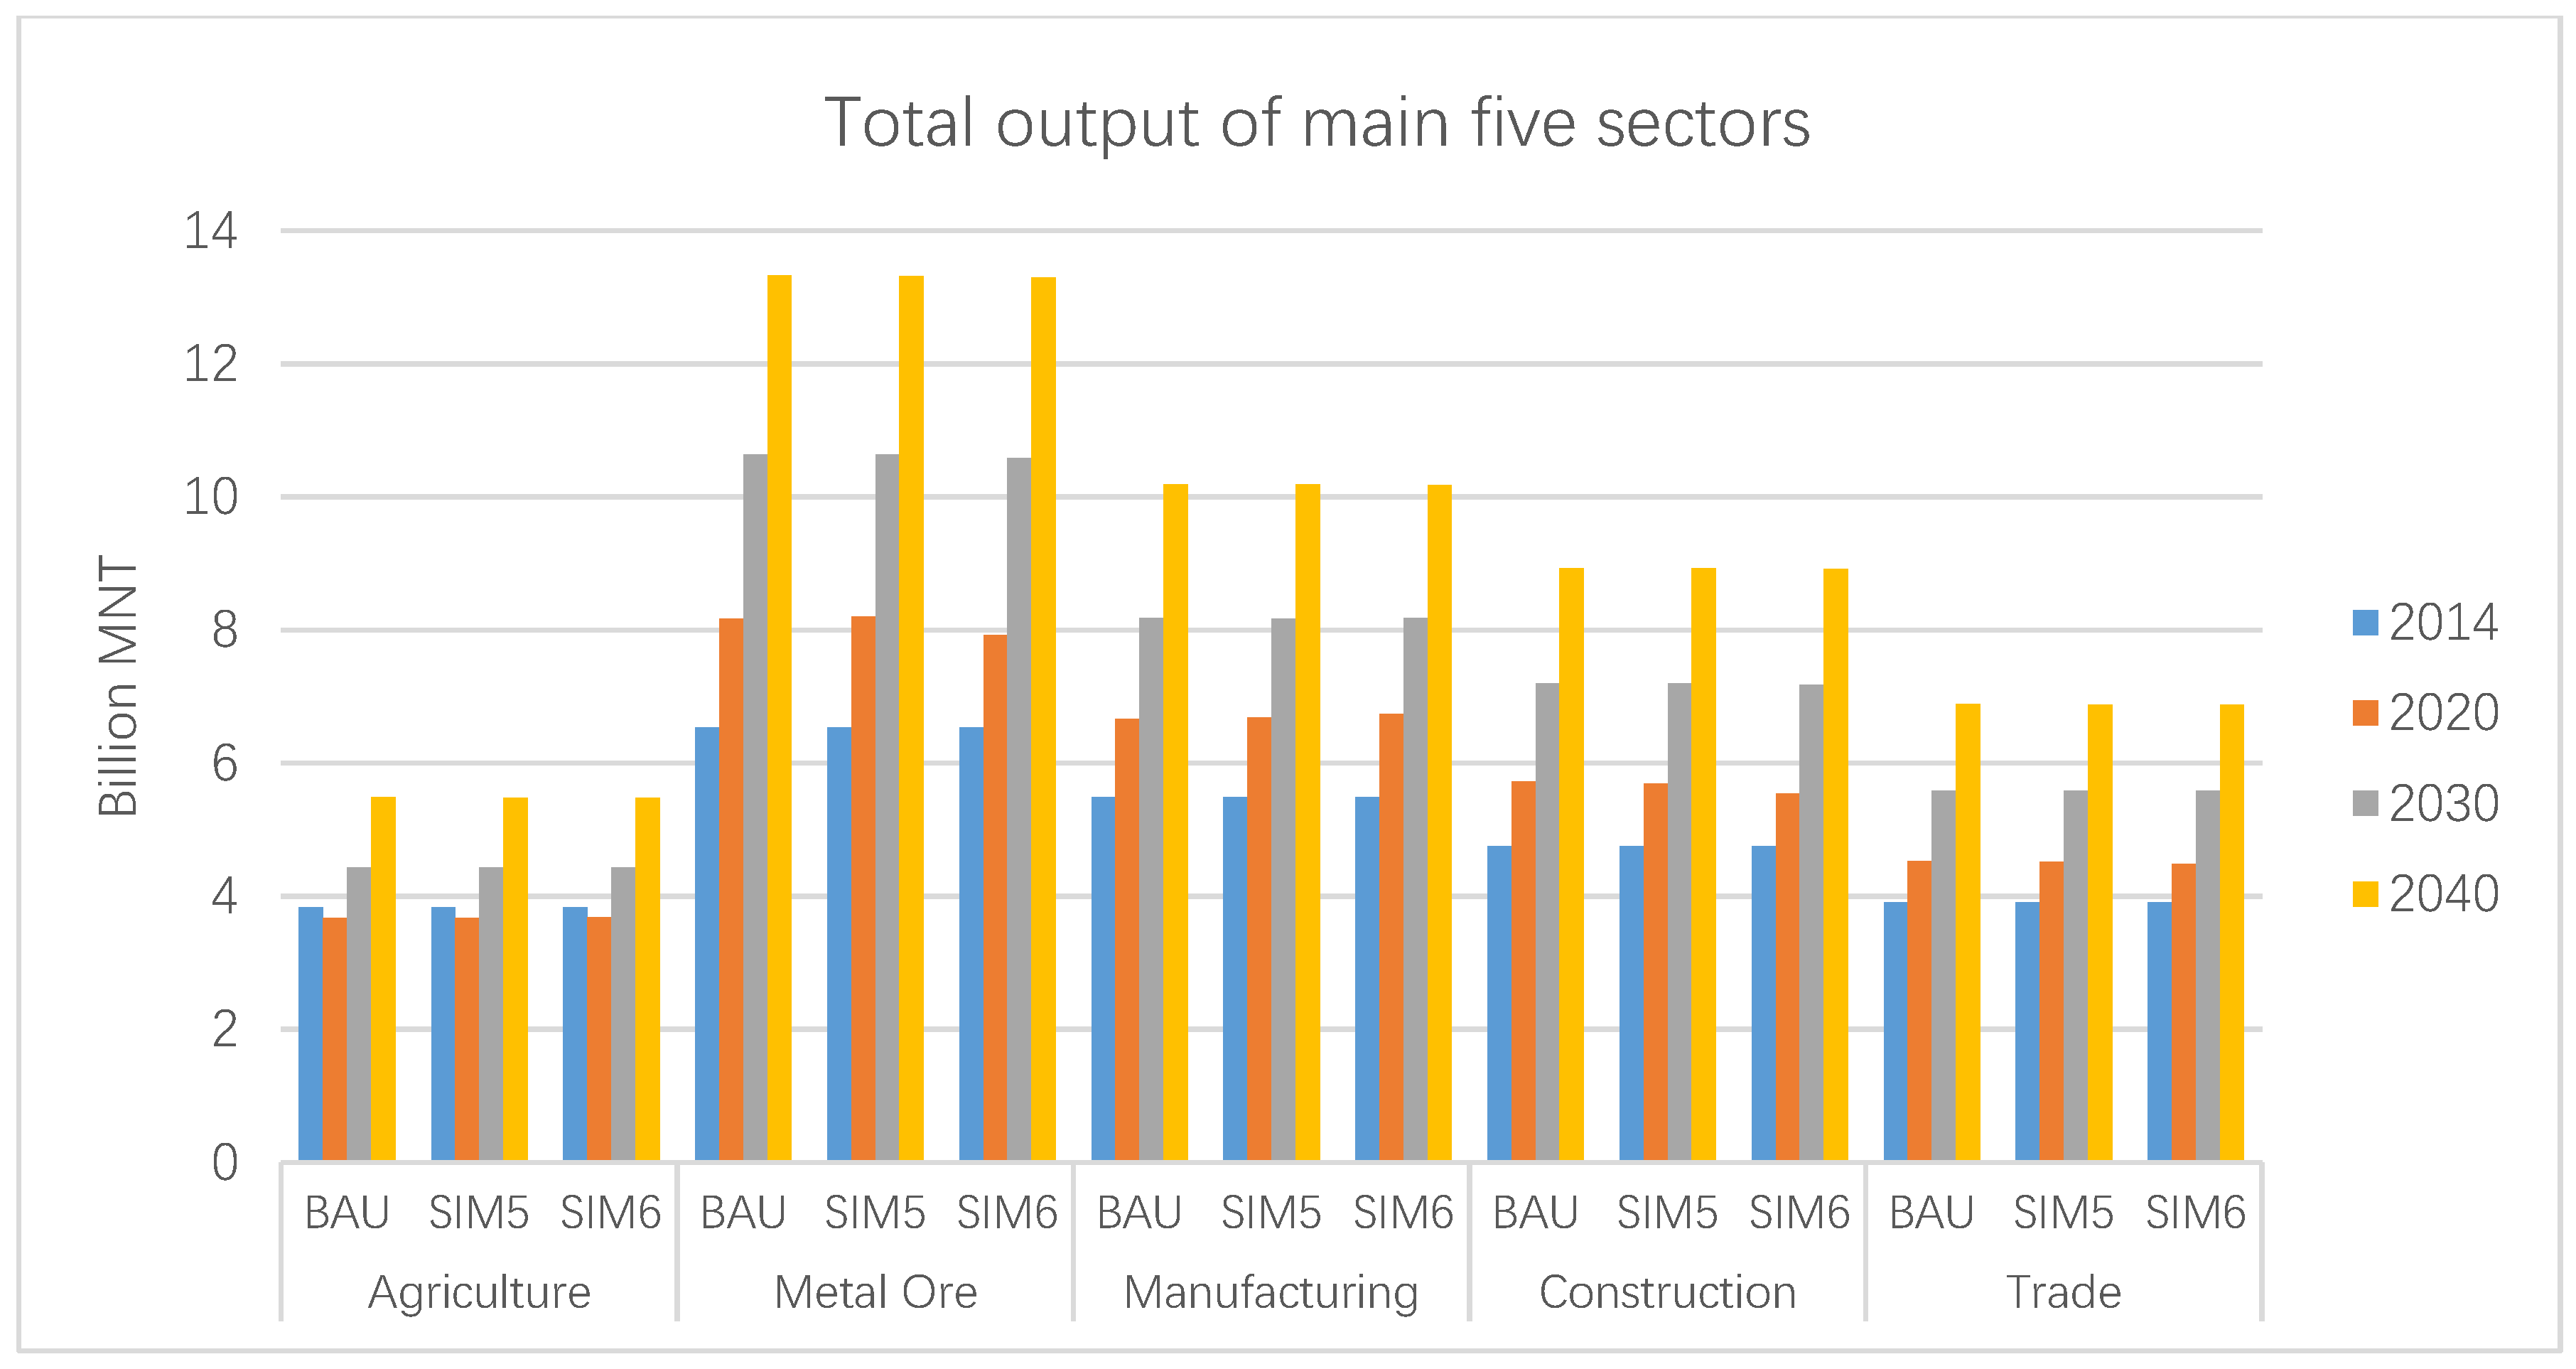
Now let us see how the mineral product price drop in the global market would affect to the Mongolian main economic sectors production in short-term (2020) and long-term (2040). For the agriculture sector output, SIM6 has greater effect in short-term (2020) of 3.68 bln.MNT production and BAU also has long-term (2040) greater effect of 5.48 bln.MNT. For metal ore output, SIM5 has the greater short-term effect of 8.2 bln.MNT and BAU have a greater long-term effect of 13.3 bln.MNT. For the manufacturing sector, SIM6 has a greater short-term effect of 6.7 bln.MNT and BAU have a long-term effect of 10.1 bln.MNT. For construction and trade sector, BAU has greater both short and long-term effect (
Figure 6).
From these results, we can conclude that the mineral price fluctuations indeed affect Mongolia’s economic performance. The mineral price drop has negative impacts on the real GDP of basic price and impacts negatively on real household consumption. It also affects the wage rate negatively. Both SIM5 and SIM6 influence on the main economic sector’s total output is lower than the baseline scenario which is normal economic flow which indicates Mongolia is highly dependent on the global mineral price. It is important for Mongolian policymakers to implement policies to aim to balance the government budget and promoting the production of tradable goods without significant dependence on the natural resource sector.
3.3. The Third Set of Scenario
3.3.1. Introduction
The third set of scenarios combines the previous two simulations and described in
Table 9. We assume that an increase in productivity of the mining sector in Mongolia originates from advanced countries with advanced mining technologies. In the first two sets of scenarios, for brevity, the increase in productivity had positive influence to the overall economy and price drop of minerals in the world market had negative effect adversely and now let us see what happens when these scenarios blend. The third simulation is to test how the economy would react in the combined effect.
We proposed simulation 7 and 8 due to the following reasons. In recent years, international prices of mining commodities have been highly volatile and we assume it will continue to fall because of most countries are choosing green energy for world sustainability. Also, we assume that productivity in coal and metal ore sectors will increase due to foreign direct investment especially investment from China to Mongolia in the scope of Belt and Road initiatives.
3.3.2. Scenario Results
In the simulation 7, the real GDP at basic prices has increased from 18.8 trillion MNT in 2014 to 33.9 trillion MNT in 2040 and simulation 8 shows a much greater increase from 19.1 trillion MNT of 2014 to 35.03 trillion MNT by 2040 due to 15 percent increase in TFP of the metal-ore sector. The variation of Real GDP at basic prices comparing to BAU scenario is shown in
Figure 7.
The decrease in the world coal price, combined with an increase in TFP in the coal sector, has positive re-distributional effects. As returning to SIM5, the decrease of coal price in 2020 impacted negatively to all household consumptions but in SIM7, it shows positive (3.61) because of TFP increase in the coal sector (
Table 10). This means the increase in productivity due to investment in technology, know-how and adapting technological capacity from developed countries can bring a positive impact to the economy without fearing from world mineral price volatilities.
In SIM 7 and 8, right after the price shock, it showed negative effects on the wage rate, but it quickly regained its position. The decrease of metal-ore price also showed the same effect in 2020, but SIM8 has more galloping positive on wage rate as indicated 1.5 variations in 2040 (
Table 11).
The combined effect of world mineral price drop and an increase in productivity shows a significant result for policymakers to analyze.
Figure 8 shows the double effect of how the mineral product price drop in the global market and increase in the productivity affect to the Mongolian main economic sectors’ production in the short- (2020) and long-term (2040).
For the agriculture sector output, SIM7 has both greater effect on short-term (2020) of 3.68 bln.MNT production and long-term (2040) greater effect of 5.5 bln.MNT. For metal ore output, SIM8 has both greater short-term effect of 9.2 bln.MNT and long-term effect of 15.6 bln.MNT. For the manufacturing sector, SIM7 has both greater short-term effect of 6.7 bln.MNT and long-term effect of 10.2 bln.MNT. For construction and trade sector, SIM8 has a greater both short and long-term effect. From here, conclude that simulations similar to SIM7 are more suitable for promoting agriculture and manufacturing sectors. Because SIM8 is supporting other economic sectors of metal-ore, construction, and trade.
4. Discussion and Conclusions
The main objective of this research was to use simulated scenarios to assess the detailed impact of changes in the mining sector on the Mongolian economy. We used a dynamic CGE model to analyze the effects of the increase in the productivity of main economy sectors which have the potential to receive foreign investments and a decrease in the main export commodity prices.
In the first set of scenarios, we simulated a 10 percent increase in the productivity of coal, mining service, agriculture, and manufacturing sectors. Improvement in technology makes factor inputs or resources more productive. If the quantity of the resource is increasing and the total factor productivity is rising, then the output would grow faster than the increase in the number of resources. In our study, the assumptions are based on upcoming big investment projects such as “Russia-China-Mongolia” economic corridor. We found that such a simulation showed positive effects on real GDP, real exports, real investment, employment, and household consumption. It shows the result of the rate of certain economic growth is achieved depending on the growth in total factor productivity.
In the second set of scenarios, we stimulated a 10 percent decrease in the international price of coal and metal ores to assess the vulnerability of the economy in the presence of negative price shocks. Related with its dependence on the mining sector, the Mongolian economy is under constant threat of frequent and violent price shocks. Our results showed that shocks have negative effects on production and employment in almost all sectors.
In the third set of scenarios, we stimulated the combined effect of an increase in productivity coal and metal-ore sector and decrease in the international price of coal and metal-ores to assess how the combined effects would influence to the entire economy. These simulations had a negative effect on production at the beginning but gradually became a positive effect in long-run from 2025 to 2040 and had mixed effects on employment and mostly positive. The results show that the increase in TFP will surely accelerate the economic development of Mongolia and it will enhance the economic integration among different sectors. The results indicate that economic growth in Mongolia is particularly significant, depending on partnering with more advanced technology, know-how and technological experience of foreign firms and investors from developed countries.
As analyzed by the four economic variables:
Changes in Real GDP at basic prices—which determines the purchasing power net of price changes for a given year. Simulation 1, 4 and 8 have the greatest positive change on Real GDP at basic prices averaging around 3 percent greater than BAU scenario.
Impact on Real household consumption—which is often viewed as a central measure of an economy’s productive success. Simulation 1, 4 and 8 have the greatest positive impact on real household consumption. Even, simulation 8 was showing negative results during 2020.
Effects on wage rate—which is an important factor for both micro and macroeconomics. Simulation 4, 7 and 8 have the greatest positive impact on the wage rate.
Impact on the total output of a particular five sectors: Agriculture, Metal ore, Manufacturing, Construction, and Trade. For agriculture sector Simulation 1 has a greater impact on both short-term and long term productivity. For Metal ore sector, Simulation 8 has a greater impact on both short-term and long term productivity. For the Manufacturing sector, Simulation 4 has a greater impact on both short-term and long term productivity. For construction and trade sectors, Simulation 8 has the greatest effect on total output.
Mongolia is expected to receive new opportunities for development in a wide range of areas such as mining, energy, infrastructure (including railways and roads), logistics, transportation, agriculture, livestock, farming, light-industry, tourism, construction and real estate in terms of Chinese “Belt and Road” Initiatives. In addition, work has begun on a feasibility study for these projects between China and Mongolia.
Our policy recommendation centers on technological progress are very important for Mongolia to avoid the negative effect of nature sources prices going down. The most effective sector is the manufactory industry and then is the agriculture sector to stable country’s economic growth and prosperity. Thus, we suggest that the Government of Mongolia enforce the R&D investment in the manufactory industry and agriculture sector. Also, the government should introduce foreign investment to promote technology progress via Belt and Road Initiatives.


