Abstract
Development of preventive migration state policy requires investigation of not only real but also prospective migration. This article provides the author’s methodological approach to the study of a population’s migration potential. The migration desires index (MDI), as one of the most important indicators of migration potential, was calculated for the unemployed urban population in Lviv, Ukraine, on the basis of the results of a monitoring sample survey (2013–2016, 2018). The MDI shows wave-like development dynamics. Generally, the share of “solid” migrants (persons who have firm plans to work abroad in the years ahead) grew from 14% in 2014 to 25% of the unemployed population in Lviv in 2018. Despite such a high level of migration desires, the respondents also showed a clear urge to be employed in Ukraine. Overall, the study results show that the improvement of employment opportunities in the national labor market and improvement of the wage system will contribute to a reduction of the level of migration potential and will thus slow the pace at which the working-age population is leaving. For those who still have a firm intention to go abroad, the state should provide an appropriate level of social and economic protection, primarily by establishing effective cooperation with countries that are most attractive for potential labor migrants. The author’s surveillance study shows that such countries are Germany, the USA, Canada, and Poland.
JEL Classification:
J11; J61; J64
1. Introduction
The processes of international population migration are intensified under the conditions of globalization and European integration. Ukraine is involved in these processes and in 2000 took fifth place in the world in terms of people who have emigrated and eleventh place in terms of the number of immigrants according to the data of the World Bank and the International Organization for Migration (IOM 2011, p. 3). In 2017, it dropped to eighth place in emigration ranking, not due to a reduced number of migrants, but rather to a significant increase of migration flows from Bangladesh, Syria, and Pakistan (UN 2017b). The aggregate number of emigrants from Ukraine amounted to 5.9 million persons in 2017, a third of which had bachelor’s or master’s degrees (UN 2017a, p. 13). Poor regulation of migration flows leads to considerable sociodemographic and economic losses for certain regions, donors of the workforce, and the country in general. Under such conditions, the need to improve the state’s migration policy is of the utmost importance.
Study and analysis of migration movement statistics allows identification of the most important problems in this field and development of relevant migration policy measures to solve them. Therefore, this contribution is mainly regarding the response policy. However, under the conditions of demographic and socioeconomic crisis in Ukraine, the strengthening of preventive measures of state migration policy directed at preserving and multiplying state human capacity, as well as its efficient use, is currently required. The development and implementation of such policy is based not only on the evaluation of the real situation in the migration sphere, but also on outlining the factors that influence population migration activity, forecasting the volumes and main directions of migration flows and on defining the major destinations of prospective migrants. Therefore, it is necessary to research not only real but also prospective migration. Examination of population migration potential will contribute to the development of adequate mechanisms that can influence residents’ migratory behavior.
The relevance and urgency of international migration problems have stimulated the interest of scientists and experts on the regulation of migration processes. However, the majority of the relevant scientific works is dedicated to the analysis of existing migration flows and external labor migration factors in different countries (Grenčíková and Španková 2016; Yormirzoev 2017; Rafique Wassan et al. 2017). The author has previously analyzed the factors and motives of external migration of Ukraine’s population (Ryndzak 2018).
As an important aspect of migration issues, this article focuses on the evaluation of migration potential. There are two main methodological approaches to migration potential studies: statistical and sociological. Statistical studies are mostly based on multifactor regression methods and extrapolation. Thorough research of prospective migration from Central and Eastern Europe to countries of the European Union was carried out by German scientists in the early 2000s (Alvarez-Plata et al. 2003) on the basis of statistical data and construction of econometric models. In another study, the level of migration from the East to the EU15 was predicted using simulations (Zaiceva 2006). Reliable future forecasts of the net number of migrants in the EU28 were made for the year 2050. The investigation was based on the analysis of core population aging indicators together with net migration rates (Jakovljevic et al. 2018).
The sociological approach involves the use of representative surveys or interviews with experts. For example, the Delphi technique was used for making forecasts of migration between EU, countries of the Visegrád Four, and Eastern Europe under the conditions of visa cancellation (Jaroszewicz et al. 2014). The Gallup International Association conducts regular population surveys and has acquired international recognition as one of the most reliable sources of information about public opinion in the United States and around the world. The Gallup World Poll conducted surveys in 160 countries concerning people’s migration intentions (for the period 2010–2015). It not only evaluated the scales of perspective migration but also showed the differences between migration desires, concrete plans, and preparations of migration on the basis of sociological surveys (Laczko et al. 2017). Furthermore, Gallup’s potential net migration index was calculated on the basis of expressed desires to immigrate or emigrate. It shows possible changes of countries’ populations (Esipova et al. 2017). However, these surveys provide an indication of only permanent migration and do not take into account potential temporary labor migration.
There is neither a state monitoring system of migration potential nor a combined approach to its study in Ukraine. Most studies are isolated and fragmentary and cover only some aspects of this problem (for example, IOM 2017; Mostova and Rachmanin 2018; Rating 2018). One of the first examinations of migration potential in Ukraine in the context of EU Member States’ visa policy was carried out in 2011 by scientists of the Donetsk Institute for Sociological Research and Political Analysis (Kipen’ and Avksent’yev 2011).
Despite existing developments, migration potential has not yet become the subject of complex investigations. Theoretical, methodological, and practical aspects of the problem need further development and improvement. In particular, there is a gap in migration potential indicators that consider different degrees of migration potential, from a minimal level (typically for people who do not wish to go abroad in any case) to the highest level (observed in individuals who want to go abroad for permanent residence).
The problem of international migration is very complex and multidimensional and cannot be covered in one study. Therefore, this study focused on one of the most important and insufficiently developed aspects. The aim of this article is to present the author’s methodological approach to evaluation of the population’s migration potential and the Migration Desires Index calculation on the basis of the results of the surveillance sociological study in Lviv (2012–2016, 2018). The time span chosen is very interesting for analysis, because it contains several important social and political events in Ukraine. In particular, Euromaidan (massive demonstrations for Ukraine’s integration into the European Union) started in November 2013. It led to the changes of president and government in 2014. At the same time, the annexation of part of Ukraine’s territory (Crimea) and the war in the east of Ukraine took place. All these things have reflected significantly on main socioeconomic performance. Data about the average monthly nominal wage in Ukraine per full-time employee (2010–2018), minimum wage rates in Ukraine (2010–2018), GDP (gross domestic product) per capita in Ukraine in 2010–2017, and unemployment rates in Ukraine (2010–2018) (Supplementary Materials Appendix S1) illustrate negative changes in 2014–2015. However, the situation began to improve from 2016. Additional data about unemployment, GDP, and the minimum wage of Ukraine’s neighboring countries and countries, which are the main recipients of migrants from Ukraine, are presented in Supplementary Materials Appendix S1.
2. Methodology
The word “potential” stems from the Latin words potentialis (possible), and potential (force) and is defined in reference literature as the aggregate of certain means and opportunities in various spheres of life (Shevchenko 2008, p. 490). These resources can be activated and used in relevant conditions and circumstances. In general, there are many different types of potential: physical, economic, natural resources, etc. In the context of this research, we pay our attention to potential that is borne by humans, i.e., human potential. The broadest meaning of human capacity is the available population of a certain territory with the aggregate of their following features: physical condition, health, natural skills, level of education, professional and qualification level, level of culture, structure of values, hierarchy of needs, etc.
In the context of economic research and development of adequate recommendations on improvement of migration policy, it is important to focus on the migration potential of the economically active population. Therefore, it can be regarded as one of the properties of labor potential. There are currently many definitions of labor potential; however, the definition of S.I. Pyrozhkov is, in our opinion, one of the most suitable. He regards labor potential as “the developed aggregate of demographic, social and spiritual characteristics and qualities of labor active population in the society, which are or can be carried out within and through existing system of social relations with labor and social activity involved in the process” (Dolishniy and Zlupko 1997, p. 43).
Kipen’ V.P. and Avksent’yev М.V. define migration potential as “the highest possible current number of potential migrants ready to leave the country of residence on condition of preserving of significance and structure of pushing and deterring factors” (Kipen’ and Avksent’yev 2011, p. 28). The researchers point out that the capacity can be realized in 5–7 years, and then the change of population structure and migration attitude takes place. The volume of migration potential, according to Donetsk scientists, is defined by demographic capacity and attitude towards leaving the country of residence.
It is worth noting that the abovementioned definition of migration potential bears a quantitative feature and has a practical focus for the accounting of the phenomenon. However, we suggest that it is not comprehensive enough for such a multidimensional category. At the same time, an important role in forming the basis of the concepts and terminology of migration research was played by defining the migration potential as the “quality and quantity limit values of self-reproductive human resources of the donor region (their work, intelligence, etc.), which can be accumulated by the other recipient region on condition of maintaining of donor region’s function as territorial social system” (Sadova 2011, p. 39).
In our opinion, leaving attitude and overall level of individual mobility can both serve as important determinants of migration potential. It is about social and psychological readiness, the ability of a person to change their place of residence, profession, job, and lifestyle in general. Mobile individuals are more often inclined toward migration as the derivative of general readiness for change. Moreover, not least in the migration behavior of the population are mental factors (love, devotion to native land, family, culture, availability of patriotic feelings, etc.). Therefore, the abovementioned aspects also require examination and consideration in the course of evaluation of the migration potential of population.
The author’s understanding of migration potential of a territory as the component of its human capacity is similar to the abovementioned definitions. In a broad meaning, it can be defined as the integral aggregate of the quantitative and qualitative properties of an economically active population of a certain territory with a certain level of mobility and a wide range of motivations to change their place of residence and lifestyle (Ryndzak 2015, p. 84). Accordingly, the component structure of migration potential, in our opinion, includes three major elements: sociodemographic, economic, and sociopsychological. The first two components can be analyzed using the data of official statistics. The study of the sociopsychological component of the migration capacity of the population of a certain territory requires the development of special instruments and conducting of sociological surveys.
It is well known that the migration behavior of a person (migration or rejection) to a considerable extent depends on their migration attitude. Migration attitude is the psychological regulator of human behavior, disposition to migration, and change of lifestyle. It can be defined as inclination (or absence of it) of a person towards migration activity in a certain situation or under relevant conditions. The share of the population with a positive migration attitude—migration desires but without making a final decision about migration—amounts to the possible migration potential of a territory. “Solid” migrants are the core of migration potential—these are persons with the formed migration readiness. In our opinion, such a type of migrants is characterized by the following key aspects: psychological readiness to leave a certain settlement, to relocate; a decision on migration; and certain actions related to implementation of this decision. While studying the migration capacity of certain territory, it is important to take into account the share of both “solid” and possible migrants. A schematic model of migration potential analysis is suggested in Figure 1.
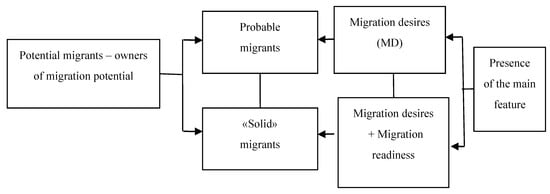
Figure 1.
A scheme of the population’s migration potential analysis. Source: own elaboration (Ryndzak 2015, p. 85), based on Kipen’ and Avksent’yev (2011).
The share of “solid” migrants, who are the basis and the core of the migration potential of a certain territory, can be defined through representative sociological surveys. In particular, a questionnaire allows interviewing a significant number of respondents in the shortest time possible. Thus, direct questions about clear plans of employment or moving abroad in the near future contribute to defining the number of “solid” migrants. This number is a very important indicator of migration potential. Previous studies show that the share of “solid” migrants is much less than the share of probable migrants (Laczko et al. 2017).
3. Results and Discussion
The share of “solid” migrants, which form the basis of the migration potential of a certain territory, can be determined by representative sociological surveys. For example, the results of a national surveillance sociological study of the Institute of Sociology of the National Academy of Sciences of Ukraine allow us to follow the dynamics of the share of “solid” migrants in our country over the past 14 years (Table 1). Thus, during the six years of research (2004–2012), this share remained stable, fluctuating within a narrow range of 5.3%–6.3% of the respondents. In 2013, it almost returned to the value of 2002 (slightly exceeding it) and amounted to 7.2%. In 2015 and 2016, the number of people willing to work abroad increased significantly and reached nearly 11%.

Table 1.
Answers to the question “Are you planning to go abroad for the temporary work in the nearest future?”, in % of the respondents.
In order to study migration potential, we used the results of a survey conducted by the author as the member of a working group of the Department of Social and Humanitarian Development of the region (State Institution “Institute of Regional Research, named after M.I. Dolishniy of the National Academy of Sciences of Ukraine”) under the auspices of the Lviv City Employment Center. Since persons who are not able to realize their potential in their country are the most inclined to go abroad, it can be assumed that young employable residents without permanent jobs are the most active group of prospective migrants. Lviv is a prototype city of the migration processes that are currently underway in Ukraine, especially in its border regions. Moreover, it serves as an important transit zone and a donor—a territory where migrants originate from. The questionnaire (Supplementary Materials Appendix S2) was conducted among unemployed persons, who sought employment assistance in the Lviv City Employment Center in the autumns of 2013, 2014, 2015, 2016, and 2018. On the basis of a stratified sample, 500 questionnaires were distributed annually. The major features of stratification were the sociodemographic features of the population, which considerably influence its migration potential, namely, age, gender, and education. Taking into consideration the level of the questionnaire return and screening by completion correctness, 360 questionnaires were analyzed in 2013, 400 in 2014, 350 in 2015, 345 in 2016, and 338 in 2018. Sociodemographic features of respondents did not differ significantly in the examined years. Gender remained, approximately, in the following ratio: 38% males, 62% females. A majority of the unemployed had basic or complete higher education (66%), 26% had technical and vocational education, and only 8% had complete secondary education. About 40% of respondents were young people up to 35 years old, middle aged persons (35–44 years old) comprised 27%, and older people (45 years and older) comprised 33%.
Analysis of the research results of unemployed persons in the Lviv oblast (2013–2016, 2018) showed that in the examined years, the share of “solid” labor migrants displayed wave-like dynamics. Thus, in 2013, their share amounted to 20%, and in 2014, it decreased by 6 percentage points (Figure 2). However, in 2015, it doubled in comparison with the previous year, and in 2016, a slight reduction, to 22% of respondents, was observed again. In our opinion, a certain reduction of the share of “solid” labor migrants in 2016 was partially caused by the beginning of the growth of the Ukrainian economy, although it was very small. In 2018, the share of respondents who had plans for employment abroad in the coming years increased again. It made up one-quarter of all respondents.
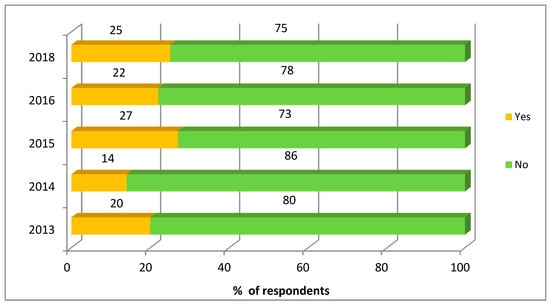
Figure 2.
Answers to the question “Are you planning to be employed abroad in the nearest 5 years?”, in % of the respondents who answered this question (according to the results of 2013–2016, 2018 panel survey). Source: own data.
Taking into account the sociopolitical events of the period under research (election of new government and president), there are grounds to believe that the reduction of the population migration attitude in 2014 was caused by a patriotic mood, positive expectations of changes, and hopes for a better future. By contrast, the dramatic growth of migration preferences of the unemployed in 2015 can serve as an indicator of general disappointment and unmet expectations and is related to the outburst of military actions in the East of Ukraine.
Males have always been more active in migration processes than females, not only in Ukraine but in the majority of countries globally. Therefore, the prevalence of males among the unemployed ready to be employed abroad in the near term is not unexpected (Figure 3). However, it is worth mentioning an important observation: the considerable growth of this share in 2015 against a background of general growth of the number of “solid” labor migrants and the fact that it remained almost at the same level in 2016 with a certain reduction of such a type of migrants. In 2018, the share of respondents planning to work abroad grew among males by 10 percentage points in comparison with 2016.
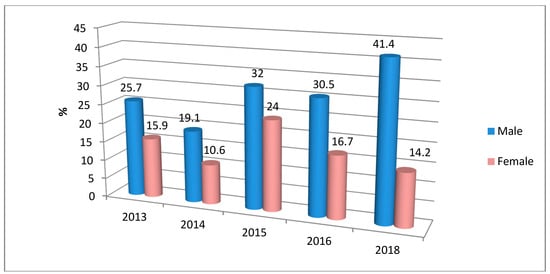
Figure 3.
The share of “solid” labor migrants among the respondents of each gender, in % of the respondents of each gender, who confirmed their readiness to be employed abroad in the near term (according to the results of 2013–2016, 2018 panel survey). Source: own data.
Since migration potential is a complex, multifaceted, and multidimensional phenomenon, evaluation of its volumes cannot be limited only to defining the number of persons with solid intentions to go abroad soon. In our opinion, it is also reasonable to view migration potential as the aggregate of qualitative and quantitative features of a person, social group, and population, which characterize desire, readiness, and ability to migrate. Therefore, it is the relative parameter that takes into account different levels of expressed readiness to migrate. This is why, in order to study it, we asked the question “If you had an opportunity to be employed abroad, what would you prefer?” when conducting the sociological survey. The question had six response options (Figure 4). Thus, almost one-quarter of survey participants wanted to go abroad for permanent residence in 2018. Further, 16% of respondents expressed a desire to improve their financial situation by going abroad for a couple of years, 21% were eager to leave for a temporary job, and 14% wanted to leave for entertainment or study. Thus, we can confirm a positive migration attitude among more than half of unemployed persons. At the same time, it is important to mention that almost one-quarter of respondents would not go abroad at all.
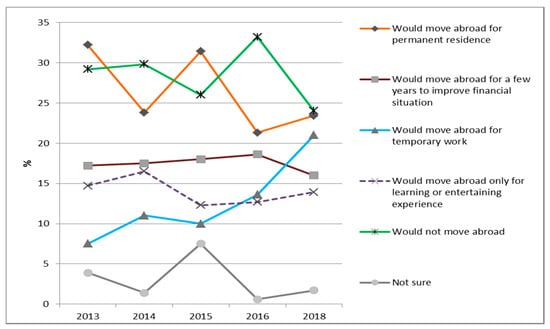
Figure 4.
Migration preferences of unemployed (according to the results of 2013–2016, 2018 panel survey), in % of the number of observations. Source: own data.
Comparative analysis of respondents’ answers for the five years under research showed considerable changes in the intentions of survey participants in two cases. Thus, in 2014, the share of persons who expressed an eagerness to go abroad for permanent residence fell by 10 percentage points compared to 2013. In 2015, it grew again, almost to the number of 2013, and amounted to 31.4%, while in 2016, it fell again. In 2018, it increased slightly to the same number as in 2014. The share of persons preferring temporary work abroad tripled between 2013 and 2018. The number of people who wanted to go abroad for a few years in order to improve their financial situation remained almost the same: within 17–19%. In the same manner, the share of respondents willing to go abroad solely for entertainment and study did not change. The growth in the number of respondents hesitating to reply to the question was significant in 2015. The group of persons who would not go abroad at all was the largest in 2016 and amounted to one-third of all respondents.
Due to the increase of some partial parameters of migration potential and the reduction of others, it is difficult to give a general complex estimate of its dynamic development. In order to solve this problem, we suggest the calculation of the migration desires index (IMD)—one of the most important indicators of migration potential. It can be calculated by the following formula:
where is the weight of migration desires expression; i is the level of migration desires expression; m is the number of parameters in migration desires evaluation; is the number of respondents willing to migrate at the i level; and N is the overall number of respondents.
The weight of component parameters of migration desires expression (weight coefficient) can be calculated by the basis of the Fishber formula (Matkovsky et al. 2016, p. 180):
where m is the number of parameters in migration desires evaluation; and i is the sequence number of the parameter by the level of their importance in the list.
However, using this coefficient, we cannot estimate limits of the migration desires index (MDI). Hence, it is better to use the formula of the weighted average and point scale for calculating MDI:
where N is the overall number of responses for this question and is the number of respondents willing to migrate at the i-level. Thus, we used six single indicators for a complex estimation of migration desires (column 1 of Table 2). Each of the proposed answer options received points from 0 to 5 that measure the degree of migration desires (column 2 of Table 2), where 5 is the highest (typical for people who want to go abroad for permanent residence) and 0 reflects its absence (observed in individuals who do not wish to go abroad under any circumstances). On the basis of the panel survey data, we calculated the migration desires indices for 2013–2016 and 2018 using Equation (3). The basis for calculation and the results are shown in Table 2. In Table 3, an interpretation of index values is proposed.
Table 2.
Migration desires index calculation (frequency of observations for each year).
Table 3.
Interpretation of migration desires index values.
Table 2 data show that the migration capacity of unemployed population in Lviv has a wave-like development tendency, the same as for the share of “solid” migrants. However, the amplitude of MDI oscillation is much weaker. The results of the calculations showed that the lowest migration potential was in 2016 at 2.5 points (corresponding to its average level) and in 2014 (slightly higher than average). The highest index value was observed for 2015. This is due to the large share of persons who would go abroad for permanent residence. In 2018, the MDI is higher than medium (2.73 points), but due to the large share of persons who would go abroad for temporary work. Such details should be considered in developing migration policy tools.
The MDI can be used both for the study of the dynamics of migration potential development for a certain period of time and for comparative analysis of this parameter between regions or separate social–demographic, economic, professional, and other groups. For example, calculation of this index for 2018 by gender showed that men have higher migration potential than women (3.13 points vs. 2.48 points). Moreover, the total index value in 2018 increased in comparison to 2016 due to significant growth of the male MDI.
In addition, respondents had an opportunity to mention the country they would go to. Thus, persons eager to go abroad for permanent residence or for a few years mentioned the following countries: Germany, the USA, Poland, and Canada. Poland was the most attractive country for potential temporary labor migrants. In addition, Germany, the USA, and Spain were the “attractive” countries for potential temporary workers. It is worth mentioning that according to the Gallup World poll, the USA takes first place in the top 20 desired destination countries among potential migrants (Laczko et al. 2017).
Then, we aimed to learn which country corresponds to respondents’ understanding of favorable employment conditions (Table 4). This question was hard to answer for one-third of survey participants each year under research. The remainder indicated the following countries, shown in the order of descending selection frequency: Germany, the USA, Canada, and Poland. The remaining countries were not selected frequently. An interesting fact is that 5–7% of respondents still mentioned Ukraine as a favorable country for employment. The smallest share of such persons was in 2013 (3%), and the largest was in 2014 (7%).
Table 4.
Answers to the question “What country corresponds to your understanding of favorable employment conditions?” *.
At the same time, the majority of unemployed still aspire to be employed here. Thus, in response to the question “What are you ready to do to quickly solve the problem of your unemployment?”, the majority of respondents chose the option of active search for work according to their profession in Ukraine (Table 5). The desire to start one’s own business in Ukraine was also a popular option (it was chosen by 21%–30% respondents). For this reason, we suppose that boosting entrepreneurship development in the region is an up-to-date alternative to unemployment and going abroad for the economically active population.
Table 5.
Answers to the question “What are you willing to do to promptly solve the problem of your unemployment?” (in % of the number of observations, several options were allowed).
The question about the main reasons for migration was also raised in the survey. Despite the fact that the majority of respondents did not have job experience abroad, most tried to identify the main causes of external migration of their relatives and friends. The reasons which took the first two places during all years of the study are low wages and unemployment, and lack of suitable jobs (Figure 5). Thereafter, the most common factors were the desire to provide a better life for their children; housing issues (need to buy a new house or repair current housing); poor occupational opportunities (opportunities for professional self-realization); and economic crisis, instability, and corruption in Ukraine.
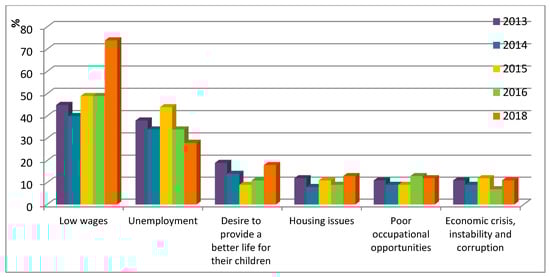
Figure 5.
The main motives of migration abroad according to the assessment of respondents *, % of observations. * The figure shows only those answers that have received the highest frequency of the choice; several options were allowed. Source: own data.
The main motives of external migration are inherent not only for the population of the Lviv region, but also for the whole of the Ukraine. In particular, they are confirmed by the results of the sample survey of households conducted by the State Statistics Service of Ukraine in 2017 (SSSU 2017, p. 20).
Thus, wages are one of the most important reasons for migration (Marchuk 2011; Gheasi and Nijkamp 2017). Therefore, respondents were asked to define the level of average monthly salary in Ukraine that would be able to contain external labor migration. In general, each year we received a significant range of responses (answers): from EUR 400 to EUR 2000. This proves that there are representatives of different labor market segments among the respondents, and that they have different levels of their personal needs and requests. According to the latest survey results (2018), the highest selection frequency (28%) accounted for the salary range of EUR 1001–1200. The interval of EUR 801–1000 took second place (20%). Respondents’ answers were distributed in almost equal parts (10% each) for the three other options: EUR 401–600, EUR 601–800, and EUR 1201–1400. The remaining options were dispersed between 3% and 5%.
In order to develop recommendations in terms of the regulation of migration policy in Ukraine that could be the basis of state authorities’ activity, we calculated the average salary value that can influence the reduction of the population migration capacity. The average salary () was calculated by the formula of the weighted arithmetic average:
where the numerator sums all values of salary () per the selection frequency of each of them (), and the denominator shows the overall number of persons who answered the question. Thus, the average “deterrent” salary level, defined by us on the basis of the 2018 survey, amounts to approximately EUR 1066. Almost the same sum was received on the basis of surveys in 2013 (EUR 1075), 2014 (EUR 1000), 2015 (EUR 1095), and 2016 (EUR 1073). Analysis of the hryvnia exchange rate relative to the average monthly salary in the years under research1 shows that in 2013, the real salary was three times less than the desired one, in 2014 it was 4.5 times less, and in 2015 up to 6 times less. In 2016, the average salary level grew to UAH 5183/month (NBU 2018), along with a slight fall in the hryvnia exchange rate (UAH 25.55/EUR) (SSSU 2018). Therefore, the gap between the real and desired salary decreased slightly, although it still amounted to 5 times. In 2018, with the growth of the salary to UAH 8666/month and the exchange rate of UAH 32.19/EUR, this gap was 4 times. It is worthwhile to mention that in 2013, scientists calculated that EUR 1087.57 is the necessary level of monthly salary for the extended maintenance of the workforce (Zvyagil’skyi 2013, p. 83).
4. Conclusions
The migration desires index is one of the most important indicators of a population’s migration potential and is based on the answers of surveyed respondents. Questions asked in the survey help to determine the shares of different types of people: those who would not go abroad under any circumstances; those who would go abroad only for study or entertainment; those who would go abroad for temporary work; those who would go abroad for a few years to improve their financial situation; and those who would go abroad for permanent residence. Unlike existing studies, this index considers both permanent and temporary potential migration. It allows the risk estimation of prospective human potential losses of some regions or countries. Moreover, the migration desires index is a tool for studying migration potential dynamics and for the comparative analysis between regions and different groups. This will serve as a basis for developing migration policy targeted tools.
In the five years under research (2013–2016 and 2018), the scope of the migration potential of the unemployed population did not face considerable changes. This can serve as confirmation of the conclusion made by Donetsk scientists about the duration of migration potential implementation, namely, that it lasts for 5–7 years (Kipen’ and Avksent’yev 2011, p. 9), after which the change of population migration attitude occurs. Therefore, we plan to continue this surveillance study next year. Moreover, it is worth conducting such a survey, which is representative of all the population of the region, and to compare results. It is possible that the migration potential of unemployed people could be higher than of all the population on average. Furthermore, it would be interesting to calculate the migration potential index in other regions of Ukraine in order to undertake a comparative regional analysis of migration potential levels.
In general, the lowest level of migration desires was recorded in 2014. It is important that such results be observed against the background of the most positive estimations of the financial situation of respondents’ families and their employment opportunities, and more optimistic forecasts of the prospects of national labor market development. As was mentioned above, this situation may have been driven by the victory of the Revolution of Dignity (Euromaidan) and the election of a new president and government, which raised many hopes at the time. In 2016, less optimism, but nonetheless a similar situation, was evident: a slight reduction of migration potential with simultaneous improvement of respondents’ estimation parameters. However, if complete reduction of migration capacity in 2014 can be explained by intangible factors, in 2016, it was caused by a certain stabilization of the economic situation and its slight improvement (Supplementary Materials Appendix S1). These trends prove the fact that the level of the migration potential of population is defined by not only economic but also sociocultural and political factors.
Another important indicator of migration potential is the share of “solid” migrants (those who have the readiness and plans to migrate). In general, research results confirmed the high level of migration desires of the unemployed population in Lviv. Thus, half of the unemployed are prospective migrants, and almost one-fifth belongs to the category of “solid” migrants. Growth of the share of men among “solid” migrants in 2015 can suggest that some men see migration not only as the way to survive or improve their socioeconomic situation but also as the way to avoid military service. However, verification of this hypothesis requires more detailed and profound research.
At the same time, participants of the survey demonstrated clear attitudes towards the active search for work in Ukraine. In other words, the results show a high level of migration potential together with an expressed desire to work in Ukraine. This confirms the conclusions of previous studies that observed migration desires “could be an indicator of people’s general dissatisfaction with conditions in their country, rather than an indicator of a real intention to migrate” (Laczko et al. 2017, p. 2). Therefore, it is very important to conduct research on migration readiness and to improve the living conditions of population. In order to prevent the draining away of the most valuable human potential from Ukraine, there are two key problems that should be solved first and foremost: unemployment and salary. For this purpose, it is necessary to increase the minimum wage level by at least 3 times. However, this should not be a mechanical and sharp growth. Salary growth should be connected with business prosperity and economic development. For those who still have a firm intention to emigrate, the state must ensure an adequate level of social protection, first of all, by establishing cooperation with the countries which are most attractive for potential migrants.
Supplementary Materials
Supplementary Materials are available online at https://www.mdpi.com/2227-7099/7/3/72/s1.
Funding
This research received no external funding.
Conflicts of Interest
The author declares no conflict of interest.
References
- Alvarez-Plata, Patricia, Herbert Brücker, and Boriss Siliverstovs. 2003. Potential Migration from Central and Eastern Europe into the EU-15—An Update. Report for the European Commission, DG Employment and Social Affairs. Berlin: DIW Berlin. Available online: http://ec.europa.eu/social/BlobServlet?docId=3400&langId=en (accessed on 15 January 2017).
- Dolishniy, Maryan, and Stepan Zlupko, eds. 1997. Labor Potential and Employment: Theoretical Fundamentals and Regional Peculiarities. Uzhhorod: Karpaty. [Google Scholar]
- Esipova, Neli, Anita Pugliese, and Julie Ray. 2017. Potential Net Migration Index falls in Middle East, Latin America. Available online: https://news.gallup.com/poll/212141/potential-net-migration-falls-middle-east-latin-america.aspx (accessed on 25 March 2019).
- Gheasi, Masood, and Peter Nijkamp. 2017. A Brief Overview of International Migration Motives and Impacts, with Specific Reference to FDI. Economies 5: 31. [Google Scholar] [CrossRef]
- Grencíková, Adriana, and Jana Spanková. 2016. Labour Migration Trends in the Slovak Republic. Economics and Sociology 9: 158–67. [Google Scholar] [CrossRef] [PubMed]
- International Organization for Migration. Representation in Ukraine. 2001. Migration in Ukraine. Facts and Figures. Kyiv: IOM Mission in Ukraine. [Google Scholar]
- International Organization for Migration. 2017. Representation in Ukraine. Survey on Migration and Human Trafficking in Ukraine. Available online: http://iom.org.ua/sites/default/files/migration_and_human_trafficking_in_ukraine_eng.pdf (accessed on 3 April 2019).
- Jakovljevic, Mihajlo Michael, Yael Netz, Sandra C. Buttigieg, Roza Adany, Ulrich Laaser, and Mirjana Varjacic. 2018. Population aging and migration–history and UN forecasts in the EU-28 and its east and south near neighborhood–one century perspective 1950–2050. Globalization and Health 14: 30. [Google Scholar] [CrossRef] [PubMed]
- Jaroszewich, Marta, Magdalena Lesins’ka, and Oleksandra Betliy. 2014. Forecast of Migration between EU, Countries of Visegrád Four and Eastern Europe: Consequences of a visa Regime Cancellation. Warsaw: Centre for Eastern Studies. [Google Scholar]
- Kipen’, Volodymyr, and Maxim Avksent’yev. 2011. Migration Potential of Ukraine. Donetsk: Skhidnyy Vydavnychyy Dim. [Google Scholar]
- Laczko, Frank, Jasper Tjaden, and Daniel Au. 2017. Measuring Global Migration Potential, 2010–2015; Data Briefing Series of IOM’s Global Migration Data Analysis Centre; Berlin: IOM’s Global Migration Data Analysis Centre. Available online: https://publications.iom.int/system/files/pdf/gmdac_data_briefing_series_issue_9.pdf (accessed on 5 January 2018).
- Marchuk, A. V. 2011. Causes and Main Motives of Labor Migration in the World and Ukraine. Available online: http://www.confcontact.com/20110629/1_marchuk.php (accessed on 7 May 2018).
- Matkovsky, Semen, Olha Grinkevich, Mariana Vdovin, Oksana Vilchinskaya, Oksana Marets, and Oleg Sorochak. 2016. Business Statistics: Tutorial. Kyiv: Alerta. [Google Scholar]
- Mostova, Yulia, and Sergiy Rachmanin. 2018. Bleeding. Why do Ukrainians leave their country? Dzerkalo Tyzhnya. January 27. Available online: https://dt.ua/internal/krovotecha-chomu-ukrayinci-pokidayut-svoyu-krayinu-267394_.html (accessed on 3 April 2019).
- National Bank of Ukraine (NBU). 2018. Official Exchange Rate of Hryvnia against Foreign Currencies (Average for the Period). Available online: http://www.bank.gov.ua/files/Exchange_r.xls (accessed on 8 January 2019).
- Rafique Wassan, M., Zubair Hussain, Muhbat Ali Shah, and Sara N. Amin. 2017. International labor migration and social change in rural Sindh, Pakistan. Asian and Pacific Migration Journal 26: 381–402. [Google Scholar] [CrossRef]
- Sociological Group “Rating”. 2018. Where Do Ukrainians Want to Live? Available online: http://ratinggroup.ua/en/research/ukraine/gde_hotyat_zhit_ukraincy.html (accessed on 3 April 2019).
- Ryndzak, Olha T. 2015. Migration potential of unemployed people of Ukraine in the system of European integrations transformation of regional labor markets (based on Lviv city). Regional Economy 2: 83–9. [Google Scholar]
- Ryndzak, Olha T. 2018. Factors and motives of external migration of Ukraine’s population. Socio-Economic Problems and the State 18: 112–21. Available online: https://sepd.tntu.edu.ua/images/stories/pdf/2018/18rotmnu.pdf (accessed on 2 April 2019).
- Sadova, Ulyana. 2011. scientific editor. Regional Migration Policy and Its Implementation Mechanisms. L’viv: Instytut rehional’nykh doslidzhen’ NAN Ukrayiny. [Google Scholar]
- Shevchenko, Larysa, ed. 2008. New Dictionary of Foreign Words: About 40,000 Words. Kyiv: ARIY. [Google Scholar]
- State Statistics Service of Ukraine (SSSU). 2018. Official Site. Average Monthly Wages by Type of Economic Activity since the Beginning of the Year. Archive. Available online: http://www.ukrstat.gov.ua/ (accessed on 8 January 2019).
- State Statistics Service of Ukraine (SSSU). 2017. External Labor Migration of the Population (Based on the Results of a Modular Sample Survey). Statistical Bulletin. Kyiv: State Statistics Service of Ukraine. [Google Scholar]
- United Nations, Department of Economic and Social Affairs, Population Division. 2017a. International Migration Report 2017: Highlights. New York: UN. [Google Scholar]
- United Nations, Department of Economic and Social Affairs, Population Division. 2017b. International Migration Stock 2017: Graphs. Twenty Countries or Areas of Origin with the Largest Diaspora Populations (millions). New York: UN. Available online: http://www.un.org/en/development/desa/population/migration/data/estimates2/estimatesgraphs.shtml?4g4 (accessed on 28 January 2019).
- Vorona, Valerii, and Mykola Shulga. 2016. chief editors. Ukrainian Society: Monitoring of Social Changes. Kyiv: Institute of Sociology of the National Academy of Sciences of Ukraine. [Google Scholar]
- Yormirzoev, Mirzobobo. 2017. Determinants of Labor Migration Flows to Russia: Evidence from Tajikistan. Economics and Sociology 10: 72–80. [Google Scholar] [CrossRef] [PubMed]
- Zaiceva, Anzelika. 2006. Reconciling the Estimates of Potential Migration into the Enlarged European Union. IZA Discussion Paper. Bonn: SSRN, No. 2519. [Google Scholar]
- Zvyagil’skyi, Yukhym. 2013. Level of wages is an indicator of the efficiency of the program of economic reforms. Economy of Ukraine 9: 73–84. [Google Scholar]
| 1 | 2013 year: average monthly salary amounted to 3265 hrn, and official hryvnya exchange rate was 10.6 hrn/euro; 2014: salary—3480 hrn/month with exchange rate 15.7 hrn/euro; 2015: salary—4195 hrn/month with exchange rate 24.2 hrn/euro; 2016: salary—5183 hrn/month with exchange rate 25.55 hrn/euro (average per year) (NBU 2018); (SSSU 2018). |


© 2019 by the author. Licensee MDPI, Basel, Switzerland. This article is an open access article distributed under the terms and conditions of the Creative Commons Attribution (CC BY) license (http://creativecommons.org/licenses/by/4.0/).