1. Introduction
The increase in the importance of spatial interaction between social sciences can be reinforced by, among other methods, the greater availability of georeferenced data together with the development of specific software including modules allowing the statistical analysis of said data (
Anselin and Florax 1995). As a result of the combination of these factors, the analysis of space begins to acquire special importance among the social sciences, highlighting tourist activities due to the special relationship with their being carried out in a given territory.
The location of any tourist company in a given space favors aspects as essential for its satisfactory progress, such as the amount of resources available, the level of occupation, seasonality, or competitive intensity, among others (
Cawley and Gillmor 2008;
Hall 2011). In addition, it can also be influenced by factors such as accessibility or the offer of complementary accommodation or services (
Martín et al. 2018).
It should be taken into account that tourist activities strongly depend on the assets and attractions found in specific locations, as tourism is a sector with a strong tendency towards spatial concentration (
Carreras Verdaguer 1995), which therefore encourages the emergence of so-called agglomeration economies.
The main consequence of the formation of agglomeration economies is that they generate a series of spillover effects, which can be both positive and negative with respect to tourist activities, and which must be taken into account in order to properly understand how these activities operate. Geographical spillover effects are the indirect or unintended effects that the industry of a tourist region has on the tourist flows of other nearby regions (
Yang and Fik 2014;
Yang and Wong 2012).
At the urban level,
Yang and Wong (
2012) studied the location of hotels through the construction of a LOGIT model that allowed them to determine that the first hotels to be located and those with the lowest service offerings have a greater predilection for occupying the most central locations in the city. In Hong Kong,
Li et al. (
2015) investigated the spatial association of urban tourism in relation to the type of land use, finding that commercial use has a strong association with the location of hotels. At the inter-regional level,
Majewska (
2015,
2017) focused on analyzing distribution patterns in Poland, observing the existence of different clusters and studying the determinants that lead to their formation.
By means of the analysis of spatial distribution patterns, groups of companies can be identified with similar behavior and, in turn, can be differentiated from those that would be expected under a hypothesis of random distribution in the territory; locations can also be indicated in which tourist activities are highly concentrated and have implications which must be taken into account for proper management of the activities.
The importance, therefore, of the discovery and identification of these specific patterns in certain destinations underlies the implications that tourism discovery entails, ranging from infrastructure planning and transportation improvement, or the development of tourism products, to the satisfactory management of the social, environmental, and cultural impacts of tourism, correcting possible regional inequalities (
Xing-Zhu and Qun 2014).
Among the techniques traditionally used to analyze tourist activities, the use of spatial association measures, both global and local, stands out. It should be noted that these present a great sensitivity, due among other factors to the demarcation of the boundaries of the territorial units (size, shape, position in the territorial division of the country, etc.), in addition to the neighborhood criteria used to define the spatial association (contiguity, Euclidean distance, the spatial weights matrix, etc.). Therefore, the decisions made to address the analysis regarding the criteria of neighborhood and territorial scale selected may affect the results obtained (
Majewska 2015,
2017;
Rodríguez-Rangel and Sánchez-Rivero 2019,
2020;
Sánchez-Martín et al. 2019).
The region of Extremadura can be described as an emerging inland destination located in the southwest of Spain. It is characterized by having a rich heritage and landscape legacy that gives it enormous potential for the development of heritage and nature tourism; both typologies are highly dependent on generating sustainable development models around their main assets. Therefore, to properly plan tourist activities with an awareness of the needs of existing infrastructure by designing competitive products or managing possible economic, social or environmental imbalances that may exist in the territory, it is necessary to have exhaustive information on the spatial distribution of the activities at that destination.
Along these lines, there have been several studies that, by using different methodologies, focus on identifying and characterizing localized clusters. These studies have shown that the distribution of tourist activities in a space does not correspond to a random pattern but is found to be grouped into certain locations (
Sánchez Martín et al. 2013,
2018;
Rodríguez-Rangel and Sánchez-Rivero 2019,
2020;
Sánchez-Martín et al. 2019;
Sánchez-Rivero 2008). To date, however, to the authors’ knowledge no alternative statistical technique has been used that allows, as
Wall et al. (
1985) suggest, confirmation that the results achieved are not influenced by the selected criteria compared with those obtained by complementary techniques pursuing the same purpose. Therefore, this paper aims to study the spatial distribution of accommodation in the region of Extremadura, Spain, using statistical techniques as an alternative to those previously used, spatial association measures, with the aim of assessing in the first place whether the activities are distributed following a random pattern. If this is not confirmed we aim to describe the structure that is identified in the intensity of the tourist activities.
In order to achieve its objectives, this paper is structured as follows: After this introduction a bibliographic review is carried out so as to determine the relationship between the tourist activities and the space. We then proceed to characterize the destination under study by synthesizing the results achieved with previous studies in the field. In the methodology section a description of the statistical techniques used to analyze the degree of intensity of the tourist activities in the space is given so as to enumerate the main results obtained in
Section 5. Finally, the main conclusions and implications of the results of this research are collected.
2. The Importance of Space in Accommodation Distribution
In recent years there has been a tendency to recognize the importance of space in many economic processes (
Goodchild et al. 2000), which is especially pronounced in the case of tourist activities because it analyzes the dimension. Geographical tourism can be useful to better understand the operation of this activity, while allowing knowledge to be derived for its management and marketing (
Xing-Zhu and Qun 2014).
Tourist activities have a clear tendency to concentrate in a space, which is due, among other factors, to the preference of companies to be located around the main tourist attractions. As
Carreras Verdaguer (
1995) points out, this results in a high spatial concentration of both demand and tourism supply.
However, this tendency towards a strong concentration in a space cannot be explained by the existence of tourist attractions in isolation because sometimes the decision to locate in a certain territory can be justified by the existence of a strong business presence that acts as a focus of attraction per se.
Marshall (
1920) emphasizes that companies can benefit from the existence of agglomeration economies in their location decisions. We understand by this that those economic externalities available to companies in large concentrations of economic activity arise because they allow a choice between a more specialized range of services. The author describes two main types of profit: production improvement and demand intensification.
The improvement of production is due to several reasons, such as the creation of a highly specialized labor market and the transfer of knowledge and technology, although as indicated in the work carried out by
Canina et al. (
2005), these types of benefits are more associated with technologically sophisticated industrial sectors rather than with service sectors with a low technological base. However, some studies carried out in the specific sector of tourism confirm how improvements in production are also likely to occur in this sector. This is the case of the work carried out by
Polo Pena et al. (
2015), in which it is confirmed that space agglomeration favors the spread of the adoption of a more market-oriented strategy among rural tourism companies that are spatially grouped.
For its part, the intensification of the demand that occurs as a result of grouping can be considered a source of the creation of magnetism towards the area while allowing companies to take advantage of better results than would be expected in an isolated location. As
Majewska (
2015) points out, the heterogeneity and density of the tourist offering can also serve as a tourist attraction due to the diversity of services, such as transport and accommodation, infrastructure, and facilities for leisure activities, such as eating and drinking or participation in cultural, social, and sporting events. Therefore, an inadequate allocation of resources can sometimes be overcome if localization economies support the tourism industry (
Yang and Fik 2014). As
Capone and Boix (
2008) point out, the growth rate of local tourism depends more on the strengthening of localization economies than on the natural resources that the destination possesses.
Given all of the above, companies can be expected to be aware of the benefits that come with their location in areas where they already have a strong business base that allows the creation of agglomeration economies in order to take advantage of positive externalities. At the same time, however, it should be borne in mind that as a strong business presence increases competition, it can also generate negative effects on the performance of companies located together. Some authors identify an inverted U relationship between the number of existing hotels and the appearance of new hotels, which is explained by the fact that an intense level of competition distances new participants (
Baum and Haveman 1997;
Ingram and Inman 1996).
Along these lines, different studies have emerged which seek to examine in depth when the benefit is greater and who benefits most from the positive externalities created as a result of location in a cluster in which there is a strong business agglomeration.
Chung and Kalnins (
2001) conducted a study in Texas in 1992, the results of which show that agglomeration intensifies demand, particularly in rural markets in which the actions carried out by companies reduce the costs of seeking information. In addition, its results indicate that the location of small independent hotels near large hotel chains benefits the former by increasing their income as a result of the intensification of demand. Along the same lines,
Canina et al. (
2005) confirm that hotels of a lower category are more likely to receive positive spillovers when they are located in clusters with higher category hotels. On the other hand, the results of the study carried out by
Freedman and Kosová (
2012) reveal that the benefits of agglomeration vary according to hotels in different product segments, and that new hotels are more likely to choose an area with a greater concentration of hotels in other segments to seek greater product differentiation.
Balaguer and Pernías (
2013) carried out a study in the region of Madrid in which they conclude that the spatial agglomeration of hotels significantly affects both the price level and its dispersal and therefore the profitability of the business.
The results achieved by the various studies confirm that a joint location generates positive effects; although they will not benefit equally all the members of the clusters formed, they will create positive externalities that will act as a force of attraction that hinders the homogeneous distribution of activities in a space. As
Yang et al. (
2014) point out, hotels are not randomly distributed in space; their locations are normally grouped with other homogeneous or heterogeneous hotels to achieve an agglomeration effect. In this context, the correct management of tourist activities requires thorough knowledge of the activity patterns created in the space for a double purpose: on the one hand to be able to enhance the positive effects generated as a result of the joint location, and on the other hand to mitigate the possible adverse effects arising from concentration of the activity in the space.
Knowledge of the pattern of distribution existing between accommodation establishments provides administrations with vital information for planning at both an urban and regional level, especially in those cases in which it is necessary to provide necessary infrastructure services or urban renewal (
McNeill 2008).
On the other hand, this knowledge of the existing pattern also provides the possibility of improving possible regional inequalities and managing the social, environmental, and cultural impacts of tourism (
Xing-Zhu and Qun 2014). In fact, although agglomeration offers opportunities for obtaining advantages from positive externalities, as a result of high tourist intensity, negative consequences may also be generated for the destination, such as congestion, which prevents the creation of a model of sustainable tourism development.
Lew and McKercher (
2006) stress that the negative impacts of tourism tend to occur when a place is visited by more tourists than it can sustain.
As a result of all the above, the need to know how tourist activities are distributed in space for proper management is evident and this need has been materialized by the proliferation of a series of studies which aim to generate knowledge of this aspect.
One of the prevailing currents within the field of study is to track the routes generated by visitors to a specific destination. In this way a high degree of knowledge of how visitors behave at their destination can be achieved: what they visit, when they do so, and how long they remain at each of the different attractions. To obtain this knowledge, some of the work carried out is supported by GPS devices that allow the obtaining of very detailed information on the tourist flows of a destination.
East et al. (
2017) conduct a study on the visiting patterns of a specific attraction, with the result being that the majority of visitors follow similar routes by inertia, which means a greater likelihood of destination congestion. On the other hand,
Galí Espelt and Donaire (
2018) study the differences in routes between those visitors who repeat visits at their destination compared with those who do so for the first time, with the result being that significant differences are only obtained when they are experienced visitors, i.e., those who have visited the destination more than four times.
Mckercher and Lau (
2008) conducted a study which allowed them to synthesize the 78 movement patterns analyzed in 11 movement styles in Hong Kong.
The new sources of information of big data have also contributed to an analysis base for the performing of different studies aimed at obtaining information on the movement patterns of tourists, in addition to serving as a basis for analyzing the association of tourism and space.
Chua et al. (
2016) use information from the geotags of the Twitter social network to describe the flows of tourism in Cilento, with the result being that photos geo-tagged by tourists have a greater tendency to concentrate than those shared by residents of the area. The photos shared by the tourists themselves through different social media have also served as the basis for various studies that have contributed to generating information on the distribution of tourism demand at different destinations at a European level (
García-Palomares et al. 2015;
Gutiérrez et al. 2016;
Batista e Silva et al. 2018).
The ultimate purpose of these studies is to identify groupings of accommodation establishments in a space, i.e., the identification of spatial clusters. To do so they have used different techniques of spatial statistics, among which both global and local spatial association indicators stand out. To be specific, the Moran global statistic I together with the general G(d) of Getis and Ord and the LISA (Local Indicators of Association Spatial) maps stand out as the most commonly used indexes for the identification of spatial association or dependence (
Moran 1948;
Getis and Ord 1992;
Ord and Getis 1995;
Anselin 1995).
These techniques show great potential in the identification of spatial clusters, but it is necessary to define the spatial interaction between the different entities under study by establishing a neighborhood criterion that constitutes a weakness in the technique due to the dependence of the results on the criteria finally selected.
In the specific case of the territory on which the present study focuses, a series of studies have been carried out with a common purpose: ascertaining the pattern of distribution in the region. As a common result of all of these it was found that tourist activities are not distributed at random in the territory; there are areas in which there is greater tourist intensity (
Martín et al. 2018;
Sánchez Martín et al. 2013;
Rodríguez-Rangel and Sánchez-Rivero 2019,
2020;
Sánchez-Martín et al. 2019;
Sánchez-Rivero 2008). To reach these conclusions, these studies used spatial association measures that allowed them to discover different clusters in which there is a greater tourist density. To date, however, to the authors’ knowledge no study has been carried out to address the distribution in the territory with alternative statistical techniques that overcome the intrinsic limitations of spatial association measures, contrasting with greater reliability the results obtained as proposed by
Wall et al. (
1985).
This study therefore aims to confirm the spatial trend identified by previous studies by estimating an intensity function of the total accommodation of the region using non-parametric techniques: Ripley’s K(r) function, Gaussian kernel smoothing, and quadrant counting.
In order to help the reader understand better the results obtained in the next chapter, a description of the destination under study is given. This also facilitates a synthesis of the results achieved by the previous studies carried out there.
3. Case Study: Extremadura
Extremadura is a Spanish region located in the southwest of the Iberian Peninsula; its location can be seen in
Figure 1. It consists of the two largest provinces in Spain, Caceres and Badajoz, and has a total surface area of 41,633 km
2. Its economy has traditionally shown a strong dependence on agricultural and forestry activities, and it is the Spanish region with the lowest GDP per capita (
Instituto Nacional de Estadística 2019). In addition, it has a high unemployment rate, which reached 19.68% in the third quarter of 2019 (
Instituto Nacional de Estadística 2002).
This unfavorable economic context has led the region to benefit from theLEADER (Liaisons entre Activités de Development de L´Economie Rural), LEADER II, and PRODER (Programa Operativo de Desarrollo y Diversificación de Zonas Rurales) European aid programs, which aim to diversify its economy in order to solve its demographic, social, and economic problems. Although these programs focus on developing different sectors, they have a special impact on tourism. In the specific case of the region under study, these grants have affected the growth of the accommodation capacity of the region, especially in rural areas, which has greatly increased in recent decades (
Sánchez Martín et al. 2013;
Masot and Gascón 2008). To be precise, this sector has evolved from having 108 accommodation establishments with 1003 beds in 2001, to 9134 beds in 772rural accommodation establishments in 2018 (
Instituto Nacional de Estadística 2020;
Observatorio de Turismo de Extremadura 2019).
This has had a significant impact on the development of the accommodation pool in Extremadura, since from the total number of existing accommodation establishments (1575 for the year 2018) the relative importance of rural tourism for the sector as a whole can be appreciated as can be seen in
Table 1.
However, as noted by authors such as
Sánchez Martín et al. (
2013,
2018), this increase in the accommodation capacity of the region has not been equally distributed throughout the territory; it is more prevalent in certain territories that depend on their existing tourist assets. Neither has it been accompanied by a comparable growth in the number of travelers arriving in the region, which reached a total of 1,866,169 visitors who made 3,438,671 overnight stays in the region in 2018 (
Observatorio de Turismo de Extremadura 2019). This fact has caused a series of imbalances that have been the reason for conducting various studies in order to understand how tourist activities are distributed in the region. Exhaustive knowledge of the distribution patterns of tourist activities will allow the design and planning of appropriate strategies for correct management of this activity by means of a sustainable development model that achieves the objectives pursued.
To the authors’ knowledge the first study carried out to ascertain the pattern existing in the region is that of
Sánchez-Rivero (
2008). The author focuses on analyzing the distribution of tourist activities by considering both accommodation and restaurants. In addition, in analyzing the beds available, the division between hotel beds and rural accommodation is taken into account. The results of this research included the identification of three hotspots in the distribution of hotel beds in the main cities of the region: Badajoz, Caceres, and Mérida. In the case of rural accommodation, it identifies a series of clusters in the north of the region, to be precise in the territories of the Valle del Jerte and La Vera, and Tajo Internacional-Sierra de San Pedro, and in the vicinity of the National Park of the Monfragüe Biosphere Reserve. As far as restaurant locations are concerned, a random distribution pattern was found.
Sánchez Martín et al. (
2018), focused on analyzing the distribution pattern by comparing the positions offered in the 2004–2014 period. Among the main results of the study they highlighted the identification of a cluster of high values in the north of the region, in the territories of La Vera, Valle de Ambroz, and Valle del Jerte, as well as in the main cities (Badajoz, Cáceres, and Mérida), albeit with different degrees of significance.
Rodríguez-Rangel and Sánchez-Rivero (
2019) analyzed the distribution pattern of travelers arriving in the region, differentiating between those who choose to stay in hotel accommodation and those who prefer other types of accommodation. Their results reveal a preference for the three main cities in the region.
On the other hand,
Sánchez-Martín et al. (
2019) studied the distribution of rural accommodation in isolation, identifying areas of a strong concentration of beds in the region of La Vera, Zafra-Río Bodión, Vegas Altas, and in the Alange area. On the other hand, cold spots were identified in the vicinity of Montánchez, Sierra de Gata, and the Valle del Jerte.
Having their suspicions regarding the unequal distribution of beds and travelers,
Rodríguez-Rangel and Sánchez-Rivero (
2020) focused on analyzing, on the one hand the beds offered by the accommodation establishments, and on the other their level of occupation, using this as a proxy indicator of their level of efficiency. Their results confirm the largest grouping of tourist beds in the cities of Badajoz and Caceres, and helped to identify the presence of three clusters of high values (Badajoz, Caceres, and Mérida) and two of low values (Trujillo-Miajadas-Montánchez and the Villuercas-Ibores-Jara Geopark) with regard to the occupation level achieved.
In view of the results obtained some similarities can be appreciated but also certain discrepancies, which invite verification by means of statistical techniques as an alternative to those they used (measures of spatial association) to obtain their results.
4. Methodology
The data analyzed in this paper are spatial point patterns (SPP), which contain the XY (longitude–latitude) coordinates of the points. The hypothesis to be tested is the spatial homogeneity (or complete spatial randomness, CSR) of SPP. If it is rejected, the heterogeneous structure of intensity will be investigated. In territorial terms, “intensity” could be defined as the average density of spatial points, i.e., the expected number of points per unit area. In the case of CSR, we can speak of “uniform” or “homogeneous” intensity, whereas when the CSR hypothesis is rejected, we speak of “inhomogeneous” intensity.
If a point process
X is homogeneous, for any sub-region
B of the global region
R the expected number of spatial points in
B can be calculated as follows:
in which the constant of proportionality λ is the intensity. The empirical density of points,
, can be calculated as follows:
with
n(
x) being the total number of spatial points in the region
R; and the area(
R) being the total area of the region
R.
is an unbiased estimation of the true intensity λ.
The CSR implies the following:
The number of points falling in any region R has a Poisson distribution with a mean of λ.
The locations of the n points inside the region R are i.i.d. (independent and identically distributed) and uniformly distributed inside R.
The contents of two disjointed regions
R1 and
R2 are independent (
Baddeley 2010).
To test the CSR hypothesis, the first step is to plot the point patterns observed in a rectangle [min(
x), max(
x)] × [min(
y), max(
y)] in which
x and
y represent the Cartesian coordinates of the points. To test the spatial homogeneity hypothesis in this rectangle, the Spatial Laplace Principle (
Smith 2020) is applied. This principle states that if the square is divided into a large number (
n) of grid cells and we consider a spatial point, each cell has the same probability (1/
n) of containing the point. This principle induces in terms of probability a uniform probability distribution in the region. The assumption of spatial randomness is that the locations of points in region
R have no influence on one another. If
C is a grid cell contained in
R (
), a Bernoulli random variable
X(
C) could be defined for each grid cell, in which
X(
C) = 1 if the point is located at
C and
X(
C) = 0 otherwise. The spatial randomness implies that the random variables
are assumed to be statistically independent for each grid cell
C.
If the intensity of a point process varies from place to place (a nonhomogeneous process), the expected number of points falling in a small region of area
around a location
u is calculated in the following way:
for all sub-regions B. In the above equation λ(
u) is called the “intensity function” of the process. This intensity function can be estimated by nonparametric techniques, such as quadrant counting, K-functions, and kernel smoothing (
Baddeley 2010).
In quadrant counting the region
R is divided into
m excluding sub-regions (“quadrants”) of equal areas B
1, B
2, …, B
m. Then the number of points falling in each quadrant,
for
j = 1, 2, …,
m, is computed. A standard test for the null hypothesis of CSR is the χ
2 Pearson goodness-of-fit
in which
, which is the total number of observed spatial points in region
R. This Pearson goodness-of-fit test has a χ
2 distribution with (
m − 1) degrees of freedom.
An alternative to quadrant methods is the calculation of Ripley’s
K(
r) function to know whether the phenomenon of interest is randomly distributed throughout the study area. This function (
Ripley 1977,
1988) is defined so that λ
K(
r) equals the expected number of additional random points within a distance
r of a typical random point of
R. The estimation of the K function can be used to summarize aspects of inter-point “dependence” and “clustering”. Taking into account that in the case of a completely random point process,
K(
r) = π
r2, deviations between the empirical y and theoretical K curves may suggest spatial clustering or spatial heterogeneity.
The K-function is given as:
in which
a is the area of the rectangle (window);
n is the number of spatial points; and
ki,j is a weight that will be equal to one when the distance between point
i and point
j is less than
r and will be equal to zero otherwise.
It is possible to represent graphically not only the observed K function and the expected K function but also an interval estimation of exact expected values, including both a lower and a higher confidence envelope. This graph can be interpreted as follows:
If the Kobserved function is larger than the Kexpected function for a particular distance r, then the distribution observed is more clustered than a random distribution.
If the Kobserved function is smaller than the Kexpected function for a particular distance r, then the distribution observed is more dispersed than a random distribution.
If the Kobserved function is larger than the higher confidence envelope function (KHiConfEnv) for a particular r, then the spatial clustering for that distance is statistically significant.
If the Kobserved function is smaller than the lower confidence envelope function (KLoConfEnv) for a particular r, then the spatial dispersion for that distance is statistically significant.
If the Kobserved function is similar to the Kexpected function for a specific distance r, then the distribution observed is a random distribution.
Finally, in order to identify possible XY coordinates where the hypothesis has been disproved another graphical approach is possible. Thus, a Gaussian kernel density estimation (
Diggle 1985) can be plotted to obtain an impression of local spatial variations in intensity.
The kernel estimator of λ(
u) is:
in which
k(
u) is the kernel (an arbitrary probability density) and
is an edge effect bias correction (
Baddeley 2010).
A kernel density with a unique color (the same number of points in each grid cell) means a CSR scenario, while different colors (a different number of points in each grid cell, i.e., a different intensity) mean a clustered or dispersed scenario. In addition, this kernel estimation can also be represented in perspective plots of a surface over the x–y plane and in a contour plot.
5. Results
The SPP analyzed represents the whole population of accommodation establishments located in Extremadura on 1st January 2019 (1591 spatial points). This population includes both hotel establishments and nonhotel establishments (rural accommodation, tourist apartments, campsites, and hostels). All graphs and calculation presented in this epigraph were produced using the R package spatstat (
Baddeley and Turner 2005).
The spatial representation of these establishments is shown in
Figure 2. The Coordinate Reference System used in this research is EPSG:4326—WGD84. In
Figure 2, the X-axis (longitude) includes values (in decimal degrees) between −7.55° and −4.75°, while the Y-axis (latitude) includes values between 37.9° and 40.5°. These limits define the minimum and maximum geographical coordinates of Extremadura, so that all the spatial points analyzed are included in the window represented by
Figure 1 (no space points are excluded).
As can be seen, the spatial distribution of the accommodation establishments appears not to be uniform throughout the regional territory. Indeed, it is intuited that the northern third of the region concentrates a higher number of establishments than the remainder of the region. If XY coordinates are represented in the form of histograms (see
Figure 3), the lack of homogeneity of distribution of the location of accommodation establishments in Extremadura can be graphically observed. A higher frequency of establishments can thus be identified in the central longitude strip (mainly between −6.4° and −6.2° and also to a lesser extent between −6.0° and −5.8°) and the northern latitude strip (between 40.0° and 40.2° and between 39.4° and 39.6°).
To confirm statistically this graphically perceived heterogeneous structure of intensity in the distribution of establishments, a Ripley’s K(r) function was estimated (see
Figure 4). As can be seen, there are significant differences between the Ripley’s function observed and the Ripley’s function expected given above the CSR hypothesis. For all r values it can be concluded that the observed distribution of establishments in the region is more concentrated than random distribution, because in all cases the function observed is higher than the functions expected.
Another way to confirm this nonhomogeneous intensity is to estimate a Gaussian kernel function (see
Figure 5).
The previous kernel estimation shows where the intensity of accommodation establishments reaches its maximum and minimum values. Thus, it is intuitive to verify a clear pattern of a higher intensity in the central longitude strip, but with a nonhomogeneous intensity inside (because this intensity clearly decreases from north—the highest accumulation of establishments of the region—to south—the lowest accumulation).
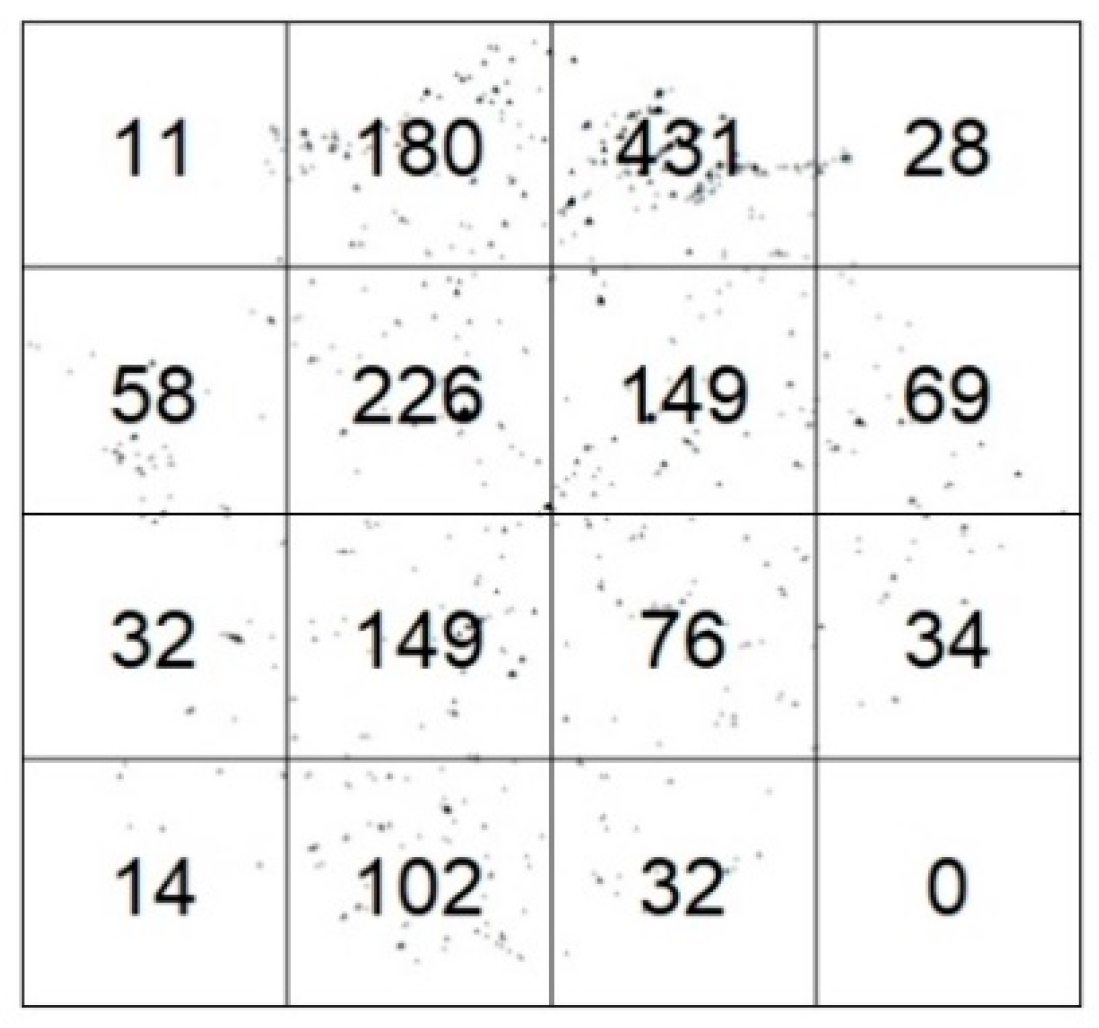
Finally, a quadrant counting approach was used to confirm the previous results. A 4 × 4 quadrant was considered and the observed number of accommodation establishments in each grid cell was calculated (
Figure 6). The expected number of spatial points per quadrant in the case of the CSR hypothesis is in this case equal to 99.4. It is easily verifiable that there are important differences between the SPP expected and observed in every grid cell.
In addition to
Figure 6,
Figure 7 shows not only the number of spatial points observed (top left), but also the number expected (top right) and the Pearson residual calculated by dividing the difference between the value observed and the value expected by the square root of the value expected (bottom). The higher the absolute value of the Pearson residual, the clearer the breach of the CSR hypothesis.
The figure above allows the identification of the territories where a higher intensity of accommodation establishments can be found. These territories are, on the one hand the third quadrant (row 1, column 3; delimited geographically between [39.9°; 40.5°] longitude and [−6.15°; −5.45°] latitude), and on the other hand the sixth quadrant (row 2, column 2; delimited between [39.2°; 39.9°] longitude and [−6.85°; −6.15°] latitude) (see
Figure 8).
Finally, a chi-squared test of CSR using the previous quadrant counting was carried out. The value of this test was 1850.9 with 15 degrees of freedom and an associated bilateral p-value equal to 0.0000. The hypothesis of complete spatial randomness for the distribution of accommodation establishments in Extremadura thus has to be clearly rejected at a 5% level of significance. It can be concluded that there is a heterogeneous spatial distribution of the accommodation establishments in Extremadura.
6. Discussions
The verification of the CSR hypothesis is crucial in the management and planning of tourist destinations. If the intensity of accommodation establishments is uniform in a destination, it could be assumed that the advantages and disadvantages of tourist activities will be manifested with the same intensity in each place in it. However, if this intensity is not uniform, the concentration of the tourist offering may be directly related to a higher intensity of tourist activities. Consequently, the tourist management/planning and strategic development policies of the destination should not be applied in the same way. Merely as an illustration, therefore, the consequences of a heterogeneous intensity in a tourist destination could be as follows:
Investment in tourism infrastructure, both public and private, should be mainly directed at certain territorial spaces and not at all equally. Complementary tourist infrastructure (catering, service companies, travel agencies, etc.) should therefore be created in the destination areas where the accommodation intensity is highest.
Tourist pressure is not the same throughout the destination. In some spatial locations the pressure of the activity on the territory is reduced (a low intensity of accommodation); in other locations the tourist pressure can be very high (a high intensity of accommodation) especially in the high season. Consequently, the tourist sustainability of the territory is not equally achievable throughout the destination.
Tourist accommodation establishments do not compete with each other in the same way to attract customers depending on the intensity of accommodation at the destination. In the case of accommodation establishments located in geographical spaces of low or very low intensity, the mutual competence of which is very limited or zero (as they operate under the system of oligopoly and even monopoly in some cases), the accommodation located in spaces with a high or very high intensity (perfect competition) will be forced to compete with each other to attract customers. This generates better products and services at market prices with the consequent benefits for the customer.
The creation of packages and tourism products is also conditioned by the number of accommodation companies operating in the territory. In a geographical space where there is a high concentration of accommodation there will also be a high intensity of other tourist companies (restaurants, tour guides, complementary activity companies, etc.). The development of these packages will therefore be easier in locations of the destination where there is a high intensity of tourist activities than in those where there is a low intensity.
For the above reasons it is important to identify the geographic spaces within a territory that have higher expectations of tourism development, as they will be those in which the highest levels of accommodation intensity are located.
In the case which concerns us, the analysis will focus on the two quadrants in which the accommodation intensity is much higher than expected in the case of complete spatial randomness (CSR). These two quadrants (
Figure 6), delimited between the 39.9° and 40.5° longitude coordinates and −6.15° and −5.45° of latitude (Quadrant A), and between the 39.2° and 39.9° longitude coordinates and −6.85° and −6.15° of latitude (Quadrant B), are analyzed below to quantify the advantages or disadvantages in terms of tourist activities.
Quadrant A includes three traditional micro-destinations in Extremadura linked to cultural tourism (Plasencia), nature tourism (Valle del Jerte and La Vera), and active tourism and spas (Valle del Ambroz). The tourist magnitudes of these three micro-destinations are presented in
Table 2 from the perspective of both supply and demand. As can be seen, the number of beds in the quadrant amounts to 13,256, which are mainly concentrated in the Valle del Jerte and La Vera. The average size of the accommodation establishments ranges between 30.8 places per establishment in the Valle del Ambroz, and 43.2 places per establishment in the municipality of Plasencia. The annual occupancy rate of these establishments is well above the regional average (36.24% for hotels and 18.13% for rural accommodation in 2018 according to data from the Spanish National Statistics Institute), since the occupancy rate of both the Valle del Ambroz and the municipality of Plasencia is around 46%, while that of the Valle del Jerte and La Vera (with a clear predominance of rural accommodation rather than hotels) is 31.36%. The number of visitors in these three micro-destinations during 2018 was almost 348,000 tourists, 18.70% of the total number of visitors to the region. Finally, the overnight stays of these three micro-destinations in 2018 were 833,000, which means that a quarter of the total overnight stays registered in the region were located at quadrant A.
With these figures it is clear that tourism sustainability policies must be applied basically in these three micro-destinations, and especially in the Valle del Jerte and La Vera, in which the state of preservation of its natural environment is its main tourist asset. On the other hand, the combination of different tourism types (cultural, nature, active, thermal, etc.) in a very small geographical space facilitates the designing of combined tourist packages to increase the average stay in the area. Finally, the accommodation companies in the area are the most competitive in the region, since their high number forces them to offer tourist products and services of excellent quality at a competitive price due to the numerous options available to tourists in this area.
Quadrant B includes the two most representative icons of tourism in Extremadura: the city of Caceres, which in 1986 was declared a World Cultural Heritage Site; and Monfragüe National Park, the regional treasure for nature tourism which was declared a UNESCO Biosphere Reserve in 2003. The most significant tourist figures of 2018 in this Quadrant B are shown in
Table 3. As can be seen, the total number of beds available in these two iconic micro-destinations rises to 5720, with the average size of the establishments being smaller than those of Quadrant A: 24.8 beds per establishment in Caceres and 27.5 beds per establishment in Monfragüe. The average annual occupancy rates of these establishments reach almost 50% in Caceres and 27.3% in Monfragüe; in the latter territory almost the entire offer of accommodation is of a nonhotel nature (rural hotels and rural lodging). The number of tourists who visited the micro-destinations of this Quadrant B during 2018 reached a total of 412,565 visitors, a figure representing 22.1% of the total visitors to the entire region. Finally, the overnight stays generated by these visitors amounted to almost 700,000, which is 20.2% of the total volume of overnight stays in the region analyzed.
The exceptional nature of the fact that two major tourist attractions are concentrated in Quadrant B and must be subject to special protection (a city declared a World Heritage Site and a national park declared a Biosphere Reserve less than 40 kilometers apart) obliges the tourism authorities in the region to be especially vigilant to ensure the sustainable tourism development of the area. In this sense it is necessary to carry out analyses on the concentration of travelers throughout the year, to determine the carrying capacity of the territory, and to establish restrictions on the carrying out of certain tourist activities if they may harm the protected cultural and natural heritage.
On the other hand, for private investment initiatives in the tourism sector this tourist attraction pole of Cáceres–Monfragüe represents an excellent opportunity to establish new tourism businesses as the interrelation with other tourism products and services (restaurants, active tourism enterprises, etc.) facilitates the success of these businesses if they can take advantage of scale economies and synergies between companies in the tourism sector of the quadrant.
Finally, by way of conclusion, the following comments can be made.
The spatial intensity of the accommodation establishments in a certain territory determines the possible existence of territorial specialization focusing on tourism. For this reason, the verification of the hypothesis of complete spatial randomness in the geolocation of accommodation establishments is a necessary analysis for any tourist destination.
If heterogeneity of the spatial intensity of the accommodation establishments is confirmed, it is necessary to locate the areas of the territory where the intensity is greater, since public and private tourism management policies must be oriented mainly towards those specific areas of the territory in which tourism specialization processes have been detected.
Sustainability processes, competitiveness strategies, and scale economies in the tourism sector have a clear spatial component. Not all tourist destinations or micro-destinations are equally sustainable, since the tourist pressure (which was measured by the intensity of accommodation establishments) is not the same in all of them. On the other hand, the high intensity of accommodation determines a competitive situation of close to perfect competition, in which market bidders cannot act on prices, which forces them to offer higher quality (more competitive) tourism products and services to stay in the tourist market. Finally, the business success of tourist accommodation in a space where there are no other tourist offerings (other accommodation, restaurants, tourist guides, complementary activities, enterprises, etc.) is much more difficult if the offer of accommodation (and other complementary services) is very high. Therefore, the high intensity of accommodation establishments favors the emergence of synergies and scale economies in the tourist destination.
7. Conclusions
Due to the major implications that the identification of groups with a high degree of tourist intensity represents for the satisfactory management of this activity, this study started with the objective of being able to contrast through statistical techniques an alternative to those traditionally used in the distribution of the tourist activities in the region of Extremadura.
The results obtained partly confirm those previously found by similar research. The identification of two high intensity areas in Quadrant A, the Valle del Jerte, the Valle del Ambroz, and La Vera, is a common conclusion reached by most previous studies, especially those focusing on identifying rural accommodation (
Sánchez Martín et al. 2013;
Sánchez-Rivero 2008). The same is true of the identification of the accommodation potential existing in Quadrant B, which has also been verified by the results obtained by previous research. However, it is striking that a common result among them, i.e., the identification of a high degree of concentration of the squares between the three main cities, is not confirmed by this study. This difference may be due to the difference in the average number of beds offered by different types of accommodation, hotels and others. For this reason, and in order to confirm the results achieved and to continue gaining knowledge of the spatial distribution of tourist activities, it would be interesting to be able to replicate this study taking as a reference the beds offered by each of the accommodation establishments in the region.
Regarding the implications of the results achieved, it should be noted that it would be important for destinations that are inserted in each of the quadrants identified with a strong intensity of tourist activity to carry out a detailed analysis of their carrying capacity. One of the priority objectives that the development of tourist activity in a destination must pursue is that it be carried out under sustainable criteria, especially taking into account that the identified areas are characterized by being natural resources, as is the case of the Ambroz Valley, Valle del Jerte and la Vera, or Monfragüe Natural Park. Therefore, before establishing the development strategy for these micro-destinations, managers should know whether or not the maximum load capacity of the destination has been reached, in order to establish lines of action in order to achieve sustainable management.
Similarly, once the areas in which tourist activity is most intense have been identified, it would be of great value to inquire about the determinants of its further development in order to achieve more balanced development in the region as a whole. Carrying out a benchmarking strategy in the identified micro-destinations can help, especially since it is an emerging destination, to know what has been the reason for their greatest success and to design growth strategies that can connect with the target audience allowing further development of the sector.
Finally, the findings achieved should also serve as a guide for destination managers in order to determine, based on the level of activity achieved, which are the priority areas for making investments in infrastructure, based on the objectives pursued by the competent administration.
On the other hand, the results obtained in this research are difficult to compare with those obtained by previous research regarding other destinations, since, as far as the authors are aware, an analysis of the existing pattern in a destination similar to that of the destination has not been performed. The selected destination is characterized, as already indicated, as being an inland destination that is in the growth phase of its tourist activity. However, there are characteristics that could be expected to be comparable, thus previous studies tend to identify island and coastal areas as locations of greater tourist intensity, as well as higher-hierarchy cities (
Majewska 2015;
Yang and Wong 2013;
Sarrión-Gavilán et al. 2015). Considering the characteristics of the destination, it would be expected that the main cities of the region, namely its capital (Mérida) and the provincial capitals, Badajoz and Cáceres, stood out for being among the locations with the highest tourist intensity. However, this characteristic is only presented in the city of Cáceres, therefore, it would be interesting to investigate why this is happening in the study to determine if the interior destinations do not meet this pattern, or if, on the contrary, it is a distinctive feature of the selected destination.
Different lines of research may be suggested aimed at alleviating some of the weaknesses and questions that arise as a result of the outputs of this study. Firstly, it would be interesting if the distribution pattern analysis could be carried out in destinations comparable to the one selected for this research, that is, emerging destinations in the interior, in order to verify whether the results achieved could be generalizable to this type of destination. Secondly, it would be valuable to be able to disaggregate the analysis by type of establishment since the different capacity and characteristics of each of the accommodation types could provide information that would substantially enrich the results achieved. Finally, it would be very helpful to be able to study the evolution of the identified pattern over time in order to obtain more information about how the distribution pattern of the activity behaves as the destination reaches its maturity phase.


