Article

Development of Military Spending Determinants in Baltic Countries—Empirical Analysis

1
Department of Resources Management, University of Defence in Brno, Kounicova 65, 66210 Brno, Czech Republic
2
Department of Quantitative Methods, University of Defence in Brno, Kounicova 65, 66210 Brno, Czech Republic
3
Department of Political and Strategic Studies, Baltic Defence College, 12 Riia St., 51010 Tartu, Estonia
*
Authors to whom correspondence should be addressed.
Economies 2020, 8(3), 68; https://doi.org/10.3390/economies8030068
Submission received: 22 June 2020 / Revised: 3 August 2020 / Accepted: 14 August 2020 / Published: 20 August 2020

Abstract

:
The article presents the use of the ARDL model to identify military expenditure determinants of the Baltic States (Lithuania, Latvia, and Estonia). Factors influencing military expenditure include the variables characterizing the economic environment of the analyzed countries (GDP per Capita, Government Deficit/Surplus, General Government Gross Debt, Inflation), and the security environment measured by Risk of Foreign Pressures, Risk of Cross-border Conflict, and Democratic Accountability. General conclusions about the analysis of relationships between the military expenditure level and selected economics and security determinants were confirmed in the cases of Government Deficit/Surplus, GDP per Capita and Inflation. The results, therefore, indicate that the military expenditure of Estonia and Lithuania depended on the state budget deficit where military expenditure tended to go down in relation to an increasing deficit within the assessed period. As far as Estonia is concerned, the findings about relationship between the economic position and military expenditure was validated as an increasing economic performance tended to increase military expenditure.

1. Introduction

The 2018 Brussels NATO Summit Declaration confirmed the requirement to increase the amount the NATO member states spend on defense determined as early as 2014 and have national plans in place to spend 2% of their Gross Domestic Product on defense by 2024. However, the recent development in military expenditure of the NATO member states clearly shows that only eight NATO member states were able to meet this requirement in the year when the NATO summit was held in Brussels and out of the new NATO member states only Latvia, Lithuania, Estonia and Poland met this requirement. The development of military expenditure of the Baltic States between the Wales Summit in 2004 and the Brussels Summit in 2018 is characterized by a big year-on-year increase representing the highest military expenditure growth rate of NATO. Military expenditure of Lithuania and Latvia increased by more than 150%; of Estonia by more than 30%. The purpose of the article is to identify factors influencing the development of military expenditure in the Baltic States within the period from 2001 to 2018 on the basis of a model estimating the demand for military expenditure in these states. To analyze military expenditure determinants data characterizing the economic environment and data describing the development of the security environment of Latvia, Lithuania and Estonia have been used. This approach can often be found in current literature and journals dealing with security issues in terms of modeling military expenditure (Sezgin and Yildirim 2002; Spangler 2018; Bove and Brauner 2016).

2. Literature Overview

The theoretical definition of military expenditure determinants of the analyzed Baltic States analyzed through the ARDL (Autoregressive Distributed Lag) model derives from articles by (Sezgin and Yildirim 2002; Spangler 2018; Solarin 2018; Bove and Brauner 2016; Abu-Qarn et al. 2010; Collier and Hoeffler 2002) determining socio-economic variables characterizing the economic environment of a country and safety variables characterizing selected security risks as factors influencing the amount of military expenditure.
Sezgin and Yildirim (2002) focused on the demand for defense expenditures in Turkey from 1951 to 1998. Their single country case study was based on the autoregressive distributed lag model to cointegration (ARDL). They used several variables such as the growth rate of GDP, defense spending of NATO, the trade balance representing the openness of the economy, the military expenditure of Greece, non-defense government spending, population and the Cyprus conflict from 1974 as dummy variable. Their findings showed that levels of military expenditures of NATO are having a positive and significant effect both in short and long term. Greece’s military expenditure is having a significant positive impact on military expenditures only in a short-run. The Turkish defense spending also depends on its data from previous year. The growth rate of Turkish GDP is having a significant sign with a negative impact contrary to expectations. Some variables such as the change of non-defense government expenditure, population and Cyprus dummy variables are insignificant in this model. The estimates also showed that the increasing GDP is negatively significant for the Turkish defense expenditures. Generally, we can conclude that used economic variables (economic growth, openness of economy) played an important role in the Turkey’s military expenditure development.
Spangler (2018) estimated the potential effects of US military expenditures on European demand for defense spending. He investigated 28 countries in the fixed static and dynamic panel data analysis for the time period 2000–2014. In this study were used the statistic fixed effects model and the dynamic model to test impact of total or regional US military expenditures on European demand for defense spending, number of US military personnel or US bases in the country or overseas. In both models the results indicate that US total military expenditures do have a negative impact on European demand for military expenditures. The effects of regional US military expenditures, US bases in the country and number of US military personnel are insignificant. Spangler (2018) used the following variables: government revenue, GDP, government expenditures, exports and imports.
Solarin (2018) investigated the impact of globalization on military expenditure in a panel of 82 countries from 1989 to 2012 using a generalized method of moments. His model includes variables such as military burdens, military expenditures, trade openness, urbanization, GDP, population, security web, dependency ratio for citizens younger than 15 years and older than 64, NATO or non-NATO members. He found that military spending is positively influenced by real GDP, lag of military burden, average regional military spending and NATO membership. The change in trade openness (globalization) was negatively related to military expenditures. Furthermore, population and polity are negatively related to military burdens.
Bove and Brauner (2016) solve the impact of the various dictator’s regime type on the military spending. They used the panel data of autocratic political regimes for the time period from 1960 to 2000. Their model is based on three categories of autocratic regime type—military regimes, single-party states and personalist regimes. This distribution of dictatorships allowed a better description on how different autocratic regime types are allocating military spending. They supposed that in the military regimes would be higher level of military expenditures compared to the personalist regimes. The results of empirical findings of 64 dictatorships proved this assumption.
Abu-Qarn et al. (2010) in the example of Egypt’s military expenditure in 1960–2009, describe the link between military spending and its level in the previous period, the economic power of the country measured by GDP, the size of the military expenditures of neighboring countries (Israel, Jordan and Syria), size of population, the quality of democracy, and the degree of economic openness of the country measured by the share of net exports in the country’s GDP. The result of the econometric model reveals, in particular, the positive dependence of military expenditures on their size in the past, the negative effect of the size of GDP and net exports. At the same time, the model did not demonstrate the influence of Jordanian and Syrian military spending on Egyptian military spending, but has shown a positive link between Israel’s and Egypt’s military expenditure as a significant indicator affecting Egyptian military spending.
Collier and Hoeffler (2002) among the determinant military spending rank low gross domestic product growth rates, dependence on international trade with basic commodities, the participation of armies in conflicts, military spending of neighboring countries, population size, threat of civil war. Their findings indicate that the risk of civil war as a determinant of military expenditure is higher in countries with serious ethnic problems.
The analysis of literary sources indicates that (Sezgin and Yildirim 2002; Spangler 2018; Solarin 2018; Bove and Brauner 2016) rate variables characterizing economic development of countries measured by Gross Domestic Product and product growth rate among variables characterizing economic determinants of military expenditure. The above authors consider military expenditure indicators, membership in military alliances indicator, participation in military conflict, and civil war among variables characterizing the security environment of a country. The authors rate, e.g., the form of government (see Table 1) among other analyzed variables. Similar classification of variables can be seen in (Bel and Elias-Moreno 2009; Dunne and Perlo-Freeman 2003; Dunne and Nikolaidou 2001; Odehnal and Neubauer 2020).
In general, military expenditure decrease can be expected when economies experience economic downturn accompanied by relatively low security risks, which corresponded to the situation in the majority of European NATO member states during and immediately after the economic crisis (Holcner and Olejníček 2017; Odehnal and Neubauer 2015; Holcner 2019; Tao et al. 2020).

3. Data Description

The article analyzes selected economic and security variables as military expenditure determinants of the Baltic States by the quantified economic determinants GDP per Capita, Government Deficit/Surplus, General Government Gross Debt, Inflation and through quantified security risks describing Cross-border Conflict, Foreign Pressures, and Democratic Accountability.
To analyze military expenditure determinants of the selected Baltic States, data characterizing selected economic and security risks from the Eurostat (European Commision Eurostat 2020) and the PRS Group database (PRS Group 2020) were examined. Table 2 shows the description of variables and manner of their quantification; the PRS reference shows more detailed methods and the description of variables. Data illustrating military expenditure development (share of GDP) was derived from the SIPRI database reference (SIPRI 2020).
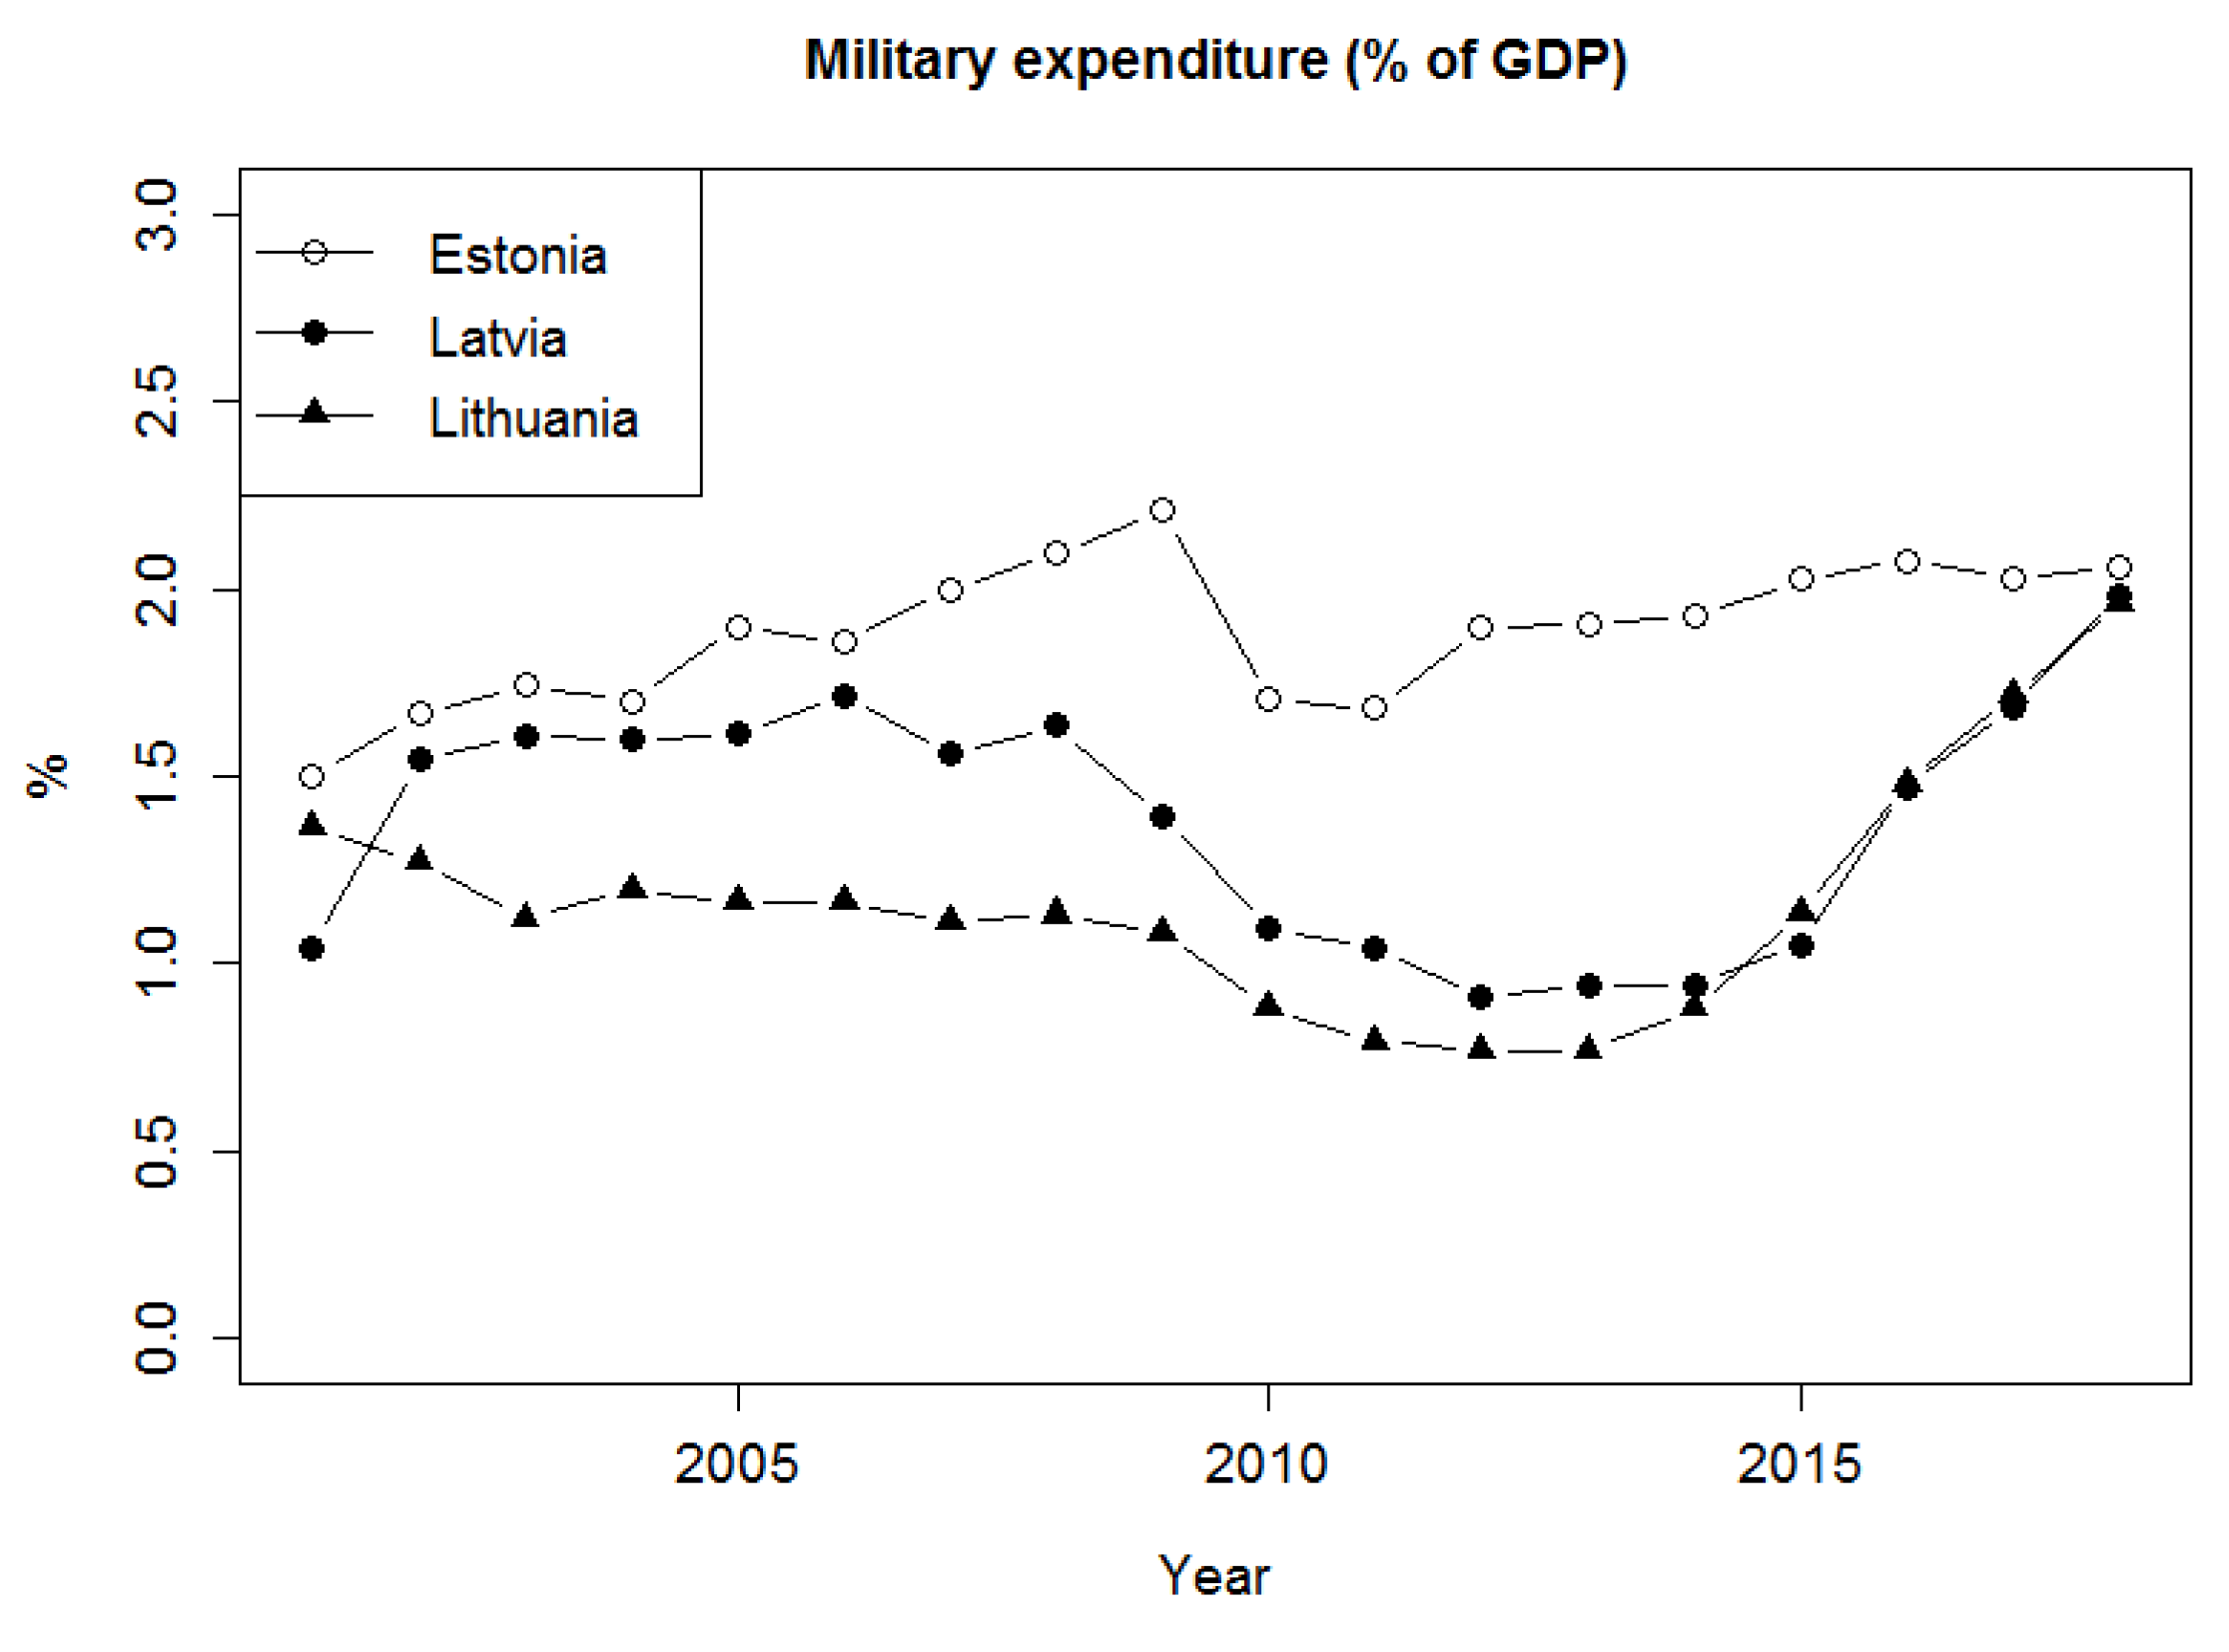
Figure 1 illustrates the development of military expenditure of Latvia, Lithuania and Estonia during the analyzed period 2001 through 2018; Figure 2, Figure 3, Figure 4, Figure 5, Figure 6 and Figure 7 illustrate the development of quantified determinants of military expenditure.
Greatest influence on defense budgets (see Figure 1) of Baltic countries from 2009 to 2014 was undoubtedly caused by the economic crisis. Its effect however influenced each nation differently (for more detailed economic analysis of Baltic countries see, e.g., (Valentinait and Snieska 2005; Stundziene et al. 2017).
In case of Estonia slight reduction of defense spending in that period affected mainly Navy which lost sizable portion of capabilities (Friedrich and Reiljan 2015). In case of personnel there were reductions on the higher positions while political elites were still committed to reaching and gradually exceeding 2% GDP spending on defense through the Political parties’ agreement in 2015. After the Russian aggression on Ukraine and in order to better organizationally accommodate increase in defense spending the Centre for Defence Investments has been established in 2015 and became operational in 2017. Thus, in the end of the researched period procurement of defense-related equipment, infrastructure costs and investment costs account for more than a third of Estonia’s defense budget. There are however significant delays in procurement processes due to legal proceedings and lack of personnel. Still several important projects are ongoing in 2018/2019 period. Most importantly joint procurement (with Finland) of 12 South-Korean K9 howitzers destined to enter service in 2021 (Cavegn 2017) or modernization of three Sandown class minehunters for EUR 30 million announced in 2018. Special case was the 2018 donation of two PZL M28 Skytruck transport aircraft from the USA, which nevertheless were donated on condition that Estonia covers the costs needed to ensure they conform to European flight safety regulations as well as transport costs (Vahtla 2017).
In case of Latvia, the economic crisis was influencing defense sector heavily until 2014. Cuts were necessary in command structure (up to 40% position were eliminated) and salaries reduced by 20% but the ongoing focus was on keeping the personnel. Procurement projects were postponed and instead there was increased effort in planning phase. Long-Term Development Plan of the Armed Forces of Latvia 2012–2024 was adopted in June 2012 precisely at the moment when defense budget cuts reached their peak. After the gradual increase of spending (2014 onwards) one of the most visible results was acquisition of 47 pieces of M109 self-propelled howitzers from Austria announced in 2017, ongoing procurement of 4 UH-60 helicopters for $200 million (Metha 2018) or development of infrastructure on Ādaži military base. For that matter, the most important decision that the Latvian government has made after the Russian aggression on Ukraine was to increase defense spending up to 2% of GDP in 2018 with roughly 60-million-euro increase annually. However in Latvian case, the stress on so called Comprehensive Defence means, that the whole society and other state institutions have tasks in defending the country, which also means, that significant parts of the budget of other ministries are in fact also spent on defense (MoD of Latvia 2018) while not counted within the target of 2% GDP and MoD budget. Contrary to that, there is currently no political discussion about re-instating conscription in foreseeable future.
Much like the other Baltic countries, Armed forces in Lithuania suffered heavily during the economic crisis. This was reflected in lacking personnel, when recruitment has been stopped and some battalions in consequence were manned only up to 14% in 2014 (Saldziunas 2016). Lack of money also meant, that ammunition, spare parts stock, etc., were not resupplied. The only sphere not hit by cuts were operations. As with the case of Latvia and Estonia, 2014 Russian aggression against Ukraine (and improved economic situation compared to 2008 War in Georgia) brought increasing military budget.
On 17 January 2017 Lithuanian Parliament adopted the new National Security Strategy and committed to allocate 2% of GDP in 2018 (Judson 2019) and to steadily increase defense expenditures further on. On 10 September 2018 the majority of Lithuanian parliamentary parties signed an Agreement on the guidelines for Lithuanian defense policy and committed to allocate at least 2.5% of GDP in 2030 to defense expenditures (Judson 2019). This increase enabled to acquire Boxer infantry fighting vehicles, PzH2000 self-propelled howitzers, and Norwegian Advanced Surface to Air Missile Systems by 2021. In real terms, more than EUR 2.5 billion were allocated to the country’s military modernization program in the years 2017 to 2022. Notably Lithuania also reintroduced conscription in 2015 which allowed the Armed forces to grow from 12,450 soldiers in 2014 to 20,073 in 2019 and this increase allowed to create second Brigade “Žemaitija” in 2017.
While Lithuania, Latvia and Estonia may seem to function as unified regional Baltic group (so called 3B) from the outside perspective, they in fact differ significantly from each other. Not only in terms of language, religion or the size of (Russian) minorities, but into some extent also in terms of their approach to defense policy.
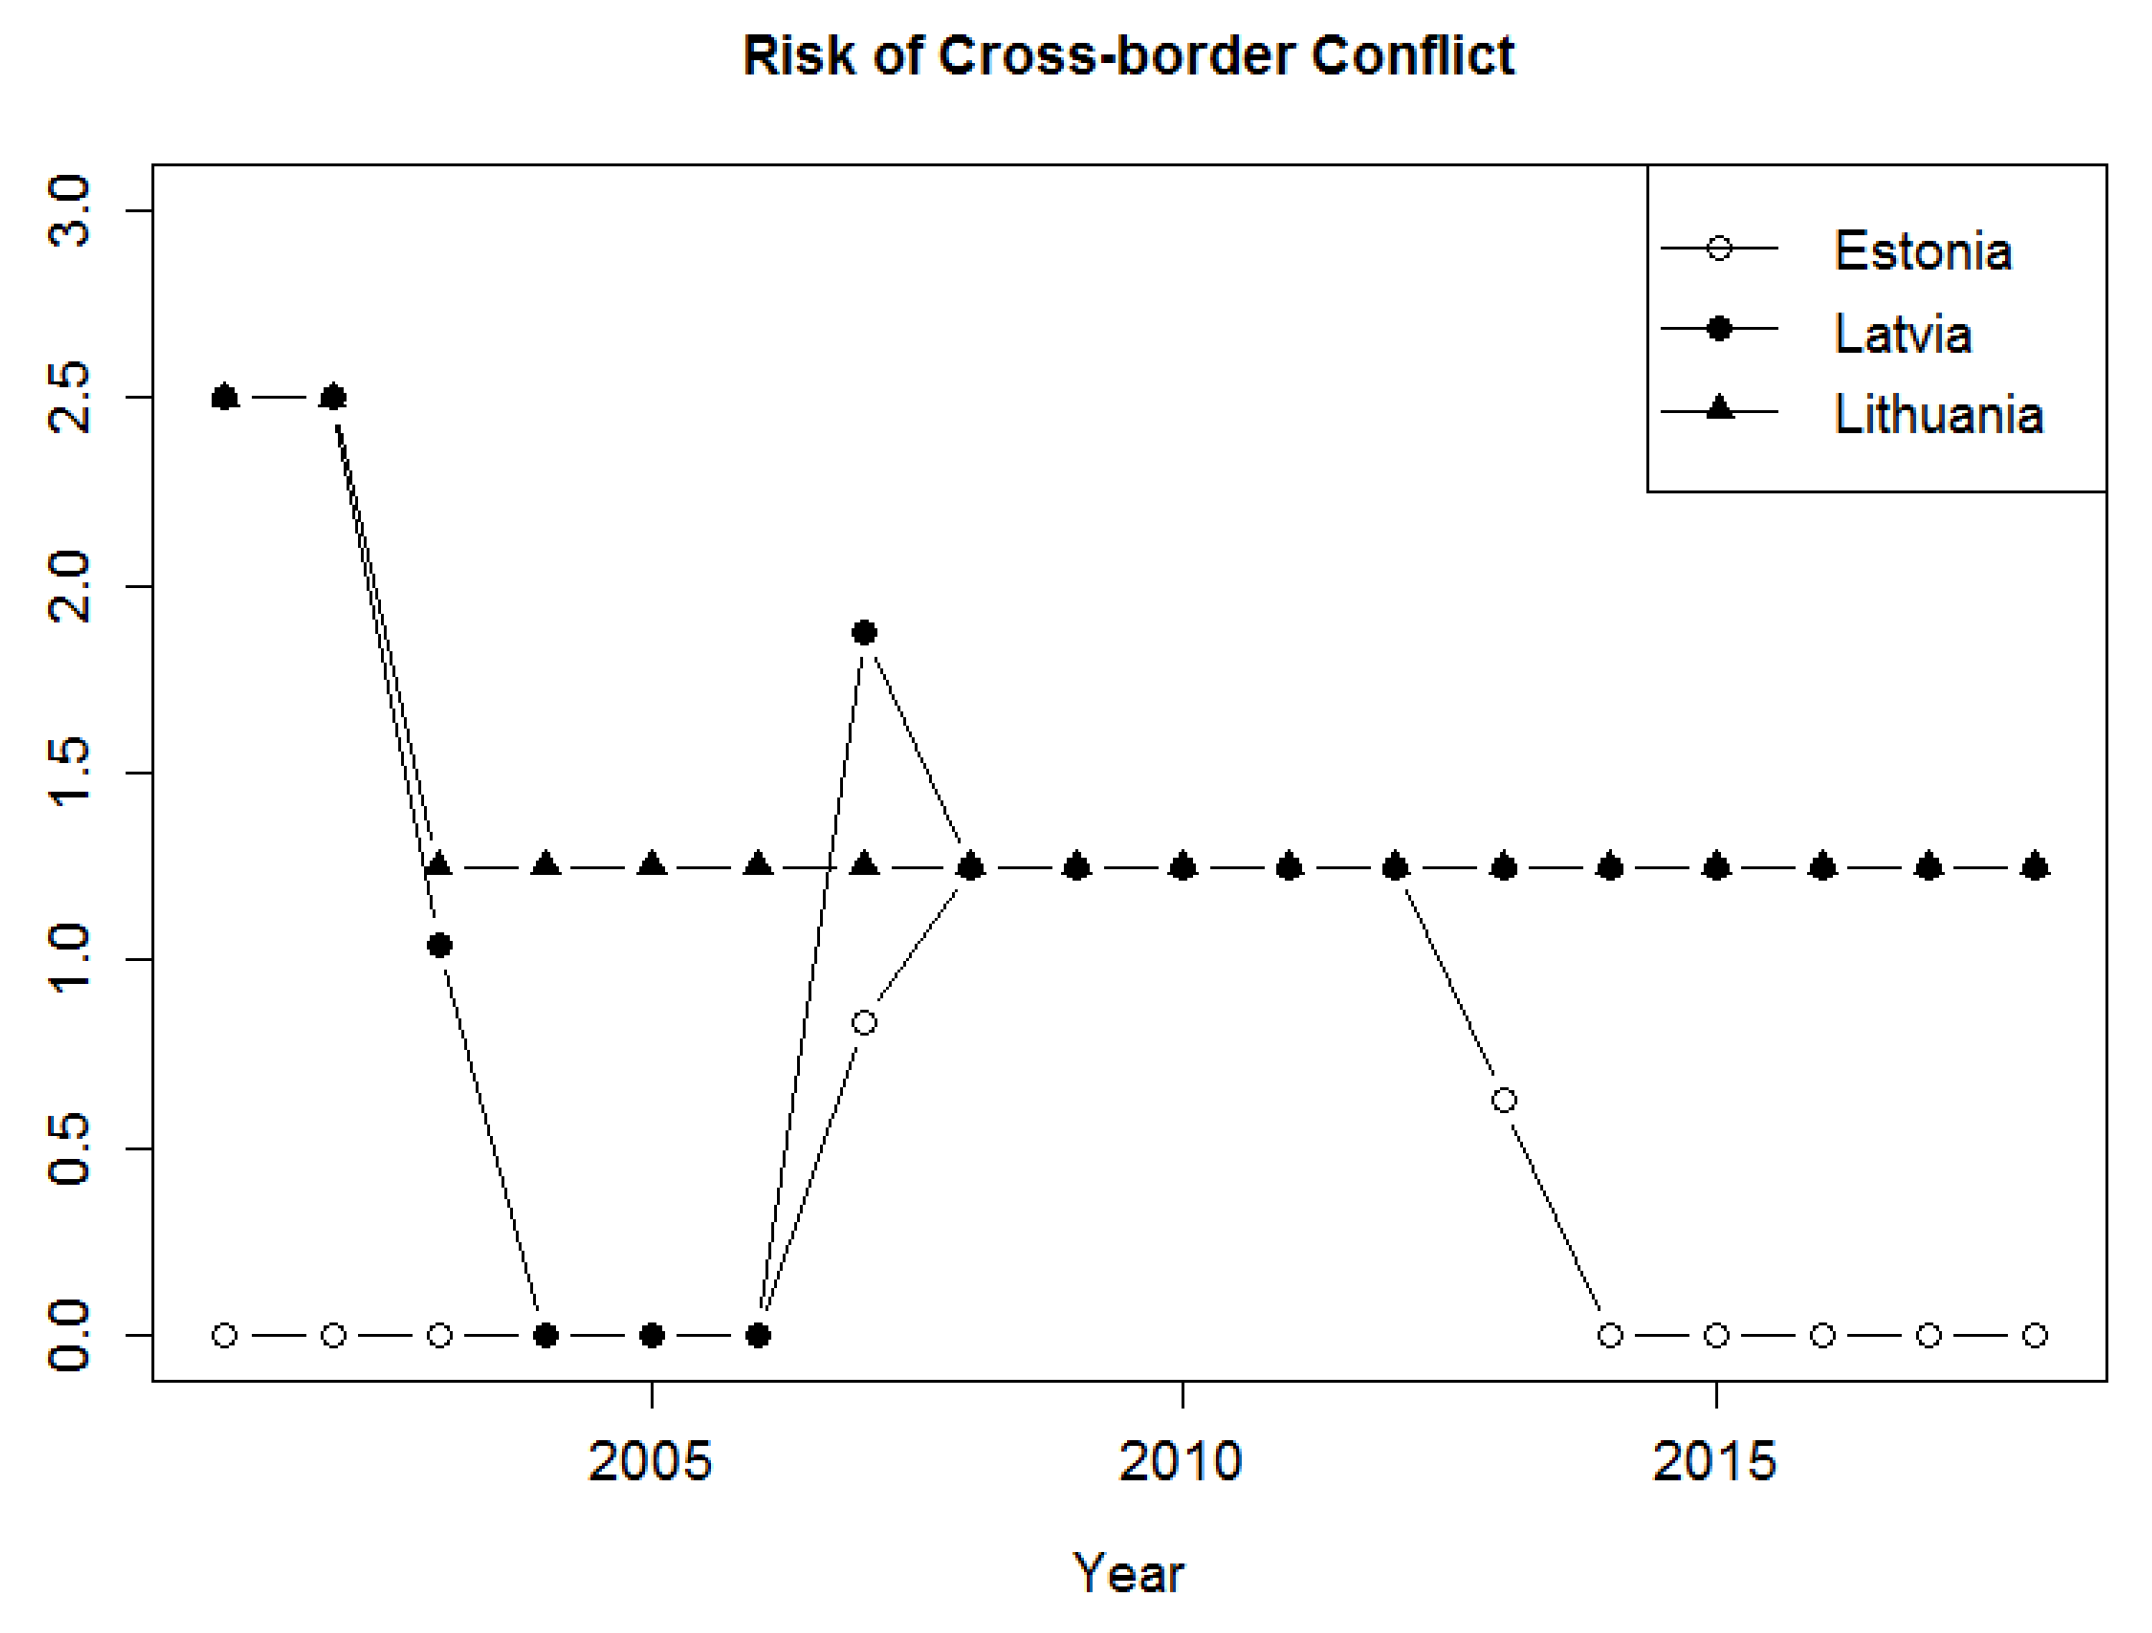
All three countries, however, share common threat perception. Unlike in many NATO countries, due to historical reasons (particularly Soviet occupation) Russia has been perceived as a major threat for Baltic countries since their re-independence in 1991. Thus, access to NATO in 2004 was seen as an important stabilization step for 3B and consequently decreased risk of cross-border conflict (see Figure 2).
For the modern period however, the 2005 quote of Russian President Vladimir Putin in his annual state of the nation address to parliament in which he for the first time called the collapse of the Soviet Union “the greatest geopolitical catastrophe of the century” (NCB News 2005) is often mentioned as a revelation of the Russian threat—this is markedly felt in the region from 2006 onwards. This was followed by 2008 war in Georgia, in which Russian intervention to support pro-Russian elements was perceived as direct threat for Latvia and Estonia—both with sizeable Russian minority encompassing roughly 1/4 of the population. It did not have the same effect in Lithuania with much less numerous Russian minority (around 6%).
Much greater effect in terms of risk of Cross-border conflict may be expected after 2014 and Russian actions against Ukraine. However here again 3B and the rest of NATO perception may differ slightly. Since Baltic countries have always perceived Russia as a threat and enemy, the Ukrainian experiences from 2014 did not come as such a great surprise as elsewhere in Europe. In Estonia particularly it has not even been deemed necessary to amend the 2011 edition of National Defence Strategy (Estonian MoD 2011), because it was identifying Russia as an enemy and thus was considered still valid and requiring no update well into 2018/2019. Furthermore, while 3B are by no means forgetting threat of Russia in their defense planning, it was not overlooked, that Russian operations in Ukraine occupy sufficient Russian forces (Petersen and Myers 2018) to enable NATO to shift its center of gravity further south to Suwalki gap on the borders between Lithuania and Poland. In such situation any kind of foreseen Russian thrust would go through Latvia and Lithuania and thus decreasing threat of cross-border conflict for Estonia as has been convincingly demonstrated during Russian exercise Zapad 2017 (Lasconjarias and Dycka 2017).
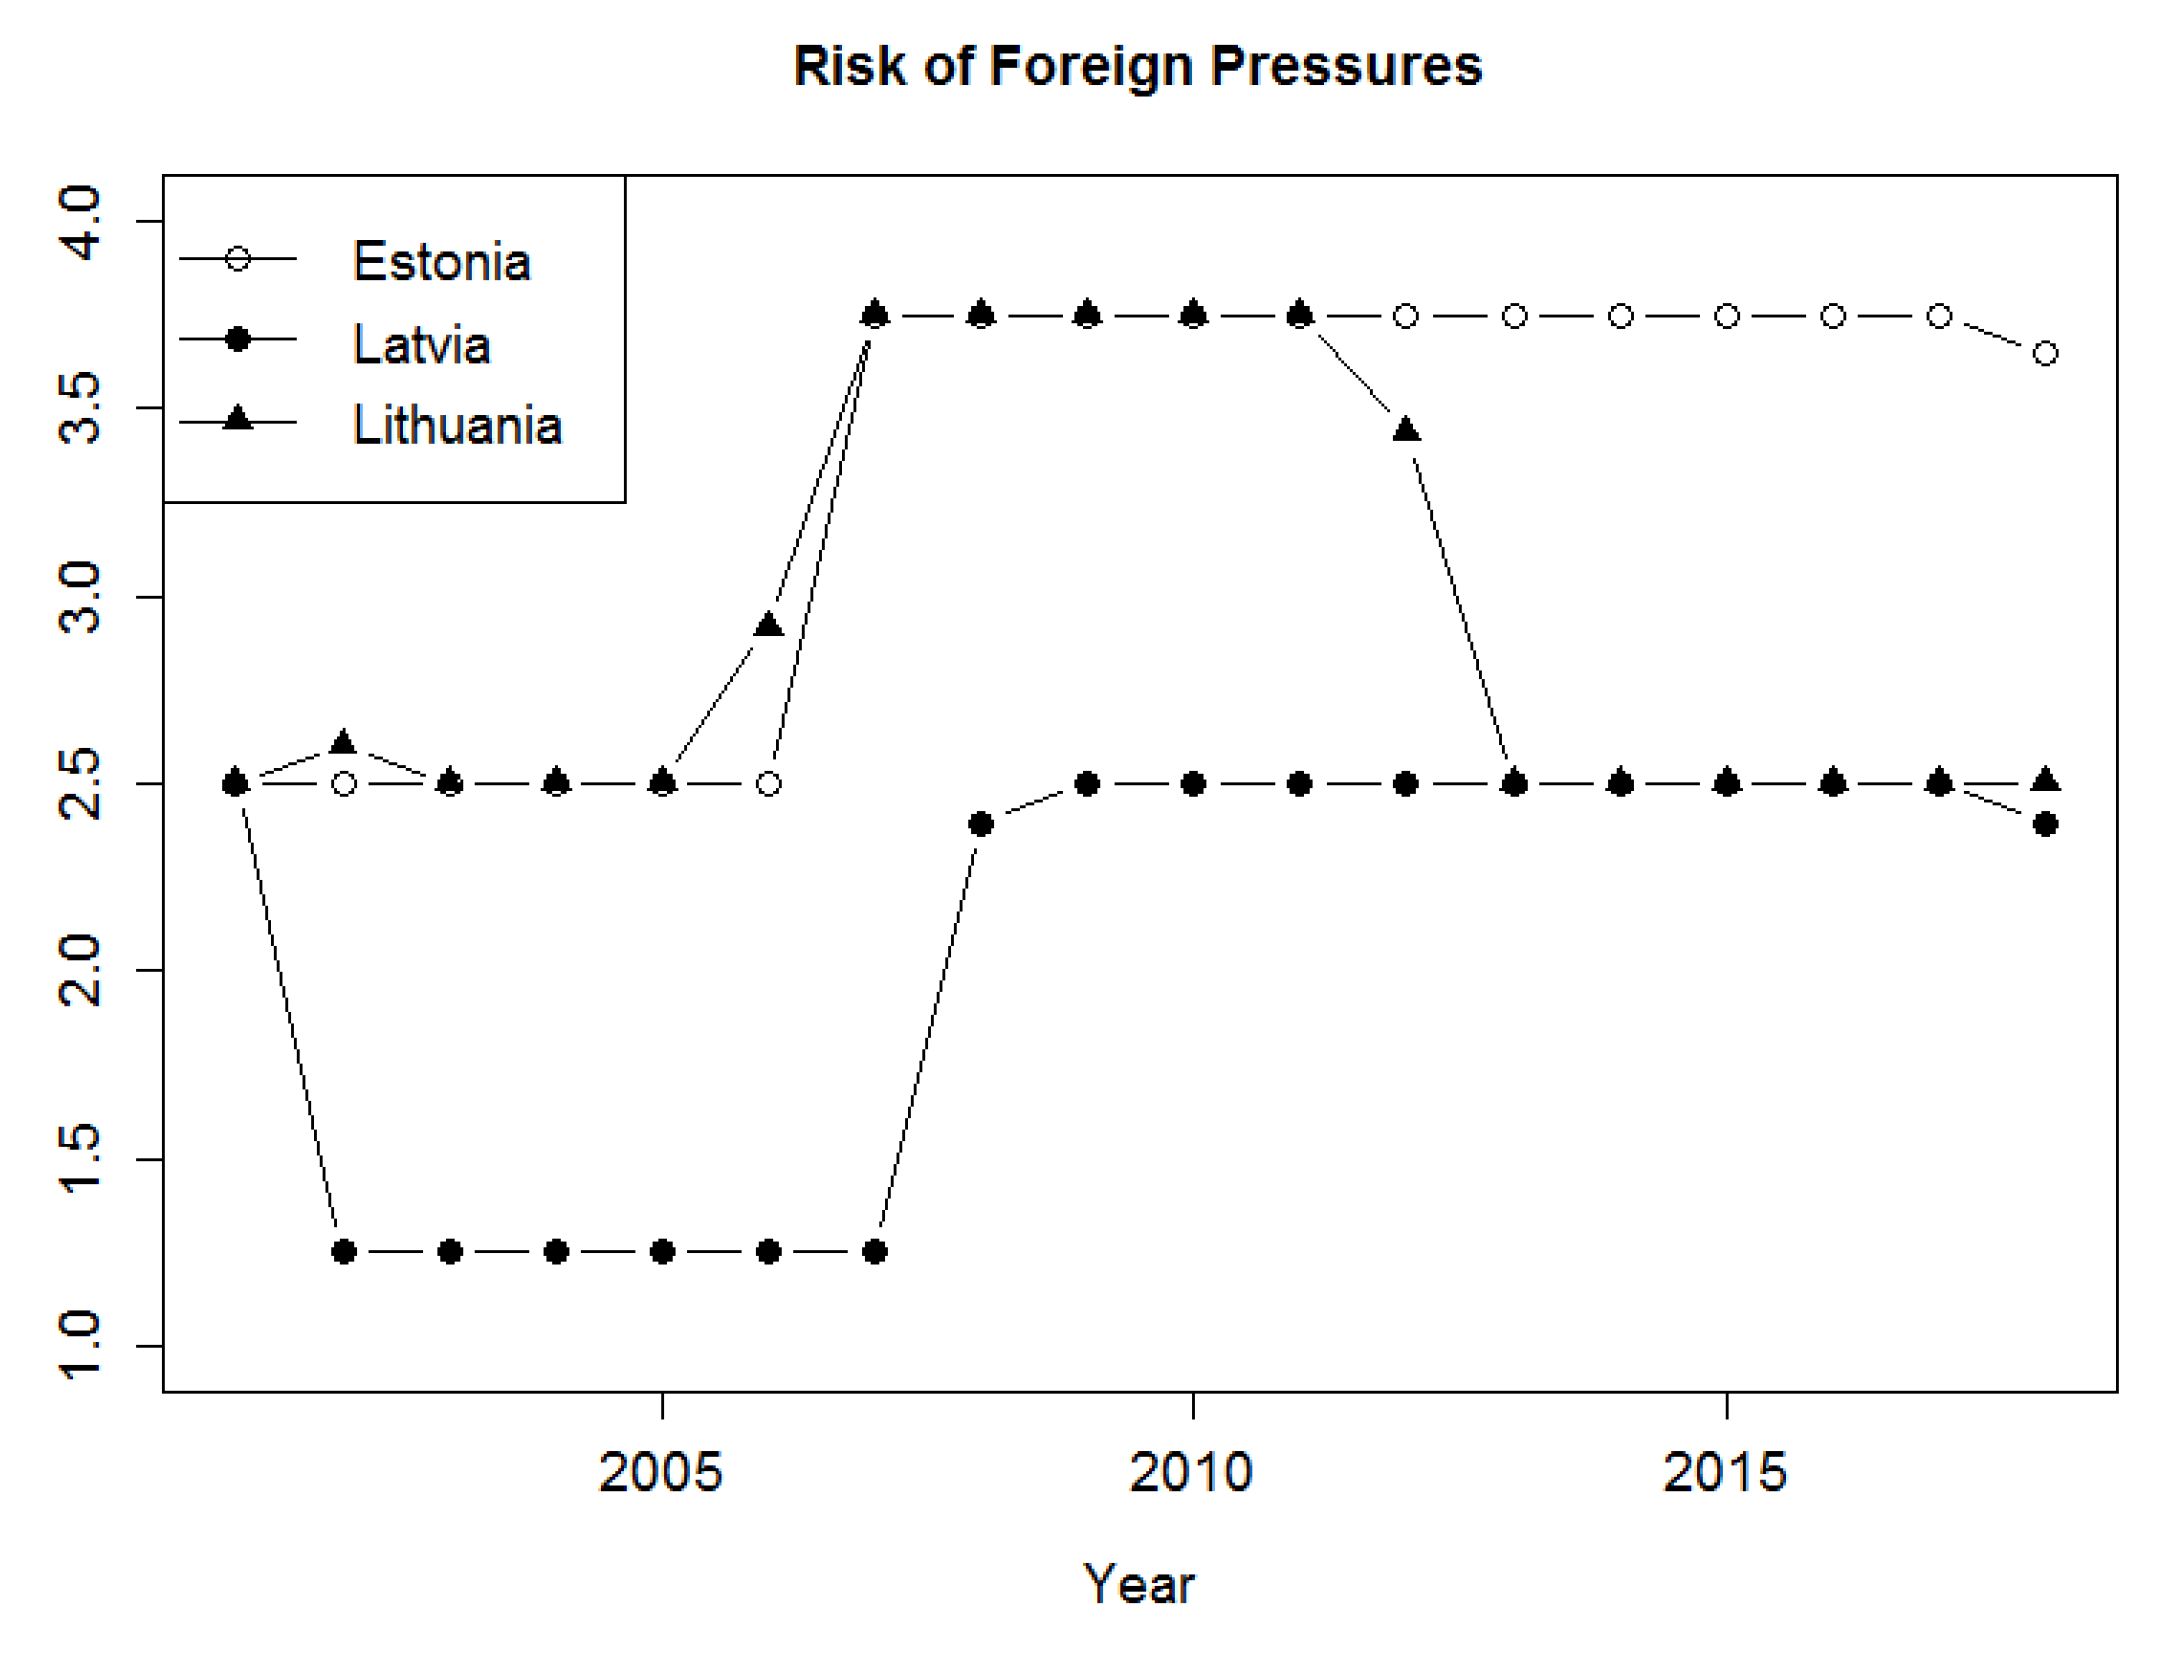
In terms of Risk of Foreign Pressures (see Figure 3), the Baltic position is heavily dictated by its regional location, being squeezed between Russia, Belorussia and Kaliningrad with very short corridor to Poland—so called the Suwalki gap and Russian minorities in Latvia and Estonia. Already in 2007 removal of statue of Red Army soldier from Tallinn sparked huge protests from Russian minority in Estonia and directly led to cyber-attacks originating from Russia resulting in webpages and online services of government, banks and media being taken down (McGuinness 2017). It however served as a wake-up call in non-kinetic domain for 3B—combined with similar actions against Georgia year later, which have been carefully studied in the region.
For Latvia and Lithuania however similar destabilizing campaigns targeting local population may also serve Russian General Staff’s planning for connecting Kaliningrad with mainland Russia, providing operational advantage in case of armed conflict and thus keeping the Risk of Foreign Pressures alarmingly high. This is also enhanced by obvious “significant disparity between Baltic countries and Russian armed forces. Estonian military forces include roughly 6600 active duty personnel and 15,800 Defence League personnel; Latvian active duty personnel number 5310 and 7850 reserves; and Lithuanian active duty strength is 18,350 and its reserve strength is 6700. Russia’s Army alone includes 280,000 active duty personnel with many operationally based at St. Petersburg’s Western Military Headquarters. Russian forces adjacent to the Baltic nations are estimated to contain 22 battalions” (Petersen and Myers 2018). This unbalance of forces has been on the other hand at least partially mitigated by creation of Very High Readiness Joint Task Force (VJTF) within NATO’s Response Force (NRF) following the 2014 Wales Summit to better respond to the changing security environment on NATO’s eastern and southern borders. An even more important step in was deployment of multinational NATO Enhanced Forward Presence (EFP) battlegroups. Founded in 2016 and first deployed in 2017, they serve to reassure Baltic states and help deterring Russia (Veebel 2019).
A supplementary factor significantly decreasing Risk of Foreign Pressures in Lithuania from 2013/2014 period was opening the Klaipėda liquefied natural gas terminal, which was finished in 2013 and after series of tests started operating on 3 December 2014 and thus decreasing Lithuanian energy insecurity. Only a slight decrease in Risk of Foreign Pressures since 2018 in Latvia may be tied to parliamentary elections held on 6 October 2018. Resulting new government is so far seen as less dependent on Russian oligarchs and (potentially) Russian funding (Bergmane 2017).
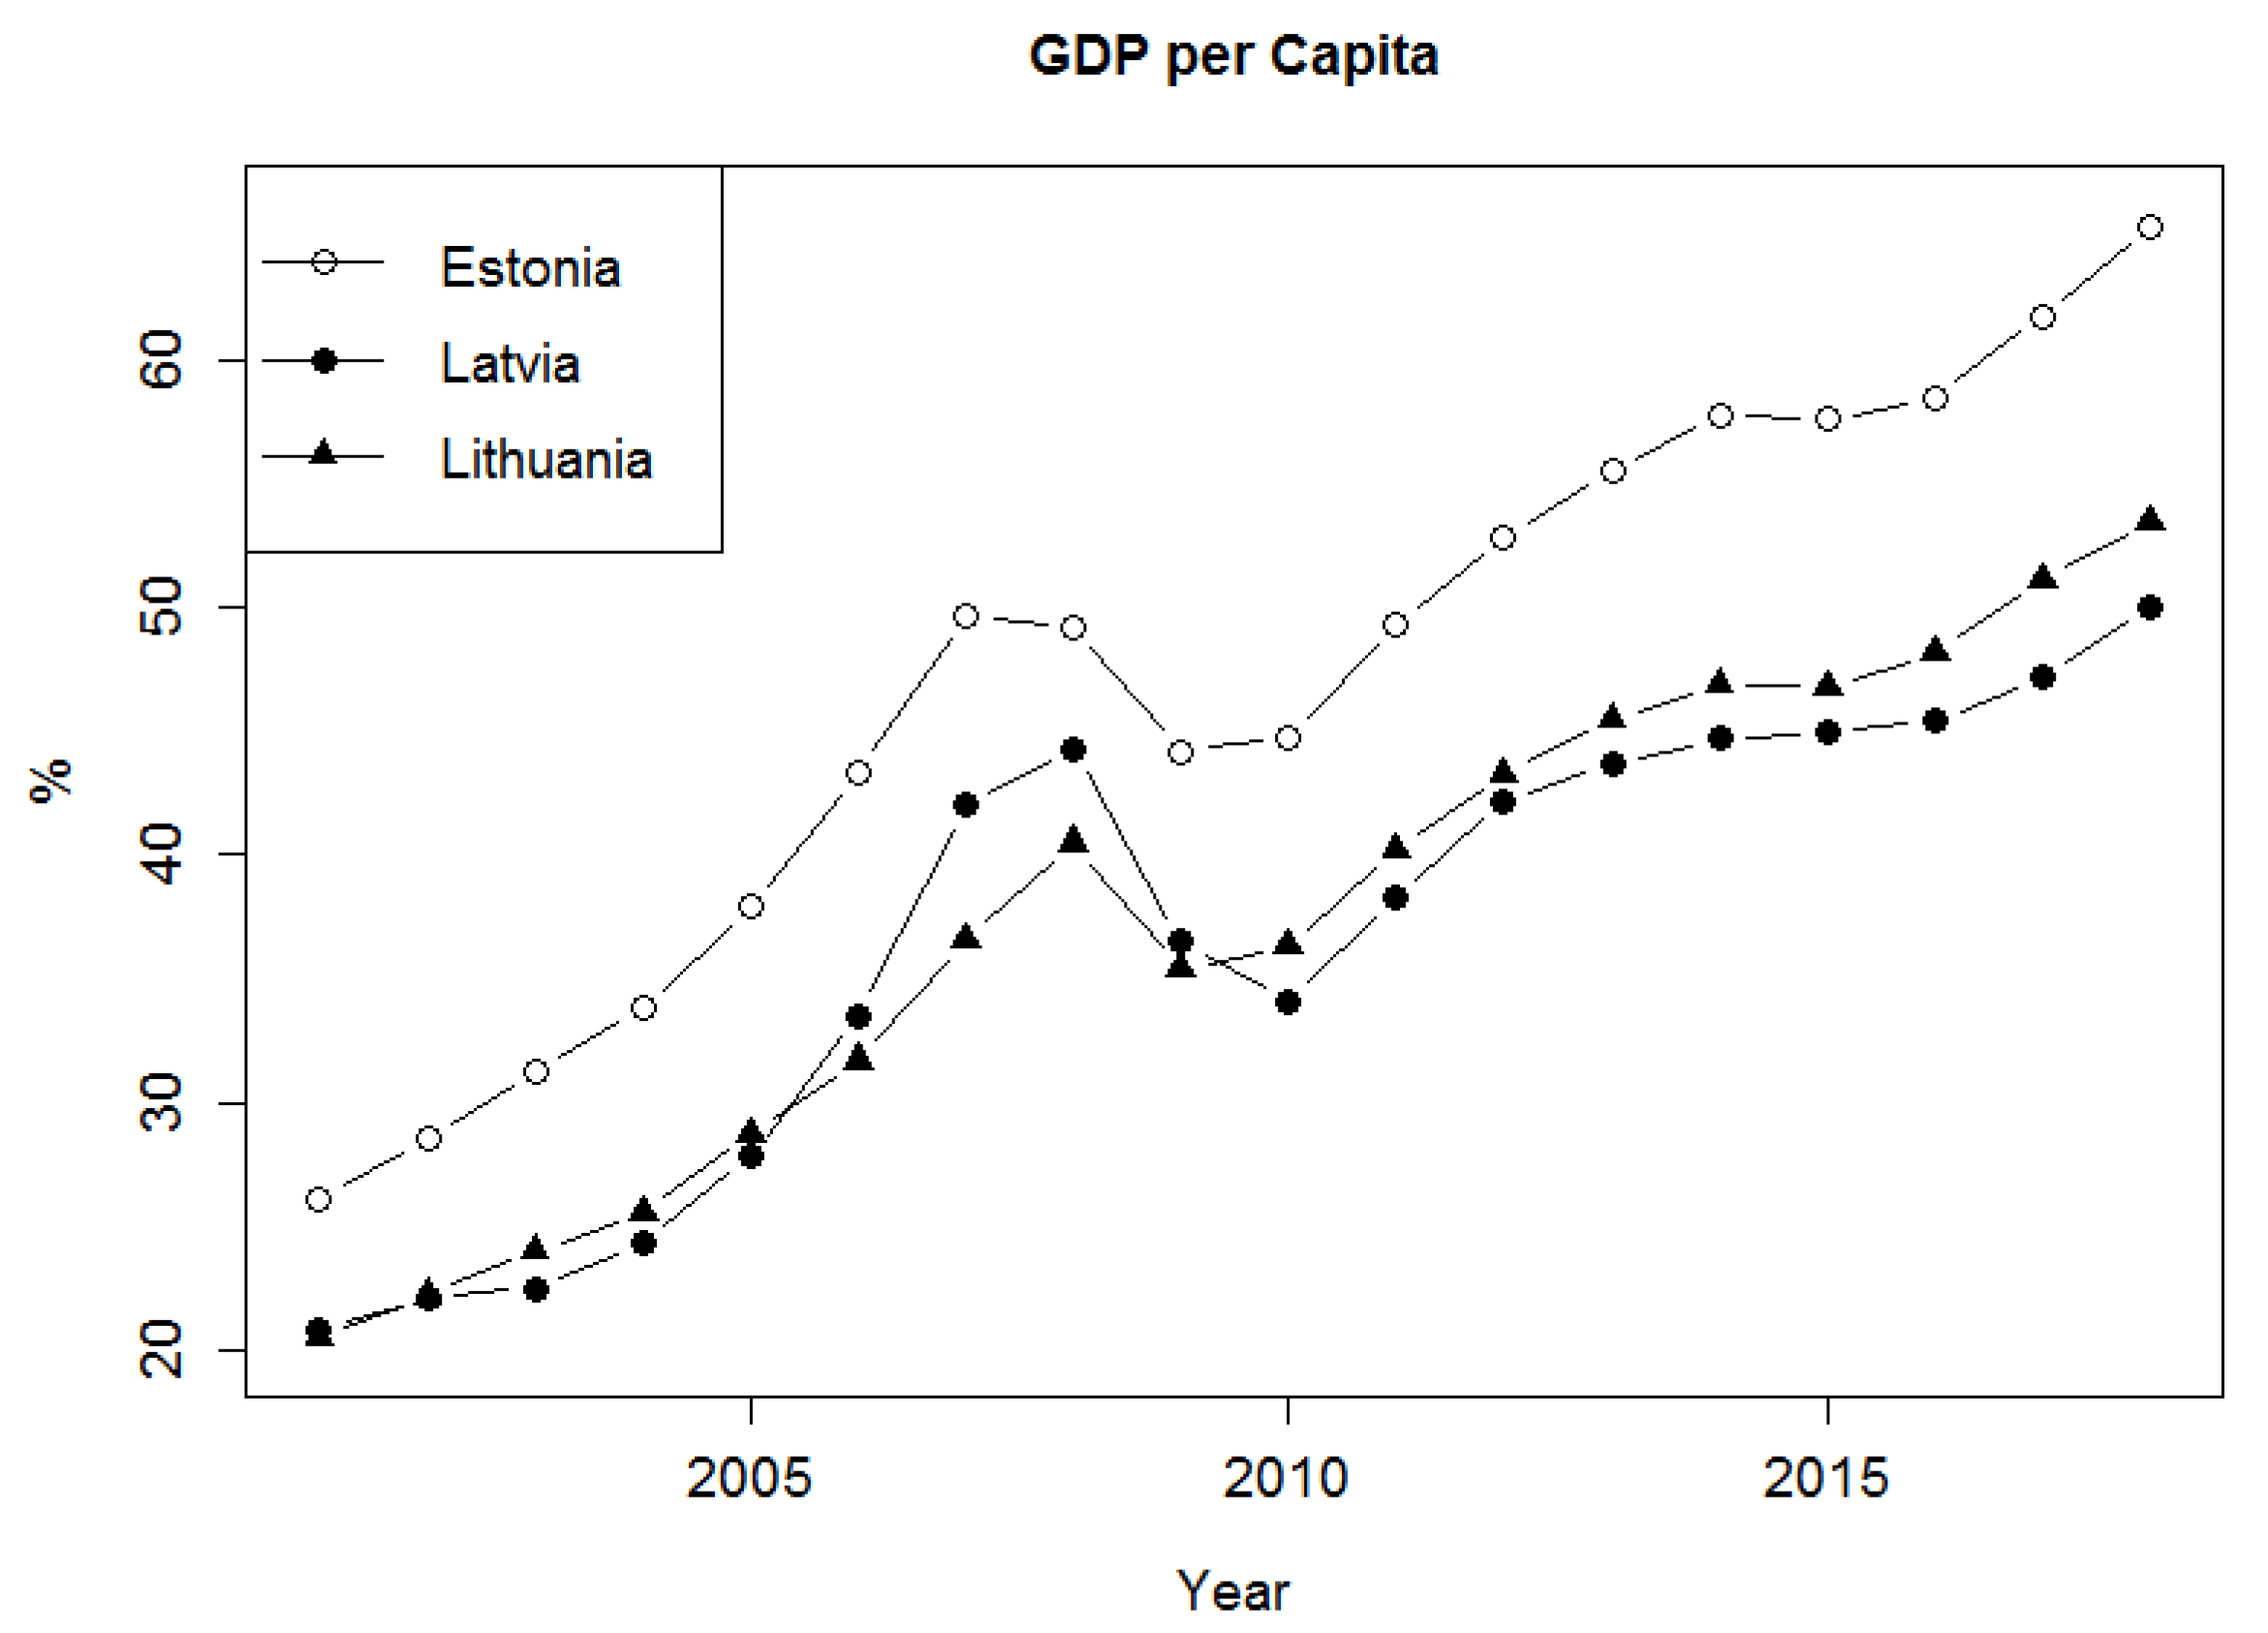
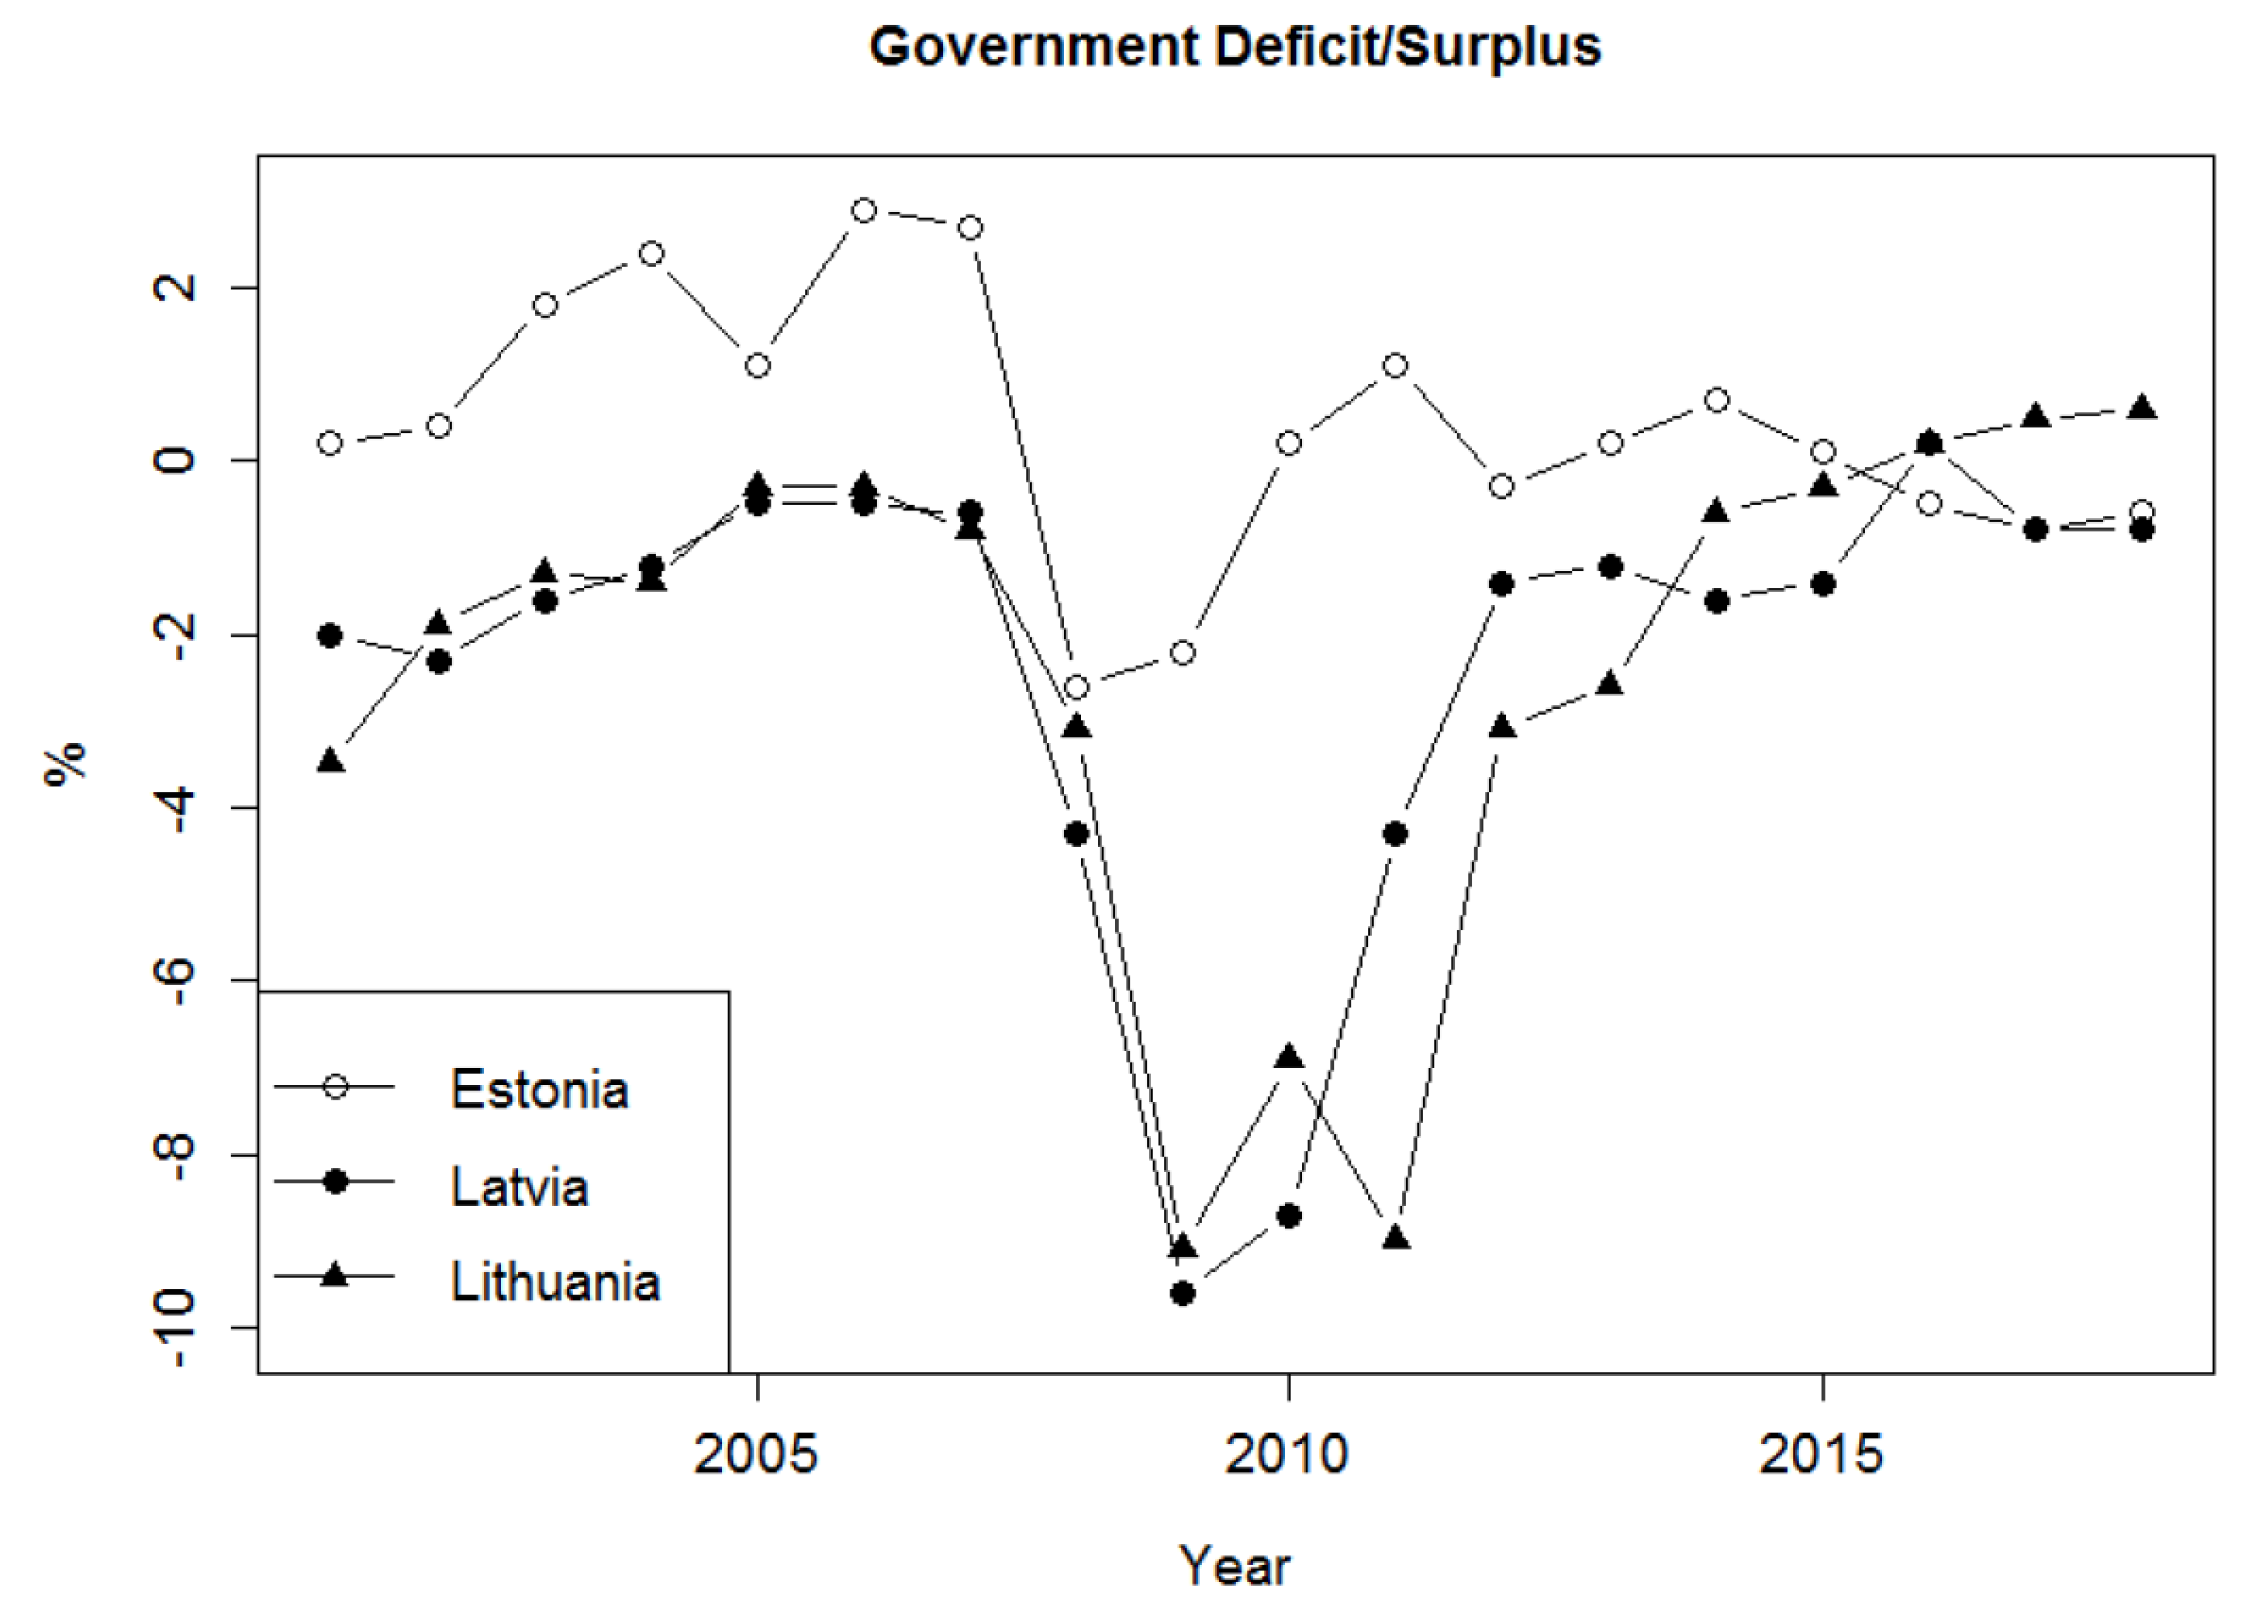
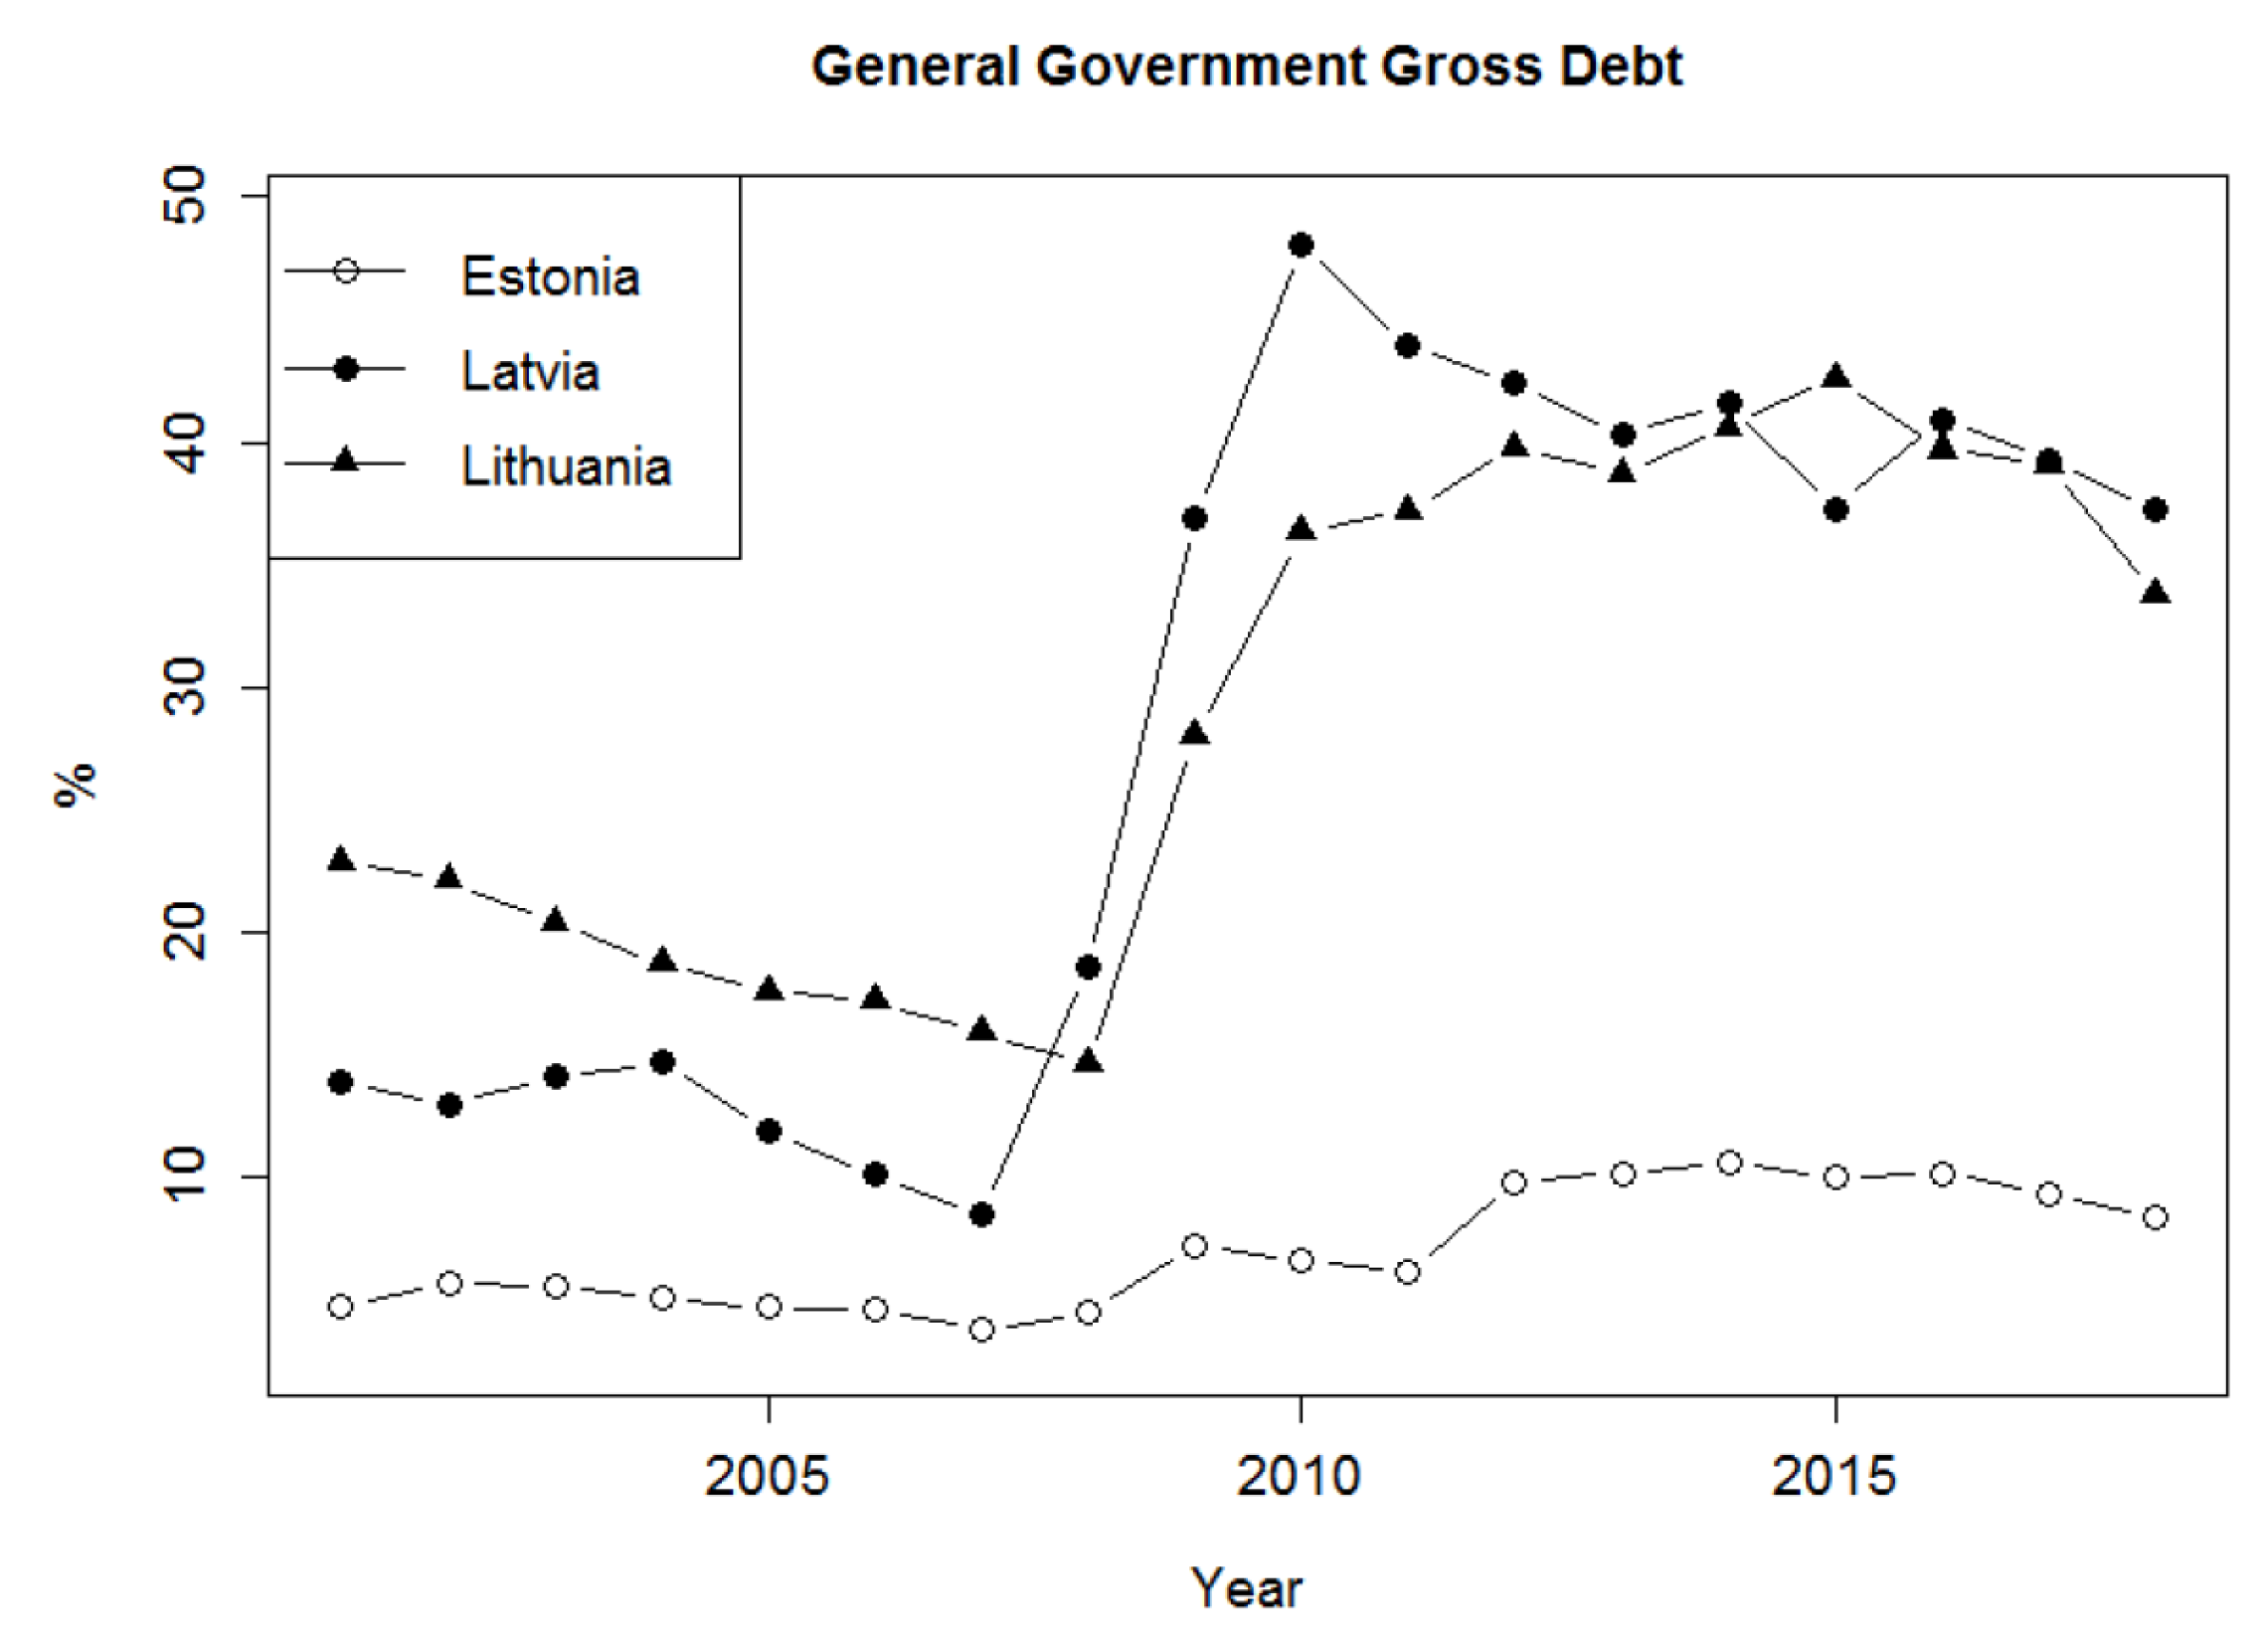
Figure 4 clearly clearly shows that the economic performance characterized by the GDP per Capita indicator was low in all three analyzed countries at the beginning of the analyzed period (2001) and during the economic crisis in 2009 (Lithuania, Estonia), 2010 (Latvia). Indicators characterizing selected fiscal risks (Government Deficit/Surplus, General Government Gross Debt, see Figure 5 and Figure 6) also show the crisis consequences. Especially the Government Deficit indicator shows different developments of this indicator for Estonia and Latvia, Lithuania. However, towards the end of the analyzed period, a positive trend can be observed and their gradual convergence resulting from reform measures implemented in connection with the adoption of the single European currency. The study about budget deficit and debt is depicted in (Karazijiene 2015).
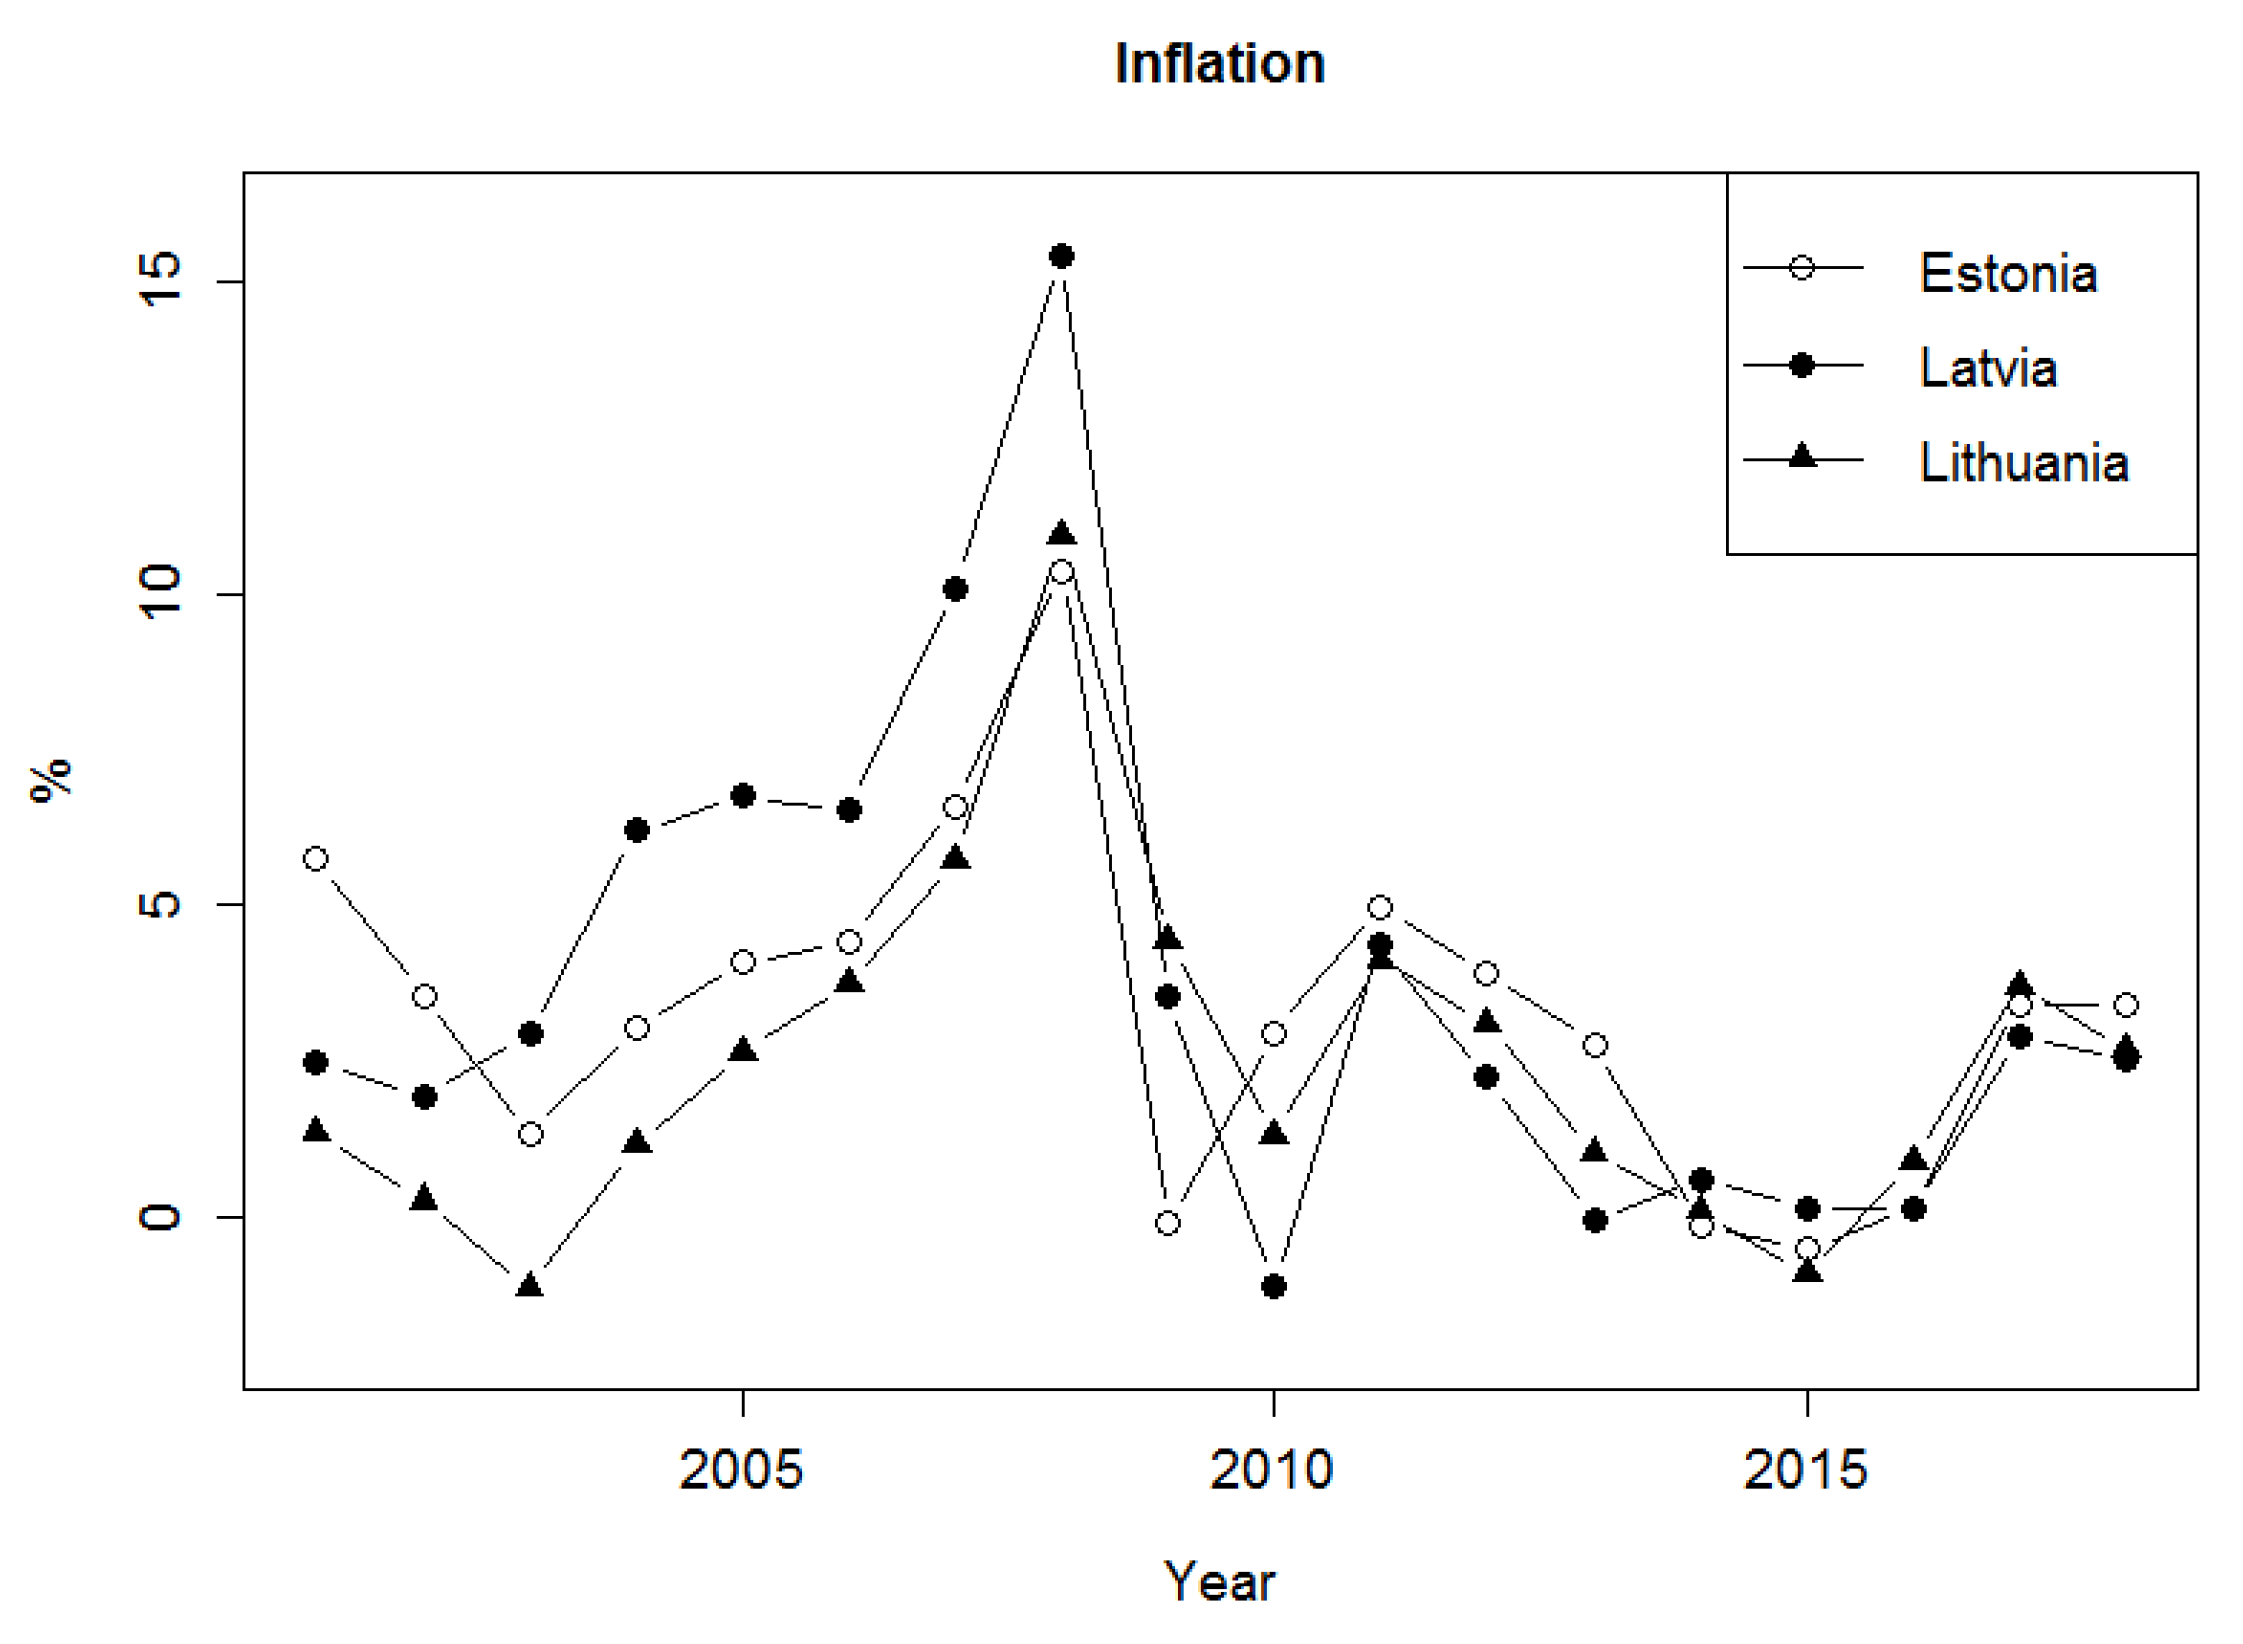
A similar trend is apparent from Figure 7 illustrating development of Inflation where the inflation rate and similarly the state budget deficit indicator belong to the “convergence criteria” binding for the adoption of the single European currency. Lithuania, the intention of which was to adopt the single currency as early as 2007, displayed very low levels at the beginning of the analyzed period. Figure 7 indicates similarly low levels after 2010 directing the analyzed countries towards fulfilling the convergence criteria. Economic analysis of inflation in Latvia is presented in (Kochetkov 2012).

4. Models and Methods

We analyze data from 2001 to 2018. We apply autoregressive distributed lag model ARDL(p, q 1 , q 2 , …, p k ), where p is the number of lags of the dependent variable Y t , q 1 , q 2 , , q k are numbers of lags of explanatory variables X i t , i = 1 , 2 , , k . The model can be written as
Y t = α + i = 1 p γ i Y t i + j = 1 k i = 0 q j β j , i X j , t i + ϵ t ,
where ϵ t is a one-dimensional zero mean error term. It is possible to transform the model into a long-run representation showing the long run response of the dependent variable to a change in the explanatory variables (Baltagi 2011; Mills 2019). The long run estimates are given by (Pesaran and Shin 1999; Pesaran et al. 2001)
θ ^ j = i = 1 q j β ^ j , i 1 i = 1 p γ ^ i .
The ARDL approach offers except for the dynamic description also testing of cointegration (Hassler and Wolters 2006). The cointegrated system of time series can by estimated as ARDL model (Pesaran and Shin 1999) with the advantage that variables in cointegrating relationship can be either I ( 0 ) or I ( 1 ) without needing to specify which are I ( 0 ) or I ( 1 ) . For the purpose of cointegration analysis the form of (1) in differences is used
Δ Y t = i = 1 p 1 γ i * Δ Y t i + j = 1 k i = 0 q j 1 β j , i * Δ X j , t i ϕ ^ E C t 1 + ϵ t ,
where E C t = Y t α ^ j = 1 k θ ^ j X j , t , and ϕ ^ = 1 i = 1 p γ i ^ . (Pesaran et al. 2001) proposed a methodology for testing existence of long-run relationship between independent variable and regressors. For so called bounds testing they use the following representation of (3)
Δ Y t = i = 1 p 1 γ i * Δ Y t i + j = 1 k i = 0 q j 1 β j , i * Δ X j , t i ρ Y t 1 α j = 1 k δ j X j , t 1 + ϵ t .
The test for existence of long-run relationship is a test of ρ = 0 and δ 1 = δ 2 = = δ k = 0 . The distribution of the test statistic based on (4) depends on the fact whether the regressors are I ( 0 ) or I ( 1 ) . (Pesaran et al. 2001) provide critical values for the cases where all regressors are I ( 0 ) and the cases where all regressors are I ( 1 ) . These critical values are used as bound for the more typical cases where the regressors are a mixture of I ( 0 ) and I ( 1 ) .
ARDL models are among the popular and frequently used approaches in econometric studies, see, e.g., (Marques et al. 2019; Menegaki 2019; Kochetkov 2012; Khan et al. 2019; Obradovic et al. 2017; Ridzuan et al. 2017; Kurecic and Kokotovic 2017).

5. Results

To analyze military expenditure determinants of the Baltic States, the ARDL model is subsequently used making it possible to identify statistically significant determinants and correlations between them and military expenditure levels. In the ARDL model, we used lagged value of military expenditure ( t 1 ) and lagged values of the determinants ( t 1 , t 2 ) as regressors. This setting reflects the planning of military spending. Results of estimated models are summarized in Table 3. Two models for each country are mentioned. The models marked as “max” contain the maximal number of regressors (some variables are skipped due computational stability reasons). The models marked “final” contain mainly statistically significant regressors. We applied so called backward selection approach based on AIC criterion. In the models we use the following notation: Milex—military expenditure as a percentage of GDP, Conflict—Risk of Cross-Border Conflict, Democratic—Democratic Accountability, Foreign—Risk of Foreign Pressures, Deficit—Government Deficit/Surplus, Debt—General Government Gross Debt, GDPpc—GDP per Capita, Inflation—Inflation.
The results of the models given in Table 3, Table 4 and Table 5 show that the military expenditure of Estonia is influenced by the following variables: lagged value of Military Expenditure, Risk of Cross-border Conflict, Government Deficit/Surplus, GDP per Capita, and Inflation. The military expenditure of Lithuania is influenced by lagged value of Military Expenditure, Government Deficit/Surplus, and Inflation. The variables influencing the military expenditure of Lithuania are lagged value of Military Expenditure, Risk of Cross-border Conflict, Government Deficit/Surplus, General Government Gross Debt, and Inflation.
According to the results of F-bound tests (see Table 6), we can identify the long-run relationship between military expenditure and regressors in all three countries. We can describe the long-run relationship for Estonia by the equation.
EC ^ t = Milex t ( 0.125 Conflict t 1 + 0.060 Deficit t 1 + 0.015 GDPpc t 1 + 0.038 Inflation t 1 + 1.197 ) .
For Latvia, we get the equation
EC ^ t = Milex t ( 1.252 Deficit t 1 + 0.686 Inflation t 1 5.302 ) .
We obtain the long run relationship for Lithuania in the form
EC ^ t = Milex t ( 0.016 Conflict t 1 + 0.270 Deficit t 1 + 0.062 Debt t 1 0.037 Inflation t 1 + 0.134 ) .

6. Discussion

According to the ARDL model results, the analyzed Risk of Cross-Border Conflict variable influences the military expenditure of Estonia and, similarly to the above variable, it fails to confirm the general hypothesis about higher military expenditure in countries having a higher risk of conflict, see Table 7. With regard to economic determinants, the model results confirm the expected positive link between Government Deficit/Surplus and military expenditure level (Estonia and Lithuania) where the increased surplus causes an increase in military expenditure. The model result confirms the variables development when Government Deficit decreases thanks to reform measures taken to meet the convergence criteria especially in the latter half of the analyzed period. At the same time, military expenditure level increases especially in Lithuania and Latvia demonstrating the biggest increase among NATO member states. On the other hand, different results are obtained when the influence of General Government Gross Debt on military expenditure level is analyzed for Lithuania, where a positive link can be observed between these variables. The economic environment characterized by the living standard indicator measured by Gross Domestic Product influences military expenditure in Estonia where positive link between increasing GDP and military expenditure can be seen. The estimated interdependence confirms the hypothesis about the influence of economic environment on military expenditure and, therefore, about a possible decrease in military expenditure in the event of an unfavorable economic situation. As to Estonia, the increasing GDP is accompanied by increasing military expenditure during the analyzed period. Inflation represents an economic determinant of military expenditure influencing the purchasing power of military expenditure of the analyzed countries. The model results indicate a positive link between Inflation and military expenditure level in the case of Estonia; the original assumption about increasing military expenditure during periods of rising inflation caused by efforts to maintain or increase the purchasing power of military expenditure was confirmed. However, real data shows that the military expenditures of Lithuania, Latvia and Estonia were increasing independently of inflation which went down during the analyzed period, especially thanks to the preparations for the adoption of the single European currency.

7. Conclusions

The Baltic States represent an example of very few NATO member states, the economies of which show increasing military expenditure (absolute value, share of GDP) and, moreover, fulfill the political obligation to allocate 2% of GDP to defense. The article presents an econometric method of analyzing military expenditure determinants understood as factors influencing the level of military expenditure. On the basis of a theoretical definition of selected economic and security factors, the following determinants were quantified: GDP per Capita, Government Deficit/Surplus, General Government Gross Debt, Inflation, Risk of Foreign Pressures, Risk of Cross-border Conflict, and Democratic Accountability. The ARDL model was applied to test general hypotheses predicting a negative link between the military expenditure level and selected economic variables (increased budget deficit, increased indebtedness, decline in GDP) leading to reductions in military expenditure (testing of the “opportunity cost” hypothesis), a positive relationship between the inflation rate and the military expenditure level (testing of the real purchasing power of military expenditure), and a positive relationship between an increased security risk to a country and the military expenditure level. The analysis results characterizing the period from 2001 to 2018 confirmed hypotheses predicting a link between variables characterizing the influence of budget deficit on military expenditure (Estonia, Lithuania), the influence of GDP on military expenditure (Estonia) and the influence of Inflation on military expenditure (Estonia). The character of data files clearly indicates a negative trend in military expenditure during the economic crisis and a significant increase in military expenditure connected with the changing security situation at the end of the analyzed period. From the point of view of economic determinants, economic policy aimed at preparations for the adoption of the single European currency seems to play an important role when the convergence criteria influence the analyzed variables Government Deficit/Surplus, General Government Gross Debt and Inflation. From the long-term point of view, measures intended to reduce state budget deficits did not limit military expenditure of the Baltic States, unlike the majority of new NATO member states, but lead to the establishment of their responsible defense policies consisting in increasing military expenditure and in fulfilling the declared political obligation towards NATO.

Author Contributions

Conceptualization, J.O. and J.N.; methodology, J.N., J.O. and T.A.; software, J.N.; validation, J.O., J.N. and L.D.; data curation, J.N. and J.O.; writing—original draft preparation, J.O., J.N., T.A. and L.D.; writing—review and editing, J.O., J.N., T.A. and L.D.; visualization, J.N.; supervision, J.O. and J.N. All authors have read and agreed to the published version of the manuscript.

Funding

This article has been supported by the Czech Republic Ministry of Defence—Faculty of Military Leadership of University of Defence development program “AERO”.

Acknowledgments

We thank the editor, the anonymous referees for their useful comments and suggestions that improved this work.

Conflicts of Interest

The authors declare no conflict of interest.The funders had no role in the design of the study; in the collection, analyses, or interpretation of data; in the writing of the manuscript, or in the decision to publish the results.

References

  1. Abu-Qarn, Aamer S., John Paul Dunne, Yasmine M. Abdelfattah, and Shadwa Zaher. 2010. The Demand for Military Spending in Egypt. Working Papers 1001. Bristol: Department of Accounting, Economics and Finance, Bristol Business School, University of the West of England, Available online: http://carecon.org.uk/DPs/1001.pdf (accessed on 2 February 2020).
  2. Baltagi, Badi H. 2011. Econometrics, 5th ed. New York: Springer. [Google Scholar]
  3. Bel, Germà, and Ferran Elias-Moreno. 2009. Institutional Determinants of Military Spending. IREA Working Papers 2009/22. Barcelona: University of Barcelona, Research Institute of Applied Economics, Available online: http://www.ub.edu/irea/working_papers/2009/200922.pdf (accessed on 20 January 2020).
  4. Bergmane, Una. 2017. The Three Little Oligarchs: Latvia’s Corruption Scandal. Baltic Bulletin. November 22. Available online: https://www.fpri.org/article/2017/11/three-little-oligarchs-latvias-corruption-scandal/ (accessed on 10 January 2020).
  5. Bove, Vincenzo, and Jennifer Brauner. 2016. The demand for military expenditure in authoritarian regimes. Defence and Peace Economics 27: 609–25. [Google Scholar] [CrossRef]
  6. Cavegn, Dario. 2017. Estonia Accepts Finnish Invitation to Go in on Howitzer Tender. ERR. February 3. Available online: https://news.err.ee/120567/estonia-accepts-finnish-invitation-to-go-in-on-howitzer-tender (accessed on 20 January 2020).
  7. Collier, Paul, and Anke Hoeffler. 2002. Military Expenditure: Threats, Aid and Arms Races. The World Bank Policy Research Working Paper Series 2927. Available online: https://msuweb.montclair.edu/~lebelp/PSC643IntPolEcon/CollierArmsRaceswps2927.pdf (accessed on 20 February 2020).
  8. Dunne, John Paul, and Sam Perlo-Freeman. 2003. The demand for military spending in developing countries: A dynamic panel analysis. Defense and Peace Economics 14: 461–74. [Google Scholar] [CrossRef]
  9. Dunne, Paul, and Eftychia Nikolaidou. 2001. Military expenditure and economic growth: A demand and supply model for Greece, 1960–1996. Defence and Peace Economics 12: 47–67. [Google Scholar] [CrossRef]
  10. Estonian Ministry of Defence. 2011. National Defence Strategy. Available online: https://www.kaitseministeerium.ee//sites/default/files/elfinder/article_files/national_defence_strategy.pdf (accessed on 20 February 2020).
  11. European Commision Eurostat. 2020. Eurostat Database. Available online: https://ec.europa.eu/eurostat/data/database (accessed on 15 March 2020).
  12. Friedrich, Peter, and Janno Reiljan. 2015. Estonian Economic Policy during Global Financial Crisis. CESifo Forum 4/2015. Available online: https://www.ifo.de/DocDL/forum-2015-4-friedrich-reiljan-baltic-tiger-december_0.pdf (accessed on 20 January 2020).
  13. Hassler, Uwe, and Jürgen Wolters. 2006. Autoregressive Distributed Lag Models and Cointegration. In Modern Econometric Analysis. Edited by O. Hübler and J. Frohn. Berlin/Heidelberg: Springe, pp. 57–72. [Google Scholar]
  14. Holcner, Vladan, and Aleš Olejníček. 2017. Possibilities of Defense Spending Stabilization. Journal of Security Sustainability Issues 7: 5–16. [Google Scholar] [CrossRef]
  15. Holcner, Vladan. 2019. Two Percent of GDP for Defense. A Realistic Commitment of NATO Nations? Obrana a Strategie 19: 5–18. [Google Scholar] [CrossRef] [Green Version]
  16. Judson, Jen. 2019. Do the Baltics need more US military support to deter Russia? DefenseNews. July 16. Available online: https://www.defensenews.com/land/2019/07/15/do-the-baltics-need-more-us-military-support-to-deter-russia/ (accessed on 10 January 2020).
  17. Karazijiene, Zaneta. 2015. Modelling of the Effect of the Public Sector Borrowing on the Lithuanian Economy. Inzinerine Ekonomika-Engineering Economics 4: 24–31. Available online: http://inzeko.ktu.lt/index.php/EE/article/view/11603 (accessed on 10 January 2020).
  18. Khan, Muhammad Kamran, Jian-Zhou Teng, and Muhammad Imran Khan. 2019. The Effect of Migrant Remittances on Economic Growth: An ARDL Approach. Inzinerine Ekonomika-Engineering Economics 30: 434–41. [Google Scholar] [CrossRef] [Green Version]
  19. Kochetkov, Yuri. 2012. Modern Model of Interconnection of Inflation and Unemployment in Latvia. Inzinerine Ekonomika-Engineering Economics 23: 117–24. [Google Scholar] [CrossRef] [Green Version]
  20. Kurecic, Petar, and Filip Kokotovic. 2017. The Relevance of Political Stability on FDI: A VAR Analysis and ARDL Models for Selected Small, Developed, and Instability Threatened Economies. Economies 5: 22. [Google Scholar] [CrossRef] [Green Version]
  21. Lasconjarias, Guillaume, and Lukáš Dycka. 2017. Dealing with the Russian Bear: Improving NATO’s Response to Moscow’s Military Exercise Zapad 2017. IAI Commentaries 17. Available online: https://www.iai.it/sites/default/files/iaicom1718.pdf (accessed on 12 January 2020).
  22. Marques, Luís Miguel, José Alberto Fuinhas, and António Cardoso Marques. 2019. Are There Spillovers from China on the Global Energy-Growth Nexus? Evidence from Four World Regions. Economies 7: 59. [Google Scholar] [CrossRef] [Green Version]
  23. McGuinness, Damien. 2017. How a Cyber Attack Transformed Estonia. BBC. April 27. Available online: https://www.bbc.com/news/39655415 (accessed on 12 January 2020).
  24. Menegaki, Angeliki N. 2019. The ARDL Method in the Energy-Growth Nexus Field; Best Implementation Strategies. Economies 7: 105. [Google Scholar] [CrossRef] [Green Version]
  25. Metha, Aaron. 2018. Latvia Cleared to Buy Black Hawks. DefenseNews. August 3. Available online: https://www.defensenews.com/global/europe/2018/08/03/latvia-cleared-to-buy-black-hawks/ (accessed on 12 January 2020).
  26. Ministry of Defence of Latvia. 2018. Comprehensive Defence. Available online: https://www.mod.gov.lv/en/nozares-politika/comprehensive-defence (accessed on 20 January 2020).
  27. Mills, Terence C. 2019. Applied Time Series Analysis: A Practical Guide to Modeling and Forecasting. London: Academic Press. [Google Scholar]
  28. NCB News. 2005. Putin: Soviet Collapse a ’Genuine Tragedy’. NCB News. April 25. Available online: http://www.nbcnews.com/id/7632057/ns/world_news/t/putin-soviet-collapse-genuine-tragedy/#.XyE2_-fgo2x (accessed on 12 January 2020).
  29. Obradovic, Saša, Srdjan Srdjan Furtula, and Nemanja Lojanica. 2017. Linkages between Inflation and Economic Growth in Serbia: An ARDL Bounds Testing Approach. Inzinerine Ekonomika-Engineering Economics 28: 401–10. [Google Scholar] [CrossRef]
  30. Odehnal, Jakub, and Jiri Neubauer. 2015. Economic Determinants of Military Spending—Causal Analysis. Ekonomicky Casopis 63: 1019–32. [Google Scholar]
  31. Odehnal, Jakub, and Jiří Neubauer. 2020. Economic, Security, and Political Determinants of Military Spending in NATO Countries. Defence and Peace Economics 31: 517–31. [Google Scholar] [CrossRef]
  32. Pesaran, M. Hashem, Yongcheol Shin, and Richard J. Smith. 2001. Bounds Testing Approaches to the Analysis of Level Relationships. Journal of Applied Econometrics 16: 298–326. [Google Scholar] [CrossRef]
  33. Pesaran, M. Hashem, and Yongcheol Shin. 1999. An Autoregressive Distributed Lag Modelling Approach to Cointegration Analysis. In Econometrics and Economic Theory in the 20th Century: The Ragnar Frisch Centennial Symposium. Edited by S. Strom. Cambridge: Cambridge University Press. [Google Scholar]
  34. Petersen, Phillip A., and Nicholas Myers. 2018. Baltic Security Net Assessment. Available online: https://www.baltdefcol.org/files/files/publications/BalticSecurityNetAssessment2018.pdf (accessed on 12 January 2020).
  35. Political Risk Service Group. 2020. PRS Database. Available online: http://www.prsgroup.com/ICRG.aspx (accessed on 15 March 2020).
  36. Ridzuan, Abdul Rahim, Nor Asmat Ismail, and Abdul Fatah Che Hamat. 2017. Does Foreign Direct Investment Successfully Lead to Sustainable Development in Singapore? Economies 5: 29. [Google Scholar] [CrossRef] [Green Version]
  37. Saldziunas, Vaidas. 2016. Drastic Changes Needed in Lithuanian Armed Forces (2). Delfi. April 25. Available online: https://en.delfi.lt/archive/drastic-changes-needed-in-lithuanian-armed-forces.d?id=71081884 (accessed on 12 January 2020).
  38. Sezgin, Selami, and Jülide Yildirim. 2002. The Demand for Turkish Defence Expenditure. Defence and Peace Economics 13: 121–28. [Google Scholar] [CrossRef]
  39. Solarin, Sakiru Adebola. 2018. Determinants of military expenditure and the role of globalization in a cross-country analysis. Defence and Peace Economics 29: 853–70. [Google Scholar] [CrossRef]
  40. Spangler, Ethan. 2018. Allies with Benefits: US Effect on European Demand for Military Expenditures. Defence and Peace Economics 29: 731–47. [Google Scholar] [CrossRef]
  41. Stockholm International Peace Research Institute. 2020. SIPRI Military Expenditure Database. Available online: https://www.sipri.org/databases/milex (accessed on 15 March 2020).
  42. Stundziene, Alina, Vytautas Barkauskas, and Vilda Giziene. 2017. The leading indicators of the economic cycles in Lithuania. Inzinerine Ekonomika-Engineering Economics 28: 280–89. [Google Scholar] [CrossRef]
  43. Tao, Ran, Oana Ramona Glonț, Zheng-Zheng Li, Oana Ramona Lobonț, and Adina Alexandra Guzun. 2020. New Evidence for Romania Regarding Dynamic Causality between Military Expenditure and Sustainable Economic Growth. Sustainability 12: 5053. [Google Scholar] [CrossRef]
  44. Valentinait, Milda, and Vytautas Snieska. 2005. Baltic States Business Cycle Symmetry: Shock Correlation. Inzinerine Ekonomika-Engineering Economics 4: 24–30. Available online: http://inzeko.ktu.lt/index.php/EE/article/view/11311 (accessed on 20 January 2020).
  45. Vahtla, Aili. 2017. US to gift Estonian Air Force two M28 transport aircraft. ERR. August 10. Available online: https://news.err.ee/612169/us-to-gift-estonian-air-force-two-m28-transport-aircraft (accessed on 20 January 2020).
  46. Veebel, Vilja. 2019. Researching Baltic security challenges after the annexation of Crimea. Journal on Baltic Security 5: 41–52. [Google Scholar] [CrossRef] [Green Version]
Figure 1. Military expenditure as a percentage of GDP.
Economies 08 00068 g001
Figure 2. Risk of cross-border conflict.
Economies 08 00068 g002
Figure 3. Risk of foreign pressures.
Economies 08 00068 g003
Figure 4. GDP per capita.
Economies 08 00068 g004
Figure 5. Government deficit/surplus.
Economies 08 00068 g005
Figure 6. General government gross debt.
Economies 08 00068 g006
Figure 7. Inflation.
Economies 08 00068 g007
Table 1. Summary of variables used in defined studies.
AuthorsAnalyzed CountriesAnalyzed Variables (Determinants of Military Spending)
(Sezgin and Yildirim 2002)TurkeyShare of Turkish defense spending in GDP, growth rate of Turkish GDP, average defense burden of NATO, Turkish balance of trade in GDP, Greek defense burden, share of non-defense government expenditure (government spending-defense spending) in GDP, Turkish population, Cyprus conflict dummy variable.
(Spangler 2018)NATO countries and Ireland, Finland, Sweden, SwitzerlandMilitary expenditures, government revenue, gross domestic product, government expenditures, summed exports and imports, population density, involvement in the Iraq War, Russian military expenditures, NATO military expenditures.
(Solarin 2018)82 countriesMilitary burden, military expenditure, globalization index, economic globalization, GDP, population, urbanization, dependency ratio, polity, institution, NATO members.
(Bove and Brauner 2016)69 countriesMilitary burden, regime, interstate war, intrastate (civil) war, GDP per capita, population, openness (economy).
(Abu-Qarn et al. 2010)EgyptGDP, military burden of other countries (Israel, Jordan and Syria), population, political and strategic variables.
(Collier and Hoeffler 2002)161 countriesInternational war, civil war, external threat, neighbors’ military expenditure, population, internal threat, democracy, GDP per capita, aid.
Table 2. Description of variables.
VariablesDescriptionMeasurement
GDP per CapitaThe estimated GDP is expressed as a percentage of the EU.% of average
Government Deficit/SurplusThe government deficit/surplus as a percentage of the estimated GDP.% of GDP
General Government Gross DebtThe estimated government debt is expressed as a percentage of GDP.% of GDP
InflationThe estimated annual inflation rate (the unweighted average of the consumer price index) is calculated as a percentage change.%
Risk of Cross-Border ConflictA score of 0 points equates to very low risk and a score of 10 points to very high risk.a minimum score of 0 points, a maximum score of 10 points
Risk of Foreign PressuresA score of 0 points equates to very low risk and a score of 10 points to very high risk.a minimum score of 0 points, a maximum score of 10 points
Democratic AccountabilityThis is a measure of how responsive government is to its people.a minimum score of 0 points, a maximum score of 10 points
Table 3. ARDL models of military expenditure in Estonia, Latvia and Lithuania; max—the models with a maximal number of regressors, final—the reduced final models; standard errors of the estimates are in parenthesis.
VariableEstoniaLatviaLithuania
MaxFinalMaxFinalMaxFinal
Milex t 1 0.294−0.415 ***1.1711.032 ***0.841 **0.794 ***
(0.369)(0.095)(0.432)(0.144)(0.085)(0.066)
Conflict t 1 −0.266−0.073 **0.277−0.072−0.134 **
(0.097)(0.023)(0.392)(0.065)(0.041)
Conflict t 2 −0.111−0.105 ***−0.2470.131 **0.137 **
(0.035)(0.028)(0.349)(0.049)(0.041)
Democratic t 1 0.169
(0.995)
Democratic t 2 −0.630
(0.430)
Foreign t 1 0.2070.5160.006
(0.529)(1.484)(0.064)
Foreign t 2 −0.2790.113
(0.595)(0.107)
Deficit t 1 0.1190.040 ***0.0340.040 ***0.0270.026 ***
(0.038)(0.008)(0.092)(0.012)(0.017)(0.006)
Deficit t 2 0.0360.046 ***0.0110.0380.030 ***
(0.007)(0.006)(0.103)(0.024)(0.006)
Debt t 1 0.028−0.0240.0340.029 ***
(0.014)(0.039)(0.021)(0.008)
Debt t 2 −0.0300.019−0.029−0.017 *
(0.013)(0.031)(0.015)(0.007)
GDPpc t 1 −0.037−0.025 ***−0.0660.019
(0.009)(0.004)(0.070)(0.019)
GDPpc t 2 0.0340.046 ***0.049−0.012
(0.008)(0.005)(0.085)(0.018)
Inflation t 1 0.0710.034 ***−0.014−0.0220.0040.026 **
(0.020)(0.004)(0.066)(0.010)(0.022)(0.009)
Inflation t 2 0.0100.019 ***−0.026−0.046−0.033 **
(0.005)(0.004)(0.037)(0.017)(0.010)
Const.1.2871.694 ***0.4380.169−0.4090.028 **
(2.500)(0.126)(1.205)(0.188)(0.293)(0.083)
R 2 0.9990.9950.9480.8730.9980.996
Adjusted R 2 0.9930.9860.9120.8410.9870.989
Note: * p < 0.1 , ** p < 0.05 , *** p < 0.01 .
Table 4. ARDL model parameter estimates (short-run) for final models; standard errors of the estimates are in parenthesis.
VariableEstoniaLatviaLithuania
Δ Conflict−0.073 ***−0.134 ***
(0.012)(0.022)
Δ Deficit0.040 ***0.026 ***
(0.003)(0.003)
Δ Debt0.029 ***
(0.003)
Δ GDPpc−0.025 ***
(0.001)
Δ Inflation0.034 ***0.025 ***
(0.001)(0.004)
EC t 1 −1.415 ***−0.032 ***−0.206 ***
(0.057)(0.007)(0.009)
Note: * p < 0.1 , ** p < 0.05 , *** p < 0.01 .
Table 5. ARDL model parameter estimates (long-run) for final models; standard errors of the estimates are in parenthesis.
VariableEstoniaLatviaLithuania
Conflict−0.125 ***0.016
(0.010)(0.206)
Deficit0.060 ***−1.2520.270 ***
(0.007)(5.732)(0.062)
Debt0.062 **
(0.019)
GDPpc0.015 ***
(0.001)
Inflation0.038 ***0.686−0.037
(0.003)(2.922)(0.028)
C1.197 ***−5.3020.134
(0.028)(29.557)(0.386)
Note: * p < 0.1 , ** p < 0.05 , *** p < 0.01 .
Table 6. F-bound test at the significance level 0.05.
VariableEstoniaLatviaLithuania
Test statistic55.2364.34146.199
Degrees of freedom424
Critical value I ( 0 ) 2.563.12.56
Critical value I ( 1 ) 3.493.873.49
Table 7. Expected and estimated links between military expenditure and their determinants.
VariableExpected LinkEstimated Link (Long-Run)
Cross-Border ConflictPositiveNegative
Democratic AccountabilityPositive
Foreign PressuresPositive
Government Deficit/SurplusPositivePositive
General Government Gross DebtNegativePositive
GDP per CapitaPositivePositive
InflationPositivePositive

