Decline in Mobility: Public Transport in Poland in the time of the COVID-19 Pandemic


Abstract
:1. Introduction
2. Methodology
3. Research Results and Discussion
4. Conclusions
Author Contributions
Funding
Conflicts of Interest
Appendix A


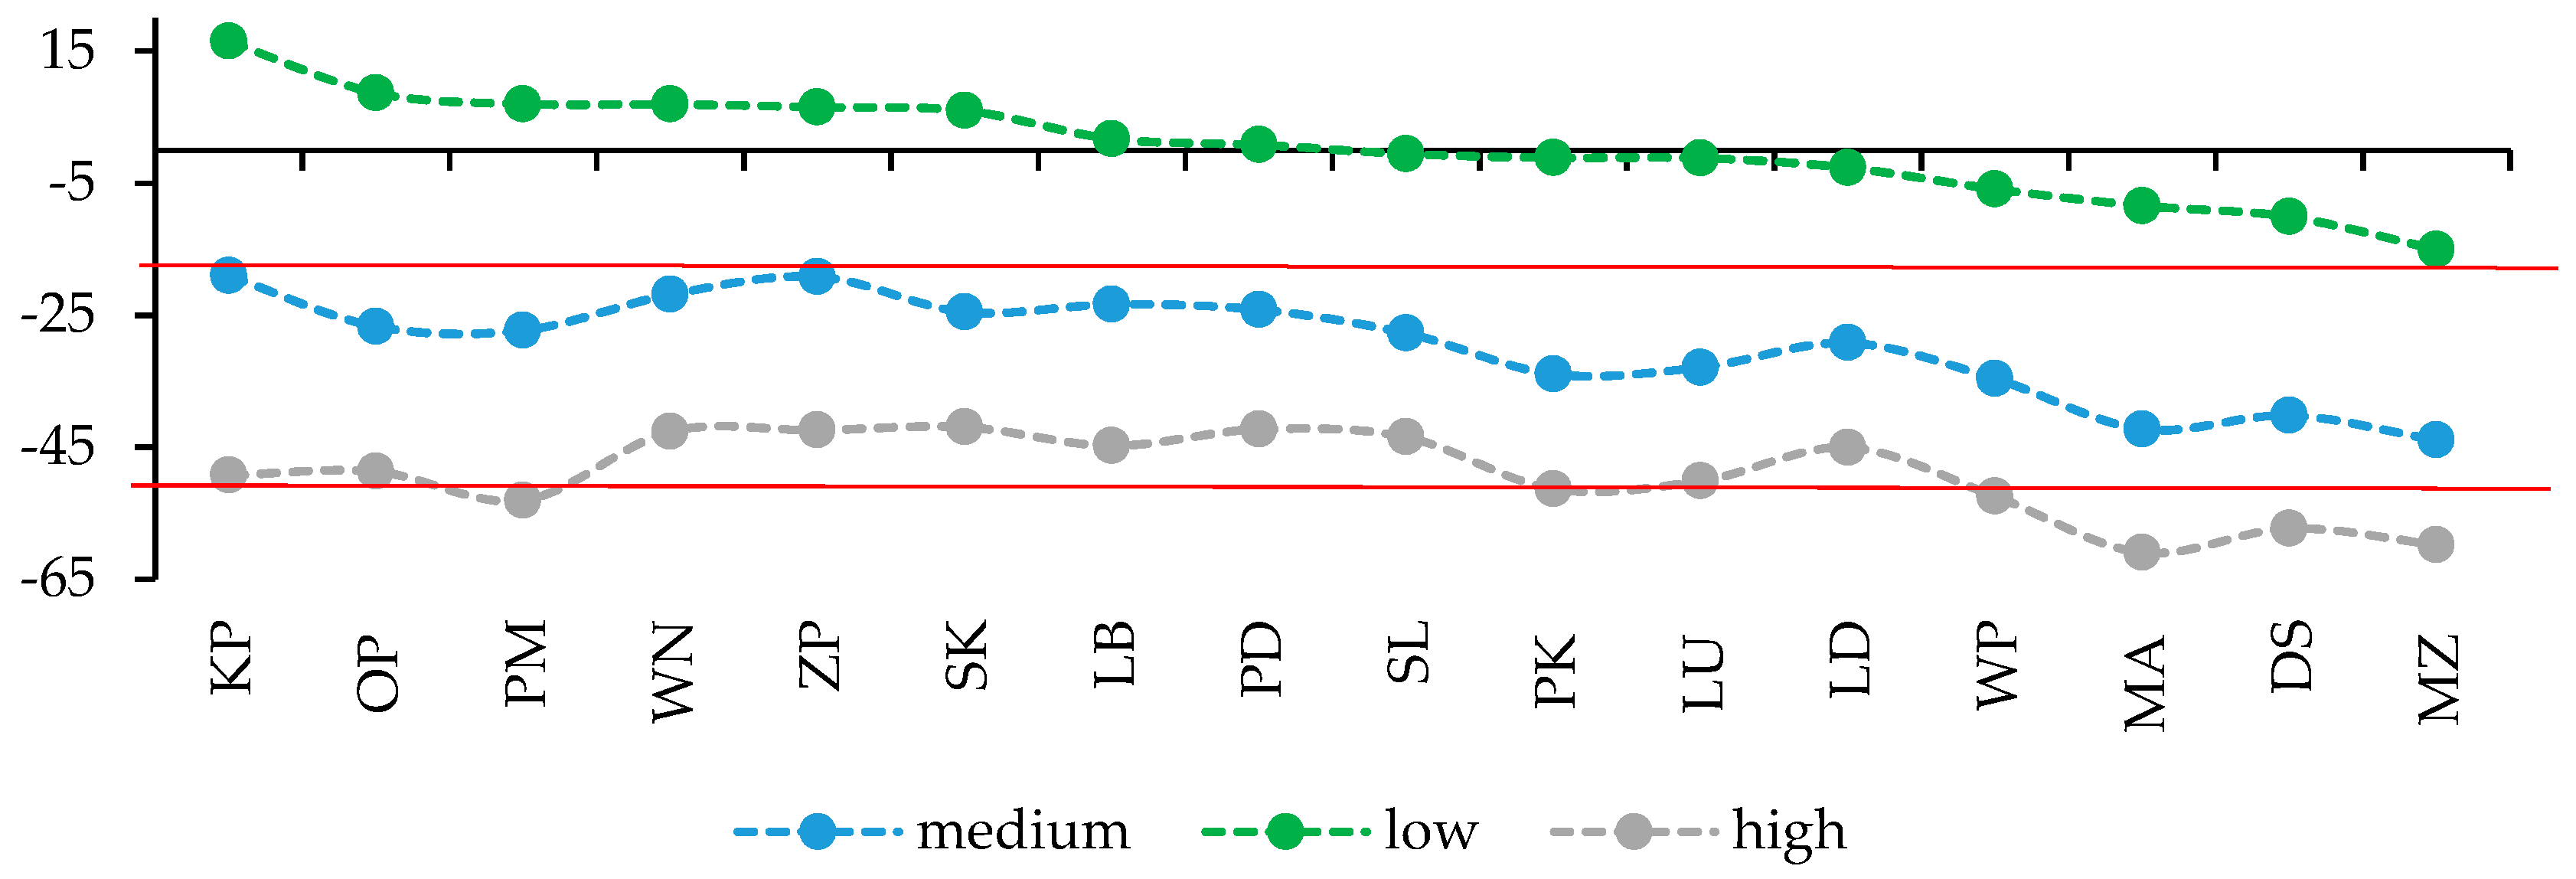
| Region | Stringency Policy Level | Average Value of Changes in Mobility in Public Transport | Tukey’s HSD Test | |
|---|---|---|---|---|
| Difference | p-Value | |||
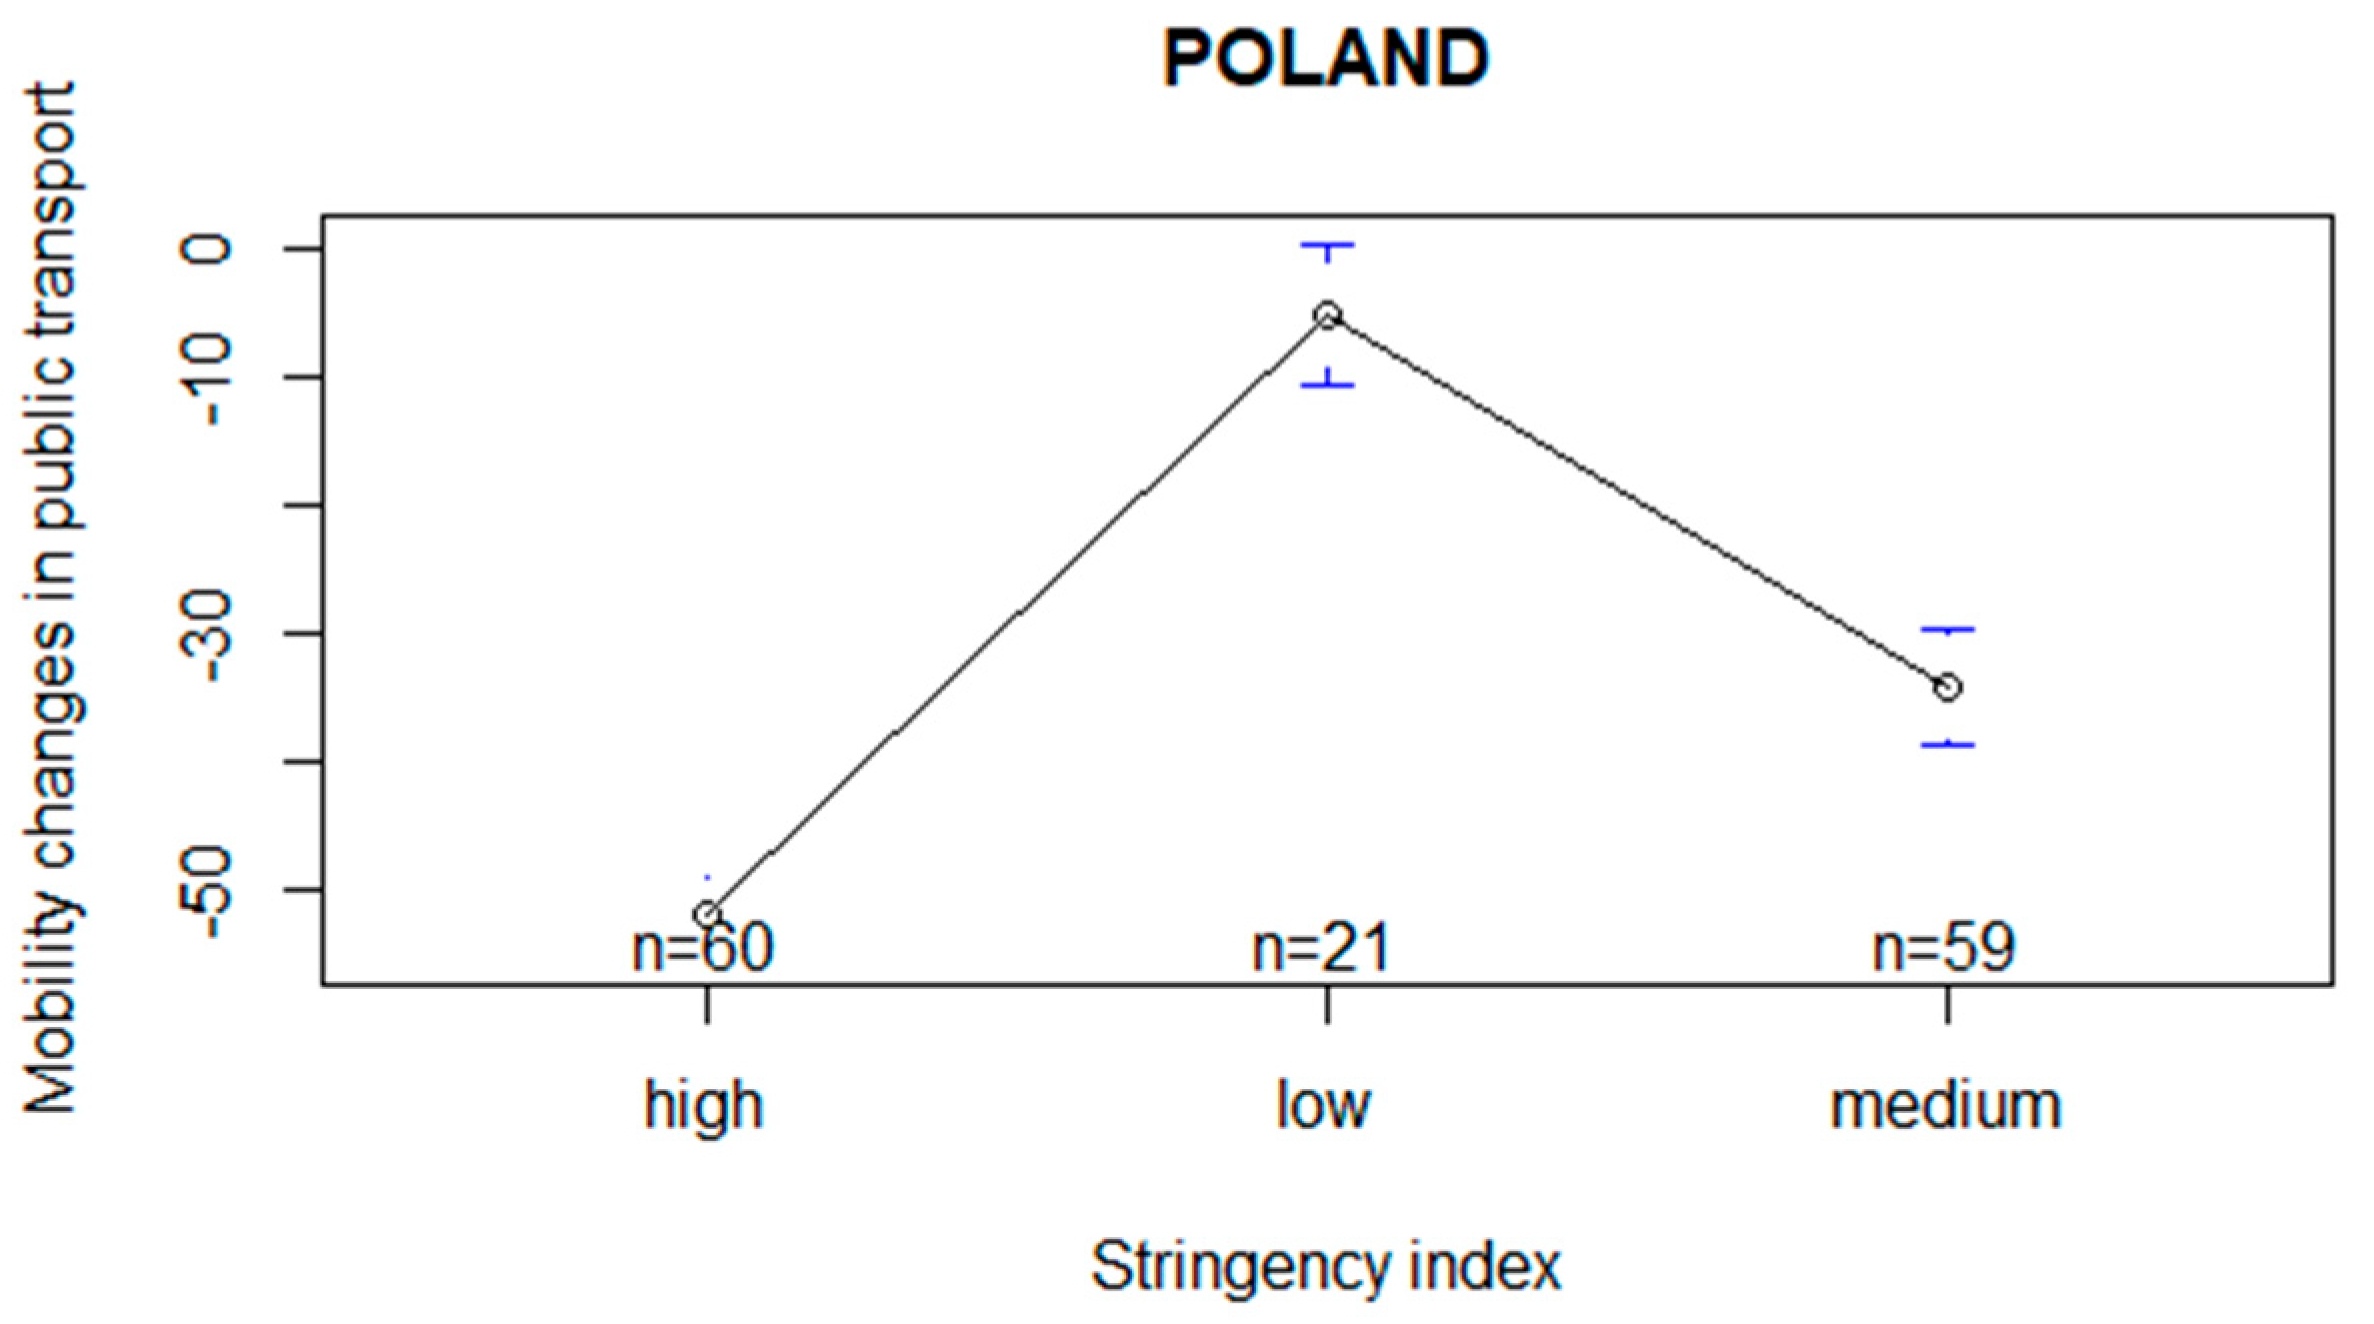
| POLAND | low | −5.24 | low-medium | <0.001 |
| medium | −34.32 | low-high | <0.001 | |
| high | −52.02 | medium-high | <0.001 | |
| Greater Poland | low | −5.90 | low-medium | <0.001 |
| medium | −34.63 | low-high | <0.001 | |
| high | −52.45 | medium-high | <0.001 | |
| Holy Cross | low | 6.00 | low-medium | <0.001 |
| medium | −24.53 | low-high | <0.001 | |
| high | −41.95 | medium-high | <0.001 | |
| Kuyavian-Pomeranian | low | 16.48 | low-medium | <0.001 |
| medium | −19.02 | low-high | <0.001 | |
| high | −49.25 | medium-high | <0.001 | |
| Lesser Poland | low | −8.43 | low-medium | <0.001 |
| medium | −42.29 | low-high | <0.001 | |
| high | −60.97 | medium-high | <0.001 | |
| Lower Silesian | low | −10.10 | low-medium | <0.001 |
| medium | −40.20 | low-high | <0.001 | |
| high | −57.30 | medium-high | <0.001 | |
| Lublin | low | −1.19 | low-medium | <0.001 |
| medium | −32.92 | low-high | <0.001 | |
| high | −50.13 | medium-high | <0.001 | |
| Lubusz | low | 1.71 | low-medium | <0.001 |
| medium | −23.37 | low-high | <0.001 | |
| high | −44.78 | medium-high | <0.001 | |
| Łódź | low | −2.67 | low-medium | <0.001 |
| medium | −29.20 | low-high | <0.001 | |
| high | −45.05 | medium-high | <0.001 | |
| Masovian | low | −15.05 | low-medium | <0.001 |
| medium | −43.92 | low-high | <0.001 | |
| high | −59.78 | medium-high | <0.001 | |
| Opole | low | 8.67 | low-medium | <0.001 |
| medium | −26.71 | low-high | <0.001 | |
| high | −48.68 | medium-high | <0.001 | |
| Podlaskie | low | 0.81 | low-medium | <0.001 |
| medium | −24.17 | low-high | <0.001 | |
| high | −42.28 | medium-high | <0.001 | |
| Pomeranian | low | 7.00 | low-medium | <0.001 |
| medium | −27.31 | low-high | <0.001 | |
| high | −53.07 | medium-high | <0.001 | |
| Silesian | low | −0.57 | low-medium | <0.001 |
| medium | −27.73 | low-high | <0.001 | |
| high | −43.47 | medium-high | <0.001 | |
| Subcarpathian | low | −1.14 | low-medium | <0.001 |
| medium | −33.93 | low-high | <0.001 | |
| high | −51.35 | medium-high | <0.001 | |
| Warmian-Masurian | low | 6.95 | low-medium | <0.001 |
| medium | −21.88 | low-high | <0.001 | |
| high | −42.63 | medium-high | <0.001 | |
| West Pomeranian | low | 6.52 | low-medium | <0.001 |
| medium | −19.17 | low-high | <0.001 | |
| high | −42.43 | medium-high | <0.001 | |


References
- Almagro, Milena, and Angelo Orane-Hutchinson. 2020. The Differential Impact of COVID-19 across Demographic Groups: Evidence from NYC. SSRN Electronic Journal. [Google Scholar] [CrossRef]
- Aloi, Alfredo, Borja Alonso, Juan Benavente, Rubén Cordera, Eneko Echániz, Felipe González, Claudio Ladisa, Raquel Lezama-Romanelli, Álvaro López-Parra, Vittorio Mazzei, and et al. 2020. Effects of the COVID-19 Lockdown on Urban Mobility: Empirical Evidence from the City of Santander (Spain). Sustainability 12: 3870. [Google Scholar] [CrossRef]
- Andersen, Kristian, Andrew Rambaut, W. Ian Lipkin, Edward Holmes, and Robert Garry. 2020. The proximal origin of SARS-CoV-2. Nature Medicine 26: 450–52. [Google Scholar] [CrossRef] [PubMed] [Green Version]
- Askitas, Nikos, Konstantinos Tatsiramos, and Bertrand Verheyden. 2020. Lockdown Strategies, Mobility Patterns and COVID-19. arXiv arXiv:2006.00531. [Google Scholar]
- Badr, Hamada S., Hongru Du, Maximilian Marshall, Ensheng Dong, Marietta M. Squire, and Lauren M. Gardner. 2020. Association between Mobility Patterns and COVID-19 Transmission in the USA: A Mathematical Modelling Study. The Lancet Infectious Diseases. [Google Scholar] [CrossRef]
- Bajardi, Paolo, Chiara Poletto, Jose J. Ramasco, Michele Tizzoni, Vittoria Colizza, and Alessandro Vespignani. 2011. Human Mobility Networks, Travel Restrictions, and the Global Spread of 2009 H1N1 Pandemic. Edited by Matjaz Perc. PLoS ONE 6: e16591. [Google Scholar] [CrossRef] [Green Version]
- Barro, Robert, José Ursúa, and Joanna Weng. 2020. The Coronavirus and the Great Influenza Pandemic: Lessons from the “Spanish Flu” for the Coronavirus’s Potential Effects on Mortality and Economic Activity. NBER Working Papers 26866. Cambridge, MA, USA: National Bureau of Economic Research. [Google Scholar] [CrossRef]
- Bonaccorsi, Giovanni, Francesco Pierri, Matteo Cinelli, Andrea Flori, Alessandro Galeazzi, Francesco Porcelli, Ana Lucia Schmidt, Carlo Michele Valensise, Antonio Scala, Walter Quattrociocchi, and et al. 2020. Economic and Social Consequences of Human Mobility Restrictions under COVID-19. Proceedings of the National Academy of Sciences 117: 15530–35. [Google Scholar] [CrossRef]
- Boot, Arnoud, Elena Carletti, Rainer Haselmann, Hans-Helmut Kotz, Jan Pieter Krahnen, Loriana Pelizzon, Stephen Schaefer, and Marti Subrahmanyam. 2020. The Coronavirus and Financial Stability. SAFE Policy Letter 78. Frankfurt: Leibniz Institute for Financial Research SAFE. [Google Scholar]
- Browne, Annie, Sacha St-Onge Ahmad, Charles R. Beck, and Jonathan S. Nguyen-Van-Tam. 2016. The Roles of Transportation and Transportation Hubs in the Propagation of Influenza and Coronaviruses: A Systematic Review. Journal of Travel Medicine 23: tav002. [Google Scholar] [CrossRef] [Green Version]
- Cartenì, Armando, Luigi Di Francesco, and Maria Martino. 2020. How Mobility Habits Influenced the Spread of the COVID-19 Pandemic: Results from the Italian Case Study. Science of the Total Environment 741: 140489. [Google Scholar] [CrossRef]
- Chancellery of the Prime Minister of Poland. 2020. Available online: https://www.premier.gov.pl/en/news.html (accessed on 31 July 2020).
- Chinazzi, Matteo, Jessica T. Davis, Marco Ajelli, Corrado Gioannini, Maria Litvinova, Stefano Merler, Ana Pastore y Piontti, Kunpeng Mu, Luca Rossi, Kaiyuan Sun, and et al. 2020. The Effect of Travel Restrictions on the Spread of the 2019 Novel Coronavirus (COVID-19) Outbreak. Science 368: 395–400. [Google Scholar] [CrossRef] [Green Version]
- Cochrane, John. 2020. Coronavirus Monetary Policy. In Economics in the Time of COVID-19. Edited by Richard Baldwin and Beatrice di Mauro. London: CEPR Press. [Google Scholar]
- Coven, Joshua, and Arpit Gupta. 2020. Disparities in Mobility Responses to Covid-19. NYU Stern Working Paper. New York, NY, USA: NYU Stern School of Business. [Google Scholar]
- Czech, Katarzyna, Michał Wielechowski, Pavel Kotyza, Irena Benešová, and Adriana Laputková. 2020. Shaking Stability: COVID-19 Impact on the Visegrad Group Countries’ Financial Markets. Sustainability 12: 6282. [Google Scholar] [CrossRef]
- De Vos, Jonas. 2020. The Effect of COVID-19 and Subsequent Social Distancing on Travel Behavior. Transportation Research Interdisciplinary Perspectives 5: 100121. [Google Scholar] [CrossRef]
- Eichenbaum, Martin, Sergio Rebelo, and Mathias Trabandt. 2020. The Macroeconomics of Epidemics. NBER Working Papers 26882. Cambridge, MA, USA: National Bureau of Economic Research. [Google Scholar] [CrossRef]
- Engle, Samuel, John Stromme, and Anson Zhou. 2020. Staying at Home: Mobility Effects of COVID-19. SSRN Electronic Journal. [Google Scholar] [CrossRef]
- Eubank, Stephen, Hasan Guclu, V. S. Anil Kumar, Madhav V. Marathe, Aravind Srinivasan, Zoltán Toroczkai, and Nan Wang. 2004. Modelling Disease Outbreaks in Realistic Urban Social Networks. Nature 429: 180–84. [Google Scholar] [CrossRef] [PubMed]
- Galeazzi, Alessandro, Matteo Cinelli, Giovanni Bonaccorsi, Francesco Pierri, Ana Lucia Schmidt, Antonio Scala, Fabio Pammolli, and Walter Quattrociocchi. 2020. Human Mobility in Response to COVID-19 in France, Italy and UK. arXiv arXiv:2005.06341. [Google Scholar]
- Glaeser, Edward L., Caitlin S. Gorback, and Stephen J. Redding. 2020. How Much does COVID-19 Increase with Mobility? Evidence from New York and Four Other U.S. Cities. National Bureau of Economic Research. [Google Scholar] [CrossRef]
- Goniewicz, Krzysztof, Amir Khorram-Manesh, Attila J. Hertelendy, Mariusz Goniewicz, Katarzyna Naylor, and Frederick M. Burkle. 2020. Current Response and Management Decisions of the European Union to the COVID-19 Outbreak: A Review. Sustainability 12: 3838. [Google Scholar] [CrossRef]
- Goodell, John W. 2020. COVID-19 and Finance: Agendas for Future Research. Finance Research Letters 35: 101512. [Google Scholar] [CrossRef]
- Google. 2020. COVID-19 Community Mobility Reports. Available online: https://www.google.com/covid19/mobility/ (accessed on 31 July 2020).
- Goscé, Lara, and Anders Johansson. 2018. Analysing the Link between Public Transport Use and Airborne Transmission: Mobility and Contagion in the London Underground. Environmental Health 17: 84. [Google Scholar] [CrossRef] [Green Version]
- Gössling, Stefan, Daniel Scott, and C. Michael Hall. 2020. Pandemics, Tourism and Global Change: A Rapid Assessment of COVID-19. Journal of Sustainable Tourism, 1–20. [Google Scholar] [CrossRef]
- Hale, Thomas, Sam Webster, Anna Petherick, Toby Phillips, and Beatriz Kira. 2020. Oxford COVID-19 Government Response Tracker. Blavatnik School of Government. 2020. Available online: www.bsg.ox.ac.uk/covidtracker (accessed on 31 July 2020).
- IEA. 2020. Changes in Transport Behaviour during the Covid-19 Crisis. Paris: IEA. [Google Scholar]
- Jelnov, Pavel. 2020. Confronting COVID-19 Myths: Morbidity and Mortality. GLO Discussion Paper 516. Global Labor Organization (GLO). [Google Scholar]
- Jinjarak, Yothin, Rashad Ahmed, Sameer Nair-Desai, Weining Xin, and Joshua Aizenman. 2020. Accounting for Global COVID-19 Diffusion Patterns, January–April 2020. NBER Working Papers 27185. Cambridge, MA, USA: National Bureau of Economic Research. [Google Scholar] [CrossRef]
- Jones, Callum, Thomas Philippon, and Venky Venkateswaran. 2020. Optimal Mitigation Policies in a Pandemic: Social Distancing and Working from Home. NBER Working Papers 26984. Cambridge, MA, USA: National Bureau of Economic Research. [Google Scholar] [CrossRef]
- Kraemer, Moritz UG, Chia-Hung Yang, Bernardo Gutierrez, Chieh-Hsi Wu, Brennan Klein, David M. Pigott, Louis Du Plessis, Nuno R. Faria, Ruoran Li, William P. Hanage, and et al. 2020. The Effect of Human Mobility and Control Measures on the COVID-19 Epidemic in China. Science 368: 493–97. [Google Scholar] [CrossRef] [PubMed] [Green Version]
- Laing, Timothy. 2020. The Economic Impact of the Coronavirus 2019 (Covid-2019): Implications for the Mining Industry. The Extractive Industries and Society 7: 580–82. [Google Scholar] [CrossRef] [PubMed]
- Lau, J T F. 2003. Monitoring Community Responses to the SARS Epidemic in Hong Kong: From Day 10 to Day 62. Journal of Epidemiology & Community Health 57: 864–70. [Google Scholar] [CrossRef]
- Linka, Kevin, Mathias Peirlinck, Francisco Sahli Costabal, and Ellen Kuhl. 2020. Outbreak Dynamics of COVID-19 in Europe and the Effect of Travel Restrictions. Computer Methods in Biomechanics and Biomedical Engineering 23: 1–8. [Google Scholar] [CrossRef]
- Maier, Benjamin F., and Dirk Brockmann. 2020. Effective Containment Explains Subexponential Growth in Recent Confirmed COVID-19 Cases in China. Science 368: 742–46. [Google Scholar] [CrossRef] [Green Version]
- Mazzoleni, Stefano, Giuseppe Turchetti, and Nicolino Ambrosino. 2020. The COVID-19 Outbreak: From “Black Swan” to Global Challenges and Opportunities. Pulmonology 26: 117–18. [Google Scholar] [CrossRef]
- Ministry of Health of the Republic of Poland. 2020. Available online: https://twitter.com/MZ_GOV_PL (accessed on 31 July 2020).
- Morawska, Lidia, Julian W. Tang, William Bahnfleth, Philomena M. Bluyssen, Atze Boerstra, Giorgio Buonanno, Junji Cao, Stephanie Dancerh, Andres Flotoi, Francesco Franchimon, and et al. 2020. How Can Airborne Transmission of COVID-19 Indoors Be Minimised? Environment International 142: 105832. [Google Scholar] [CrossRef]
- Muller, Sebastian Alexander, Michael Balmer, Andreas Neumann, and Kai Nagel. 2020. Mobility Traces and Spreading of COVID-19. medRxiv. [Google Scholar] [CrossRef] [Green Version]
- Musselwhite, Charles, Erel Avineri, and Yusak Susilo. 2020. Editorial JTH 16 –The Coronavirus Disease COVID-19 and Implications for Transport and Health. Journal of Transport & Health 16: 100853. [Google Scholar] [CrossRef]
- Nicola, Maria, Zaid Alsafi, Catrin Sohrabi, Ahmed Kerwan, Ahmed Al-Jabir, Christos Iosifidis, Maliha Agha, and Riaz Agha. 2020. The Socio-Economic Implications of the Coronavirus Pandemic (COVID-19): A Review. International Journal of Surgery 78: 185–93. [Google Scholar] [CrossRef]
- Oztig, Lacin Idil, and Oykum Esra Askin. 2020. Human Mobility and Coronavirus Disease 2019 (COVID-19): A Negative Binomial Regression Analysis. Public Health 185: 364–67. [Google Scholar] [CrossRef] [PubMed]
- Peak, Corey M., Amy Wesolowski, Elisabeth zu Erbach-Schoenberg, Andrew J. Tatem, Erik Wetter, Xin Lu, Daniel Power, Elaine Weidman-Grunewald, Sergio Ramos, Simon Moritz, and et al. 2018. Population Mobility Reductions Associated with Travel Restrictions during the Ebola Epidemic in Sierra Leone: Use of Mobile Phone Data. International Journal of Epidemiology 47: 1562–70. [Google Scholar] [CrossRef] [PubMed]
- Pepe, Emanuele, Paolo Bajardi, Laetitia Gauvin, Filippo Privitera, Brennan Lake, Ciro Cattuto, and Michele Tizzoni. 2020. COVID-19 Outbreak Response, a Dataset to Assess Mobility Changes in Italy Following National Lockdown. Scientific Data 7: 230. [Google Scholar] [CrossRef]
- Pullano, Giulia, Eugenio Valdano, Nicola Scarpa, Stefania Rubrichi, and Vittoria Colizza. 2020. Population Mobility Reductions during COVID-19 Epidemic in France under Lockdown. medRxiv. [Google Scholar] [CrossRef]
- Queiroz, Lucas, Lucas Queiroz, José Luciano Melo, Gabriel Barboza, Alysson H. Urbanski, André Nicolau, Sergio Oliva, and Helder Nakaya. 2020. Large-Scale Assessment of Human Mobility during COVID-19 Outbreak. Open Science Framework Open Science Framework. Open Science Framework. [Google Scholar] [CrossRef]
- Ritchie, Hannah. 2020. Google Mobility Trends: How Has the Pandemic Changed the Movement of People around the World? Available online: https://ourworldindata.org/covid-mobility-trends (accessed on 31 July 2020).
- Schlosser, Frank, Benjamin F. Maier, David Hinrichs, Adrian Zachariae, and Dirk Brockmann. 2020. COVID-19 Lockdown Induces Structural Changes in Mobility Networks—Implication for Mitigating Disease Dynamics. arXiv arXiv:2007.01583. [Google Scholar]
- Service of the Republic of Poland. 2020. Available online: https://www.gov.pl/web/coronavirus (accessed on 31 July 2020).
- Statista. 2020. Available online: https://www.statista.com/statistics/1112658/poland-transport-of-passengers-during-covid-19-by-transport-type (accessed on 31 July 2020).
- Tian, Huaiyu, Yonghong Liu, Yidan Li, Chieh-Hsi Wu, Bin Chen, Moritz U. G. Kraemer, Bingying Li, Jun Cai, Bo Xu, Qiqi Yang, and et al. 2020. An Investigation of Transmission Control Measures during the First 50 Days of the COVID-19 Epidemic in China. Science 368: 638–42. [Google Scholar] [CrossRef] [Green Version]
- Tirachini, Alejandro, and Oded Cats. 2020. COVID-19 and Public Transportation: Current Assessment, Prospects, and Research Needs. Journal of Public Transportation 22: 1. [Google Scholar] [CrossRef]
- Troko, Joy, Puja Myles, Jack Gibson, Ahmed Hashim, Joanne Enstone, Susan Kingdon, Christopher Packham, Shahid Amin, Andrew Hayward, and Jonathan Nguyen Van-Tam. 2011. Is Public Transport a Risk Factor for Acute Respiratory Infection? BMC Infectious Diseases 11: 16. [Google Scholar] [CrossRef] [Green Version]
- Wang, Kuo-Ying. 2014. How Change of Public Transportation Usage Reveals Fear of the SARS Virus in a City. Edited by Volker Thiel. PLoS ONE 9: e89405. [Google Scholar] [CrossRef] [Green Version]
- Warren, Michael S., and Samuel W. Skillman. 2020. Mobility Changes in Response to COVID-19. arXiv arXiv:2003.14228. [Google Scholar]
- Wind, Tim R., Marleen Rijkeboer, Gerhard Andersson, and Heleen Riper. 2020. The COVID-19 Pandemic: The “Black Swan” for Mental Health Care and a Turning Point for e-Health. Internet Interventions 20: 100317. [Google Scholar] [CrossRef] [PubMed]
- Wu, Joseph T., Kathy Leung, and Gabriel M. Leung. 2020. Nowcasting and Forecasting the Potential Domestic and International Spread of the 2019-NCoV Outbreak Originating in Wuhan, China: A Modelling Study. The Lancet 395: 689–97. [Google Scholar] [CrossRef] [Green Version]
- Yap, Bee Wah, and Chiaw Hock Sim. 2011. Comparisons of Various Types of Normality Tests. Journal of Statistical Computation and Simulation 81: 2141–55. [Google Scholar] [CrossRef]
- Yilmazkuday, Hakan. 2020. Stay-at-Home Works to Fight against COVID-19: International Evidence from Google Mobility Data. SSRN Electronic Journal. [Google Scholar] [CrossRef]
- Yuksel, Mutlu, Yigit Aydede, and Francisko Begolli. 2020. Dynamics of Social Mobility during the COVID-19 Pandemic in Canada. IZA Discussion Paper No. 13376. Available online: https://ssrn.com/abstract=3631586 (accessed on 31 July 2020).
- Zheng, Ruizhi, Yu Xu, Weiqing Wang, Guang Ning, and Yufang Bi. 2020. Spatial Transmission of COVID-19 via Public and Private Transportation in China. Travel Medicine and Infectious Disease 34. [Google Scholar] [CrossRef] [PubMed]


| Description | Date |
|---|---|
| Global perspective | |
| Unpublished Chinese government report on first cases of a novel coronavirus infections. | 17 November 2019 |
| The first confirmed case of a novel coronavirus infection in Wuhan, China. | 8 December 2019 |
| The first confirmed cases of a novel coronavirus infection in Europe, Italy. | 23 January 2020 |
| WHO declares the novel coronavirus outbreak a Public Health Emergency of International Concern. | 30 January 2020 |
| The International Committee on Taxonomy of Viruses (ICTV) names a novel coronavirus: SARS-CoV-2. WHO announces an official name for the disease caused by the coronavirus: COVID-19. | 11 February 2020 |
| WHO announces that COVID-19 can be officially described as a pandemic. | 11 March 2020 |
| Poland | |
| The first laboratory-confirmed case of COVID-19, Lubusz voivodeship. | 4 March 2020 |
| Border controls and ban on mass events. | 10 March 2020 |
| The first reported COVID-19 death, Greater Poland. | 12 March 2020 |
| school closing, restrictions on internal movement | 12 March 2020 |
| The government announces an epidemic threat on the territory of Poland | 14 March 2020 |
| Restriction on functioning of selected institutions and workplaces, remote working obligation | 14 March 2020 |
| Suspension of international passenger air and rail connections, restrictions on cross-border movements | 15 March 2020 |
| The government announces epidemic in Poland. | 20 March 2020 |
| Restrictions on movement except commuting to work, essential matters of everyday life and volunteering in the fight against COVID-19. | 24 March 2020 |
| Maximal number of passengers on public transport (buses, trams, metro) equal half the number of seats. | 24 March 2020 |
| Restrictions on gathering, stay-at-home policy implementation | 31 March 2020 |
| Mandatory nose and mouth covering in public places | 16 April 2020 |
| The first stage of lifting restrictions related to COVID-19 (possibility of movement for recreational purposes, easing restrictions in trade and services). | 20 April 2020 |
| The second stage of lifting restrictions related to COVID-19 (opening of shopping centres, hypermarkets and hotels). | 4 May 2020 |
| The third stage of lifting restrictions related to COVID-19 (partial abolition of public transport restrictions to increase the number of passengers to 30% of all seats and standing places). | 18 May 2020 |
| The fourth stage (first part) of lifting restrictions related to COVID-19 (lifting the limits of people in shops, post offices, restaurants, and places of religious worship). | 30 May 2020 |
| Partial abolition of public transport restrictions to increase the number of passengers to 100% of seats or 50% of all seats and standing places, resumption of internal passenger flights. | 1 June 2020 |
| The fourth stage (second part) of lifting restrictions related to COVID-19 (full opening of hotels, swimming pools, fitness clubs, and places of culture, enabling gatherings up to 150 persons). | 6 June 2020 |
| Lifting restrictions on traffic at borders | 13 June 2020 |
| Resumption of international passenger flights. | 16 June 2020 |
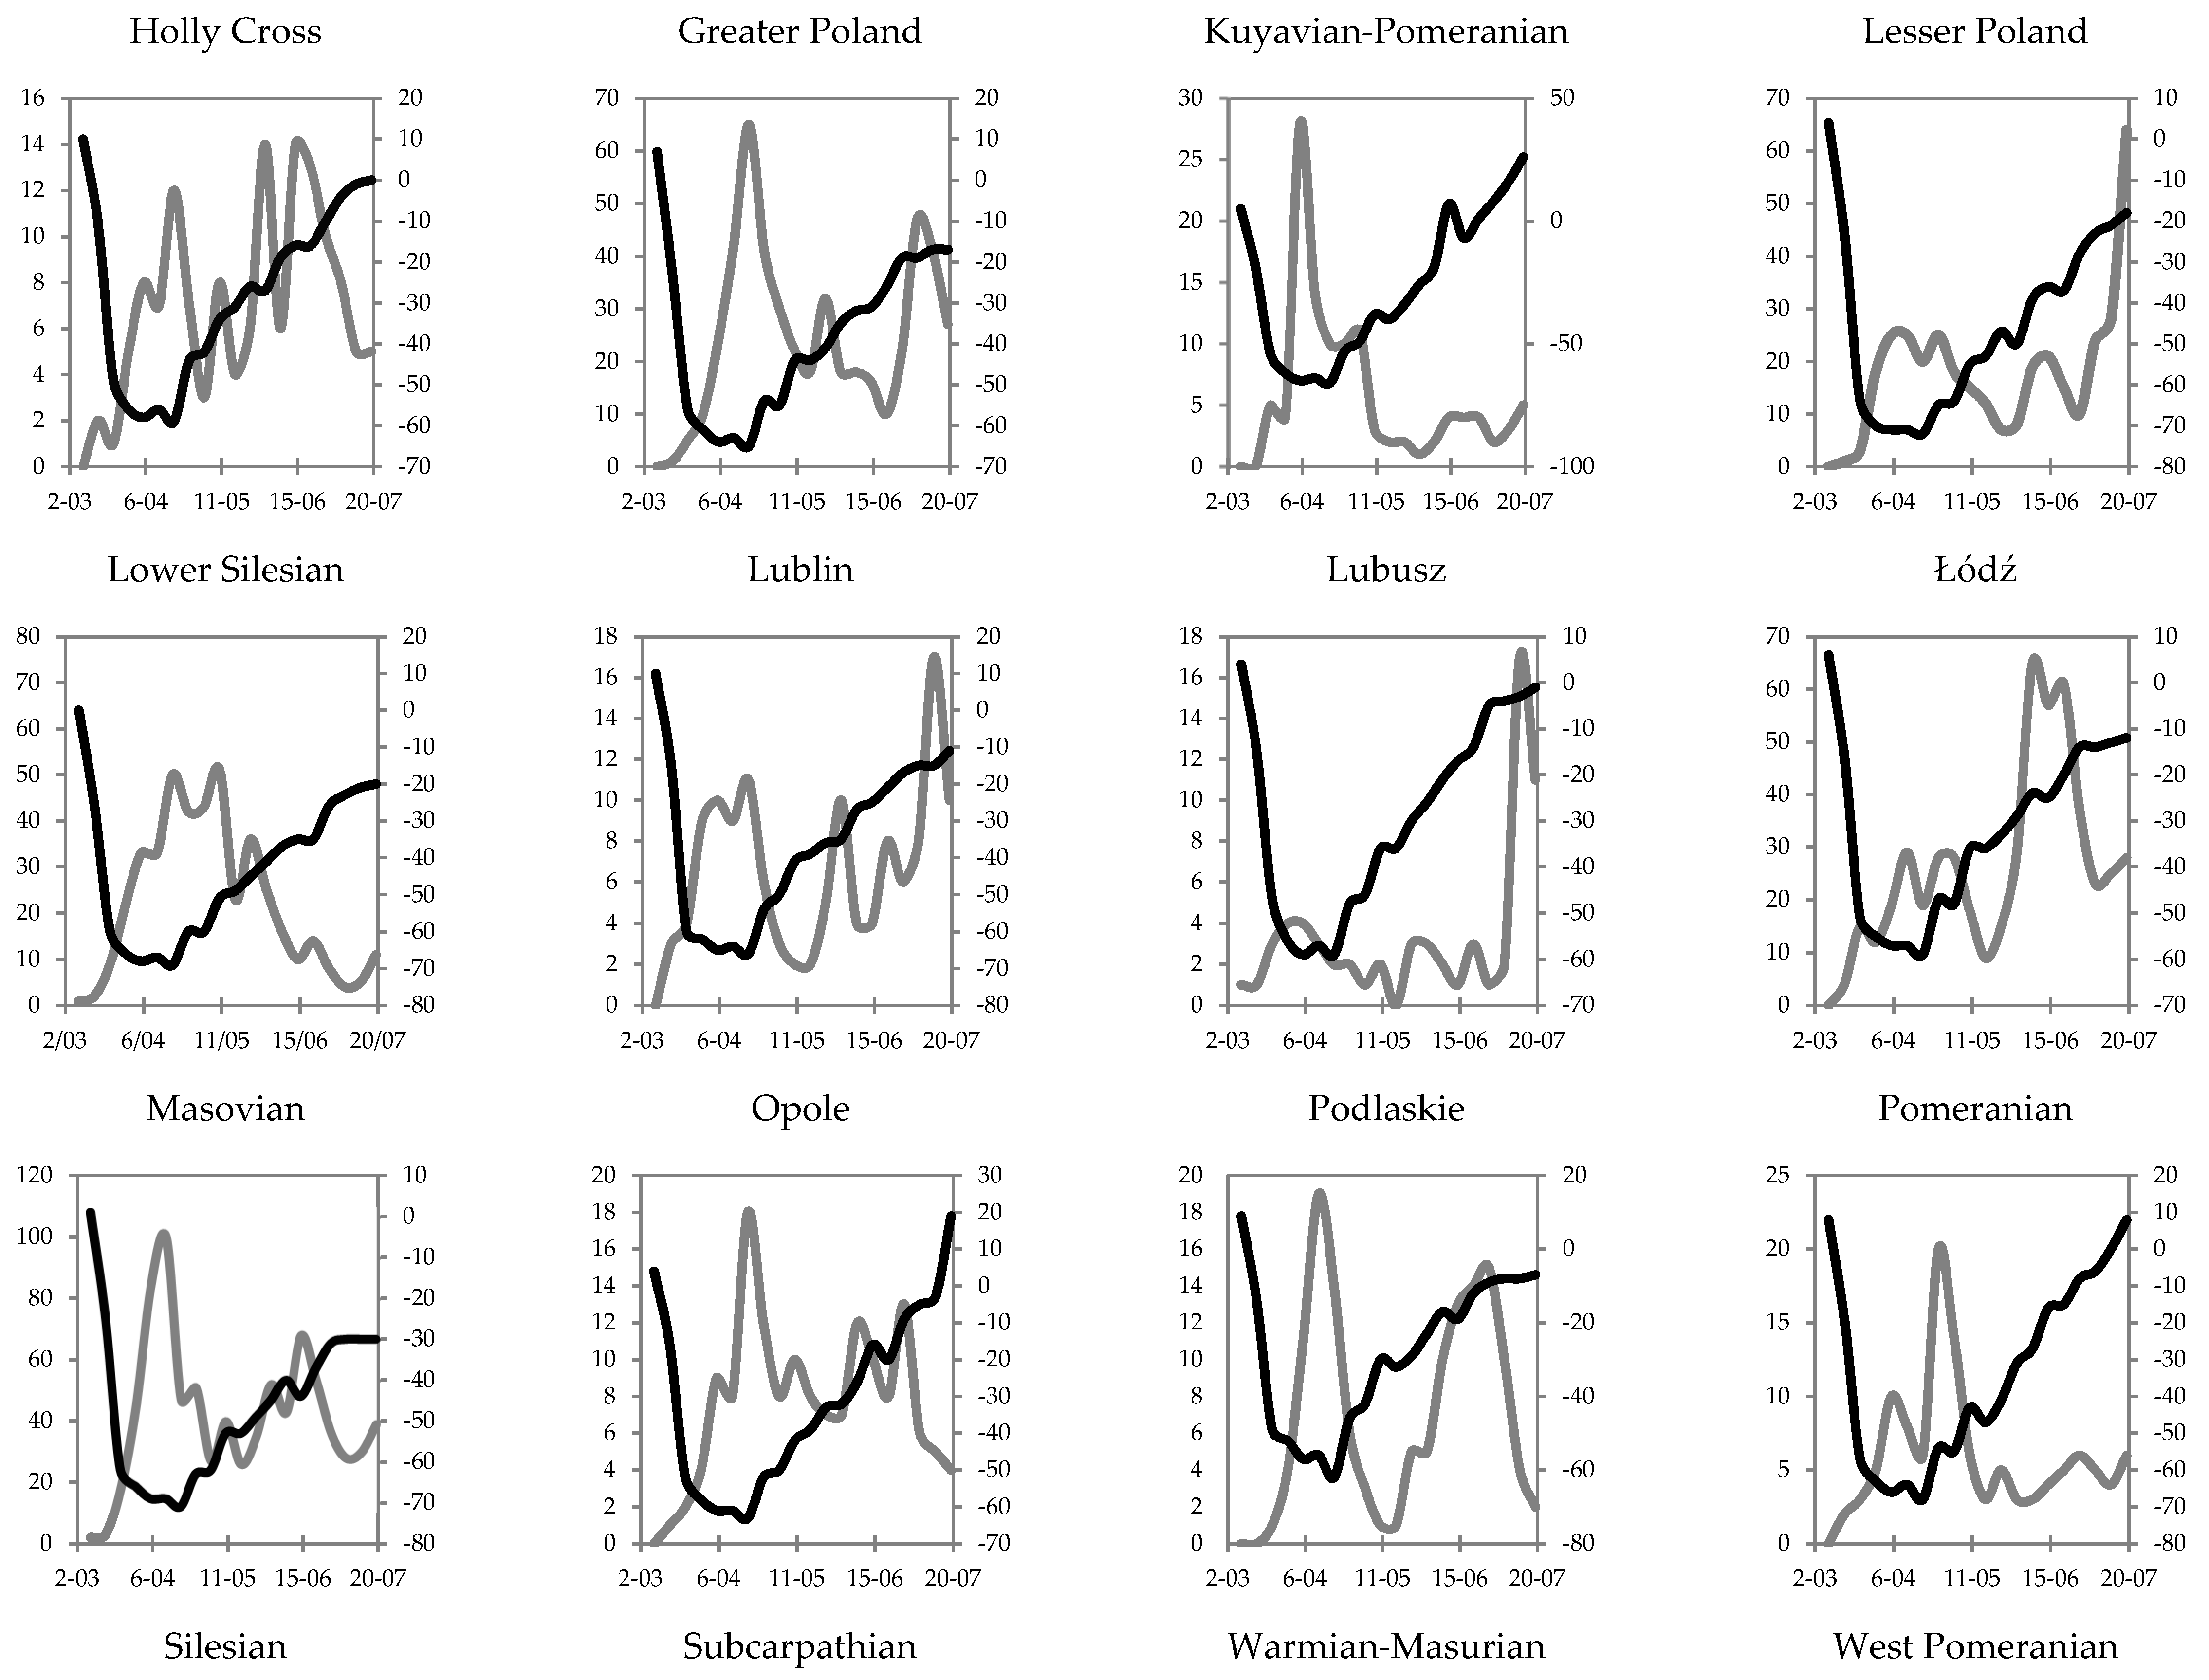
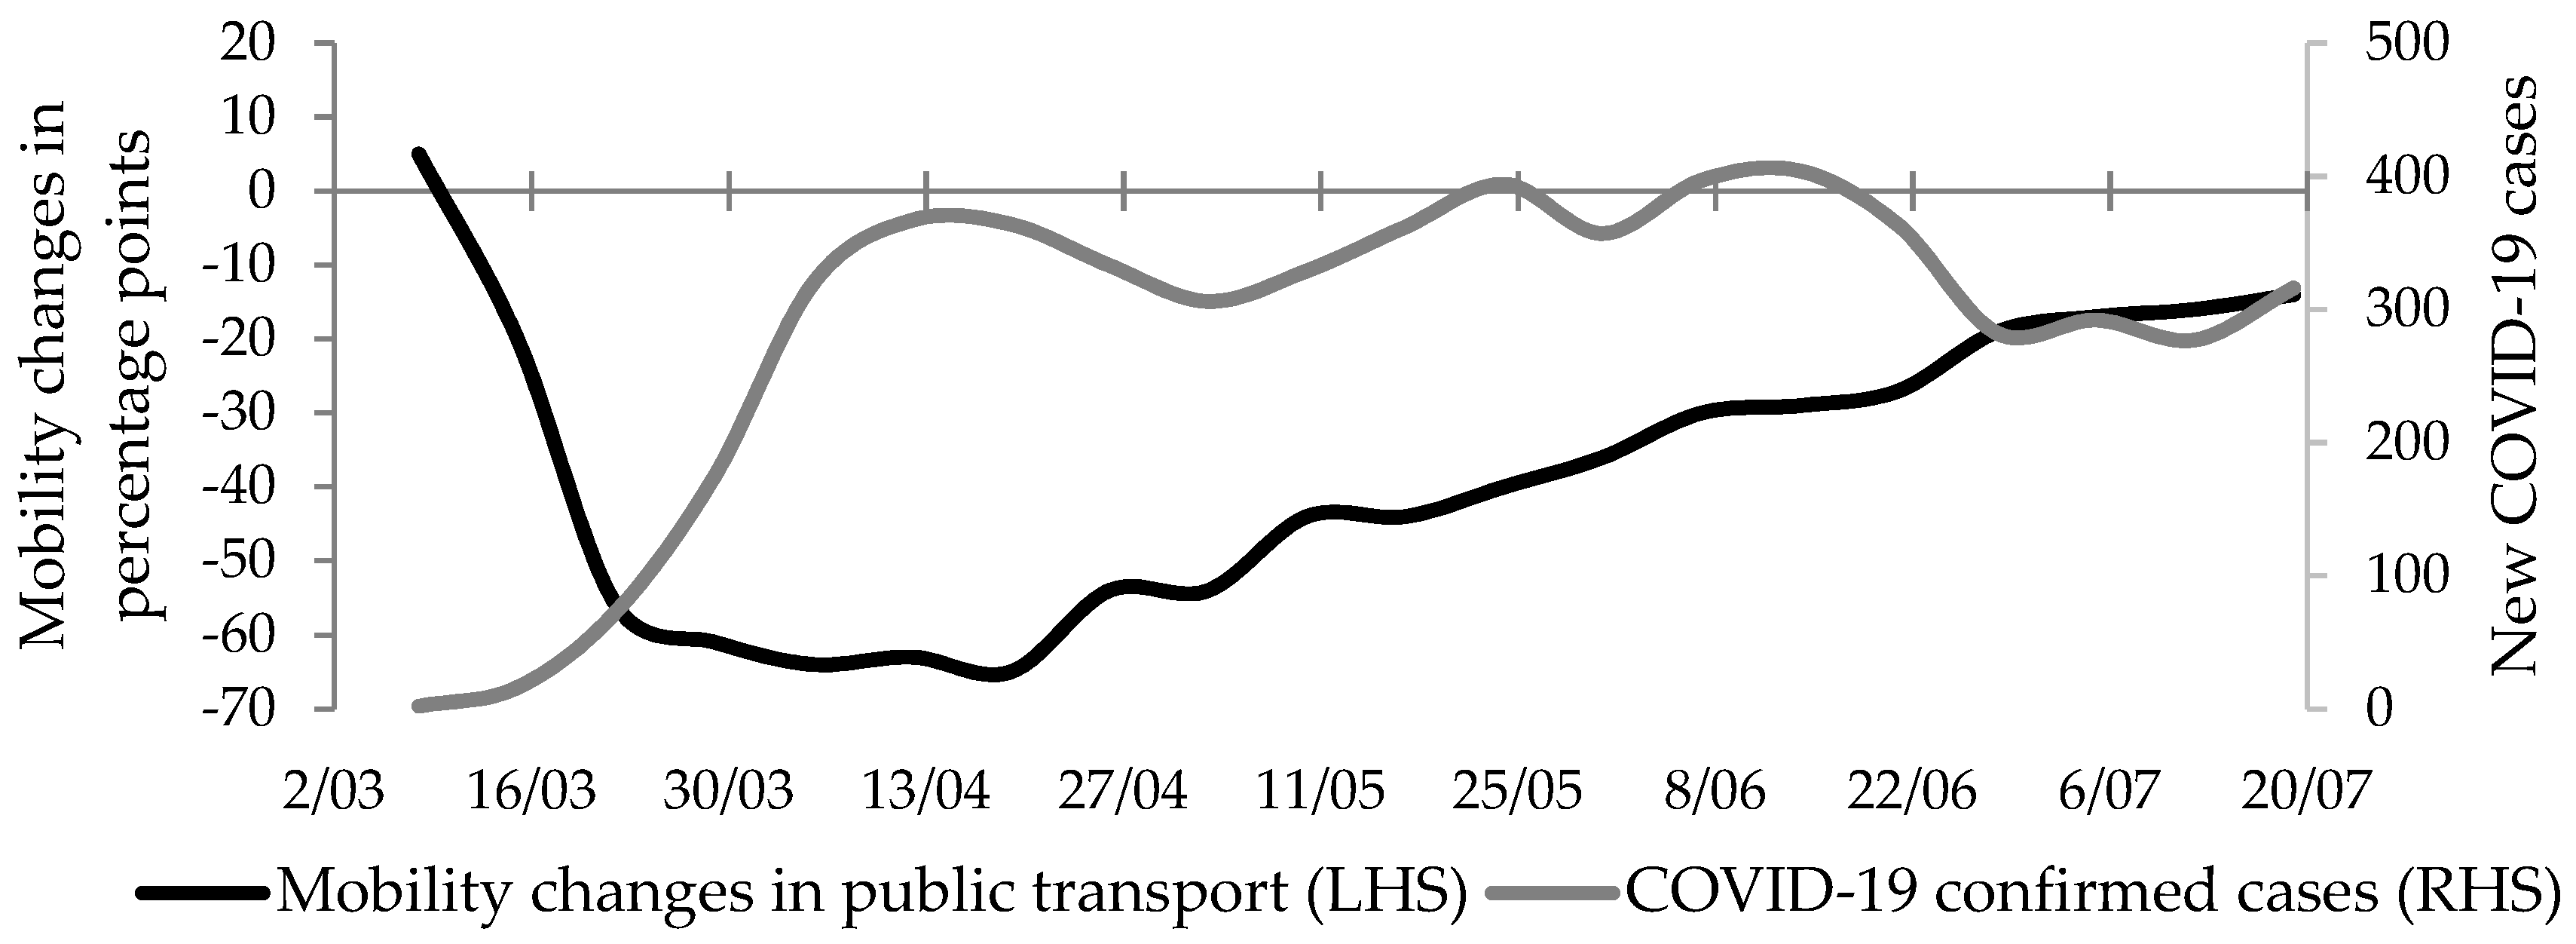
| Variable | Shapiro-Wilk Test Statistic | p-Value | Correlation Coefficient | p-Value |
|---|---|---|---|---|
| POLAND | 0.87 | 0.01 | −0.29 S | 0.21 |
| Greater Poland | 0.97 | 0.76 | −0.36 P | 0.15 |
| Holy Cross | 0.98 | 0.91 | −0.11 P | 0.64 |
| Kuyavian-Pomeranian | 0.75 | <0.001 | −0.50 S | 0.02 |
| Lesser Poland | 0.77 | <0.001 | −0.14 S | 0.55 |
| Lower Silesian | 0.97 | 0.84 | −0.76 P | <0.001 |
| Lublin | 0.89 | 0.03 | −0.24 S | 0.30 |
| Lubusz | 0.59 | <0.001 | −0.10 S | 0.66 |
| Łódź | 0.91 | 0.05 | 0.10 P | 0.67 |
| Masovian | 0.95 | 0.34 | −0.58 P | 0.01 |
| Opole | 0.98 | 0.94 | −0.39 P | 0.09 |
| Podlaskie | 0.97 | 0.85 | −0.22 P | 0.34 |
| Pomeranian | 0.80 | <0.001 | −0.45 S | 0.04 |
| Silesian | 0.92 | 0.08 | 0.10 P | 0.67 |
| Subcarpathian | 0.81 | 0.01 | 0.12 S | 0.61 |
| Warmian-Masurian | 0.96 | 0.58 | −0.30 P | 0.20 |
| West Pomeranian | 0,97 | 0.72 | −0.69 P | <0.001 |
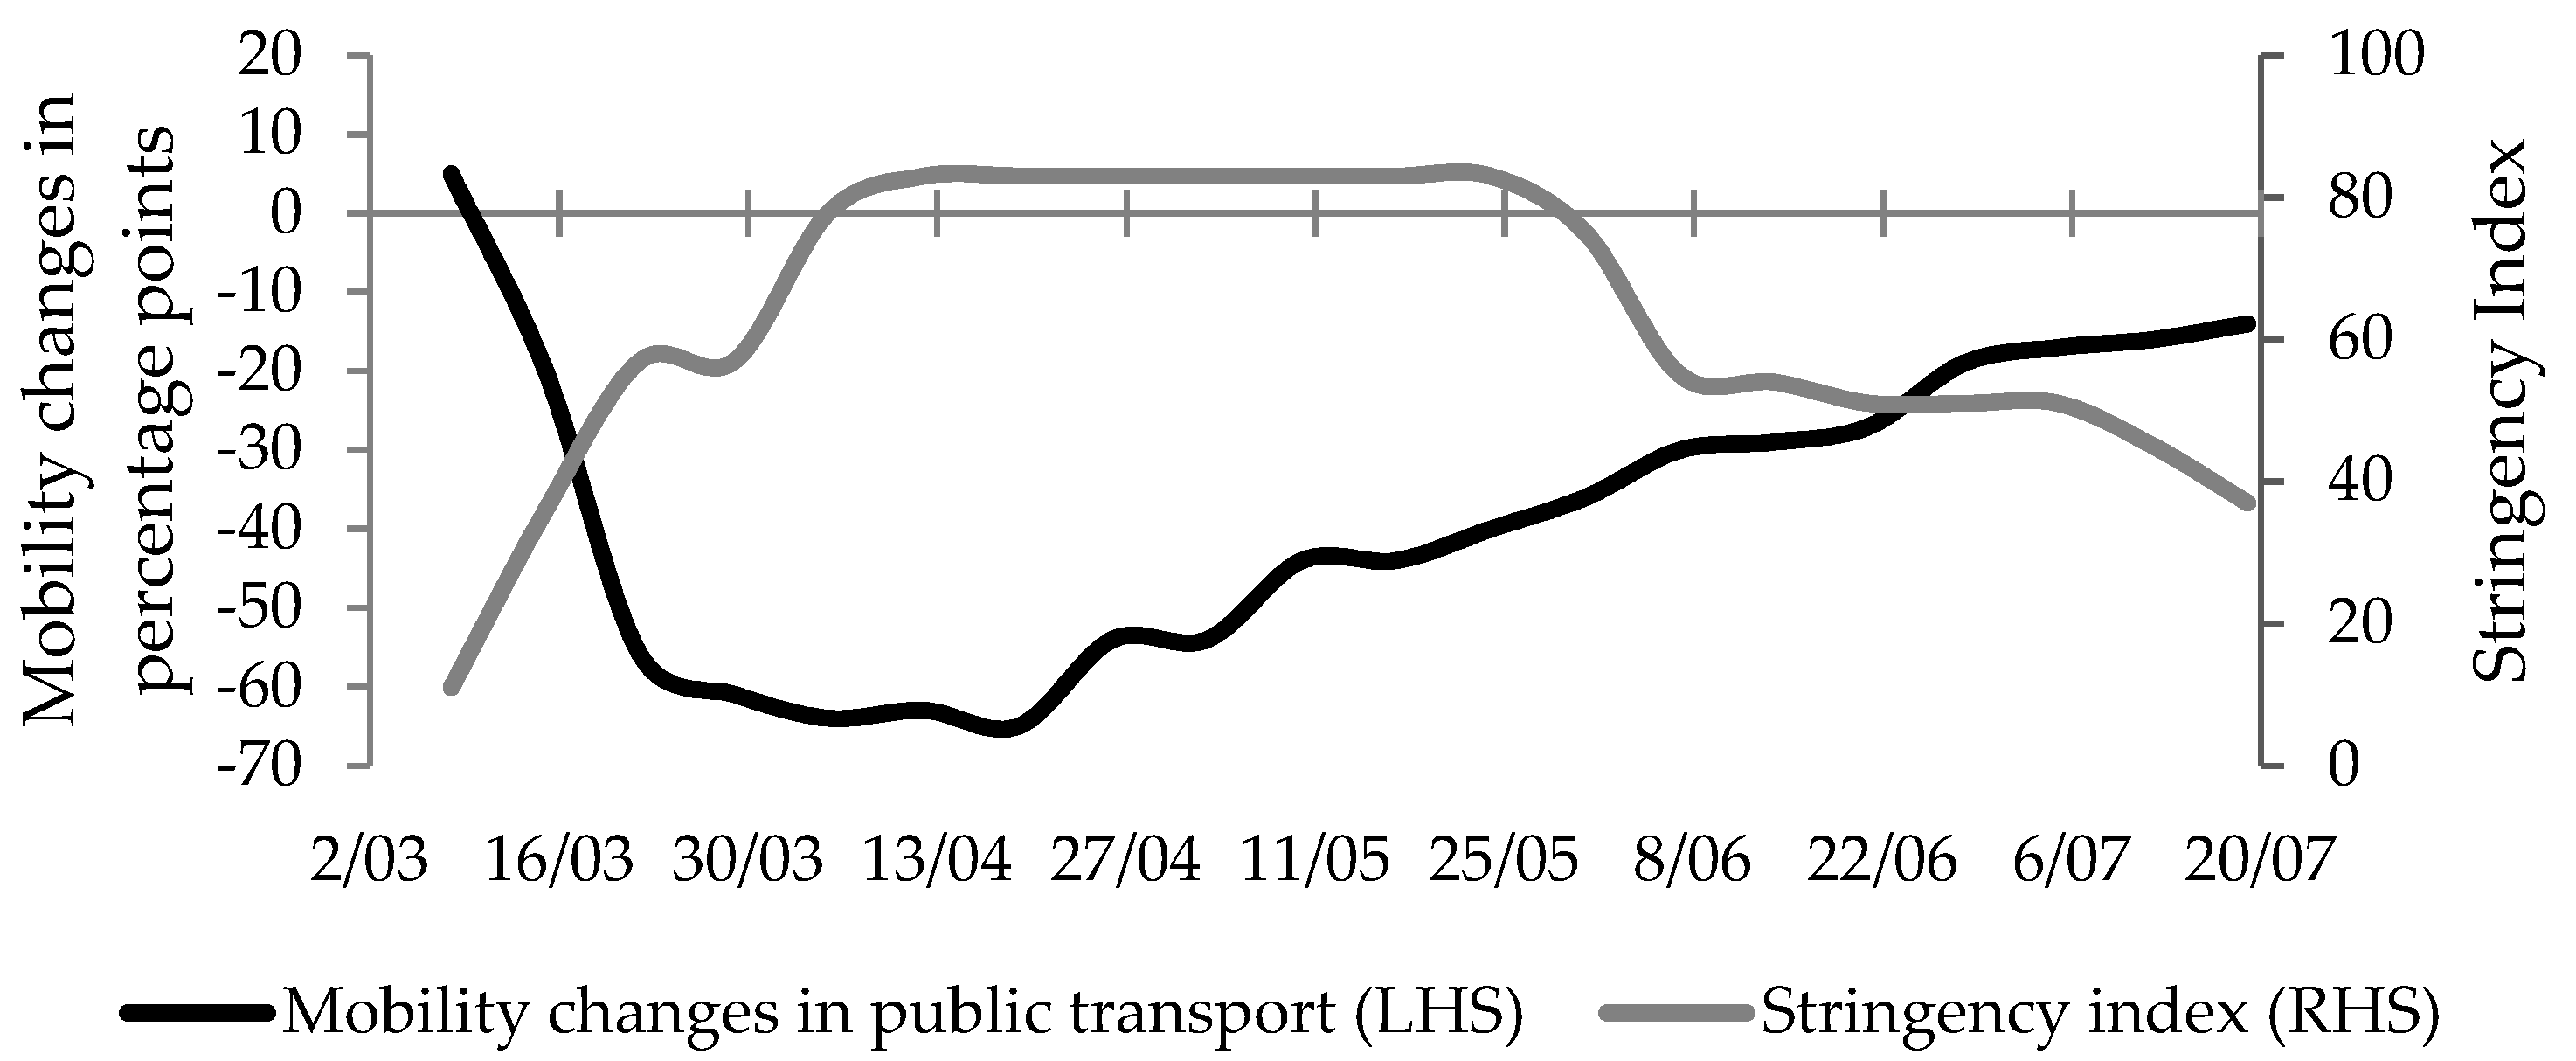
| Variable | Shapiro-Wilk Test Statistic | p-Value | Correlation Coefficient | p-Value |
|---|---|---|---|---|
| POLAND | 0.89 | 0.02 | −0.84 S | <0.001 |
| Greater Poland | 0.91 | 0.06 | −0.83 P | <0.001 |
| Holy Cross | 0.88 | 0.02 | −0.84 S | <0.001 |
| Kuyavian-Pomeranian | 0.92 | 0.08 | −0.74 P | <0.001 |
| Lesser Poland | 0.91 | 0.08 | −0.85 P | <0.001 |
| Lower Silesian | 0.90 | 0.04 | −0.86 S | <0.001 |
| Lublin | 0.89 | 0.03 | −0.85 S | <0.001 |
| Lubusz | 0.91 | 0.07 | −0.78 P | <0.001 |
| Łódź | 0.89 | 0.03 | −0.84 S | <0.001 |
| Masovian | 0.92 | 0.11 | −0.85 P | <0.001 |
| Opole | 0.92 | 0.10 | −0.79 P | <0.001 |
| Podlaskie | 0.87 | 0.01 | −0.83 S | <0.001 |
| Pomeranian | 0.90 | 0.04 | −0.82 S | <0.001 |
| Silesian | 0.87 | 0.01 | −0.82 S | <0.001 |
| Subcarpathian | 0.87 | 0.01 | −0.84 S | <0.001 |
| Warmian-Masurian | 0.91 | 0.07 | −0.72 P | <0.001 |
| West Pomeranian | 0.92 | 0.10 | −0.75 P | <0.001 |
| Region | F Statistics | p-Value |
|---|---|---|
| POLAND | 84.72 | <0.001 |
| Greater Poland | 84.18 | <0.001 |
| Holy Cross | 65.19 | <0.001 |
| Kuyavian-Pomeranian | 62.87 | <0.001 |
| Lesser Poland | 105.2 | <0.001 |
| Lower Silesian | 92.78 | <0.001 |
| Lublin | 69.47 | <0.001 |
| Lubusz | 72.01 | <0.001 |
| Łódź | 64.88 | <0.001 |
| Masovian | 92.88 | <0.001 |
| Opole | 70.08 | <0.001 |
| Podlaskie | 61.07 | <0.001 |
| Pomeranian | 95.07 | <0.001 |
| Silesian | 59.26 | <0.001 |
| Subcarpathian | 76.20 | <0.001 |
| Warmian-Masurian | 60.56 | <0.001 |
| West Pomeranian | 68.81 | <0.001 |
© 2020 by the authors. Licensee MDPI, Basel, Switzerland. This article is an open access article distributed under the terms and conditions of the Creative Commons Attribution (CC BY) license (http://creativecommons.org/licenses/by/4.0/).
Share and Cite
Wielechowski, M.; Czech, K.; Grzęda, Ł. Decline in Mobility: Public Transport in Poland in the time of the COVID-19 Pandemic. Economies 2020, 8, 78. https://doi.org/10.3390/economies8040078
Wielechowski M, Czech K, Grzęda Ł. Decline in Mobility: Public Transport in Poland in the time of the COVID-19 Pandemic. Economies. 2020; 8(4):78. https://doi.org/10.3390/economies8040078
Chicago/Turabian StyleWielechowski, Michał, Katarzyna Czech, and Łukasz Grzęda. 2020. "Decline in Mobility: Public Transport in Poland in the time of the COVID-19 Pandemic" Economies 8, no. 4: 78. https://doi.org/10.3390/economies8040078