1. Introduction
On November 2, 2010, Georgia voters went to the polls to elect state and federal officeholders and to cast ballots on several proposed constitutional amendments. One amendment, known as the Georgia Trauma Care Funding Amendment, called for amending the state constitution to add USD 10 to the motor vehicle registration fee and earmarked the proceeds for trauma center funding.
1 Hence, this amendment, which was defeated by about five percentage points, was an instance of direct voting on the provision of a quasi-public good. As is well known, collective provision of goods and services is potentially susceptible to collective action problems such as free-riding and rent-seeking (
Olson 1965;
Tullock 1967). This paper analyzes voter support for the amendment across Georgia’s 159 counties and finds evidence consistent with election results being driven by free-riding and rent-seeking.
This paper analyzes voter support for the amendment across Georgia’s 159 counties and finds evidence consistent with election results being driven by free-riding and rent-seeking. The free-riding is by Georgia voters near bordering states voting against the referendum, attempting to free ride on existing trauma centers in nearby states, paid for by residents of other states. The rent-seeking is by Georgia voters with existing trauma centers near them in Georgia, who are currently funding trauma centers with local taxes but would prefer a statewide tax to lower their own fiscal burden.
Determinants of voting on individual initiatives and referenda have been the subject of much previous research.
Kahn and Matsusaka (
1997) examing patterns on 16 California environmental ballot propositions and find that income is positively related to voter support, thereby inferring that environmental quality is a normal good.
Schroeder and Sjoquist (
1978) find that economic self-interest is a strong predictor of voting on two transit referenda in Atlanta. By contrast,
Shabman and Stephenson (
1994) argue that self-interested voting is insufficient to explain the passage a flood control referendum in Roanoke, Virginia. Examining expressive voting rather than instrumental voting,
Feigenbaum et al. (
1988) analyze voting on 1982’s Nuclear Freeze Referendum, which had no policy consequences beyond moral suasion. Similarly,
Karahan and Shughart II (
2004) examing on a Mississippi referendum to change the state flag away from one containing Confederate symbols.
To date, however, there appears to be little consideration of collective action problems such as free-riding and special interest rent-seeking in the direct democracy literature, especially with regard to healthcare issues. Several papers do address spillover effects where the provision of collective goods in another locality influence the outcome of a referendum vote on other issues. For example,
Isen (
2014) examines local referenda in Ohio on bond and tax issues, finding no evidence of spillovers to nearby jurisdictions. Furthermore,
Lang et al. (
2018) also find no spillover effects from municipal land conservation policy in Massachusetts and New Jersey. However, these and other papers differ from ours because they focus on geographical competition for residents as the possible mechanism for spillovers, not free-riding and rent-seeking, which seem unlikely for these publicly provided goods.
Several other papers have looked at referenda related to healthcare issues, though they did not examine any spillovers or free-riding.
Fort and Christianson (
1981) analyze referenda held to enhance hospitals in rural areas of the Plains and the Intermountain West and find that hospital employment has no systematic relationship with support for the referenda. A positive relationship might have been expected if the hospital employees expected to acquire benefits from the referenda that they could not obtain via the marketplace.
Costa (
2018) documents a significantly negative relationship between the share of physicians in a county and the county voters’ support for a state-provided health insurance scheme but concludes that the opposition of interest groups such as doctors was insufficient to explain the referendum’s defeat. (Presumably, physicians opposed the measure because their practices would have become less profitable.) Indeed, regarding the use of direct democracy to benefit special interests,
Matsusaka (
2005, p. 200) concludes “the evidence generally shows that direct democracy serves the many and not the few.”
2 An interesting historical example of direct democracy and free riding comes from ancient Athens, where
Kyriazis and Zouboulakis (
2004) argue that the trierarchy system was a way to overcome the free rider problem by taxing individuals roughly in proportion to their benefit from national defense.
3This paper contributes to the literature on referendums by highlighting a situation where rent-seeking and free-riding behavior seem to have influenced a ballot measure’s outcome. We find that Georgia border counties adjoining out-of-state counties with trauma centers were less likely to vote for the Georgia Trauma Care Amendment. This pattern is consistent with residents of these counties free-riding off the provision of trauma care services by taxpayers in neighboring states. We also find that counties with pre-existing trauma centers were, ceteris paribus, more likely to vote for the amendment. This finding could be interpreted rent-seeking if voters in counties with trauma centers sought to replace local funding for trauma centers with statewide funding.
2. Empirical Model and Data
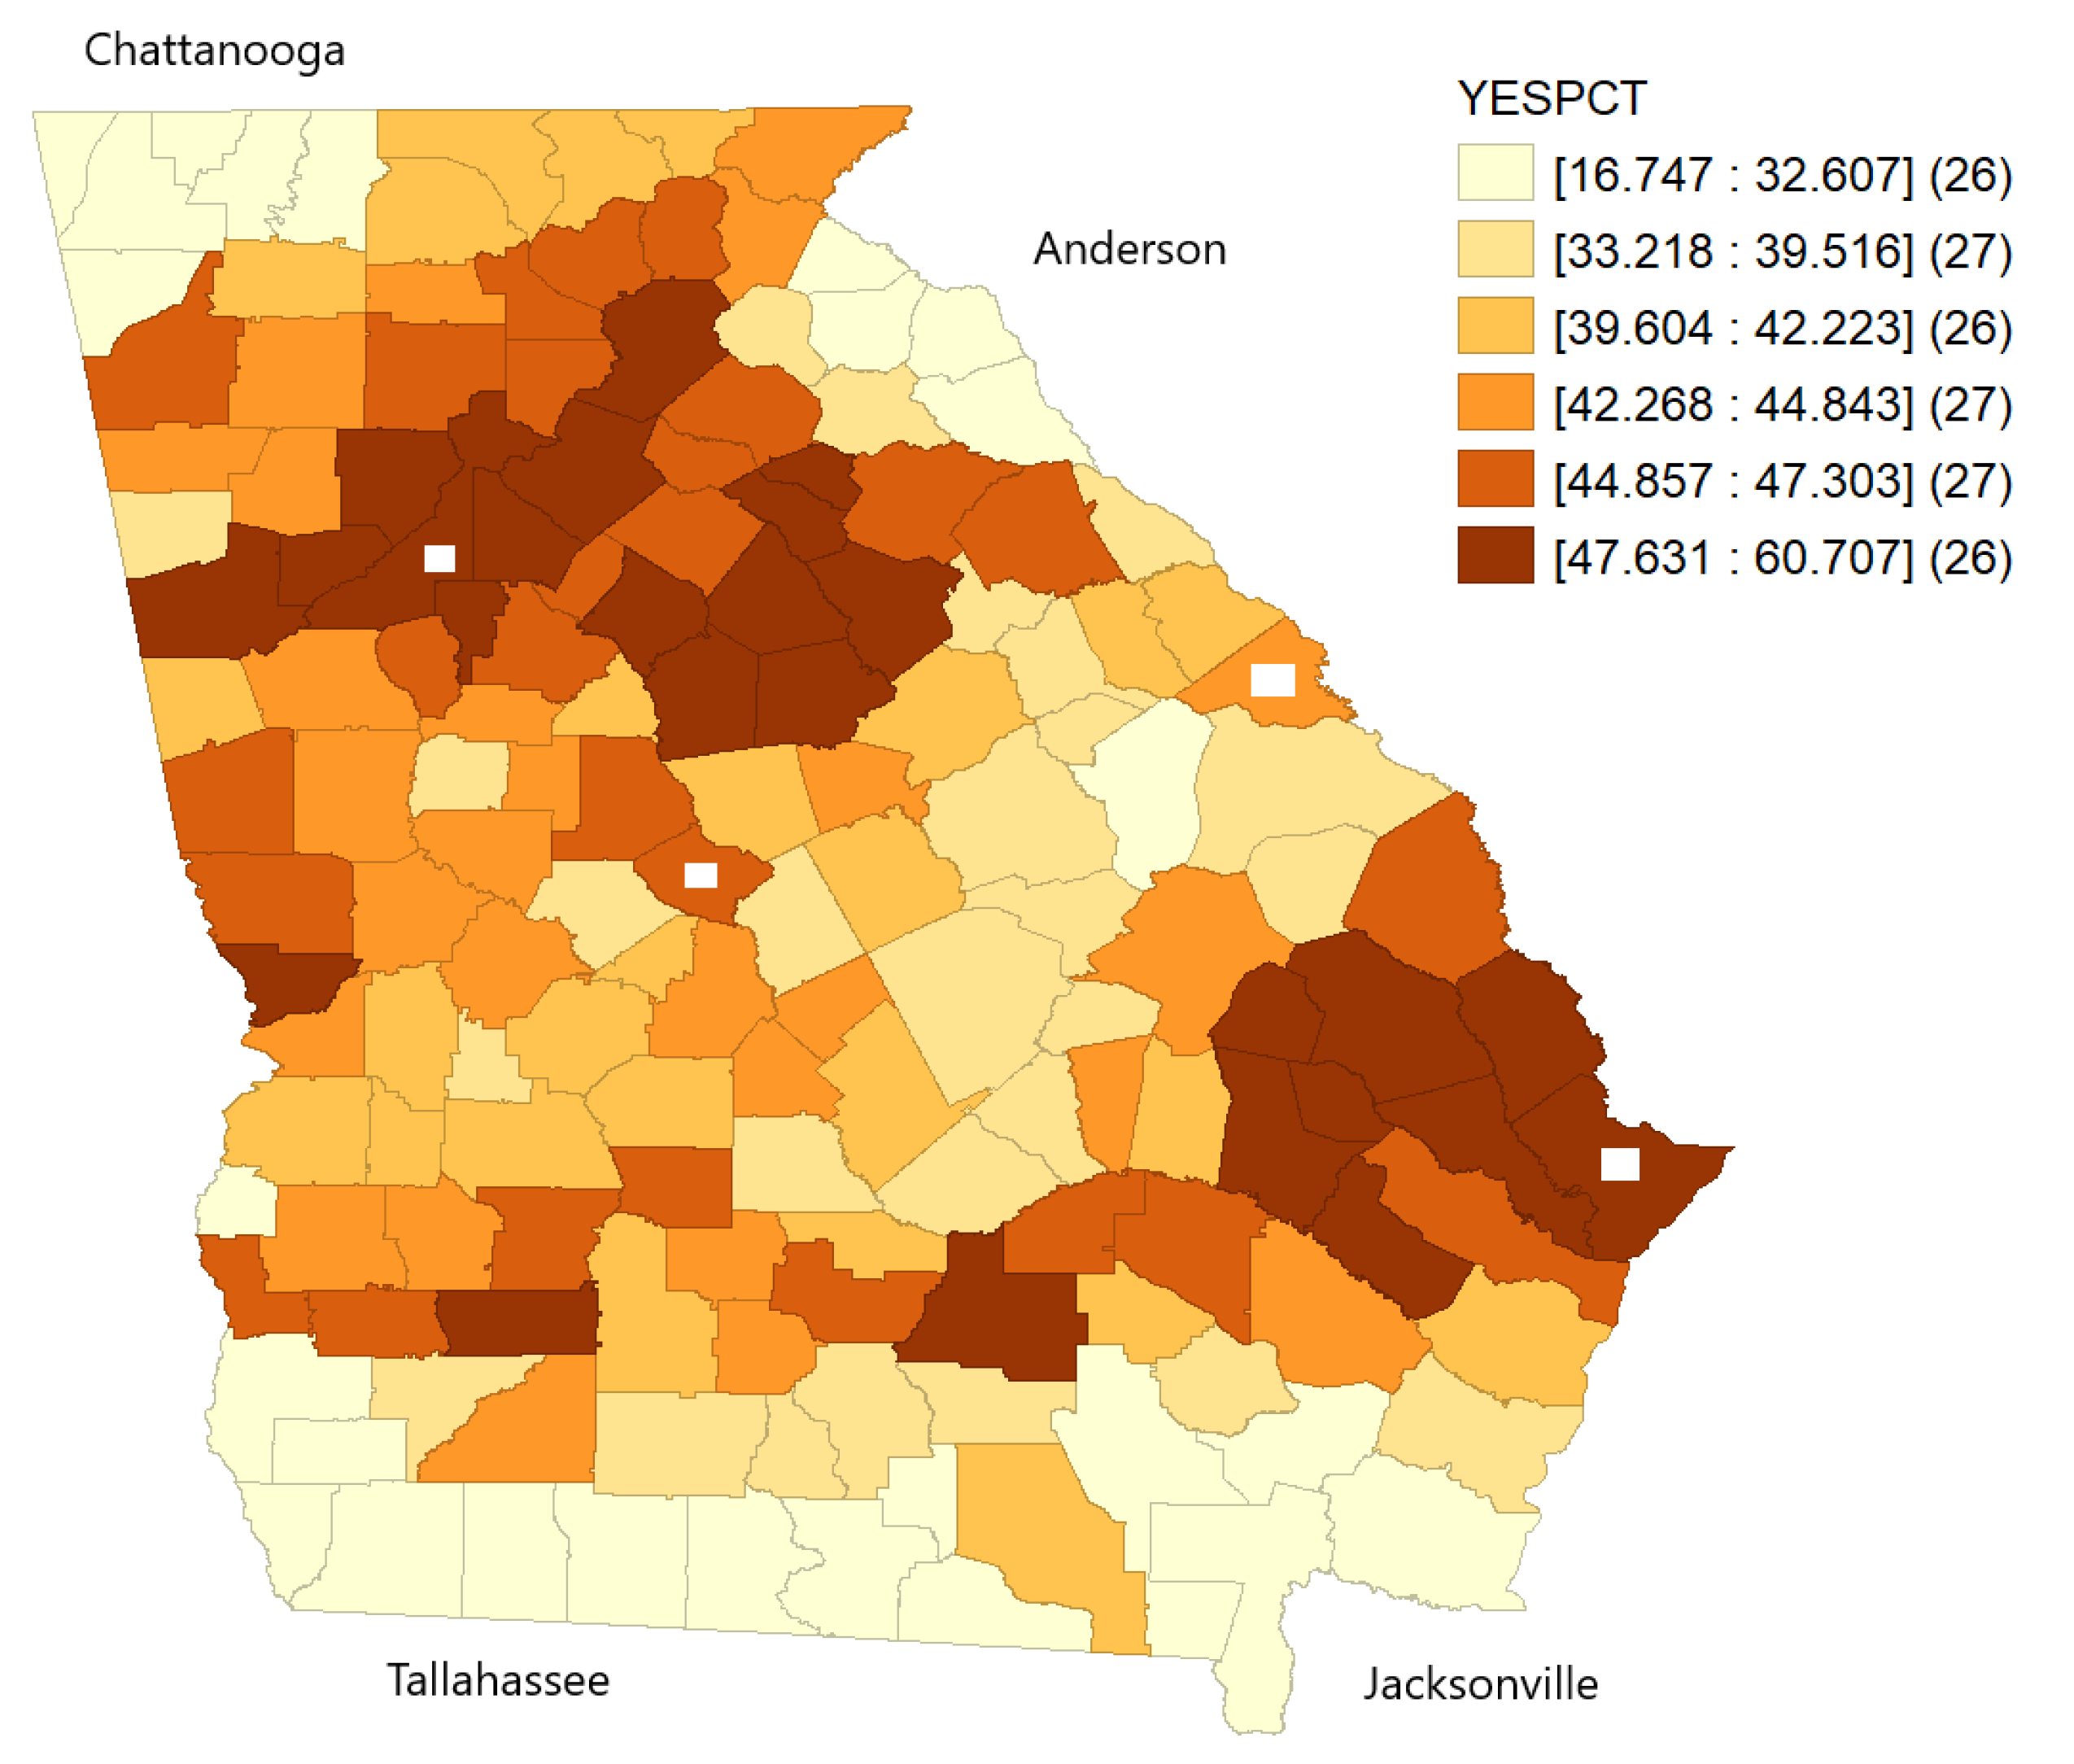
Georgia’s November 2010 trauma tax referendum lost by a 52.6% to 47.4% margin, but the support for it varied widely across the state’s 159 counties.
Figure 1 maps the support by counties with darker red colors indicating higher percentages of voters supporting the referendum. The most support was 60.7% in Chatham County (Savannah) while the least support was the 16.75% favorable votes cast in northwest Georgia’s Dade County.
Inspection of
Figure 1 reveals several patterns in the support across Georgia’s counties for the trauma tax referendum. Although referendum proponents’ public appeals were based on large areas of rural southern Georgia being located large distances from trauma centers, voters in areas with trauma centers such as Atlanta, Macon, and Savannah were more supportive of the referendum than voters in remote parts of the state. Another pattern is the poor support for the referendum in counties located along borders with other states. This pattern appears in northwest Georgia (near Chattanooga), in northeast Georgia (across the Savannah River from South Carolina), and in the southern Georgia counties located along the border with Florida. These areas are located near out-of-state trauma centers. By contrast, border counties such as Heard (in west Georgia), Towns (in north Georgia), and Burke (in east Georgia) which are not located near cross-border trauma centers show no such dampening of support for the referendum. It is these two patterns—the popularity in areas already served by trauma centers and the lack of support in certain, but not all, border regions—that motivate this paper’s examination of collective action problems in a direct democracy context.
We posit the following multiple regression model to explain the pattern of support across counties:
where
YESPCT is the percentage of voters supporting the referendum in each county.
4 Descriptive statistics for
YESPCT and all other variables are reported in
Table 1.
TRAUMA is a dummy variable taking a value of one for counties with existing trauma centers. The sign of this variable is unclear a priori (though, as noted earlier,
Figure 1 suggests it will be positive). If counties without trauma care are more likely to favor the referendum because they lack trauma care, then the coefficient on TRAUMA should be negative. On the other hand, trauma centers might be burdensome to local taxpayers if their services are not fully covered by patients or their insurers. For example, Atlanta’s Grady Hospital reportedly requires costly support from local taxpayers. To some extent, then, a positive coefficient could arise from voters trying to shift the tax burden of their local trauma centers from local taxpayers to taxpayers statewide. Moreover, a positive relationship between TRAUMA and YESPCT could also arise because trauma centers and affiliated hospitals are large employers. Trauma hospital workers might expect the trauma tax to increase compensation for their services thereby making them inclined to support the referendum. It is interesting to note, in the context of possible rent seeking, that there was a strong television and newspaper advertising campaign (known as YES 2 SAVE LIVES) urging voters to support the referendum. Most of the existing trauma centers were sponsors of the campaign, and other sponsors included groups such as EMTs, air ambulance services, and emergency physicians that might expect increased demand for their services upon passage of the referendum. There was not, to our knowledge, an organized campaign against the referendum.
HOSPITAL is a dummy variable taking a value of one for counties with hospitals that are not trauma centers. This variable should have a positive relationship with YESPCT if voters in counties with non-trauma hospitals anticipate that the trauma tax would lead to upgraded emergency medical services in their counties. Next, the model includes three dummy variables (ANDERSON, CHATTANOOGA, and FLORIDA) taking values of one for counties in particular parts of the state. As noted earlier,
Figure 1 suggests that voters in northwest Georgia (near Chattanooga), in northeast Georgia (near Anderson SC), and in southern Georgia (along the border with Florida) tended to have weak support for the trauma tax referendum. These Georgia counties are all served by out of state trauma centers (two of Florida’s facilities are located in Jacksonville and Tallahassee); hence, voters in these counties might have expected the referendum to provide them little benefit. In effect, these voters might have been unwilling to pay the fee for enhanced trauma services in Georgia because they could free ride on the trauma services provided in neighboring states. Such a relationship would be another manifestation of a collective action problem in this direct democracy context.
We also include two variables that might capture costs and benefits associated with the trauma tax proposal. MVREG is the number of motor vehicles registered per capita in each county. This variable is constructed using motor vehicle registration and population data obtained from the Georgia County Guide. Ceteris paribus, the trauma tax would be more costly to voters in counties with more vehicles per capita. Since the tax applies per vehicle, the number of vehicles per capita acts as the price for the quasi-public goods that would be provided under the referendum. Hence, a negative relationship between MVREG and YESPCT is anticipated.
On the other hand, INTERSTATE, a dummy variable taking a value of one for counties traversed by an interstate highway, should capture some of the benefit of having upgraded trauma care. Interstate highways have high traffic volumes and occasionally have horrific crashes. Hence, the presence of an interstate highway would suggest a larger benefit from enhancing a county’s trauma services so a positive relationship between CRASH and YESPCT might be expected. However, this expectation might be dampened to the (presumably large) extent that interstate highway crashes affect people living outside of a county rather than the county’s voters.
We also include a vector (CONTROLS) containing several political and socioeconomic variables. The inclusion of political and socioeconomic control variables is standard in the empirical median voter literature (
Bovay and Sumner 2019;
Hawkins and Chia-Yuan 2018;
Khurana et al. 2020;
Reed et al. 2019;
VanCeylon et al. 2020). In addition to the trauma tax vote and other referenda, Georgians also elected a new governor on November 2, 2010. The variables DEMOCRAT and LIBERTARIAN are, respectively, the share of votes in each county going to the Democrat and Libertarian candidates; the share of voters favoring the Republican gubernatorial candidate is the category omitted to avoid multicollinearity. The party preference variables are included to control for ideological differences in voters across counties. It is expected that a larger share of a county’s voters who prefer the Democrat candidate for governor would be associated with more support for the referendum. It is unclear ex ante whether Libertarian voters are more or less likely than Republicans, the omitted reference group, to support the trauma tax.
The socioeconomic variables include per capita income (in 1000s) (INCOME), the poverty rate (POVERTY), the percentage of the population that is black (BLACK), the percentage of the population that is Hispanic (HISPANIC), the percentage of the population that has a bachelors degree (BA), and the percentage of the population that is 65 or older (OVER65). Because there are some potential multicollinearity issues (e.g., the correlation between the Democrat vote share and the black population share is over 0.90), the estimation is performed first with only the political control variables, second with only the demographic control variables, and lastly with both the political ideology controls and the demographic controls.
3. Results
Ordinary Least Squares (OLS) estimation results are presented in
Table 2. The regional dummy variables all have negative coefficients and are significantly different from zero. Other things equal, the northwest Georgia counties located near Chattanooga’s Erlanger trauma center had 20–25 percentage points fewer voters supporting the referendum depending on specification.
There is also a strong negative effect for counties near the Florida border and the counties near Anderson, SC, though the magnitudes are somewhat smaller (10–15 percentage points) than in the counties near Chattanooga. These results strongly suggest that voters in these border counties were motivated to vote against the referendum because of the availability of trauma services in the neighboring states.
The coefficient on TRAUMA indicates that counties with trauma centers had, ceteris paribus, 4.5 to 6.9 percentage points more support for the ballot measure than did counties without trauma centers, depending on specification. This finding suggests that local taxpayer relief or trauma employee rent-seeking was more salient with voters in trauma center counties than the possibility of improved trauma services was to voters in counties lacking trauma centers. The estimated coefficient on HOSPITAL is also positive, but it is smaller (1.3 to 2 percentage points) and is statistically significant in only two of the specifications. Having a non-trauma hospital apparently had less effect in inducing voters to support the referendum than having an existing trauma center. The control variables generally have small and statistically insignificant coefficient estimates. The notable exceptions are the percentage of people with bachelor’s degrees, the black population share, and the percentage who voted Libertarian, which are all positively related to YESPCT.
4. Robustness Checks
We turn now to three robustness checks. First, we repeat the estimation with the border dummies (ANDERSON2, CHATTANOOGA2, and FLORIDA2) defined more broadly; for example FLORIDA2 is defined to include the second row of counties across southern Georgia whereas FLORIDA took a value of one for the border counties only. We include all variables contained in
Table 2 but report only the coefficients on our primary variables of interest. These results are reported in
Table 3 and are similar to those reported in
Table 2. The primary exception is that the estimated coefficient on HOSPITAL is considerably smaller and no longer statistically significant in any specification.
Second, we estimate the model using [YESPCT/(100-YESPCT)] as the dependent variable so that the dependent variable is not confined to the range [0, 100]. Results are reported in
Table 4 and are similar in sign to the baseline results from
Table 2.
Third, we estimate the model with the TRAUMA and the border area dummy variables replaced by a dummy taking a value of one if the nearest center is out of state, a variable measuring a county’s distance from the nearest trauma center (in state or out of state), and an interaction term between the distance and out of state variables. These results are presented in
Table 5. This approach also yields results consistent with rent-seeking and free-riding.
The free-riding effect is evident in this framework because the dummy indicating that the nearest trauma center is out of state has a negative coefficient (-32 to -35 percentage points depending on specification) and is statistically significant. The rent-seeking aspect is supported by the negative relationship between a county’s distance from the closest trauma center; if enhancing services for underserved areas motivated voters then one would expect more support for the referendum to increase as counties become more distant from the existing trauma centers. The interaction term indicates that if a county’s nearest trauma center is out of state free-riding exists, but is mitigated the farther away the trauma center is.
5 5. Conclusions
Collective action problems such as free-riding and rent-seeking are often considered phenomena arising in representative democratic situations. The results of this paper suggest that even single issue referenda may be subject to these behaviors. In particular, if quasi-public goods can be obtained from outside a geographic area then citizens adjoining those areas will be less likely to support the provision of the good using taxes, fees, or other resources from within the area. Similarly, to the extent a good is already provided locally, a referendum on increased state support is likely to engender rent-seeking behavior by citizens interested in shifting the burden of taxation away from local taxpayers.
Our finding of a strong negative relationship between support for the referendum and the availability of a cross-border trauma center is evidence of free-riding behavior on the part of voters in these areas. For voters in these areas, the close proximity of out-of-state trauma centers meant they were less likely to want to financially support the creation of in-state trauma centers. The strong positive relationship between trauma centers and support for the referendum is consistent with local voters and trauma center employees viewing the referendum as an opportunity to spread the cost of their centers to taxpayers statewide.


