Abstract
The recession in India and the UK peaked in 2017 due to the implications of new policy initiatives. The outbreak of the COVID-19 pandemic at the beginning of 2020 intensified the crisis, causing a drastic decline in aggregate demand and output. India and the UK have resorted to monetary and fiscal stimulus packages to face the economic crisis. This study investigated the inflation–unemployment dynamics during the recession and COVID-19 times in India and the UK. Using a generalized additive model (GAM), the results of this study revealed that the recession had given way to stagflation in India. In contrast, in the UK, it has led to a more severe recession in the short-run. During the downturn, policy initiatives aggravate the recession and eventually turn to stagflation in India due to inflation caused by the weak supply side. However, in the UK, the policy initiatives during this downturn pushed the economy into a deeper recession due to reduced demand. The outbreak of the COVID-19 pandemic has had a similar recessionary impact on both economies. A time horizon based recovery plan is suggested to help the economies recover from stagflation and even deeper recession. This framework could enable policymakers to choose the right path of recovery within the shortest possible time.
1. Introduction
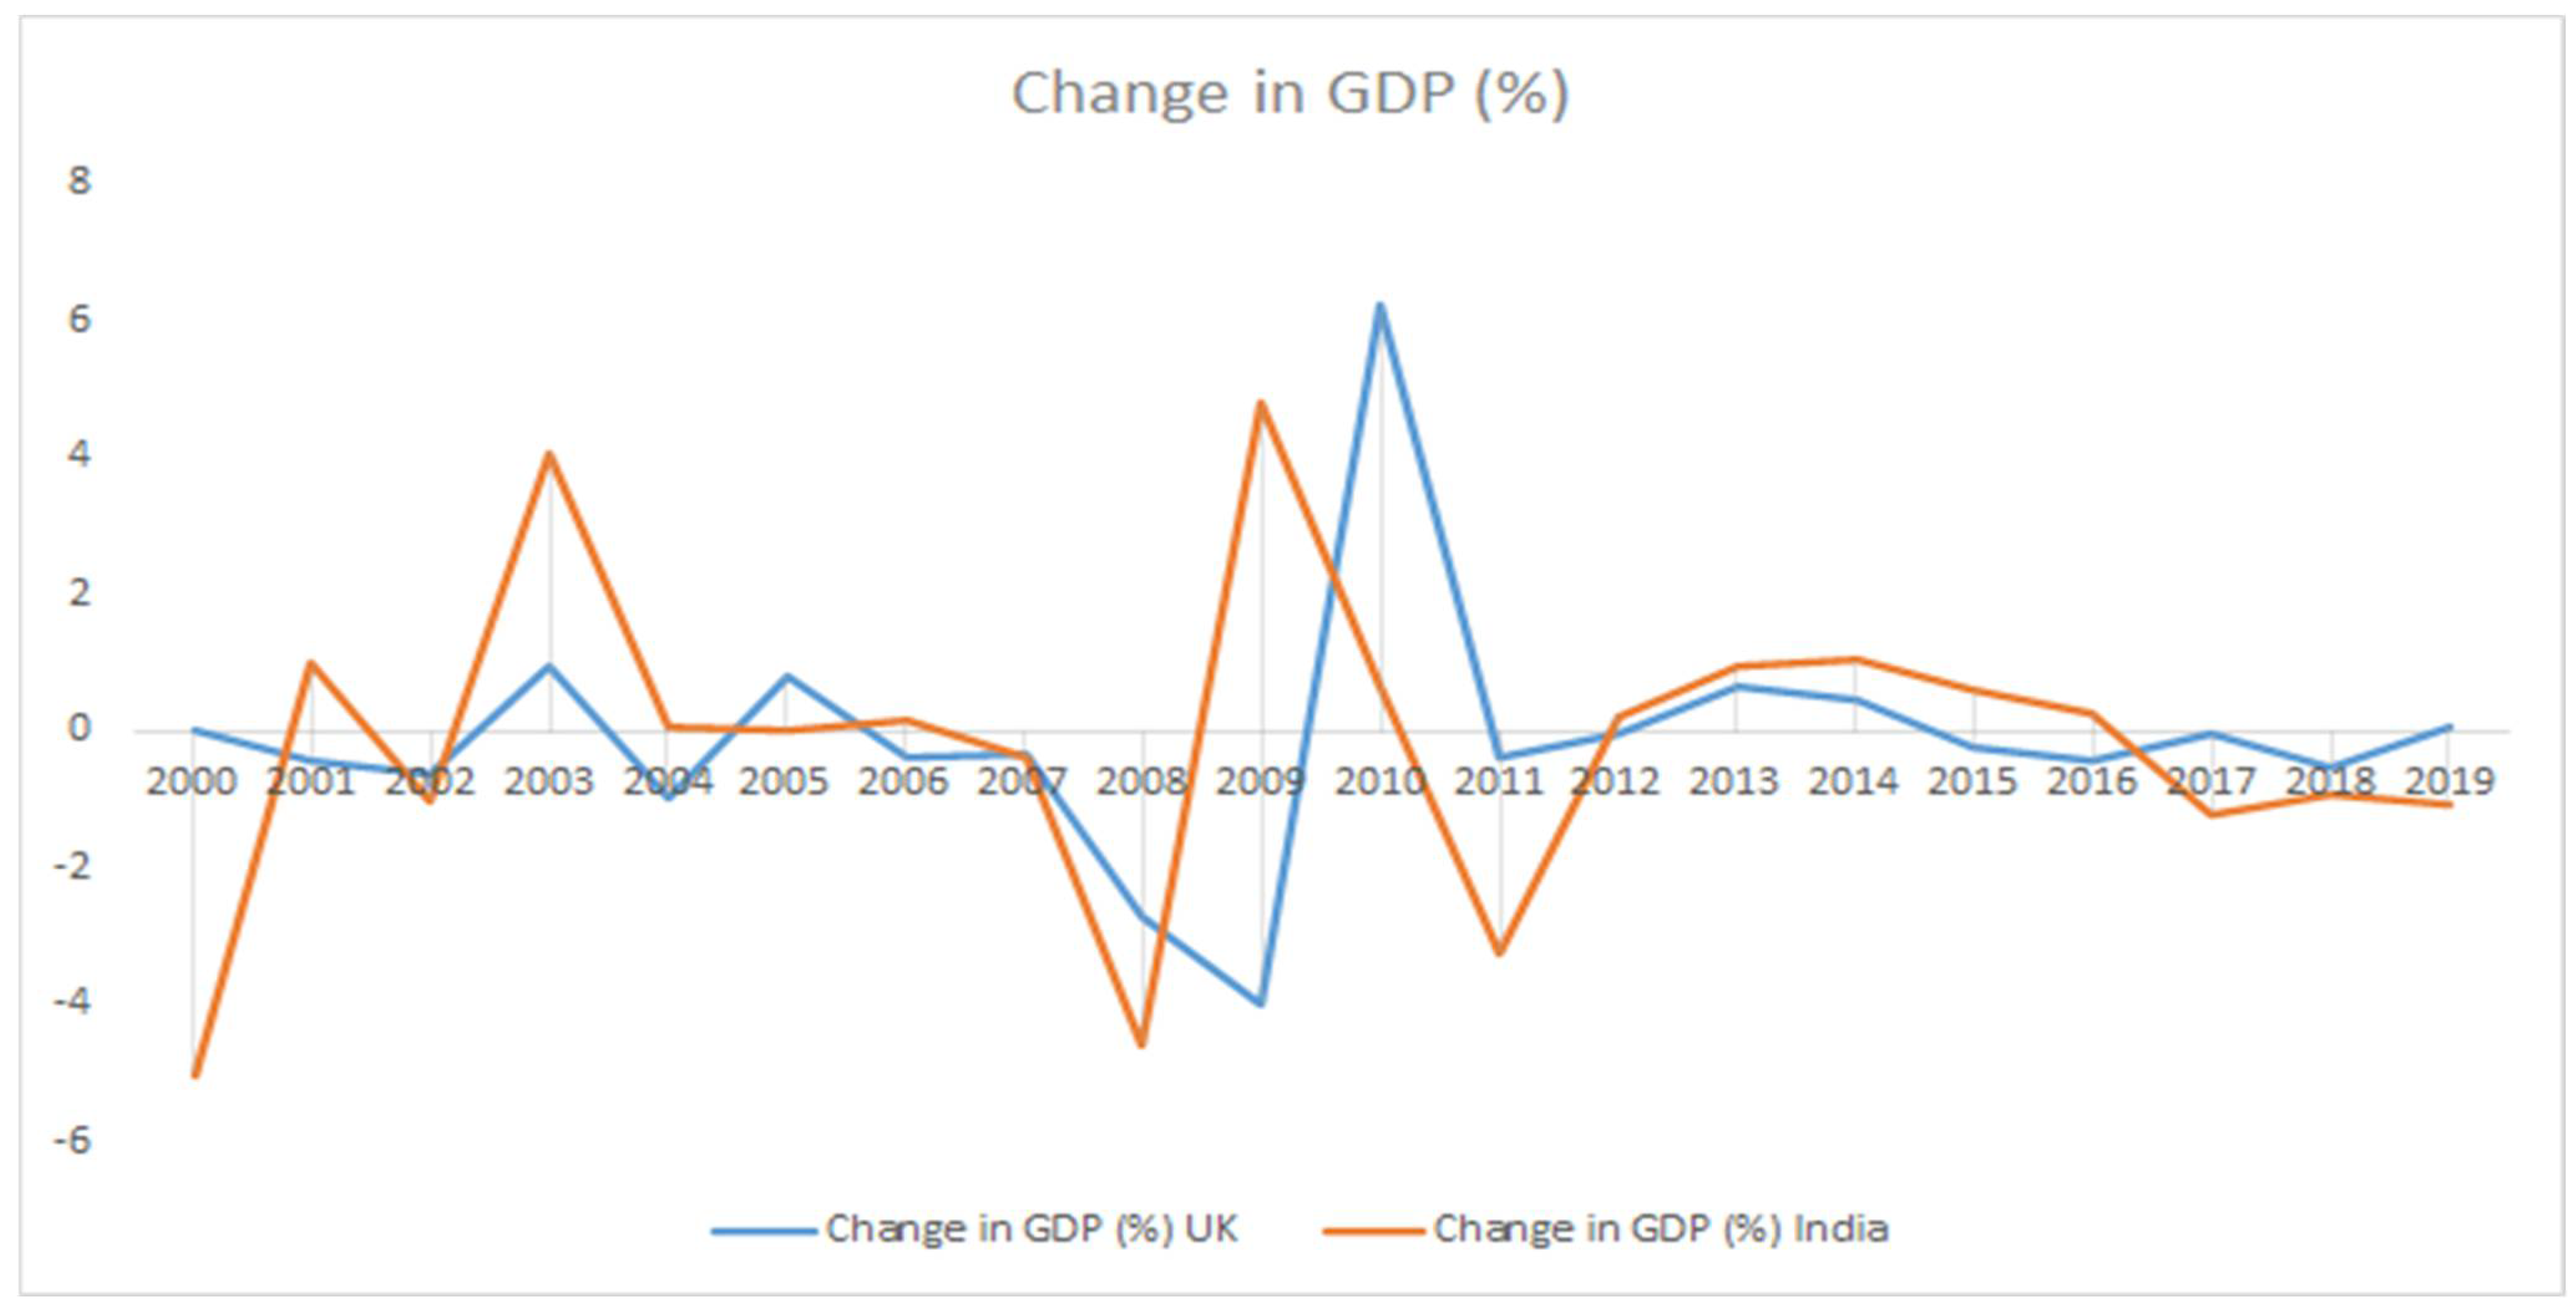
The Indian and UK economies have been under pressure due to domestic and global factors for over a decade since the 2007–2008 global recession. In India, the fall in the GDP growth is attributed to factors such as increasing non-performing assets (NPAs) in the banking sector (Lokare 2014) and the 2007–2008 recessionary effects from the major trading partners. When the government implemented the so-called ‘twin blows’ of Demonetization (2016) and Goods and Services Tax (GST 2017), an already strained economy was pushed into a more severe recessionary phase in 2016/2017 (Verma et al. 2020). Similarly, the UK recorded robust growth by 2010 and moved into a prosperity stage in the following years (Lenoël et al. 2020). However, this boom is characterized by high GDP growth, consumption and investment soon spun into a steep decline in domestic savings and gross investment following the Brexit Referendum in 2015–2016 (Figure 1).
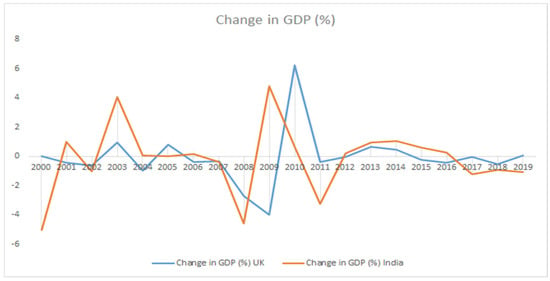
Figure 1.
Percentage change in GDP growth rate for India and the UK from 2000 to 2019. Source: World Bank, 2020.
These observations imply that India and the UK moved into a recession by 2016–2017 due to Demonetization and the Brexit Referendum, respectively, when the economies had already been shrinking and under pressure. The implementation of Goods and Services Tax (GST) in 2017 deepened the recession in India. The Brexit Referendum results led to the depreciation of the local currency, which raised the cost of living and reduced real wages. It automatically reduced the proportion of income saved and spent on consumption (Giammetti 2020), along with a rise in unemployment. Figure 1 shows the contractionary phase in both economies after the new policy initiatives introduced in 2016.
It is vivid that the way these economies are responding to the contraction is not uniform, as India has recorded a more severe adverse impact since 2016. Against this background, the present COVID-19 pandemic, unparalleled to many earlier economic episodes, is characterized by demand and supply shocks (Brinca et al. 2020). It has created a deep-rooted socio-economic crisis worldwide, with an adverse impact on the labor, goods, and financial markets (Baqaee and Farhi 2020). On the supply side, it has led to a cut in production with job losses and a further increase in unemployment levels. It is possible that, when the economy falls into a deeper recession on the wings of both demand and supply shocks, it might eventually lead to a stagflation phase, characterized by a higher price level and unemployment rates (Papanikolaou and Schmidt 2020).
The traditional outlook on inflation–unemployment dynamics is based on a trade-off, although modern approaches reduce their relevance in the short run. Despite the debate surrounding its existence, the Phillips curve has been established in contemporary empirical works on developing and developed economies (Abu 2019; Tenzin 2019; Donayre and Panovska 2018; Ho and Iyke 2019). Interestingly, the nature and strength of the negative relationship are dependent on various factors, such as inflation relative to its long-term trend (Donayre and Panovska 2018), source of external shock and policy response (Ho and Iyke 2019). These works stand to substantiate the complexity of inflation–unemployment dynamics and bring focus to the understanding of policy factors in the relationship.
The present economic situation warrants examination of the inflation–unemployment dynamics of India and the UK, countries with wide variations in the economic characteristics, as the world gears towards policy intervention for economic revival from the pandemic. We investigate the possibility of recession giving way to stagflation and to bring out the reasons behind it. In examining the magnitude of the impact of the COVID-19 crisis in India and the UK, this study also highlights the drawbacks of the current economic model and recommends an alternative economic model to address recessionary trends. Research in this area is expected to contribute towards developing an intimate and nuanced understanding of the inflation–unemployment dynamics with a focus on tailor-made policy interventions for recovery. In the context of policy-induced economic events and unprecedented external shocks like the pandemic, this study seeks to provide a framework for remedial measures that can be adopted for economic recovery.
2. Literature Review
2.1. Theoretical Foundation
A. W. Phillips (1958), a British economist, empirically tested the statistical relationship between inflation and unemployment. He observed the negative relationship between money wage growth (inflation) and unemployment in the UK for an extended period between 1861 and 1957. The evidence he presented appeared to show the negative relationship between these two variables and a non-linear relationship. It was concluded that the link between inflation and unemployment is stable so that a fall in unemployment leads to a considerable rise in employment. It implies that unemployment has high costs, while inflation is a minor nuisance at low inflation rates. Therefore, with reasonable limits based on the public’s preferences, policymakers could tolerate some more inflation to reduce unemployment (Samuelson and Solow 1960).
However, the negative relationship between inflation and unemployment appeared to become unstable in many countries as they began to coexist by the 1970s. This led to serious concerns about the Phillips Curve theory’s validity and resulted in a concerted attack from a group of economists headed by Milton Friedman. He argued that the Phillips Curve relationship is a short-run phenomenon (Friedman 1968; Samuelson and Solow 1960). The short-run Phillips Curve, referred to as the expectations augmented Phillips Curve, shifts along with inflationary waves. Thus, monetary policy cannot affect unemployment as the economy adjusts back to the natural output rate in the long run. However, this long-run neutrality of monetary policy allows for short-run fluctuations and the monetary authorities’ ability to reduce unemployment by way of an increasing inflation rate temporarily. The supply shocks due to a hike in prices of crude oil and other essential raw materials raise inflation and coexist with rising unemployment (stagflation). It highlights the Phillips Curve shift, which implies rising price levels and economic stagnation coexist, making the policy decisions difficult.
In India’s case, some studies show that the economy might not reflect a regular Phillips Curve as we have to adjust for exogenous variables. A rise in both inflation and unemployment, a phenomenon termed stagflation was observed. For instance, the inflation rate went up from 5.7 percent in 2012–2013 to 6 percent in 2013–2014 and during this period unemployment also increased from 4.7 percent to 4.9 percent (Reserve Bank of India 2014; World Economic Outlook 2014). In other words, the inflation–unemployment trade-off was seen as relevant only for the spells of short periods with the association never remaining permanent. For instance, unemployment was about 3.8 percent while inflation (WPI) was 9.7 percent in 2010–2011. By 2012–2013 unemployment rose to 4.7 percent with a decline in inflation to 5.7 percent. One of the reasons attributed to this was the GDP growth in these years as it was observed that high GDP growth rate was accompanied by a falling unemployment rate. For instance, in 2010–2011, GDP growth rate was at 8.91 percent and the unemployment rate was at 3.8 percent. In 2012–2013, the GDP growth rate declined to 4.47 percent and the unemployment rate increased to 4.7 percent (Planning Commission 2019). In the case of the UK, the short-run trade-off between inflation and unemployment is very evident. The high unemployment during recessionary times supports the same theoretical argument. However, this relationship does not exist in the long run as the price level gets adjusted.
The debate over the effectiveness of fiscal and monetary policies are embedded in the differences between Keynesians and monetarists. Keynesian economics emerged strongly after the Great Depression of the 1930s, reposing the faith in fiscal measures such as government spending, taxation, and borrowing to address economic fluctuations. On the contrary, Monetarism emerged as a robust alternative to Keynesian thought under Milton Friedman (Jahan et al. 2014).
Keynes emphasized the superiority of fiscal policy measures over monetary policy and highlighted the role of direct government intervention in regulating macroeconomic variables. Through the adjustment in tax rates and direct government spending, these measures would directly affect aggregate demand. In a simple Keynesian model, with the assumption of stable prices and excess capacity, the output is determined by aggregate demand. Any fiscal expansion would have a multiplier effect on the income level through aggregate demand. As an extension of this model, crowding out through induced changes in interest rates and exchange rates are emphasized due to economic stimulus packages that increase the economy’s debt burden. It raises the risk of growing bankruptcy. As stated by the debt overhang theory, debt repayment and servicing could negatively affect the capital formation, hindering sustained economic growth (Abdullahi et al. 2016).
Similarly, monetary policy has a short-term impact on inflation and the country-wide demand for goods and services. During inflationary times, contractionary monetary policy by reducing money supply or increasing interest rates reduces the price levels. The significant challenges associated with monetary policy include the time lag between the policy changes and economic outcomes. The time-lag in Friedman’s analysis in the USA’s context is estimated to be between six–nine months (Jahan et al. 2014).
2.2. Empirical Results of Studies from India and the UK
The existence of the Phillips curve has been empirically studied in several contexts. These studies have been critical in providing a basis for the various arguments underpinning the Phillips theory, including inflation–unemployment dynamics. This sub-section seeks to present the findings of empirical works regarding the Phillips curve’s existence in the Indian and the UK contexts. These works stand to indicate some of the differences in the inflation–unemployment relationship between developing and developed countries.
In India, most studies point to the existence of a conventional Phillips curve that depicts a short-run trade-off between inflation and unemployment. Singh et al. (2010), in their analysis, used output gap and inflation to establish the existence of a Phillips curve for a time period from Q1 of 2004 to Q1 of 2009. Further, they argued that the Phillips curve only emerges when supply shocks are accounted for in the analysis. On similar lines, Paul (2009) showed that supply shocks resulted in the disappearance of the curve. In contrast to these studies, which employed a complex quantitative analysis, Mazumder (2011) presented a view that standard econometric specifications can be used to establish the existence of a Phillips curve. With this method, his work established the existence of the Phillips curve. Further, it argued that Lucas’ critique regarding historical data for forecasting would not be relevant for inflation–unemployment dynamics in the Indian context. As an extension to these works, Behera et al. (2017) showed that an inverse relationship was present for both core and headline inflation, with the effect of excess demand being more significant in core inflation. In substantiation of the arguments of Mazumder (2011) regarding Lucas’ critique, Behera et al. (2017) demonstrated that monetary intervention that is countercyclical could play a critical role in the stabilization of inflationary expectations and inflation in the economy. The work of Salunke and Patnaik (2019) contributes to the debate on forms of specification, stating that the data for the short-term support of all specifications and those hybrid models are more robust. Studies, however, have not focused on the long-term relationship between inflation and unemployment in the Indian context.
Concerning the UK, the work of A.W. Phillips (1958) established a negative relationship between money wage growth (inflation) and unemployment for an extended period between 1861 and 1957. In recent times, Osmerod et al. (2013) provided essential conclusions about inflation–unemployment dynamics in the context of advanced economies, such as the UK, the US and Germany. They demonstrated that the inflation–unemployment relationship shifted over time, indicating shifts in the Phillips Curve. Secondly, it was found that the short-run relationship was unstable, indicating the existence of several other factors that determine inflation–unemployment dynamics. Therefore, Osmerod et al. (2013) stated that a specific short-run relationship could not be accurately linked to a particular time period. Finally, based on the above findings, they were critical of the use of Phillips theory for policy intervention as the relationship was unstable.
With regard to the long-run Phillips curve, there is not sufficient evidence to reject a vertical curve for advanced economies such as the UK, Canada and the Eurozone (Benati 2015). Other works concerning the UK have primarily focused on forecasting inflation based on the Phillips theory and the econometric challenges associated with it (Posch and Rumler 2015; Clausen and Clausen 2010). Further, works have examined the New Keynesian Phillips Curve that examines the impact of historical inflation, inflationary expectations and aggregate demand on the present rates of inflation (Nason and Smith 2008; Mihailov et al. 2011). However, works examining the existence of an inverse relationship are restricted.
2.3. The New Policy Initiatives and Indian Economy
The impact of the global financial crisis on the Indian economy due to its transmission through trade and investments was different from the West (Kumar and Vashisht 2009). It was cushioned by government intervention (Bhatt 2011), and the economy, which stabilized in 2009 (Dasgupta and Gupta 2010) and experienced a decline in 2016, then entering a slowdown phase by 2019 (Sharma 2019). Manmohan Singh, the former Prime Minister of India, attributed these trends to the twin policy initiatives—demonetization (2016) and introducing the Goods and Services Tax (PTI 2019). It was expected that the adverse effects of these measures would be short-lived, and the economy was expected to recover within four months of demonetization (Reserve Bank of India 2017). It was observed that the strength of aggregate demand enabled the country to enter the recovery process (Ashwani and Nataraj 2019). However, there are views that the primary informal sector’s vulnerable groups were adversely affected (Ghosh 2017). The economic slowdown in 2019 was an outcome of the cumulative effects of these policies, which reduced the resilience of India’s consumption demand (Dey 2019). COVID-19 has led to devastating consequences for the Indian economy, beginning with a steep fall in GDP growth. For instance, India’s quarterly GDP growth rate recorded the largest fall in the world, with a 23.9 percent fall in the last quarter of 2020 (International Monetary Fund 2020b).
The initial reports examining the Goods and Services Tax (GST) policy positively influenced the economy (Vasanthagopal 2011). It was predicted that the system would stimulate consumption and income for households and investment and employment in all productive industrial sectors (Bhattarai 2017). These studies, based on the understanding of an ‘optimal’ design of the GST, presented a theoretically grounded analysis that brought out the benefits of simplifying the tax system and removing its cascading effects. However, these works failed to account for the implementation challenges and other structural factors that negatively affected productivity across various sectors. In actual implementation, it was found that the GST led to the process of ‘destocking’ in industries that are consumption and investment intensive, which is a contradiction of earlier works (PTI 2017). These changes were regarded as some catalysts that added to cyclical changes in the economy resulting in an intense slowdown of economic activities at the end of 2019 (Business Line 2019).
2.4. Brexit and the UK Economy
It was reported that the UK entered a recession after two consecutive quarters of fall in GDP, with a 20.4 percent reduction in GDP, the highest among developed economies (Dodd 2020). This is the first recession since the global financial crisis in 2008 and came during the transition period of the Brexit Withdrawal Agreement. The Brexit Withdrawal Agreement was finalized between the United Kingdom and the European Union in January 2020. Since the British Parliament was not agreed upon an exit plan, it was decided under this agreement that the UK would remain in the single market till the end of 2020 as a transition period. If a plan is not reached by then, the UK will exit with no deal on the 1st January 2021. The Majority of the literature agrees on the negative impact, but differ in estimates of the magnitude. Dhingara et al. (2017) summarized the welfare losses associated with Brexit for the UK and have estimated it to range between 1.5 percent to 2.5 percent for a ‘soft’ Brexit and 7–8 percent of GDP for a ‘hard’ Brexit. A ‘soft’ Brexit involves an agreement that retains a form of the single market, while the ‘hard’ Brexit was a complete breaking away from the European economy.
Despite disagreements regarding its long-term effects, there is significant evidence suggesting that the economy would be negatively affected in the short-term, depending on the exit deal and transition process (Begg and Mushovel 2016). The exit from the EU would increase the costs involved in trade, adversely affecting people’s standard of living and reducing the GDP per capita by more than 3 percent of the expected levels (Hantzsche et al. 2018). The UK’s growth trajectory depends on the nature of the British Parliament’s policy decisions, and the consensus reached between policymakers of the UK and the EU.
2.5. India and the UK in the Wake of COVID-19
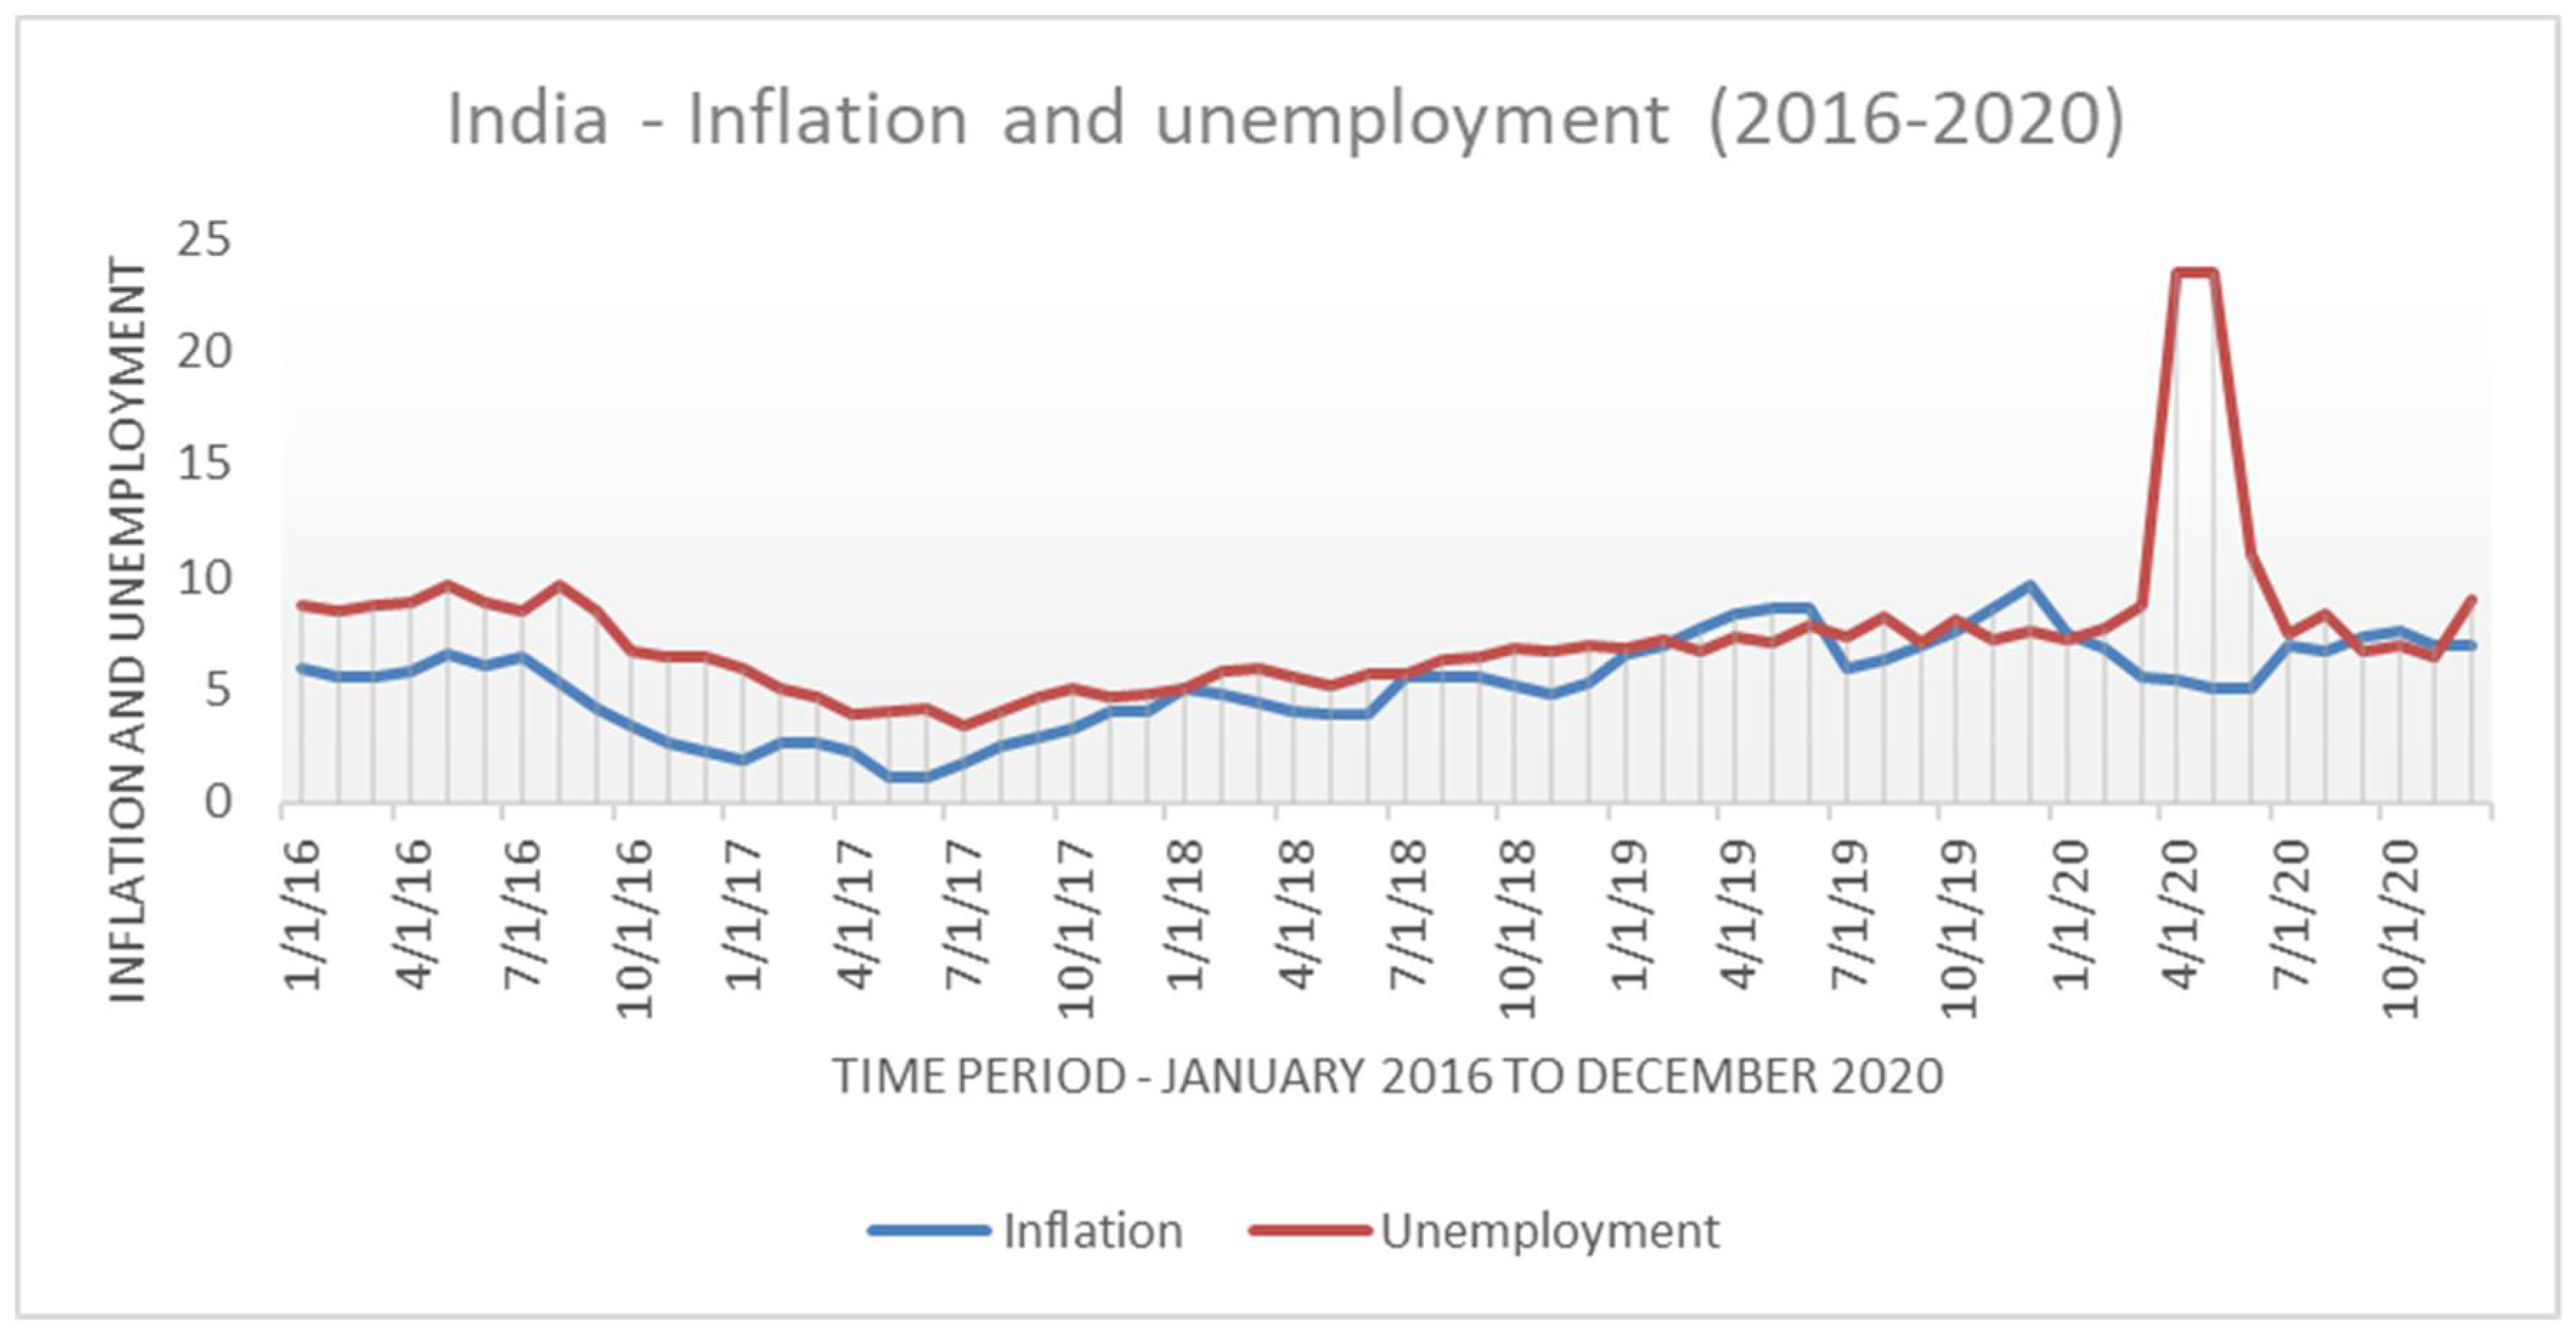
The World Economic Outlook (International Monetary Fund 2020a) has predicted global economy shrinkage by 4.9 percent in 2020. In contrast, The World Bank (2020) has cautioned about a fall in per capita income, endangering the welfare of millions globally. Further, COVID-19 presents a unique scenario of a simultaneous fall in supply and demand, along with a reduction in production and employment (Loayza and Pennings 2020). Thus, this scenario is characterized by the Keynesian supply shock, where aggregate demand falls much further in response to a reduction in aggregate supply resulting in a demand deficient recession (Guerrieri et al. 2020). There is evidence of a reduction in employment, productivity and density of trade following the pandemic (UNIDO 2020; Vidya and Prabeesh 2020). The Indian economy has undergone a decline of 23.9 percent in quarter 2 of 2020 and is predicted to decline by 4.5 percent in 2020 (The Indian Express 2020). Figure 2 shows the economic contraction in the Indian economy from 2016, with the falling price level. Though the unemployment rate declined initially, it started rising by mid-2017, which implies that the recession has given way to stagflation. The simultaneous uptrend of inflation and unemployment is a clear indication of inflation persistence in the economy. Further, the pandemic induced lockdown has inflicted a dent on the economy in terms of a massive jump in the unemployment rate.
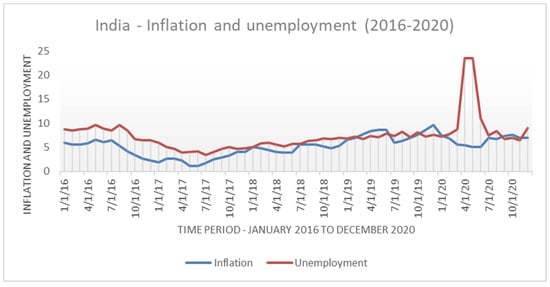
Figure 2.
Inflation and unemployment dynamics observed in the Indian economy between January 2016 and July 2020. Source: Plotted based on Data from the Centre for Monitoring Indian Economy (CMIE) and Ministry of Statistics and Programme Implementation (MOSPI).
The UK has been one of the worst-hit economies during the pandemic, with a 20.4 percent decline in output in quarter 2 of 2020. The Job Retention Scheme has cushioned the effects on the labor market, but is expected to provide less protection as the pandemic continues (Mayhew and Anand 2020). Inflation has been kept low by policies targeted at consumer spending. The limited reopening in June and July helped the economy to have an immediate bounce back from the recession, and monthly growth has been positive. However, the economy remains below pre-pandemic levels and has lost its momentum (The Guardian 2020). However, the prospects remain mixed as the pandemic may have prolonged negative impacts, and a second wave is likely to induce another set of restrictions.
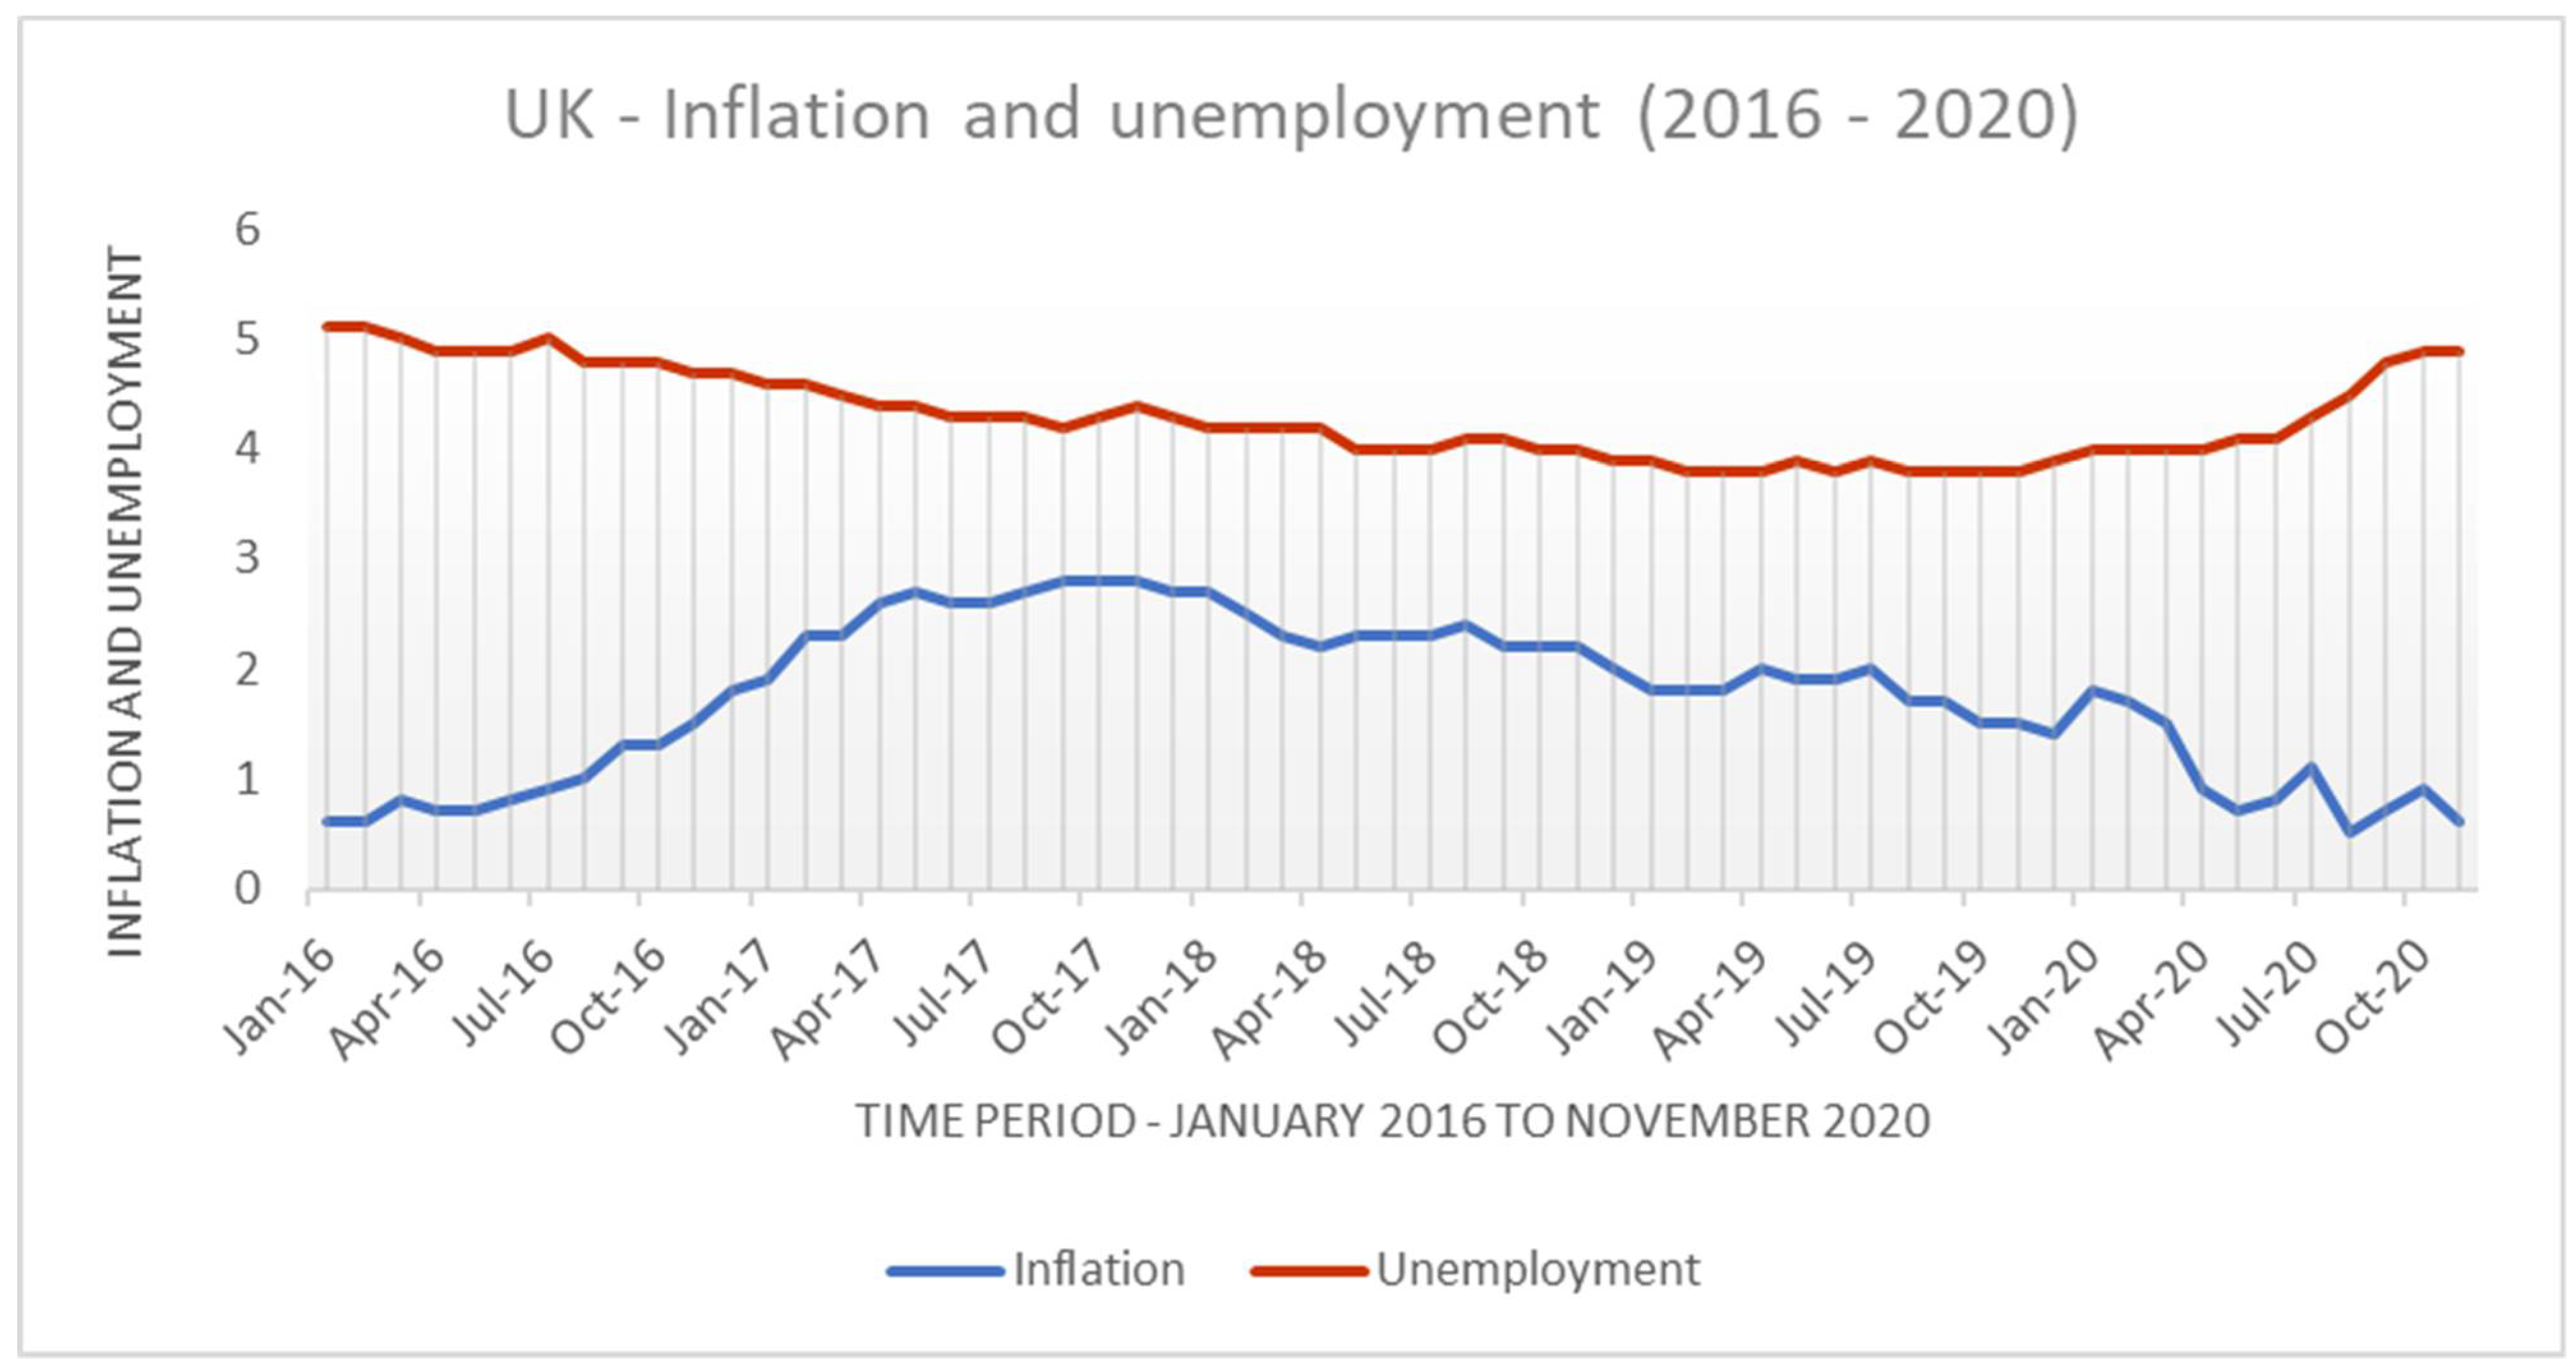
Figure 3 depicts the movement of inflation and unemployment in the UK economy during the 2016–2020 period. The economic contraction is evident through the recessionary signs from 2017 with the falling price level. Though the unemployment rate remains more or less stable initially, it started to record a nominal increase by 2019. The pandemic’s outbreak causes a deeper recession as unemployment increases and the price level falls together. It is worth mentioning that, unlike India, the UK economy does not move to stagflation as it is free of inflation persistence.
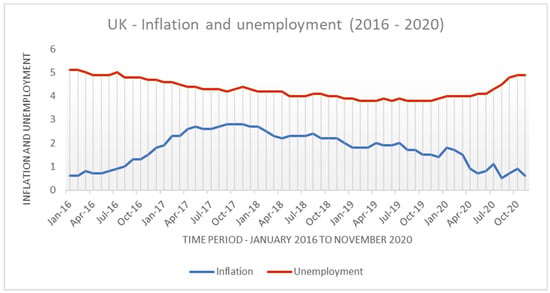
Figure 3.
Inflation and unemployment dynamics observed for the UK between January 2016 and May 2020. Source: Plotted based on Data from the Office of National Statistics (ONS).
3. Materials and Methods
3.1. Data Description
This study uses monthly data from the consumer price index (CPI) from 2016 January to 2020 December for both India and UK. Additionally, it uses the monthly unemployment rate for the same period for both countries. The time period was selected on the basis of the significant policy changes brought in both countries in 2016. In India, demonetization was executed on 8 November 2016 and the UK citizens voted in favor of the Brexit referendum on 23 June 2016. For India, the CPI data is collected from the Ministry of Statistical Program Implementation (MOSPI) and unemployment data from the Centre for Monitoring Indian Economy (CMIE). For the UK, the CPI and unemployment data are collected from the Office of National Statistics (ONS).
3.2. Methods
This study employs a quantitative approach using a generalized additive model, which is an extension of the Generalised Linear Model (GLM) to study the relationship between inflation and unemployment in the UK and India. The turbulent period under study requires relaxing of several assumptions of Ordinary Least Squares (OLS) to capture the real fluctuations. Generalised linear models have the flexibility of allowing for response variables that do not follow normal distribution. Generalized additive models (GAMs) are an extension of the generalized linear models (GLMs) with some smoothing functions. GAMs are often used to model and illustrate the non-linearities in data through many non-linear smooth functions. GAM is useful in capturing the non-linear relationship between the variables that may not be well reflected by polynomial terms and spline terms, which require manual specification of the knots. The spline regression’s difficulties are that the knots should be adequately specified, failing to which will yield unreliable results. Moreover, the coefficients in the spline regression cannot be directly interpreted. Hence, a Generalized Additive Model (GAM) that automatically fits spline regression to the data was used to study the relationship between the variables. This advantage makes GAMs flexible compared to polynomial and spline regressions (Hastie and Tibshirani 1987). Further, GAMs have been successfully applied in a variety of research areas such as GDP growth (Pršlja 2019), shipping economics (Köhn 2008), prediction of electricity demand (Sigauke 2017) and pricing of agricultural land and residential housing (Valtiala et al. 2019; Bax et al. 2021). The model fits the data well as the regression function is altered without making significant changes in the model’s variance and exhibits a better performance in generalization to the random unseen data.
General GLM can be specified as:
where g(…) is a function. The inverse of g(…), which can be given as gi(…), is the link function. Thus, Equation (1) can be formulated as:
Y = g(b0 + b1X1 +… + bmXm)
gi(μY) = (b0 + b1X1 +… + bmXm)
The expected value of the dependent variable Y here is E(Y) = μ =gi(μY). The idea of the additive models with generalized linear model could be associated to obtain a model as follows:
gi(μY) = ∑i(fi(Xi))
The model for this study, based on the general function, could be specified as:
g(E(Inflationt│.)) = b0 + s(Unemploymentt)
Inflationt is the Inflation rate at time period t, Unemploymentt is the unemployment rate at time period t and g(.) is the link function.
4. Results
As indicated in Table 1, second-degree polynomial regression is used to examine the relationship between inflation and unemployment in both countries. For the UK, first and second-order coefficients are negative and significant, whereas for India, the first-order coefficient is positive, and the second-order coefficient is negative. The adjusted R squared for India is 0.43, and for the UK, it is 0.59. A spline regression, which is considered as a superior approach to polynomial regression in modeling non-linear relationships, was also carried out to see if the results improved. Based on the nature of the data, a cubic spline was initially applied to analyze the relationship. The adjusted R squared improved for both India and the UK, with values of 0.57 and 0.60, respectively.

Table 1.
Polynomial and spline regression results.
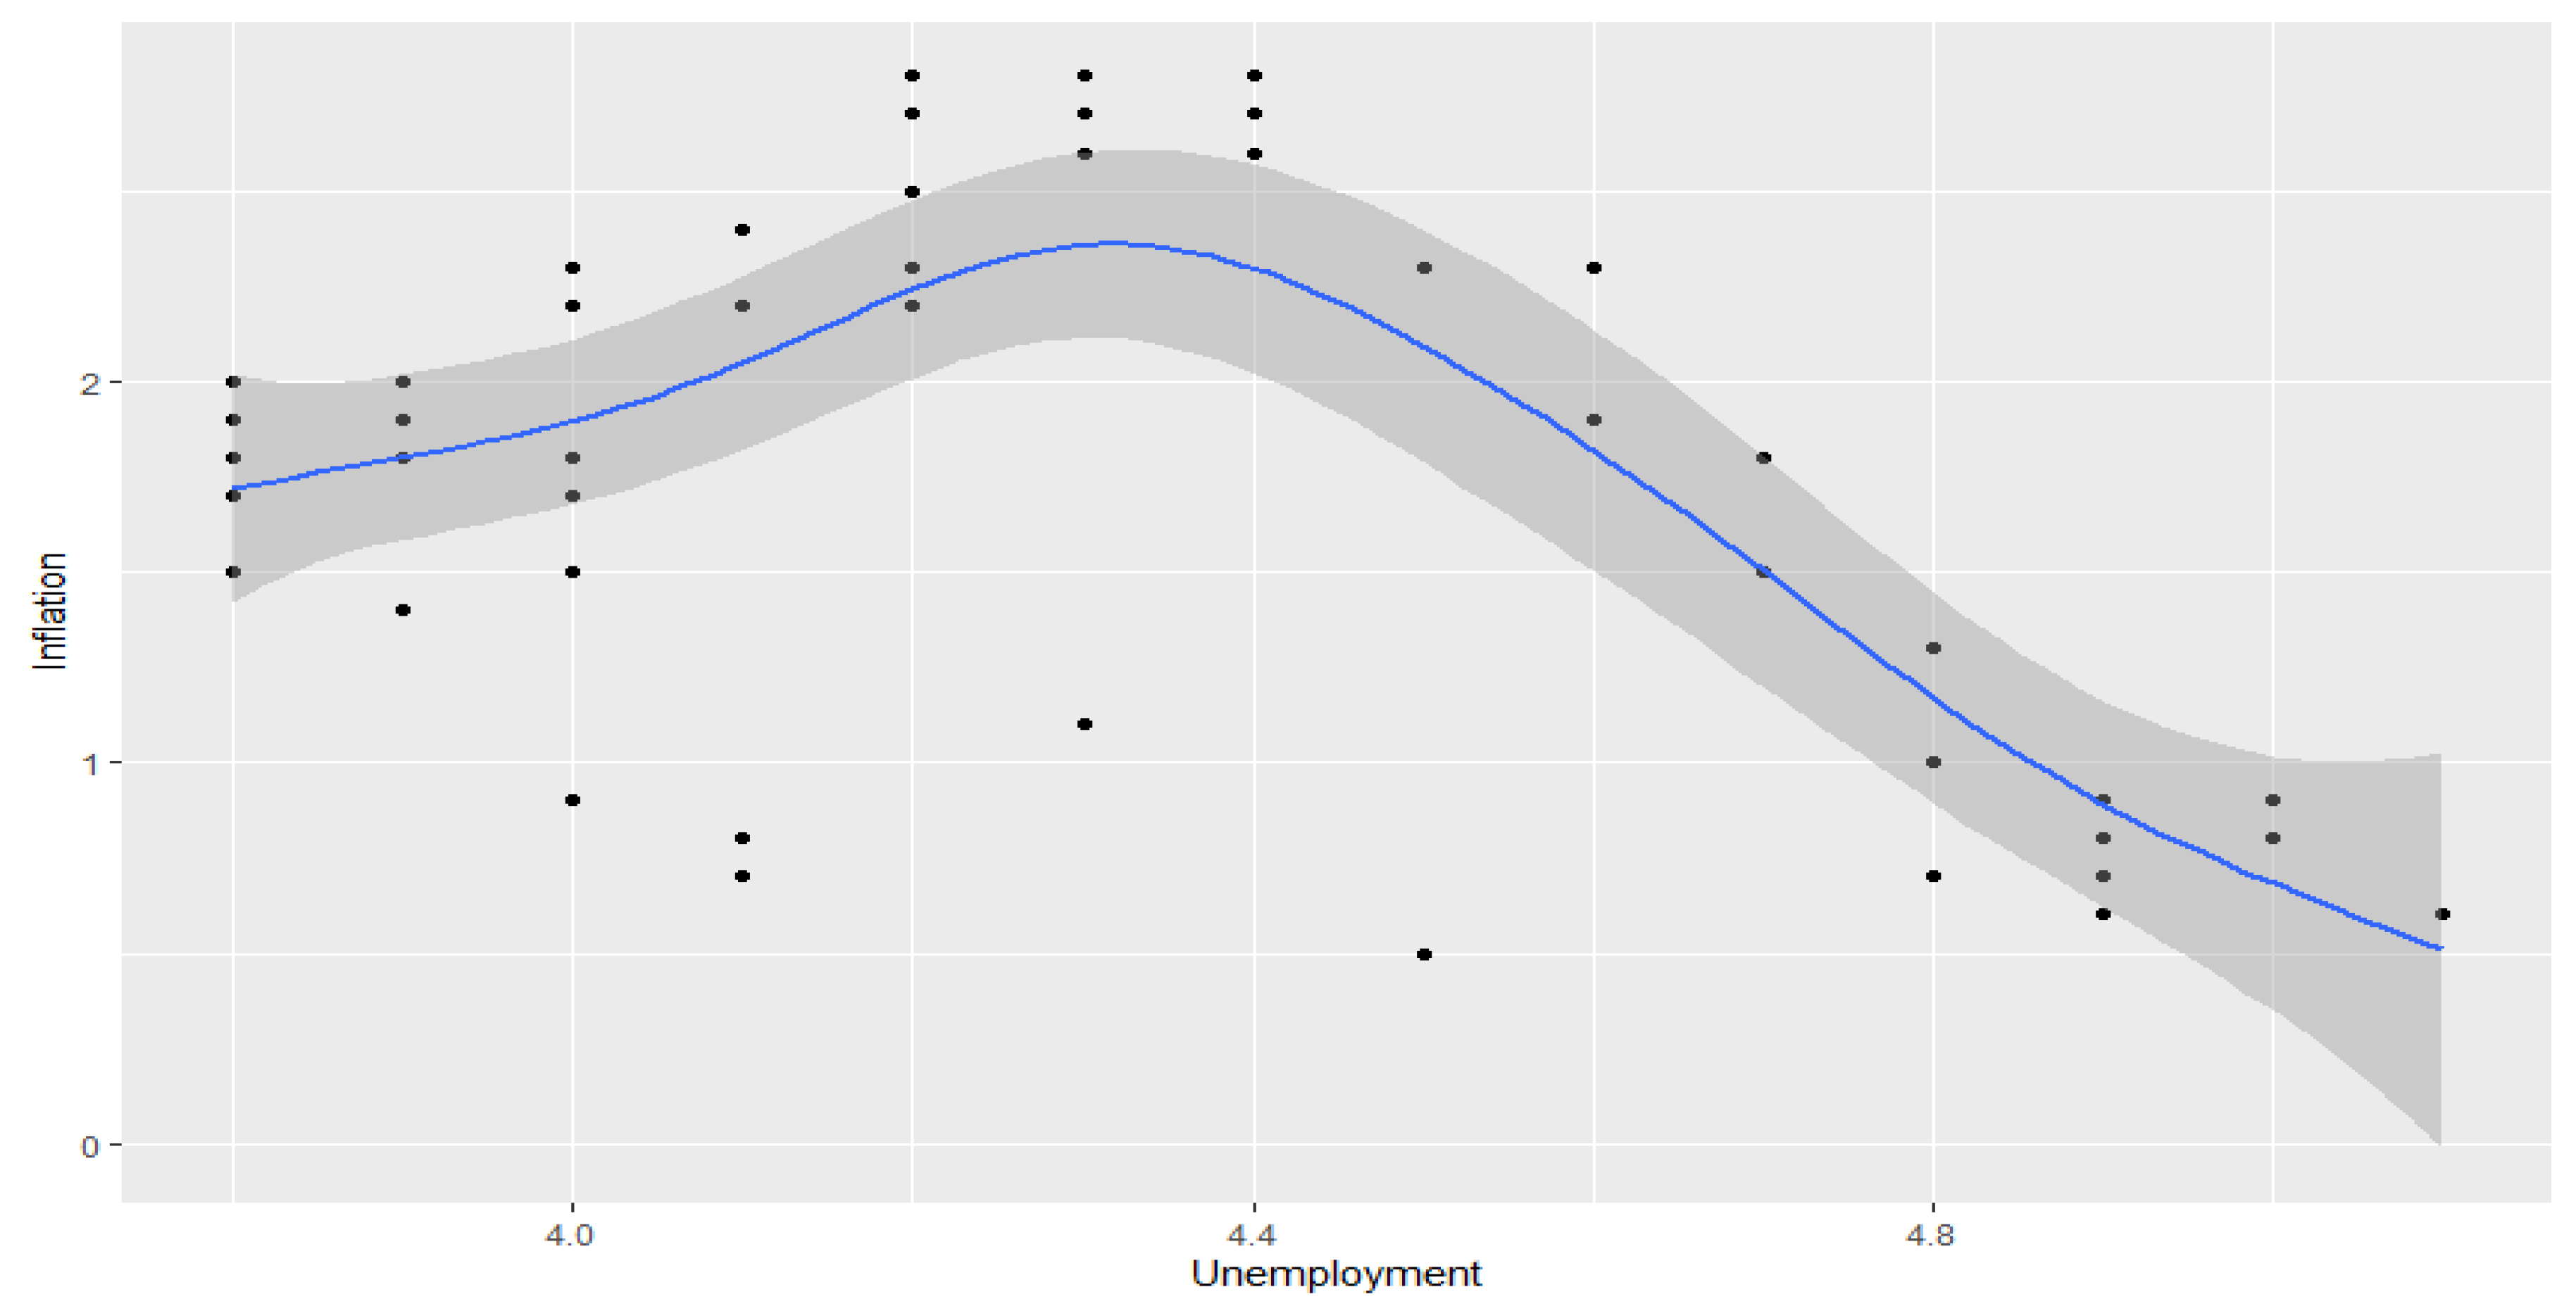
Figure 4 shows that the relationship between unemployment and inflation is non-linear and reflects the inverse relationship between the variables following an initial positive correlation, as depicted by the smooth curve’s rising portion. The figure indicates a short-run trade-off between inflation and unemployment for the UK, aligning with the Phillips curve theory. The positive relationship between the variables, as seen in the upward rising first part of the curve, could be mainly attributed to the influence of the Brexit deal negotiations between the UK and the EU in the year 2017. However, this trend disappears, and the inverse relationship between the variables is visible after a peak. During the pandemic, inflation rates fell, and the unemployment rate increased, indicating a recession.
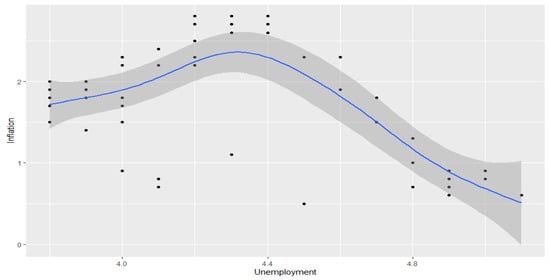
Figure 4.
Smooth function of UK fitted using GAM.
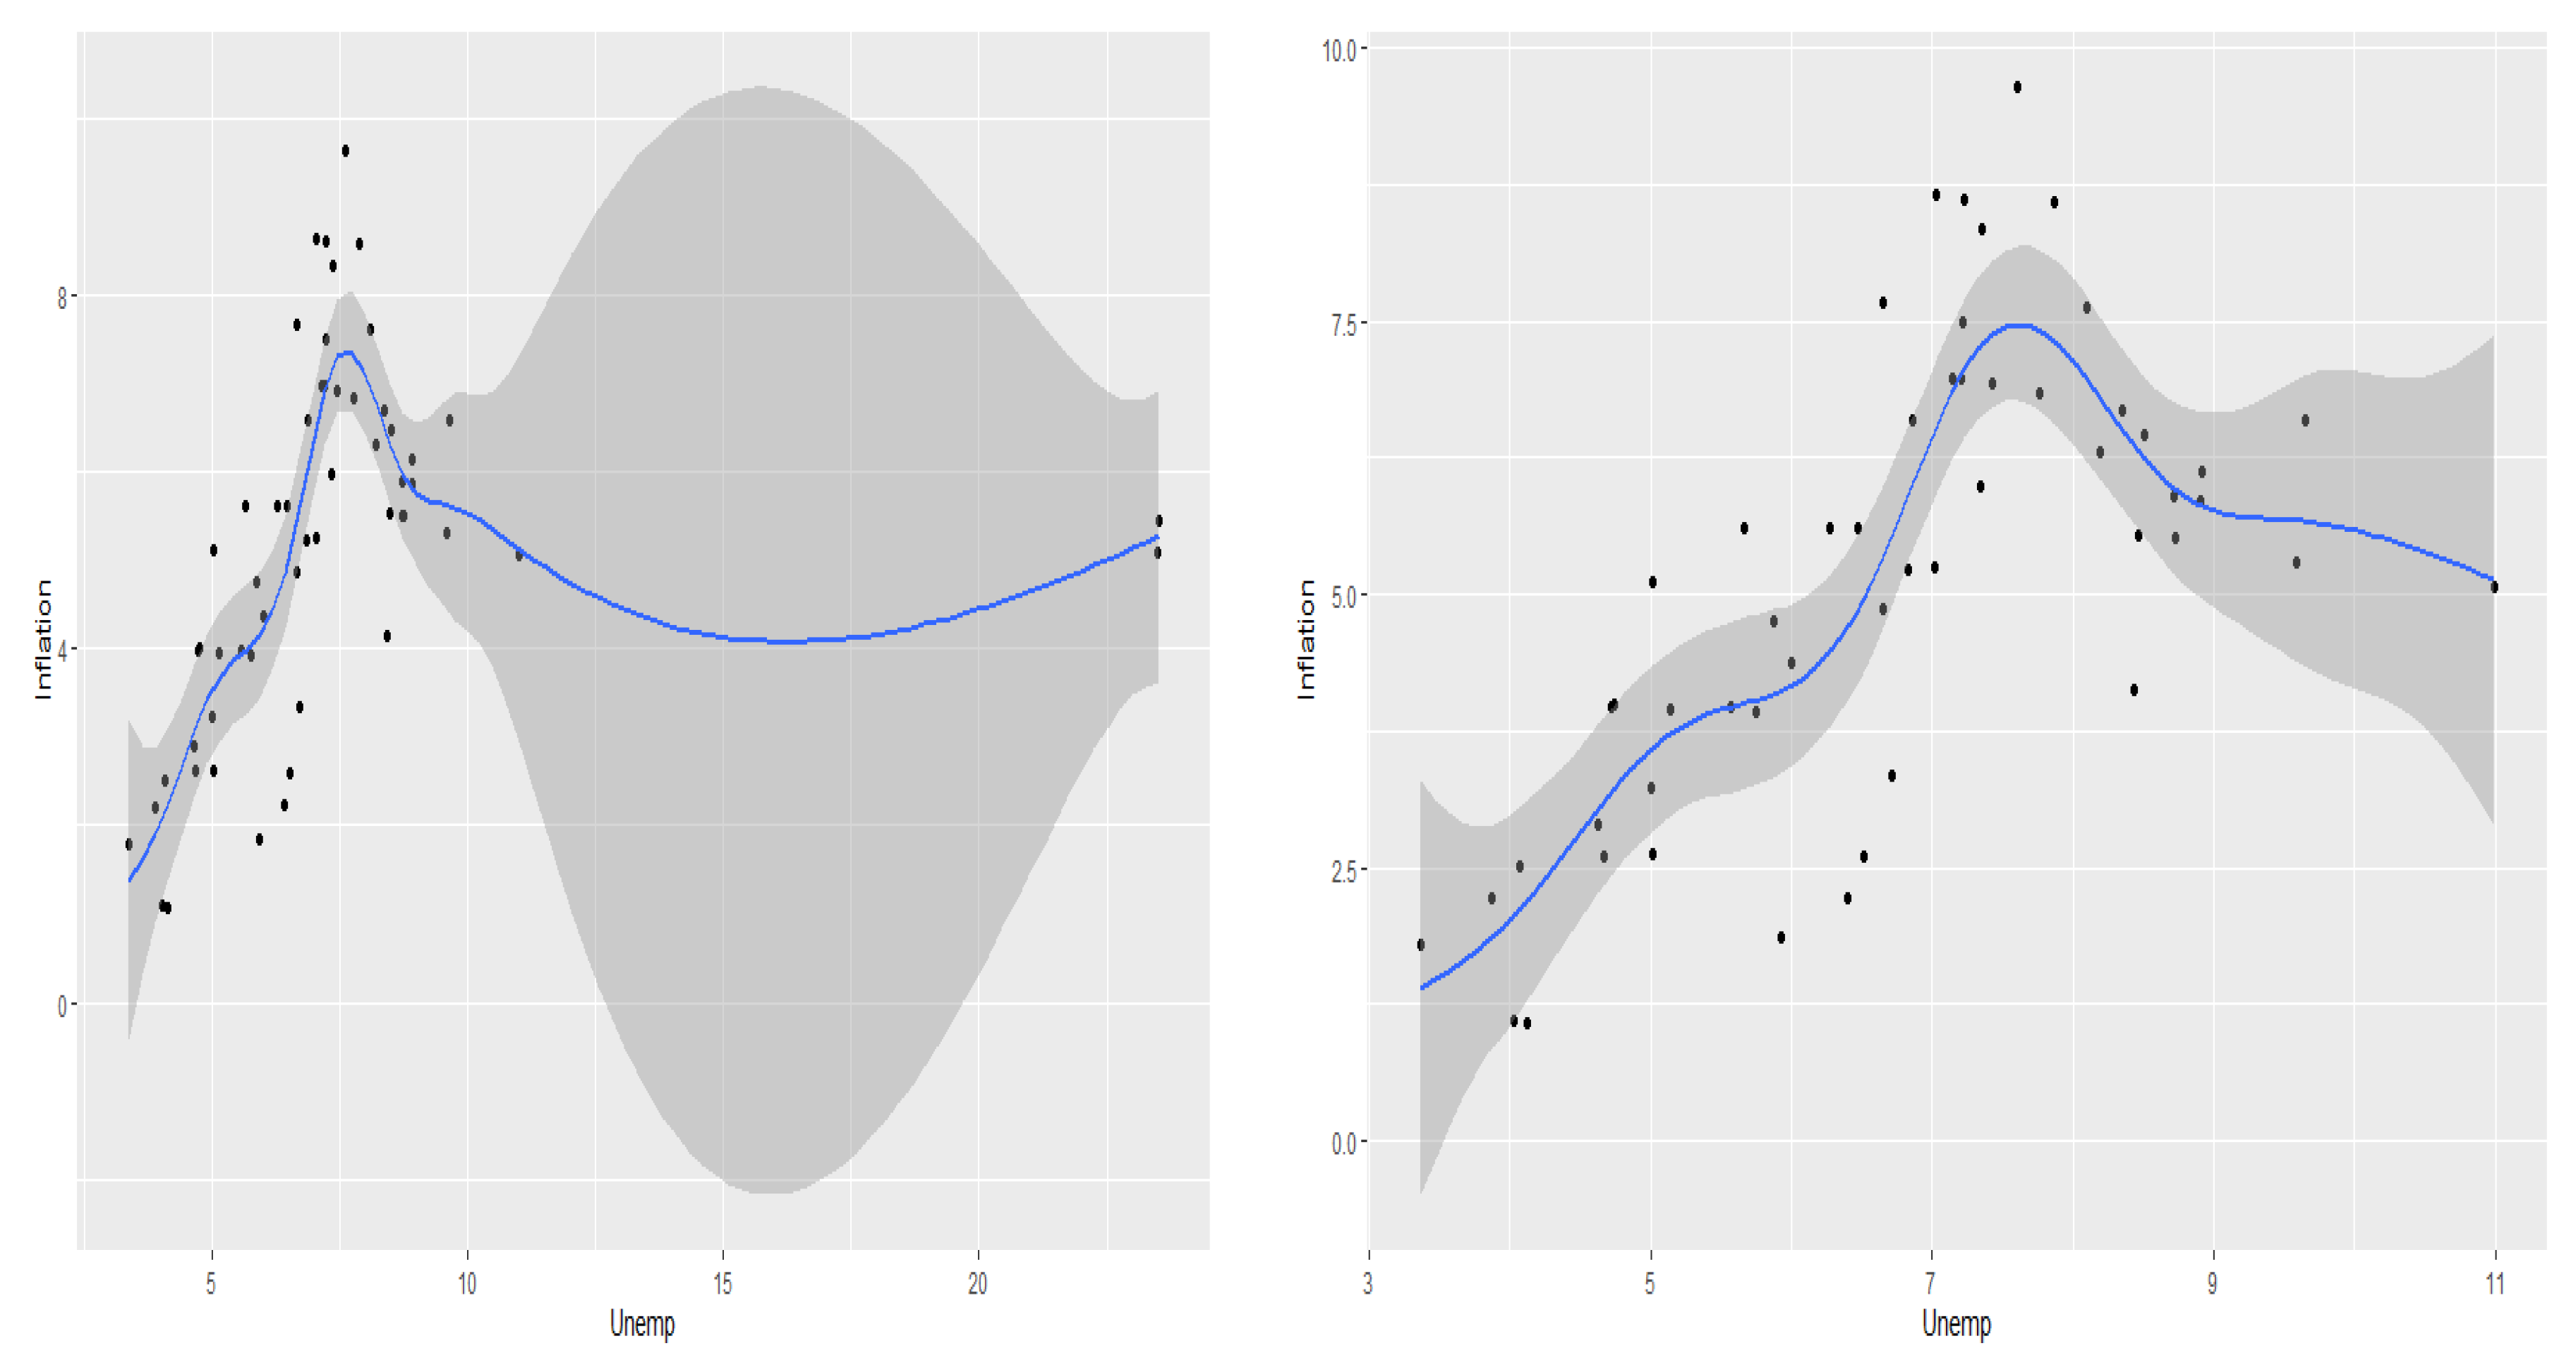
Figure 5 shows the smooth curve fitted for India before and after outlier removal. The rising trend in the curves indicates a stagflationary trend in the economy. The extreme outliers from the lockdown period were retained in the first model and removed in the second one to see the changes in the relationship between the variables specifically. The standard error in Figure 5 increases abnormally after a point due to extreme outliers in the model. The figure on the right side gives a closer look at the model without outliers. The smooth curve fitted provides a clear indication of a positive relationship between inflation and unemployment in the initial phase. The falling portion of the curve reflects the trade-off between the variables. However, the data at hand is not enough to confirm whether this falling trend exhibits the inflation unemployment trade-off, as stipulated by Phillips curve theory.
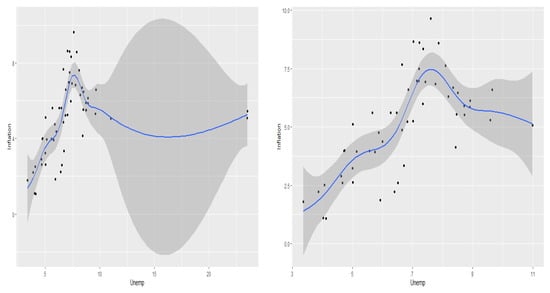
Figure 5.
Smooth function of India (before and after outlier removal).
The significance of the smooth terms and the coefficient of determination are further investigated to understand inflation and unemployment dynamics in both countries. Regression results are given in Table 2. The first part provides the results for the parametric coefficient, which is just the intercept term here. The second part shows the results for the smooth components (unemployment). The statistically significant practical degrees of freedom values given in Table 1 indicate the non-linearity in the relationship between inflation and unemployment for both countries. The edf coefficient of 8.049 for India before outlier removal implies that the curve appears to be wigglier than the case of the UK. However, a slight improvement in edf is seen after outlier removal (7.145). The adjusted R squared is 0.68 for India before and after outlier removal and 0.67 for the UK. The deviance explained is above 70 percent for all three models.

Table 2.
Approximate significance of smooth terms of the robust Generalized Additive Model (GAM).
The diagnostic plots for the models are analyzed to check the reliability of the models.
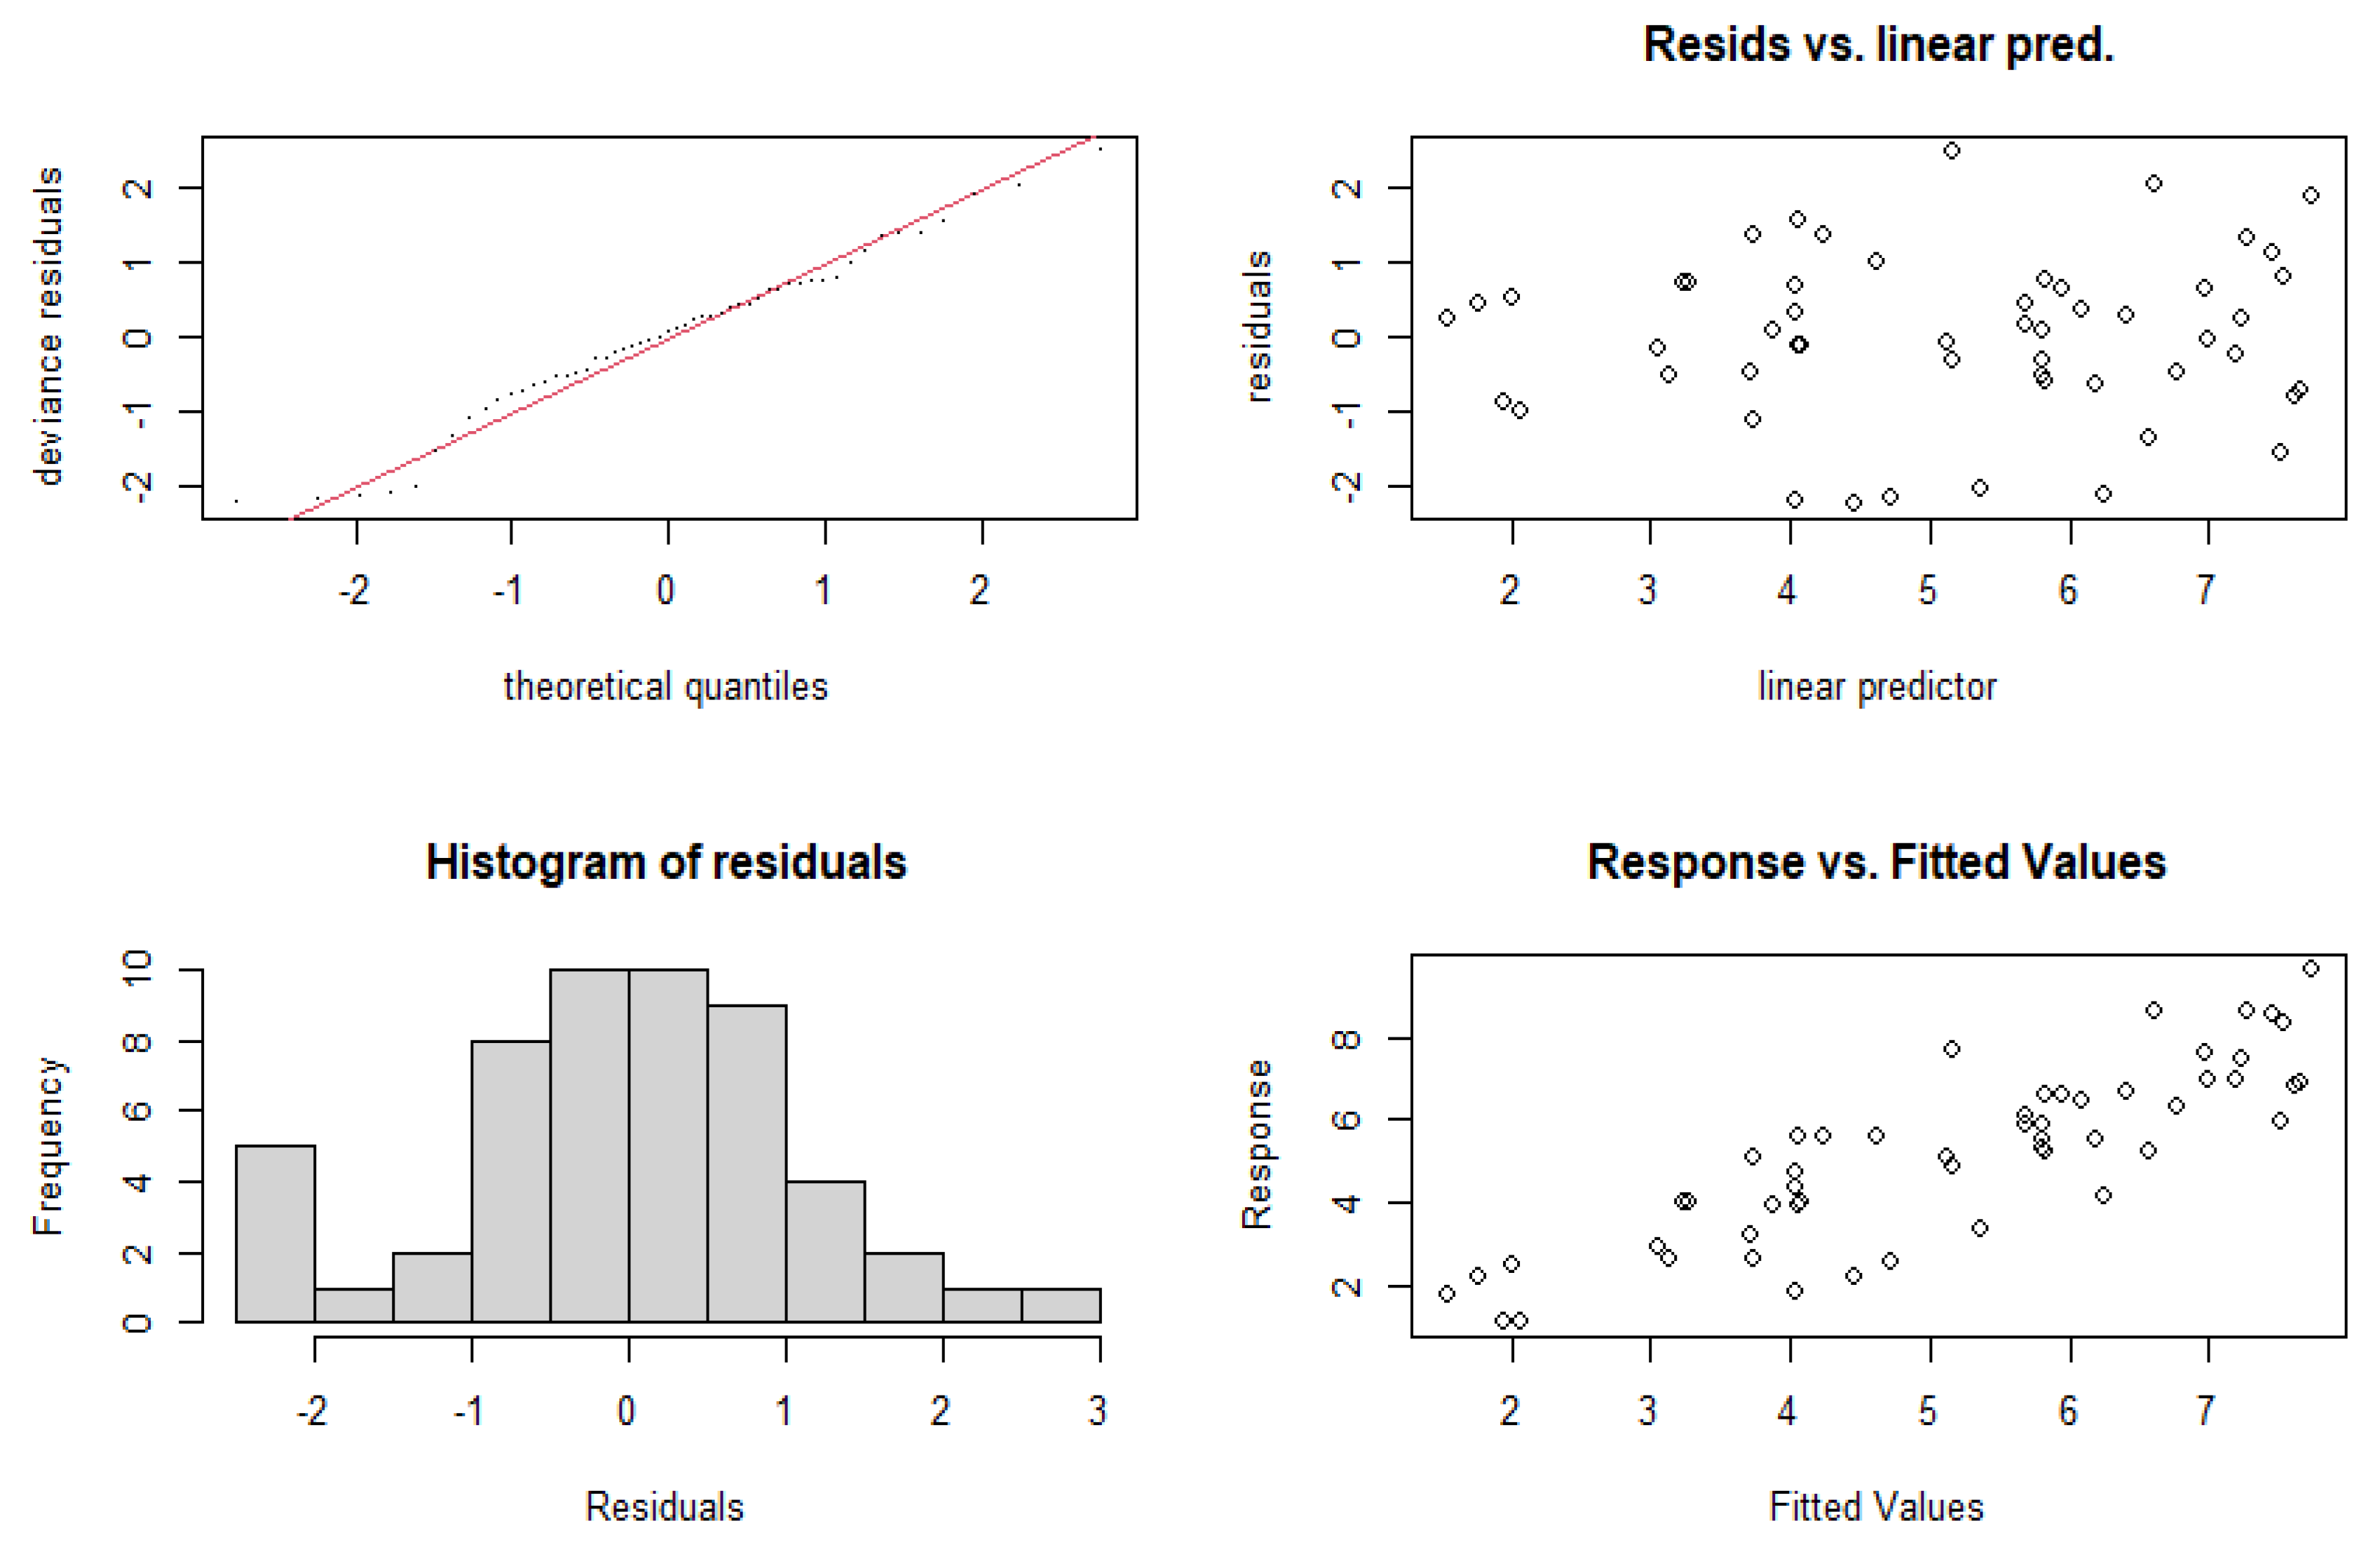
The residual plots for all three models indicate that the models are relatively stable and reliable. While the normality plot for the UK shows a slight deviation, the results are not significantly affected. For India, both models’ residual plots seem to be fairly regular, indicating that the variance due to the presence of outliers in the data was also well accounted for. These residual diagnostic plots are included in Appendix A.
5. Discussion and Policy Recommendations
5.1. Recession to Stagflation or Deeper Recession?
Based on India’s model, a positive relationship between inflation and unemployment could be seen for the study period. This is evident from the upward rising portion of the curve. This indication of a different result, as compared to the existing evidence that established the Phillips curve prior to 2010 in India (Paul 2009; Singh et al. 2010), should be read along with the significant changes that happened in the economy. The reason for this positive relationship in the short-run could be primarily attributed to the twin blows, the demonetization policy of 2016 and the Goods and Services Taxes (GST) of 2017. Ironically, GST was introduced even before the economy could recover from the demonetization’s adverse impacts (Mishra et al. 2020). As Paul (2009) elaborated, the existence of supply shocks, like the present situation, led to the disappearance of the Phillips Curve. Several reports already stated that the Indian economy was staring at stagflation in the wake of the second half of 2019 (Khanna 2020; Perumal 2020). The latest GDP estimates for the second quarter of 2020 reveals a significant decline of 23.9 percent. As per the estimates of CMIE, around 121 million jobs were also lost from the second half of 2019 to July 2020. While the average total stimulus package, including fiscal and liquidity measures for G20 countries, was around 12.1 percent of GDP, India’s total fiscal stimulus was only 1.7 percent of the total GDP (Chidambaram 2020).
In the UK, the relationship between inflation and unemployment, as determined by the model, signifies the existence of a short-run trade-off. In advanced economies like the UK prior to 2009, Osmerod et al. (2013) stated that the short-run relationship was unstable as it shifted with time. It is apparent that with the new policy initiative, the economy moves to a more severe recession. The fall in aggregate demand plays a crucial role in pushing the economy to an inflation–unemployment trade-off in the short run. The outbreak of the COVID-19 pandemic makes the situation worse. However, the impact is viewed differently in India and the UK. Predictive works on the effects of Brexit have concluded that the economy is bound to experience negative effects depending on the nature of future UK–EU relations (Tetlow and Stojanovic 2018). The economy has now come under the pressure of a recession following the lockdown induced by the pandemic (The Guardian 2020). This section may be divided by subheadings. It should provide a concise and precise description of the experimental results, their interpretation, as well as the experimental conclusions that can be drawn.
The results of the analysis have shown that India has positive inflation–unemployment dynamics, while the UK has negative inflation–unemployment relationship consistent with Phillips’ theory. We observe a change in the dynamics in both countries in comparison to existing works based on data prior to 2010. These changes can be, to a large extent, attributed to policy changes introduced in both countries since 2016.
5.2. Addressing the Supply Side or Demand Side
The pandemic’s outbreak has brought simultaneous supply and demand-side crises (Loayza and Pennings 2020). Since the Indian economy mainly relies on consumption-driven growth and service sector jobs, any adverse shocks affecting these two factors will negatively affect the economy. These areas are the first and immediate targets of any pandemic, as both demand and supply-side factors are heavily impacted. Any decline in demand through the fall in consumption expenditure will have a substantial negative impact on the economy, resulting in a reverse multiplier effect having both short and long-run implications.
The supply-side factors play a crucial role in determining the inflation–unemployment trade-off in India. Unlike the UK economy where aggregate expenditure plays a key role, in countries like India the supply constraints influence the price level in the short run. Factors such as crude oil prices, the supply of primary food articles, input costs, etc., have a direct bearing on the price level, leading to the condition of inflation persistence (Dev and Sengupta 2020). The results indicate that government intervention following the twin blows of demonetization and the introduction of GST aimed at putting the economy back on track has pushed the economy into rapid inflation–unemployment trade-off. But the trade-off has weakened over time due to inflation persistence, rising unemployment and inflation in the economy (Stagflation).
5.3. The Current Crisis and Building New Economic Models
The COVID-19 pandemic has brought a severe recessionary trend in both economies. Over time, the fall in GDP growth rate (or the increase in the unemployment rate) is observed with a rising price level (high inflation rate) in the Indian economy. This signifies the prevalence of stagflation due to inflation persistence caused by adverse supply shocks. However, the situation is different in the UK as the recession became more severe due to adverse demand shocks. The conventional demand management policies may not be useful during the current crisis as supply and demand-side factors have been simultaneously affected (Loayza and Pennings 2020).
Similarly, supply-side economics cannot be expected to revive the economy in the immediate future. The economies may move towards a ‘Great recession’ in the imminent future. Thus, we suggest a Time Horizon based Recovery Plan’ to safeguard the economies from falling into stagflation or deeper recession. It is expected to enable policymakers to choose the right mix of policy tools to bring the economy back to the recovery path in the shortest possible time.
The policy measures adopted by the governments to tackle such a crisis need not be the same. For instance, in the Indian context, the government needs to undertake an aggressive direct spending strategy to keep the consumption demand high, which will give a fillip to the production sector. Capacity building can be focused on in the medium (intermediate) term. However, in advanced economies like the UK, the supply side is inherently strong, and along with an increase in aggregate demand, the recovery process will automatically begin. Thus, the short and medium-term policies can be clubbed to ensure faster recovery and long-term stability. As an immediate response to the pandemic, most advanced economies, including the UK, announced oversized stimulus packages to push the aggregate demand. For instance, the initial packages announced in the US, UK and Australia were 9.8, 16.6, 18.8 percent of GDP, respectively, whereas, for India, it was only 0.9 percent of GDP. India also announced more oversized packages eventually; however, inadequate measures to transfer the income directly to the beneficiaries like marginal farmers and migrant workers would sustain the recessionary trend for longer.
In such a scenario, the path ahead for a fast-growing economy like India must be time-bound, based on three terms—Relief (Short Term), Recovery (Intermediate), and Reform (Long Term). Such a model will highlight the focal points with a linkage effect to bring the economy back to its long-run equilibrium path. The existing model has inherent constraints as it neglects the intermediate-term. The linkage among short-medium-long terms is missing, and the policies pay full attention to fiscal stimuli, monetary infusion and monetary reliefs. These policies are indispensable in ensuring short term stability and setting the path for bouncing back to normalcy. However, unless the supply side issues are addressed by assigning equal weightage, the adverse outcomes can be generated with a long-run effect. By then, the introduction of reform measures may be of less benefit to the economy, taking into account the changing macroeconomic environment and time lag associated with these policies (Chaudhary et al. 2020). It makes these policies less effective or counterproductive in some cases.
5.4. Time Horizon Based Recovery Path for India and the UK
A closer analysis would reveal that the Indian economy needs a focused path of planning and implementation to overcome the dangers of a deep recession. The problem could be aggravated in the wake of stagflationary trends (attributed to the persistent inflation with rising unemployment). The immediate response of the policymakers and the government to a situation like a pandemic is often through the macroeconomic policies, focusing only on the short-term relief without accounting for the long-term adverse consequences. Since it is a war-like situation affecting the demand and supply sides simultaneously, a multi-prong approach is essential, focusing on the relief, recovery and reform paths connected to short, intermediate and long term, respectively.
Short Term Relief Measures: The government’s aggressive direct spending enhances the purchasing power of people. Thus, the transfer of benefits to the beneficiaries with no delay is crucial. Most studies reveal that output responds positively to increased government spending and short-term multipliers are higher for spending changes than tax changes. Further, most studies prove that long-term multipliers are smaller than short-term multipliers (Hemming et al. 2002). It indicates the need to focus on short-term spending and tax-related policies to recuperate, irrespective of the structure and development level.
Intermediate/Medium Term Recovery Measures: In countries like India, these policies include building up the health infrastructure, structural changes, and Micro, Small, Medium Enterprises (MSMEs), enhancing the working capital needs of entrepreneurs to set the base for the recovery process. Some of these measures may not be equally applicable to advanced economies like the UK due to high capacity and infrastructure strength. Thus, the relief and recovery measures can be clubbed into measures aiming at stabilizing the economy.
Long Term Reform: Currently, in the Indian context, the structural changes have been planned and implemented over a long time and this has failed to bring expected outcomes in a time-bound manner. For all the economies, the macroeconomic policies need to be streamlined to adjust the liquidity position and fiscal consolidation targets in the long run. Similarly, the policies related to foreign trade and foreign investment should be reworked, keeping in mind newer opportunities and long-run stability. Additionally, it is said to be a suitable time to make changes in the global supply chains. Especially for the UK, it is an opportunity to rebuild strategic partnerships after Brexit. Table 3 shows that India’s existing model does not account for the strategies falling between short and long-terms (referred to as intermediate or medium-term). Thus, it fails in addressing the stability of the economy in the long run. We suggest an alternative model, emphasizing the need to carefully select the short, intermediate, and long-term policies to fight the potential dilemmas emerging out of the pandemic. However, the short and medium-term measures could imply a recovery process for the UK since the economy has a more robust supply side. This enables the economy to strengthen aggregate demand and focus on the reform measures for long-term sustainability. It means that the pandemic’s adverse impact on the output could be temporary and corrective measures of short and medium terms could bring positive outcomes.

Table 3.
Time horizon based recovery plan: existing and proposed model for India.
Compensatory and relief packages for informal workers, small entrepreneurs, and traders have been highlighted in most countries’ economic packages. For India, the vast geographical expanse and the demographic factors leave with a natural advantage, which takes care of the demand side to a great extent. The government could use successful income transfer programs like MGNREGA and PM KISAN to double the wages and raise consumption levels. Cash transfers have been extensively used in the context of advanced economies, but restricted for developing countries (Loayza and Pennings 2020). However, the existence of mechanisms such as Unique Identification Number (Aadhar) ensures the effective transfer of benefits. Since lower-income groups’ propensity to consume is much higher, such measures will keep the spending at satisfactory levels. The announcements relating to deferring taxes for some industries like aviation, hospitality and small companies, which have been most hurt by the lockdown, could be a medium-term measure.
On the contrary, for advanced economies like the UK, aggregate demand fluctuations would create cyclical waves, pushing the economy into recession. As shown in Table 4, the demand side constraints can be addressed through a combination of monetary and fiscal measures. The initial fiscal measures related to taxes and government spending, like the additional funding for the NHS, public services and charities, measures to support businesses, and strengthening the social safety net to support vulnerable people, highlight the emphasis on direct spending. Cash transfers as an option remain unexplored in previous models. However, they have been extensively used in developed economies since the pandemic (Loayza and Pennings 2020), making them an essential tool for short-term recovery. Similarly, the monetary measures include the reduction of Bank Rate by 65 bps, expanding the central bank’s holding of UK government bonds and non-financial corporate bonds, introducing a new Term Funding Scheme to reinforce the transmission of the rate cut, additional incentives for lending to the real economy (especially SMEs) and reducing the UK countercyclical buffer rate to zero percent from a pre-existing path toward 2 percent by December 2020.

Table 4.
Time horizon based recovery plan: existing and proposed model for the UK.
6. Summary and Conclusions
It is critical for all types of economies to evolve sustainable strategies for resource mobilization in the long-term. Our analysis highlights the inflation–unemployment dynamics from the time of newer policies in India and the UK by 2016, amidst recessionary signals. The results indicate that the recession had given way to India’s stagflation due to the dominance of adverse supply shocks. The recession intensified due to dominance of adverse demand shocks in the UK. The situation worsened due to the outbreak of the pandemic and continued lockdowns, pushing the economies of India and the UK to stagflation and deeper recession, respectively. The conventional demand management policies’ exclusive application may not be useful during such a crisis simultaneously affecting the supply and demand-side factors (Loayza and Pennings 2020). Thus, the monetary and fiscal policies would make themselves partially ineffective creating gaps among short, medium and long-term measures.
The results underline the importance of evolving need-based policies, as per the economy’s structure and condition. It is believed that the total direct cash transfers during the COVID-19 need to be to the tune of at least 10–15 percent of GDP with successive stimulus packages in the short period, irrespective of the structure of the economy. Nevertheless, we argue that more than the volume, a well carved-out path is essential to safeguard the economy, moving from recession to stagflation or deeper recession and to ensure long term stability. Though the policy measures may differ across short, medium and long terms, based on the nature of the economies, a time horizon-based path and the linkage effect would help the economy face similar crises in the future and address adverse demand and supply shocks simultaneously.
The study’s findings provide evidence to argue that case-specific and need-based interventions are critical for developing a recovery strategy for exogenous and unanticipated shocks like the pandemic. The findings further imply that policy measures must integrate different time periods to benefit from linkages, while optimizing fiscal allocations and minimizing adverse effects. This study, however, also has limitations concerning the generalizability of results to other economies. It must be noted that it concerns specific cases of India and the UK. These economies were already facing the adverse consequences of policy-induced shocks that had set them into recession even before the pandemic.
Further, it is restricted to a short-term analysis of the time period and does not provide evidence regarding long-term inflation–unemployment dynamics. Therefore, it cannot contribute to the debate regarding the differences in inflation–unemployment trade-offs during the long and short time periods. Future studies in this area can extend the time period of analysis to examine the long-run relationship. Another stream of research can empirically examine the inflation–unemployment dynamics and policy interventions based on the suggested term-structure model.
Author Contributions
Conceptualization—J.J.K., V.V.; Methodology—V.V., S.L., D.F.M.; Software—V.V.; Validation—V.V., S.L., D.F.M.; Formal Analysis—V.V.; Investigation—J.J.K., S.L., V.V.; Writing—Original Draft Preparation—S.L., J.J.K., V.V., D.F.M.; Writing—Review and Editing—D.F.M., J.J.K., S.L., V.V.; Supervision—D.F.M.; Project Administration—D.F.M., J.J.K. All authors have read and agreed to the published version of the manuscript.
Funding
This research received no external funding.
Data Availability Statement
Publicly available datasets were analyzed in the study. Data for inflation and unemployment in India was accessed from http://mospi.nic.in/cpi (accessed on 5 January 2021) and https://unemploymentinindia.cmie.com/ respectively (accessed on 5 January 2021). Data for inflation and unemployment in UK was accessed from https://www.ons.gov.uk/economy/inflationandpriceindices (accessed on 5 January 2021) and https://www.ons.gov.uk/employmentandlabourmarket/peoplenotinwork/unemployment (accessed on 5 January 2021) respectively.
Conflicts of Interest
Authors declare no conflict of interest.
Appendix A
The residual diagnostic plots for all the three models have been included in this appendix.
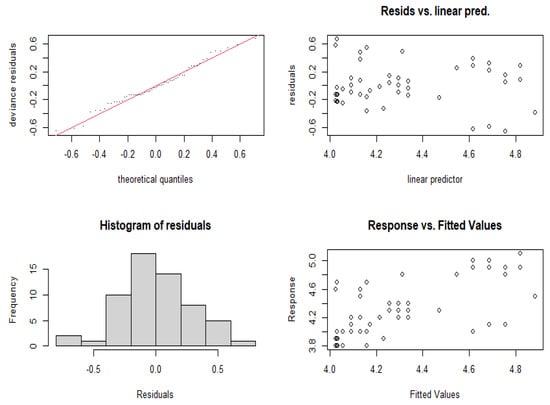
Figure A1.
Residual diagnostic Plots for the UK.
Figure A1.
Residual diagnostic Plots for the UK.
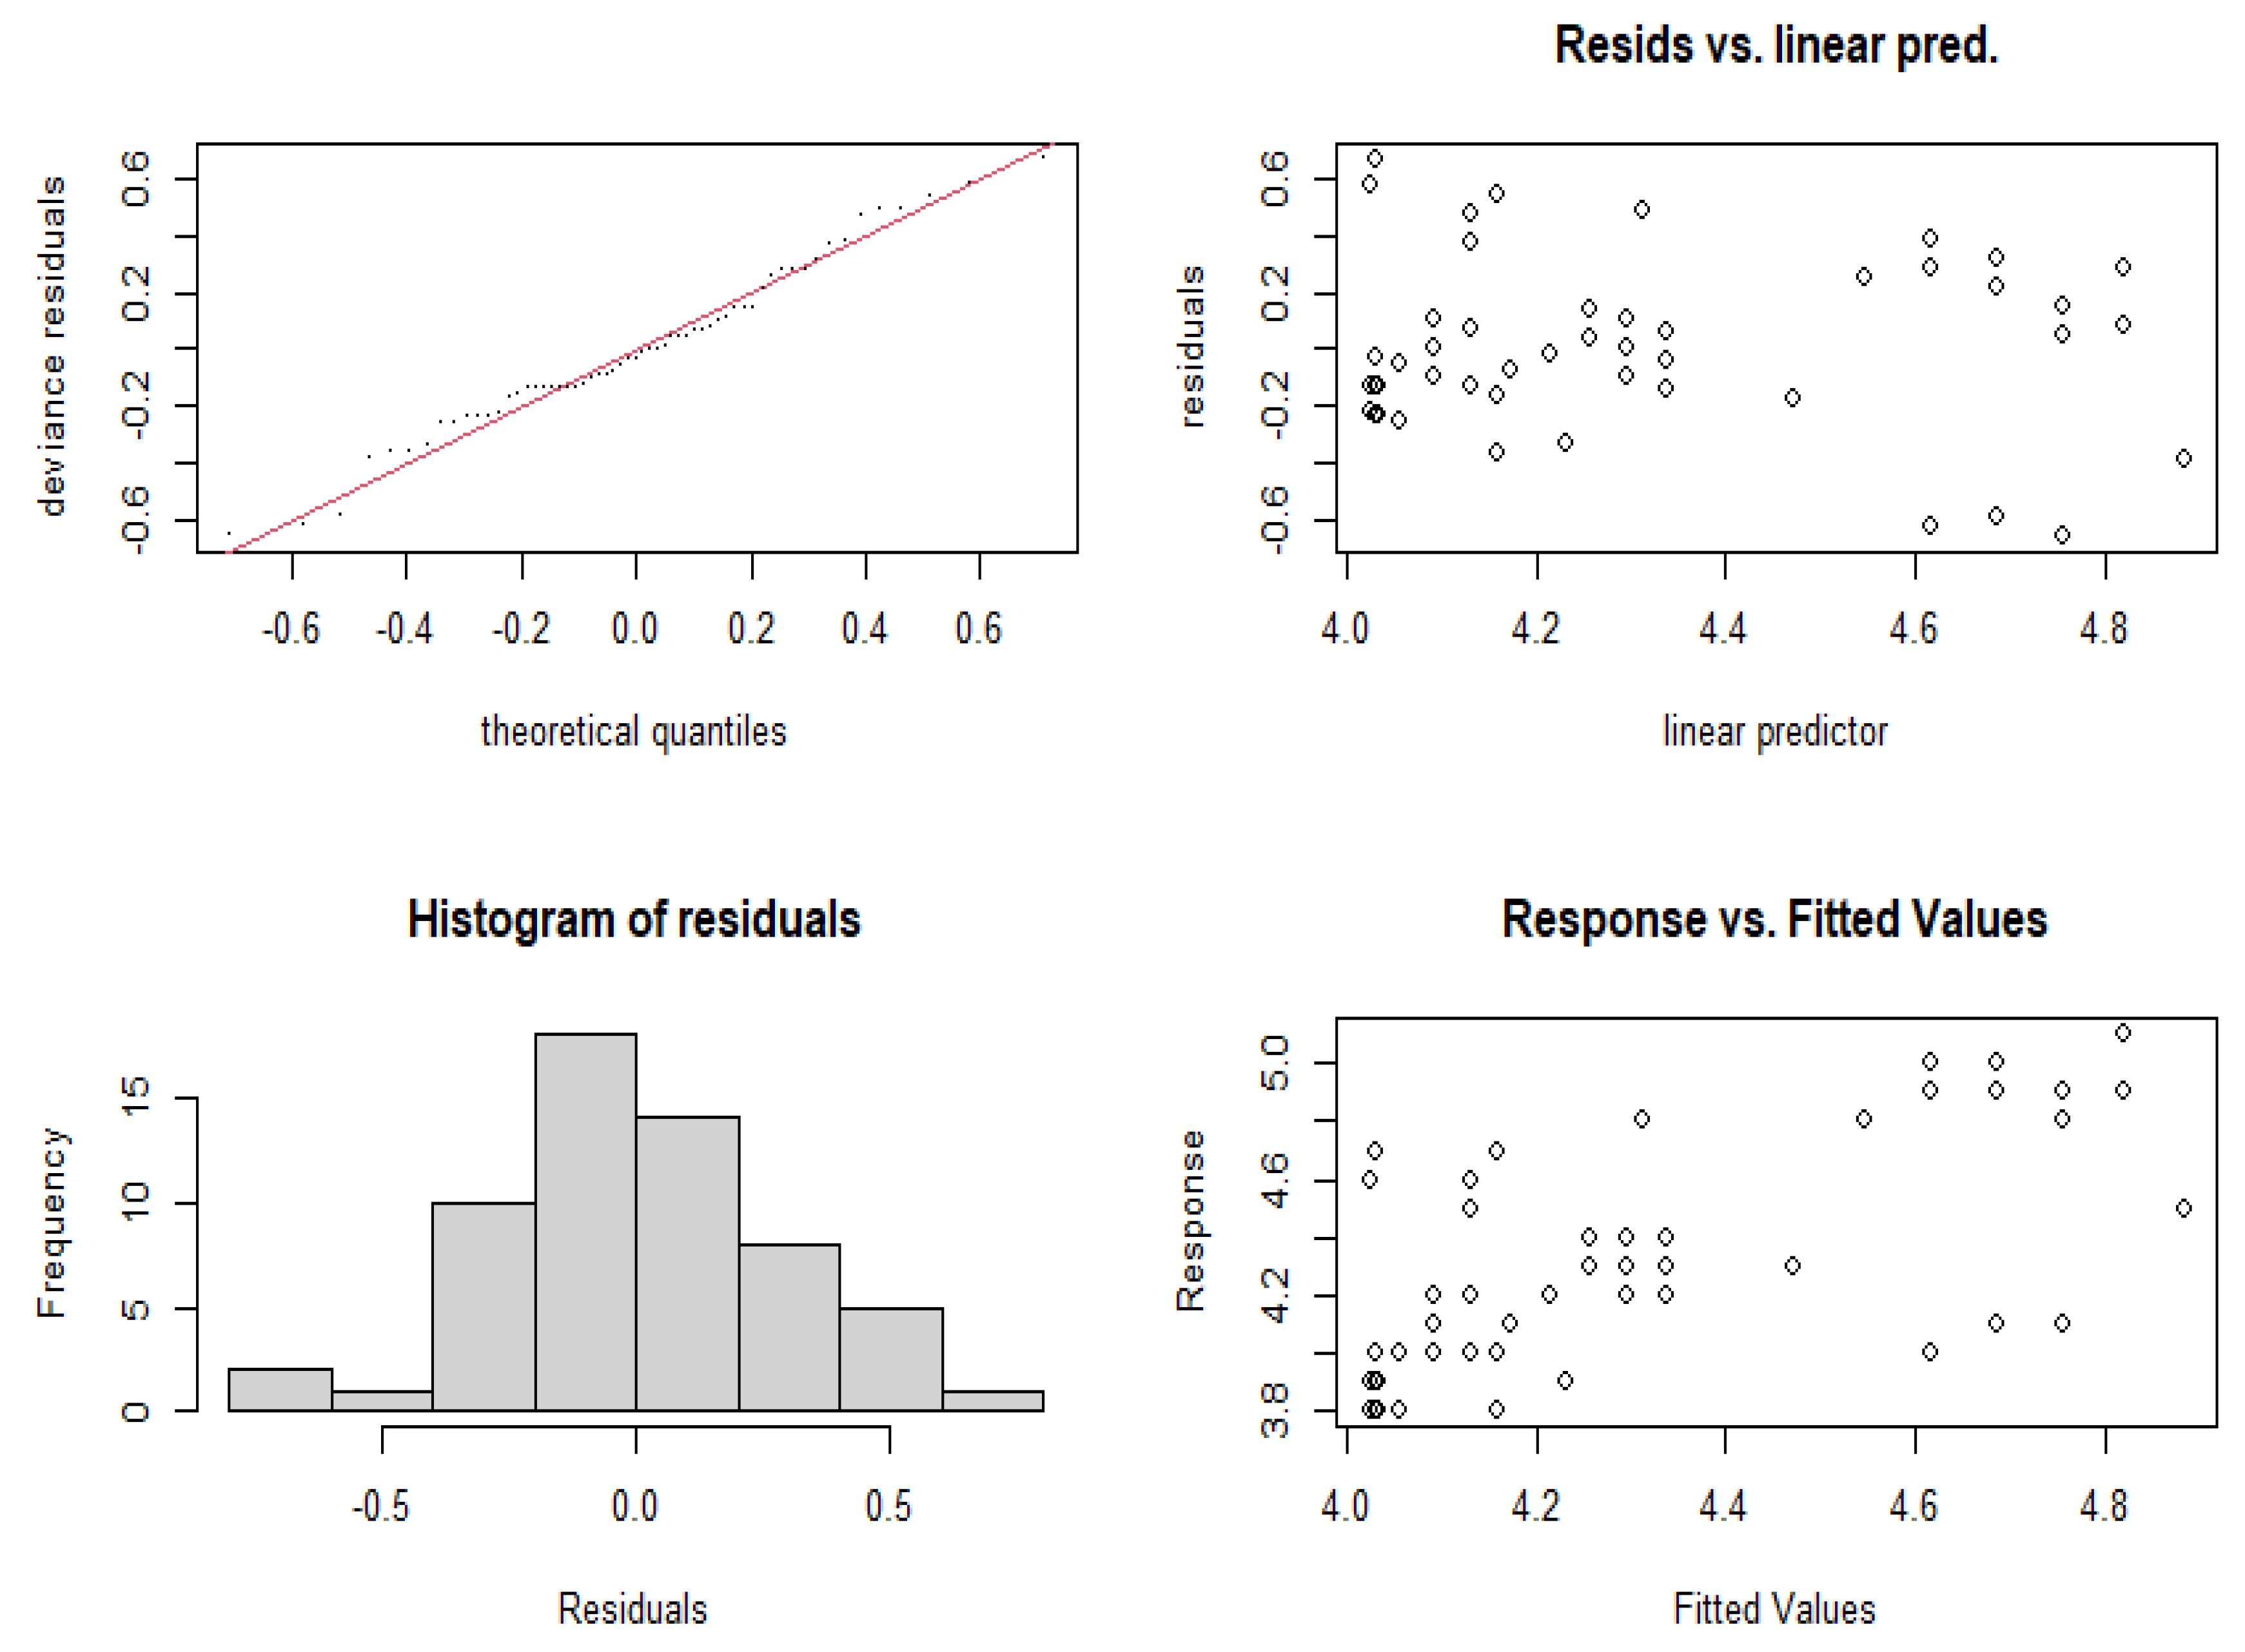
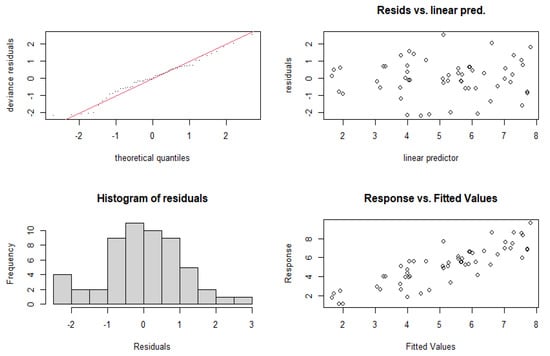
Figure A2.
Residual diagnostic Plots for India.
Figure A2.
Residual diagnostic Plots for India.
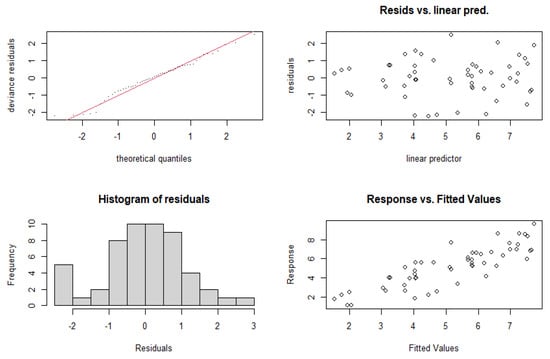
Figure A3.
Residual diagnostic Plots for India (Outliers Removed).
Figure A3.
Residual diagnostic Plots for India (Outliers Removed).
References
- Abdullahi, Muhammad Mustapha, Nor Aznin Bt Abu, and Sallahuddin B. Hassan. 2016. Debt Overhang versus Crowding Out Effects: Understanding the Impact of External Debts on Capital Formation in Theory. International Journal of Economics and Financial Issues 6: 271–78. [Google Scholar]
- Abu, Nurudeen. 2019. Inflation and Unemployment Trade-off: A Re-examination of the Phillips Curve and its Stability in Nigeria. Contemporary Economies 13: 21–34. [Google Scholar] [CrossRef]
- Ashwani, and Geethanjali Nataraj. 2019. Demonetisation in India: An Impact Assessment. Journal of Business Thought 9. [Google Scholar] [CrossRef]
- Baqaee, David, and Emmanuel Farhi. 2020. Supply and demand in disaggregated Keynesian economies with an application to the Covid-19 crisis (No. w27152). National Bureau of Economic Research. [Google Scholar] [CrossRef]
- Bax, Dane, Temesgen Zewotir, and Delia North. 2021. Appraising Residential Property using Hierarchical Generalised Additive Models. Journal of Property Research. [Google Scholar] [CrossRef]
- Begg, Iian, and Fabian Mushove. 2016. The Economic Impact of Brexit: Jobs, Growth and Public Finances. London School of Economics. Available online: http://eprints.lse.ac.uk/67008/1/Hearing-11---The-impact-of-Brexit-on-jobs-and-economic-growth-sumary.pdf (accessed on 26 January 2021).
- Behera, Harendra, Garima Wahi, and Muneesh Kapur. 2017. Phillips Curve Relationship in India: Evidence from State-Level Analysis. RBI Working Paper Series No. 8. Available online: https://mpra.ub.uni-muenchen.de/80737/1/MPRA_paper_80737.pdf (accessed on 11 December 2020).
- Benati, Luca. 2015. The long-run Phillips curve: A structural VAR investigation. Journal of Monetary Economics 76: 15–28. [Google Scholar] [CrossRef]
- Bhatt, Rajiv Kumar. 2010. Recent Global Recession and Indian Economy: An Analysis. International Journal of Trade, Economics and Finance 2: 212–17. [Google Scholar] [CrossRef]
- Bhattarai, Keshab. 2017. Impacts of GST Reforms on Efficiency, Growth and Redistribution of Income in India: A Dynamic CGE Analysis. Available online: https://mpra.ub.uni-muenchen.de/92139/1/MPRA_paper_92139.pdf (accessed on 20 December 2020).
- Brianca, Pedro, Joao Durte, and Miguel Faria-e-Castro. 2020. Is the COVID-19 Pandemic a Supply or a Demand Shock? In Economic Synopses. St. Louis: Federal Reserve Bank of St. Louis. [Google Scholar]
- Business Line. 2019. Demonetisation, Faulty GST Implementation behind the Slowdown, Says Manmohan Singh. Business Line. Available online: https://www.thehindubusinessline.com/economy/demonetisation-faulty-gst-implementation-behind-the-slowdown-says-manmohan-singh/article29394026.ece (accessed on 11 December 2020).
- Chaudhary, Monika, P. R. Sodani, and Shankar Das. 2020. Effect of COVID-19 on Economy in India: Some Reflections for Policy and Programme. Journal of Health Management 22: 169–80. [Google Scholar] [CrossRef]
- Chidambaram, Perumal. 2020. The Worst Affected Economy. The Indian Express. Available online: https://indianexpress.com/article/opinion/columns/india-economy-slowdownactofgodpchidambaram6584615/#:~:text=The%20provisional%20estimates%20of%20GDP,in%20the%20last%2012%20months (accessed on 16 January 2021).
- Clausen, Jens R., and Bianca Clausen. 2010. Simulating Inflation Forecasting in Real-Time: How Useful is a Simple Phillips Curve in Germany, the UK, and the US? IMF Working Paper No. 10/52. Available online: https://ssrn.com/abstract=1562420 (accessed on 15 December 2020).
- Dasgupta, Dipak, and Abhijit Sen Gupta. 2010. India: Rapid Recovery and Stronger Growth. In The Great Recession and Developing Countries. Edited by Mustapha K. Nabli. Washington: The World Bank. [Google Scholar] [CrossRef]
- Dev, Mahendra, and Rajeswari Sengupta. 2020. Covid-19: Impact on the Indian Economy. Working Paper. Indira Gandhi Institute of Development Research. Available online: http://www.igidr.ac.in/pdf/publication/WP-2020-013.pdf (accessed on 14 January 2021).
- Dey, Soumik. 2019. Five factors that worsened the economic slowdown. The Week. Available online: https://www.theweek.in/news/biz-tech/2019/09/03/five-reasons-that-worsened-the-economic-slowdown.html (accessed on 21 January 2021).
- Dhingara, Swati, Stephen Machin, and Henry Overman. 2017. Local Economic Effects of Brexit. National Institute Economic Review 242: R24–36. [Google Scholar] [CrossRef]
- Dodd, D. 2020. Corona Virus Shrinks UK Economy by a Fifth. The Financial Times. Available online: https://www.ft.com/content/38234084-6dde-4834-a40d-29bd0d1c28cf (accessed on 24 January 2021).
- Donayre, Luigi, and Irina Panovska. 2018. U.S. Wage Growth and Non-Linearities: The Roles of Inflation and Unemployment. Economic Modelling 68: 273–92. [Google Scholar] [CrossRef]
- Friedman, Milton. 1968. The role of monetary policy. American Economic Review 58: 1–17. [Google Scholar]
- Ghosh, Amber. 2017. Impact of Demonetisation on India: A Macro-theoretic Analysis. Trade and Development Review 9: 57–73. [Google Scholar]
- Guerrieri, Veronica, Guido Lorenzoni, Ludwig Straub, and Ivan Werning. 2020. Macroeconomic Implications of COVID-19: Can Negative Supply Shocks Cause Demand Shortages? (No. w26918). Cambridge: National Bureau of Economic Research. [Google Scholar]
- Giammetti, Raffaele. 2020. Tariffs, domestic import substitution and trade diversion in input-output production networks: An exercise on Brexit. Economic Systems Research 32: 318–50. [Google Scholar] [CrossRef]
- Hantzsche, Arno, Amit Kara, and Garry Young. 2018. The economic effects of the UK government’s proposed Brexit deal. The World Economy 42: 1–24. [Google Scholar] [CrossRef]
- Hastie, Trevor, and Robert Tibshirani. 1987. Generalised additive models: Some applications. Journal of the American Statistical Association 82: 371–86. [Google Scholar] [CrossRef]
- Hemming, Richard, Selma Mahfouz, and Michael Kell. 2002. The Effectiveness of Fiscal Policy in Stimulating Economic Activity-a Review of the Literature. Working Paper No. 02/208. Washington: International Monetary Fund. [Google Scholar]
- Ho, Sin-Yu, and Bernard Njindan Iyke. 2019. Unemployment and Inflation: Evidence of a Non-Linear Phillips Curve in the Eurozone. The Journal of Developing Areas 53. [Google Scholar] [CrossRef]
- International Monetary Fund. 2020a. World Economic Outlook Update. International Monetary Fund. Available online: https://www.imf.org/en/Publications/WEO/Issues/2020/06/24/WEOUpdateJune2020 (accessed on 17 January 2021).
- International Monetary Fund. 2020b. Policy Responses to COVID-19. International Monetary Fund. Available online: https://www.imf.org/en/Topics/imf-and-covid19/Policy-Responses-to-COVID-19 (accessed on 21 January 2021).
- Jahan, Mahmud, Ahmed Saber Mahmud, and Chris Papageorgiou. 2014. What Is Keynesian Economics? Washington: International Monetary Fund, vol. 51. [Google Scholar]
- Khanna, Kavita V. 2020. India is Now in Classic Stagflation Territory. The Wire. Available online: https://thewire.in/economy/india-gdp-slowdown (accessed on 18 January 2021).
- Köhn, Sebastian. 2008. Generalised Additive Models in the Context of Shipping Economics. Master’s Thesis, University of Leicester, Leicester, UK. [Google Scholar]
- Kumar, Raj, and Pankaj Vashisht. 2009. The Global Economic Crisis: Impact on India and Policy Responses. Asian Development Bank Institute: Available online: https://www.adb.org/sites/default/files/publication/156019/adbi-wp164.pdf (accessed on 19 December 2020).
- Lenoël, Cyrille, Rory Macqueen, and Garry Young. 2020. Prospects for the UK economy. National Institute Economic Review 252: F10–43. [Google Scholar] [CrossRef]
- Loayza, Norman V., and Steven Pennings. 2020. Macroeconomic Policy in the Time of COVID-19: A Primer for Developing Countries. The World Bank: Available online: https://pdfs.semanticscholar.org/743b/8cc6b118771cc8a0621931851b6d456b49e0.pdf (accessed on 15 January 2021).
- Lokare, Shasidhar M. 2014. Re-emerging Stress in the Asset Quality of Indian Banks: Macro-Financial Linkages. Reserve Bank of India Working Paper Series No.3. Available online: https://www.rbi.org.in/scripts/PublicationsView.aspx?id=15720 (accessed on 11 December 2020).
- Mayhew, Ken, and Paul Anand. 2020. COVID-19 and the UK Labour Market. Oxford Review of Economic Policy 36: S215–24. [Google Scholar] [CrossRef]
- Mazumder, Sandeep. 2011. The Stability of the Phillips Curve in India: Does the Lucas Critique Apply? Journal of Asian Economics 22: 528–39. [Google Scholar] [CrossRef]
- Mihailov, Alexander, Fabio Rumler, and Johann Scharler. 2011. The small open-economy new Keynesian Phillips curve: Empirical evidence and implied inflation dynamics. Open Economies Review 22: 317–37. [Google Scholar] [CrossRef]
- Mishra, Alok Kumar, Badri Narayan Rath, and Aruna Kumar Dash. 2020. Does the Indian financial market nosedive because of the COVID-19 outbreak, in comparison to after demonetisation and the GST? Emerging Markets Finance and Trade 56: 2162–80. [Google Scholar] [CrossRef]
- Nason, James M., and Gregor W. Smith. 2008. Identifying the new Keynesian Phillips curve. Journal of Applied Econometrics 23: 525–51. [Google Scholar] [CrossRef]
- Osmerod, Paul, Bridget Rosewell, and Peter Phelps. 2013. Inflation/unemployment regimes and the instability of the Phillips curve. Applied Economics 45: 1519–31. [Google Scholar] [CrossRef]
- Papanikolaou, Dimitris, and Lawrence D. W. Schmidt. 2020. Working Remotely and the Supply-Side Impact of COVID-19. (No. w27330). National Bureau of Economic Research: Available online: https://www.nber.org/papers/w27330 (accessed on 20 January 2021).
- Paul, Biru Paksha. 2009. In Search of the Phillips Curve for India. Journal of Asian Economics 20: 479–88. [Google Scholar] [CrossRef]
- Perumal, Prashanth. 2020. Is the Indian economy staring at stagflation? The Hindu. Available online: https://www.thehindu.com/business/Economy/is-the-indian-economy-staring-at-stagflation/article30595793.ece (accessed on 20 January 2021).
- Posch, Johanna, and Fabio Rumler. 2015. Semi-structural forecasting of UK inflation based on the hybrid New Keynesian Phillips curve. Journal of Forecasting 34: 145–62. [Google Scholar] [CrossRef]
- Phillips, Alban W. 1958. The relation between unemployment and the rate of change of money wage rates in the United Kingdom, 1861–1957. Economica 25: 283–99. [Google Scholar] [CrossRef]
- Pršlja, Katarina. 2019. Analysing Country-Specific GDP Growth in Europe with Additive Models. Master’s Thesis, University of Ljubljana, Ljubljana, Slovenia. Available online: https://core.ac.uk/download/pdf/187764441.pdf (accessed on 11 January 2021).
- PTI. 2017. Negative GST Impact on GDP Growth Majorly Emphasised: SBI Report. The Economic Times. Available online: https://cfo.economictimes.indiatimes.com/news/negative-gst-impact-on-gdp-growth-majorlyemphasizedsbireport/60455056#:~:text=Negative%20GST%20impact%20on%20GDP%20growth%20majorly%20emphasized%3A%20SBI%20report,PTI&text=India’s%20GDP%20growth%20was%20expected,than%20transient%2C%20says%20a%20report (accessed on 19 December 2020).
- PTI. 2019. India Headed for Slowdown; Modi Govt Left Economy in ‘Dire Straits’: Ex-PM Manmohan Singh. The Economic Times. Available online: https://economictimes.indiatimes.com/news/elections/lok-sabha/india/modis-5-years-mosttraumaticdevastatingshouldbeshownexitdoormanmohansingh/articleshow/69186098.cms?from=mdr (accessed on 16 December 2020).
- Reserve Bank of India. 2014. Annual Report 2013-2014. Available online: https://www.rbi.org.in/Scripts/AnnualReportPublications.aspx?year=2014 (accessed on 12 January 2021).
- Reserve Bank of India. 2017. Macroeconomic Impact of Demonetisation: A Preliminary Assessment. Available online: https://rbidocs.rbi.org.in/rdocs/Publications/PDFs/MID10031760E85BDAFEFD497193995BB1B6DBE602.PDF (accessed on 20 January 2021).
- Salunke, Bhavesh, and Anuradha Patnaik. 2019. Inflation Dynamics and Monetary Policy in India: A New Keynesian Phillips Curve Perspective. South Asian Journal of Macroeconomics 8: 144–75. [Google Scholar] [CrossRef]
- Samuelson, Paul, and Robert M. Solow. 1960. Analytical aspects of anti-inflation policy. The American Economic Review 50: 177–94. [Google Scholar]
- Sharma, Shantanu Nandan. 2019. Severe Slowdown: When Will the Indian Economy Recover and How? The Economic Times. Available online: https://economictimes.indiatimes.com/news/economy/indicators/severe-slowdown-when-will-the-indian-economy-recover-and-how/articleshow/72310684.cms (accessed on 29 January 2021).
- Sigauke, Caston. 2017. Forecasting medium-term electricity demand in a South African electric power supply system. Journal of Energy in Southern Africa 28. [Google Scholar] [CrossRef]
- Singh, B. Karan, A. Kanakaraj, and T.O. Sridevi. 2010. Revisiting the Empirical Existence of the Phillips Curve for India. Journal of Asian Economics 22: 247–58. [Google Scholar] [CrossRef]
- Tenzin, Ugyen. 2019. The Nexus Among Economic Growth, Inflation and Unemployment in Bhutan. South Asia Economic Journal 20: 94–105. [Google Scholar] [CrossRef]
- Tetlow, Gemma, and Alex Stojanovic. 2018. Understanding the Economic Impact of Brexit. Institute for Government. Available online: https://www.instituteforgovernment.org.uk/sites/default/files/publications/2018%20IfG%20%20Brexit%20impact%20[final%20for%20web].pdf (accessed on 29 January 2021).
- The Guardian. 2020. UK Economy Nears ‘Perilous Turning Point’ on Covid-19. The Guardian. Available online: https://www.theguardian.com/business/2020/sep/29/uk-economy-nears-perilous-turning-point-on-covid-19 (accessed on 18 January 2021).
- The Indian Express. 2020. India’s GDP Contracts by 23.9% in April-June Quarter. The Indian Express. Available online: https://indianexpress.com/article/business/economy/india-gdp-data-1st-quarter-live-updates-coronavirus-lockdown-6577361/ (accessed on 9 December 2020).
- The World Bank. 2020. Global Economic Prospects - Pandemic, Recession: The Global Economy in Crisis. The World Bank. Available online: https://openknowledge.worldbank.org/handle/10986/34710 (accessed on 21 December 2020).
- UNIDO. 2020. Coronavirus: The Economic Impact. United Nations Industrial Development Organization: Available online: https://www.unido.org/stories/coronavirus-economic-impact-10-july-2020 (accessed on 3 January 2021).
- Valtiala, Juho PIetari, Sami Ovaska, and Timo Sipiläinen. 2019. Investigating the Determinants of Finnish Agricultural Land Prices using Generalised Additive Model. In EAAE Seminar on Agricultural Land Markets- Recent Developments, Efficiency and Regulation. Berlin: European Association of Agricultural Economists. [Google Scholar]
- Vasanthagopal, R. 2011. GST in India: A Big Leap in the Indirect Taxation System. International Journal of Trade, Economics and Finance 2: 144–46. [Google Scholar] [CrossRef]
- Verma, Toran Lal, D. K. Nema, Rahul Pandagre, and Surendra Verma. 2020. Impact of Demonetisation, Goods and Service Tax & COVID-19 on Indian Economy. International Journal of Advanced Research 8: 189–200. [Google Scholar] [CrossRef]
- Vidya, C.T., and K.P. Prabeesh. 2020. Implications of COVID-19 Pandemic on the Global Trade Networks. Emerging Markets Finance and Trade 56: 2408–21. [Google Scholar] [CrossRef]
Publisher’s Note: MDPI stays neutral with regard to jurisdictional claims in published maps and institutional affiliations. |
© 2021 by the authors. Licensee MDPI, Basel, Switzerland. This article is an open access article distributed under the terms and conditions of the Creative Commons Attribution (CC BY) license (https://creativecommons.org/licenses/by/4.0/).

