Abstract
Maritime transport remains the main gateway to the global marketplace. Ocean ports are a central and necessary component in facilitating trade. Ports are essentially a channel of integration into the global economic system. Resourceful and well-connected container ports empowered by regular and consistent shipping services are key to reducing trade costs, including transport costs, connecting supply chains and supporting global trade. Consequently, port performance is an important factor that can influence countries’ trade competitiveness. However, for Africa, the ports are dilapidated, lack essential infrastructure, are congested and perform poorly. Africa’s shipping and ports do not always match global trends and standards. In light of this, this study seeks to assess Africa’s current port performance and test the relationship between Africa’s port performance and trade performance. Very few studies have attempted to investigate the impact of port performance on trade. Hence, it was worthwhile to study the impact of port performance on Africa’s trade. The study used panel data that covering the period 2005–2018. An ARDL panel technique was used for estimation purposes. Results showed that port performance positively affects trade. This study argues that African ports require expensive infrastructure to be able to compete successfully. Africa needs to pursue an intensive course of infrastructure development so as to maintain economic growth and improve port efficiency and trade competitiveness. At the moment, African ports are inefficient, and there is congestion partly because the ports cannot accommodate further expansion without serious investments.
1. Introduction
Ocean ports are a central and necessary component in facilitating trade. According to Ndlendle (2018), trade competitiveness requires governments and key stakeholders to see ports as facilitators of trade and integrators in the logistics supply chain. Over 90% of international trade moves via the sea, making ports and their hinterlands vital for global trade (Sok 2016; Fugazza and Hofman 2017; International Maritime Organization 2018; Jha 2019; Chelin and Reva 2020; SAIMI 2020; Heiland and Ulltveit-Moe 2020). Shipping is the lifeblood of the global economy, and without shipping, efficient intercontinental trade would simply not be possible (International Chamber of Shipping 2020; United Nations Conference on Trade and Development cited in Marleny (2020)). This shows that Maritime transport is at the core of international trade, and in order for maritime transport to be efficient, there should be, among other things, well-functioning ports. Munim and Schramm (2018) argue that ports are the hub and node of networks for all kinds of waterborne transport and link countries with the rest of the world; accordingly, they promote transportation and distribution in an economical way. Ports are a primary conduit of international trade and are central to the growth of the global economy. Seaports are also an important locational determinant of exporters’ location (Nazarczuk et al. 2020). Greater strides should be made to ensure that ports are efficient and their operations are frictionless in order to spur trade.
Efficient ports set the ground for trade, and ports can also enhance a country’s growth prospects. It can thus be said that port efficiency is important to improving trade facilitation. Thien (2019) and Sebastian (2019) state that every hour of port time saved by ships translates into savings in port infrastructure expenditure for ports, ship capital costs for carriers and inventory holding outlays for shippers. Resourceful and well-connected container ports empowered by regular and consistent shipping services are key to reducing trade costs, including transport costs, connecting supply chains and supporting global trade (Benamara et al. 2019). Heiland and Ulltveit-Moe (2020) concur and state that networks are the facilitators for production linkages that permit the more effective allocation of resources through the utilization of comparative advantage and economies of scale. Consequently, port efficiency is a fundamental aspect that can determine the trade performance of any country.
Ports are an important part of the logistics network in Africa, with many ports having an extensive hinterland often covering a number of countries, which makes them a natural focus for regional development (PWc 2019). Maritime transport is the lifeblood of Africa, with over 90% of the continent’s trade merchandise transported by sea (African Union 2019; Manduku 2019). Furthermore, Africa is located on one of the busiest global sea routes‚ vital to global maritime logistics‚ and its geographical position offers an enormous chance for investing in a diversified global market. Despite the significance of ports to international trade, the development and integration of ports in Africa’s wider logistics chains and performance remains poor (Shaw 2018; Tralac 2018; Chimbelu 2019; Chelin and Reva 2020; Gicheru 2020; Kahyarara 2020). Africa still makes up just a small percentage of global trade, with problems persisting at its ports from performance concerns to ineffective handling time, poor security and, in some places, corruption (Kingsland 2020).
Africa needs to make use of the economic potential of its ports and maritime sector if it is to achieve its growth ambitions. An analysis by the PwC in 2018 revealed that upgrades in port efficiency might increase growth, demonstrating the close relationship between port effectiveness and trade competitiveness (Booth 2018; Niselow 2018). However, with increasing congestion in several African ports1, Africa faces the risk of foregoing further development through poor or little investment in port infrastructure. Access to effective ports, interconnecting infrastructure and effective operations to deal with current demand and future growth could lead to reduced costs and improved overall freight logistics efficiency and reliability, all of which are essential to the region’s future success (UNCTAD 2019). It is against this background that this study engages in an investigation of the impact of port performance on trade. The study seeks to answer the following question: does port performance affect trade? Considering the current state of ports in Africa, it is important to embark on a study on how port performance affects trade. The impacts of port performance on Africa’s trade and economy have been largely overlooked in the existing literature. Very few studies (African Development Bank 2009; UNCTAD 2018a; Humphreys et al. 2019; PWc 2019; UNCTAD 2020) have attempted to investigate the impact of port performance on trade. Hence, it is worthwhile to study the impact of port performance on Africa’s trade. There are no records of similar studies having been conducted in Africa. This study makes an original contribution towards the scope of maritime transport and trade.
The paper is divided into six sections: following the introduction in the first section, section two provides a review of the current state of ports in Africa, section three presents a review of literature, section four presents the methodology which was utilized to carry out the study, whist section five and six discuss the findings and conclusions of the study, respectively.
2. The Current State of Ports in Africa
The section makes an attempt to build a glimpse of port performance in Africa. The key aim is to show the current performance of ports. This is important because it might give an insight into whether African ports are performing efficiently. Port performance is a key indicator of trade efficiency that determines connectivity and trade costs (UNCTAD 2020). African ports have been seen to be performing badly compared to other regions. Table 1 below shows the highest and lowest ranked economies in terms of median time spent in ports.

Table 1.
Ten highest- and lowest-ranking economies: median time spent in port by container ships.
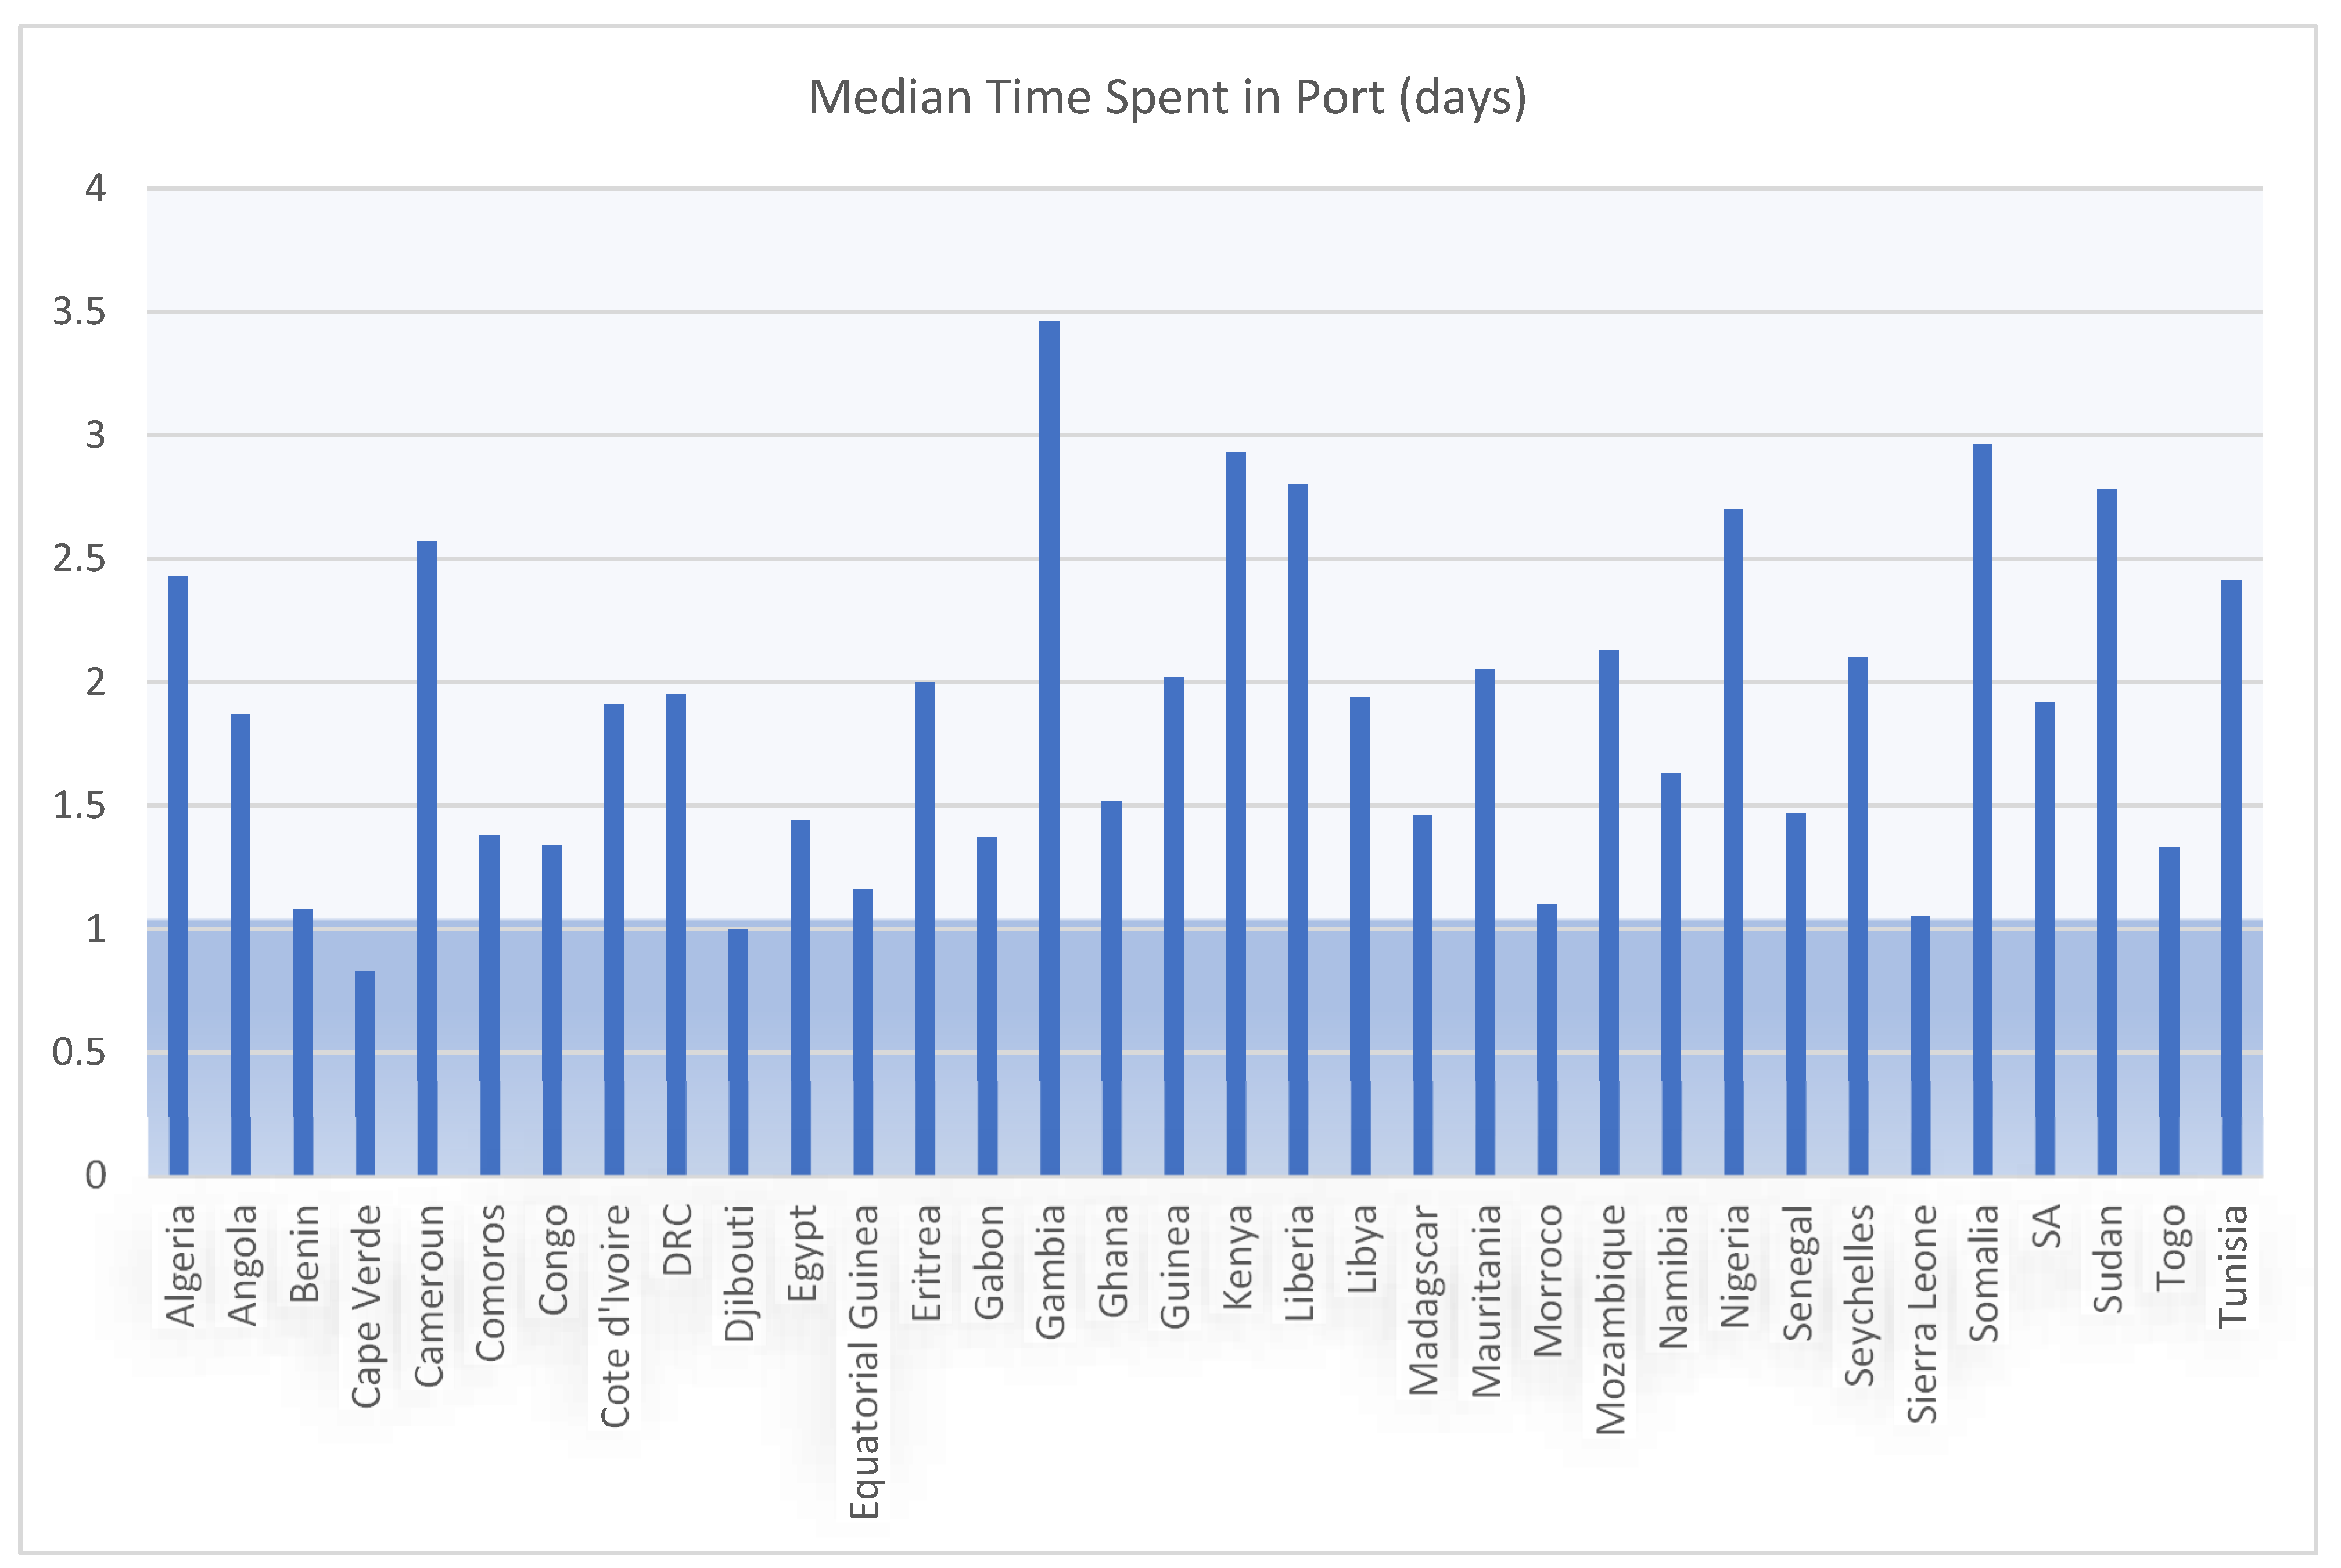
Table 1 shows that none of the African countries are in the top ten performing countries. Most African countries are in the bottom ten2. In other words, several African countries have low ranks when it comes to the median time spent by container ships. This suggests that the median time spent by container ships at ports in Africa is high. This length detention of goods in ports shows that port efficiency is poor, and it has been a major complaint from various users of ports within Africa (Kahyarara 2020). Figure 1 gives a much clearer picture of the median time spent by all ships (passenger ships, wet bulk ships, container ships, dry bulk ships, etc.).

Figure 1.
Median time spent in port. Source: author’s own computation using UNCTAD (2019).
NB: The mean time spent in port for the world is 0.88 days. The mean time spent in port for African countries is 2 days.
Figure 1 shows that only three African countries compare to the global average of 0.88 days: Cape Verde (0.83), Djibouti (1), Morocco (1.1) and Sierra Leone (1.05). Most African countries have a median time of at least 2 days. This may suggest that port performance3 is generally poor in African countries. A report by PWc (2018), Tralac (2018), Trade Mark East Africa (2019) also came to a similar conclusion. The Trade Mark East Africa (2019) argues that many of the handling inefficiencies and long container dwell times are a result of poor port infrastructure, poor port management, customs and associated container clearing procedures, as well as inadequate landside networks which prevent containers from leaving ports without delay. Saggia (2017) states that African ports face the major challenges of poor and dilapidated infrastructure, usage of dated equipment and low levels of mechanization, and container and cargo theft. UNCTAD (2018b), cited in Kahyarara (2020), confirmed that port inefficiency is portrayed by longer container dwell time, interruptions in vessel traffic clearance, protracted documentation handling, lesser container per crane hour (with the exception of South Africa) as one of the critical binding constraints on African ports. This makes most African ports “fail to match global industry standards” (Jaferi 2019).
This poor performance of ports has negative consequences. Saggia (2017) states that inefficient operations at ports lead to significant losses in potential revenue, and “the ports’ inefficiencies have for years allowed corruption from middlemen promising to clear goods for a fee” (Jaferi 2019). High port logistics costs, lack of consistency and low economies of scale in trade volumes have an adverse effect on trade growth in Africa (Doe 2018; Ramaphosa quoted in (RSA 2020). Resourceful and well-connected container ports enabled by frequent and regular shipping services are key to minimizing trade costs, including transport costs, linking supply chains and supporting international trade (Benamara et al. 2019). It should be realized that when more consideration is given to ports through infrastructure investment and port maintenance, ports are likely to contribute positively to trade and economic growth. Well-maintained and well-functioning ports are vital for trade and development. Despite such importance, the impacts of port performance on Africa’s trade and economy have been largely overlooked in the existing literature.
3. Literature Review
3.1. Theoretical Literature
Martin and Rogers (1995) came up with a theoretical model of firm location that looked at technology and trade. In their theory, trade integration implied that in the existence of economies of scale, firms are likely to locate in countries with better national infrastructure, as they offer lower costs to serve all markets. Better international infrastructure increases the industrial relocation of firms toward a country with better national infrastructure. Investment in national infrastructure will help the relocation of firms to developing countries, which become more attractive (Olarreaga 2016). However, investment in international infrastructure will make it more attractive to serve the developing country market from countries with better national infrastructure.
3.2. Empirical Literature
Ways to measure port efficiency and performance are very diverse (Ducruet et al. 2014). A commonly used gauge providing comprehensions into the functioning of ports and their capability to entice business is volumes handled by ports (UNCTAD 2018b; Lei and Bachmann 2020; United States Department of Transportation 2021). As cargo flows are largely determined by changes in demand, port volumes help take the pulse of the world economy and inform about potential transport infrastructure needs and investment requirements. As such, port cargo throughput, including all cargo types, can serve as a leading economic indicator (Talley 2011; UNCTAD 2018b). This is known as the port throughput, and it measures the amount of cargo or number of vessels the port handles over time (United States Department of Transportation 2017).
Deng et al. (2013) completed a study in China and showed that there was a positive relationship between value-added operations at ports and economic activity. Bottasso et al. (2013) completed a study in 10 West European countries and showed that port efficiency, as measured by port throughput, increased growth and employment opportunities. Shan et al. (2014) completed a study in China and showed that port efficiency increased growth in a country and also in its neighboring countries. Poor efficiency in ports was also seen to be a significant contributor to poor economic performance in South Africa (Chang et al. 2014). Sánchez et al. (2003) showed that port efficiency is a major determinant of freight costs; efficient ports are associated with lower freight rates. Clark et al. (2004) concur and state that port efficiency and port infrastructure determine freight transport costs, and they also assist businesses in accessing global markets.
Wilmsmeier and Hoffmann (2008) estimated the role of liner shipping connectivity (LSC) and port infrastructure in determining freight rates in the Caribbean. Their study concluded that an increase in port infrastructure and LSC resulted in reduced freight rates. This reduction in costs can promote more production and increase economic growth. Yeo et al. (2008) found that quality of port service, logistics costs, regional connectivity, hinterland condition and port accessibility contribute significantly to a port’s competitiveness. Abe and Wilson (2008) completed a study on how infrastructure affected trade. They found that port efficiency was a major determinant of trade performance. Their study concluded that poor port efficiency, measured by port congestion, has significantly increased the cost of transportation from the USA and Japan to East Asia. Puertas et al. (2014) found that improvement in port efficiency leads to an increase in its export volume. An analysis by the PwC in 2018 revealed that a 25% upgrade in port efficiency might increase growth by 2%, demonstrating the close relationship between port effectiveness and trade competitiveness (Booth 2018; Niselow 2018).
Munim and Schramm (2018) completed an investigation into the broader economic influence of seaborne trade from a port infrastructure quality and logistics performance perspective in 91 countries with seaports. The study used a structural equation model (SEM) to examine the impact of port quality on trade. The study showed that port quality is vital for trade performance. The study concluded that port quality improves trade and economic growth. Chang et al. (2020) used a gravity model to study the ex-post effect of trade agreements. A gravity model was constructed using worldwide trade data for 2007, 2010 and 2015. The study showed that port performance had a positive effect on trade and logistics performance.
4. Methodology
4.1. Data Sources
In order to examine the impact of port performance on trade, an econometric analysis was completed across 10 African countries (Gambia, Liberia, Nigeria, Kenya, Cameroun, Ghana, Ivory Coast, Senegal, South Africa and Morocco). Data were sourced from the UNCTAD and the World Bank. Panel data covering the period between 2005 and 2018 were used in the study. The sample period and countries included in this study were chosen on the basis of data availability. In other words, the composition of the sample is restricted due to unavailability of data and the necessity for a balanced panel.
4.2. Estimation Technique
The ARDL model (autoregressive distributed lag) is employed because of its adequacy to this study’s data set. First, it allows for the combination of variables integrated in the order of I(0) and I(1) (Belloumi 2014; Yakubu et al. 2014). It is also suitable for studies with small sample size (Olayungbo and Quadri 2019). In this study, there was a mix of I(0) and I(1) variables, and the study’s sample size was small, and this made the panel ARDL approach more than appropriate. The ARDL model provides estimates of the corresponding error correction model (Ghatak and Siddiki 2001; Pesaran et al. 2001; Yakubu et al. 2014; Ogbechie and Anetor 2016). Furthermore, the panel ARDL approach provides consistent estimates of the parameters’ averages. It allows the parameters to be freely independent across groups and does not consider potential homogeneity between groups (Bangake and Eggoh 2011). The analysis in this study followed 3 steps that are usually followed when carrying a panel ARDL approach. The series of steps in the ARDL procedure is the investigation of (i) stationarity, (ii) cointegration and panel ARDL estimation (Menegaki 2019). The study also used the Fixed Effects and Ransom Effects models to corroborate the findings obtained from the ARDL models.
4.2.1. Cross-Dependence, Unit Root and Cointegration
Pesaran (2007) argues that panel unit root tests can lead to spurious conclusions if they fail to take account of significant degrees of cross-section dependence. A shock witnessed in one of the panel units can greatly affect the other units. This is known as cross-section dependence in econometrics (Aktürk and Özyeşil 2019). Cross-sectional dependence can also be caused by other factors such as common shocks and model misspecification (Chudik and Pesaran 2013). If cross-sectional dependence is ignored, the regression results can be biased and unreliable (Phillips and Sul 2003). In order to avoid these problems, the study had to perform a cross-dependence test. The study used the Breusch-Pagan LM, and the Pesaran CD tests were used.
After performing the cross-dependence test, the next test was to perform unit root tests. There are a number of tests that can be used to test for unit root. These include Levin, Lin and Chu test (2002), Im, Pesaran and Shin test (2003), Fisher-type tests, Bai and Ng (2004) and Phillips and Sul (2003). First-generation unit root tests were employed because results from the cross-dependence test had revealed that there is no cross-dependence. In this regard, the Levin, Lin and Chu Test and LM, Pesaran and Shin test were used to test for unit root.
After the results from the unit root showed that the variables were of different order of integration, the next step was to test for cointegration. The study used the Pedroni and the Kao Residual Cointegration test. Pedroni (1999, 2004) introduced seven test statistics that test the null hypothesis of no cointegration in nonstationary panels. The seven test statistics allow heterogeneity in the panel, both in the short-run dynamics as well as in the long-run slope and intercept coefficients (Neal 2014).
4.2.2. Panel ARDL
Pooled Mean Group Estimator (PMG)
Pesaran et al. (1999), cited in Olayungbo and Quadri (2019), proposed the PMG estimator associated with pooling and averaging of the coefficients over the cross-sectional units. This technique was chosen in this study because it accommodates a combination of stationary and nonstationary variables, and it is also appropriate when there is a small sample size (Olayungbo and Quadri 2019). Fayissa and Nsiah (2012) state that a pertinent advantage of the PMG is that the underlying auto-regressive distributed lag (ARDL) structure dispenses with the importance of the unit root pre-testing of the variables in question. Pesaran et al. (1999) propose an estimation approach in which the long-run coefficients on the explanatory variables (xit) are the same across units:
The error correction parameter is denoted by and it is indicative of the speed of adjustment (Oyelami and Ogundipe 2020). The positive sign of the implies return to the long-run relationships (Blackburne and Frank 2007) from points above the regression line. The negative sign also shows the return to long-run equilibrium but in opposite direction (from below). The is expected to be statistically significant as the insignificant coefficient of (i.e., = 0) implies the absence of long-run equilibrium (Masih and Majid 2013).
Mean Group (MG) Estimator
Fauzel et al. (2019) state that the MG calls for estimating separate regressions for each country and calculating the coefficients as unweight means of the estimated coefficients for the individual countries. Chu and Sek (2015) state that MG estimator has the least restraining process and it permits heterogeneity of all the parameters where no cross-country restriction is imposed. The MG estimator derives the long-run parameters from autoregressive distribution lag (ADRL) models for individual countries. The ARDL is as follows:
The MG estimators for the panel model is, therefore, given by:
According to Rafindadi (2013), the above equations reveal how the model estimates separate regressions for each country and calculates the coefficients as unweighted mean of the estimated coefficients for the individual countries. This does not impose any restrictions.
Gravity Model
The second model used a gravity model. The gravity model approach is a standard method to measure different effects on trade flows. Tinbergen (1962) and Pöyhönen (1963) invented the gravity model to investigate the effect of economic mass and distance on trade flows between countries. Tinbergen and Pöyhönen use the gross domestic product as a proxy for economic proportions, and the distance between the countries is used as a space measure.
is hereby the trade between country i and j. and are the mass coefficients and show the size of the country, often defined by GDP. is the variable for the distance between both countries and stated in the distances between the capitals. Equation (5) can be converted into log-linear form as:
The c term is a regression constant; the variable represents any hidden factors that could affect export performance, while is the stochastic term. The model for this study was presented as follows:
where X is total exports, GDP is economic growth, EXCH is exchange rate, D is the physical distance between the locations of economic hubs within the trading partner countries, Borderij equals to one if a common border exists between two trading partners and zero otherwise and the variable represents any hidden factors that could affect export performance. The gravity model was used because bilateral trade patterns are well described empirically by the so-called gravity equation. Africa has recently made efforts and signed regional trade agreements in order to promote interregional trade. Interregional trade between African states still has large room for growth.
4.3. Model Specification
The study modified Munim and Schramm (2018)4 and came up with the following model:
where TR is trade, INF is inflation, PP is port performance, GDP is economic growth, EXCH is exchange rate and D5 is a dummy variable. The description of the variable presented in Equation (6) above is presented in Table 2 below.
TR = f (INF, PP, GDP, EXCH, D)
Table 2.
Summary of variable descriptions.
5. Presentation of Results
5.1. Descriptive Statistics
It is imperative to check the descriptive statistics before analyzing the data series in order to observe the variability and distribution of the variables as shown (Olayungbo and Quadri 2019). The descriptive statistics for the data used in this study are presented in Table 3.
Table 3.
Descriptive statistics.
The results show that the mean value of EXCH (103.7092) was higher than all other mean values, and the INF (1.516473) variable had the lowest mean value. Results also further show that the EXCH variable had the highest variability, as shown by the standard deviation value of 37.56983. EXCH had the highest maximum value (163.8752), and the INF variable had the lowest minimum value (1.297362). The TR variable (1.815353) showed some deviation from the standard skewness of 0, and it also had a value that was above the standard kurtosis of 3.
5.2. Cross-Dependence and Unit Root Tests
In order to test for panel cross-dependence, the Breusch–Pagan LM and the Pesaran CD tests were used. Results are shown in the table.
According to the findings in Table 4, there is no cross-sectional dependence among the countries included in this study. In other words, a shock in one of these countries does not affect the others. Having found no evidence of cross-dependence, first-generation panel data analysis methods were used in this analysis.
Table 4.
Panel cross-dependence.
5.3. Stationarity Tests
The first step was to test the stationarity of the variables. This was completed using the test of LM, the Pesaran and Shin test and the Levin Test. Results are shown in Table 5.
Table 5.
Stationarity tests.
Table 5 shows that, under the Levin, Lin and Chu Test, GDP and INF were stationary at levels. EXCH, PP and TR became stationary at the first difference. Under the LM, Pesaran and Shin test, only GDP was stationary at levels. The rest of the variables became stationary at being differenced once. Since some variables were seen to be nonstationary at levels, there was a need to test for cointegration.
5.4. Cointegration Tests
The second step involved the testing of the presence of a long-run association among the variables (cointegration). This was completed using the Pedroni test (the Kao test was completed as a robustness test). Results are shown in Table 6 and Table 7.
Table 6.
Pedroni cointegration test.
Table 7.
Kao residual cointegration test.
Results from the Pedroni test show that seven of the eleven statistics reject the null hypothesis of no cointegration at the conventional size of 0.05. This shows that there is a long-run association among the variables. The Kao test was also performed for robustness purposes. Results from the Kao test are shown in the table below. Table 7 shows the results from the Kao panel cointegration test.
Results show that the p-value turned out to be 0.0021, and this rejects the null hypothesis of no cointegration at the conventional size of 0.05. This also confirms the presence of a long-run association among the variables. After detecting cointegration, the study proceeded to estimate the short-run and long-run relationships using the panel ARDL technique. A PMG was estimated, and the results are shown in Table 8 below.
Table 8.
Pooled mean group results.
5.5. Regression Results
The study performed two dynamic models (PMG and MG) and two static models (FE and RE). Results are shown in the tables below (Table 8 and Table 9).
Table 9.
Mean group results.
Having estimated the PMG and MG model, the Hausman test was employed to determine which of the two models is the most consistent and suitable model in establishing the impact of port performance on trade. Results are shown in Table 10 below.
Table 10.
Hausman test.
The calculated Hausman Test is 8.23 with a p-value of 0.734. It can thus be concluded that a null hypothesis cannot be rejected, and the PMG estimator is preferred. Under the null (slope homogeneity), the PMG estimator is consistent and efficient (Bardi et al. 2019). The study only reports the findings from the PMG estimator because the Hausman test chose it as the preferred model. PMG was also chosen due to its advantage over the static models (FE and RE).
The PMG results displayed in Table 8 show that there is a statistically significant positive relationship between PP (port performance) and trade. This result is consistent with the literature. The literature views ports and terminals as key engines for economic growth (Dwarakish and Salim 2015; PWc 2018; Munim and Schramm 2018). Efficient and well-connected container ports enabled by frequent and regular shipping services are key to minimizing trade costs, including transport costs, linking supply chains and supporting international trade (PWc 2018). Ports are also important for the support of economic activities in the hinterland since they act as a crucial connection between sea and land transport. The transportation sector is a strong factor in terms of economic and regional balanced development, as well as also having a great influence on national integration to the world economic market (Dwarakish and Salim 2015). A study by Munim and Schramm (2018) revealed that it is vital for developing countries to continuously improve the quality of port infrastructure as it contributes to better logistics performance, leading to higher seaborne trade, yielding higher economic growth.
Results show that there is a statistically significant positive relationship between INF (inflation) and trade. This may suggest that when inflation is increasing, trade tends to also increase. These results are consistent with a number of studies. For instance, Evans (2011) proposed that trade openness enhanced a country’s incentive to create inflation by estimating data through regression from 1973 to 1987 and 1988 to 2002. He concluded that openness was inflationary between developed countries in which monetary policy can roughly be approximated by controlling for imperfect competition and inelasticity of labor supply within the country. Babatunde (2017) showed that there is a significant positive long-run relationship between inflation and trade openness and a robust negative link between openness and inflation in the short run. However, other studies that were conducted on the same subject area arrived at different conclusions. For instance, Aron and Muellbauer (2007) showed that increased trade openness has significantly reduced the mean inflation rate and has also reduced the exchange rate pass-through into wholesale prices. Yihevis and Musila (2018) found that inflation exerts no significant effect on the trade balance.
The study does not find any evidence of a statistically significant relationship between GDP (economic growth) and trade. The result is insignificant, as reflected by the p value (0.1280) which is higher than 0.05. This shows that there is no relationship between the two variables (GDP and trade). The result is surprising because economic growth is supposed to result in more trade. Countries with higher rates of GDP growth also tend to have higher rates of growth in trade as a share of output (Ospina 2018). However, other studies have shown that the relationship between growth and trade can be confusing. The relationship between trade and GDP is complicated (World Economic Forum 2016).
The study shows that when there is a depreciation of the domestic exchange rate, the contribution of trade to GDP declines. This result goes again the traditional exchange rate and exports notion. It is widely expected that the depreciation of exchange rates would improve export performance. The result is consistent with Liewa et al. (2016), who found that devaluation-based adjustment policies may not achieve the desired effects of nominal exchange rate changes (devaluation) on the balance of trade. In other words, the exchange rate cannot be used solely in managing external balances. Furthermore, a Financial Times (2015) study found that the “benefits of depreciation on exports may have evaporated”. The argument is based on the apparent lack of a correlation between exports and US dollar exchange rates for emerging markets since 2013. The dummy variable (D) is significant, and this reinforces the result that port performance has a positive relationship with trade. Port performance is a critical factor that can shape countries’ trade competitiveness. Every hour of port time saved by ships translates into savings in port infrastructure expenditure for ports, ship capital costs for carriers and inventory holding outlays for shippers (PWc 2018). This will then contribute positively to trade.
In the short run, the results show that the speed of adjustment parameter (−0.586) is negative and significant, which implies that 59% of the last year’s disequilibrium is corrected this year. The fact that the coefficient of the error correction (−0.586) is negative confirms the existence of the long-run relationship between port performance and the regressors that were used in this study. The short-run results were almost similar to the results that were obtained in the long-run analysis. However, in the short run, there is an improvement in the explanatory power of some of the indicators. This may suggest that the impact of the explanatory variables is much bigger in the short run than in the long run. However, INF was seen to be having an insignificant relationship with trade performance. This may suggest that inflation does not affect trade performance in the short run.
Furthermore, the gravity model was used to conducted to affirm the findings of PMG. Two models were conducted using the gravity model. The first model had exports as its dependent variable, and the second model had trade volume (exports and imports) as its dependent variable. However, it must be noted that the sign of the main variable of interest (port performance) is the same in all the models. This reinforces the findings in the PMG that port performance contributes positively to trade performance. Results are presented in Table 11 below.
Table 11.
Gravity Model results.
The Hausman test was performed, and the results showed a Hausman statistic of 18.34, and it was significant at a 5% significance level. This shows that the Random Effects performed better than the Fixed Effects model. This is the reason the RE model was chosen in the second model (Model 2).
The results suggest that the LGDP, EXCH and LPP are the powerful positive determinants of bilateral trade. These results are inconsistent with the results from the PMG estimator except for LGPD, which was found to be insignificant in the PMG estimator. For LGDP, the result seems to be reasonable, and it is consistent with the literature. For instance, Songwe (2019) shows that when African countries trade with themselves, they exchange more manufactured and processed goods, have more knowledge transfer and create more value. Trade is the key to long-term, sustainable economic growth and development in sub-Saharan Africa (Farahane and Heshmati 2020; US Government 2021). Osei-Assibey and Dikgang (2020) found that both imports and have the potential to positively impact economic growth in African countries.
The distance variable (D) has a negative sign (on the GMM model) and is insignificant in all other regressions. This is inconsistent with the gravity model. Conventional wisdom suggests that transportation costs go up along with the increase in distance. However, this is not the case in Africa. The share of internal trade in Africa remains very low. Intra-African exports were 16% of total exports in 2018 (Jarreua 2018; Tralac 2019; UNCTAD 2019; Fitch Ratings 2021). This is because it is much costlier for African states to trade with each other than for them to trade with Europe, Asia and America (BBC 2021). The continent’s railways and roads often lead towards the ports rather than link countries across regions. To fly from one African country to another, it is often easier to pass through Europe (UN 2020). This explains why many African countries prefer to trade with Europe, Asia and America. This is caused by such constraints as high trade costs, expressed through a lack of access to credit and finance, inefficient border processes, poor physical infrastructures such as road and railway networks, customs systems, security issues and communication barriers (Luke 2020; BBC 2021). The border variable (B) is insignificant in all regressions. This shows that sharing the same border does not influence trade in the countries under investigation. This is explained by the fact that Africans trade the least with each other than all the other continents (Songwe 2019; US Government 2021). Furthermore, a large share of regional trade in Africa is informal, i.e., not recorded in official data (Bensassi et al. 2019; World Bank 2020). This makes it difficult to include such trade in official trade statistics.
6. Conclusions and Recommendations
The main aim of this study was to examine the impact of port performance on trade in Africa. The study drew from the fact that, globally, ports are gateways for over 70% of merchandise trade by volume and value. Efficient ports set the ground for trade, and ports can also enhance a country’s growth prospects. It can thus be said that port efficiency is important to improving trade facilitation. However, in Africa, the functioning and concatenation of ports in Africa’s wider transport logistics chains remain poor. Others fall behind in terms of available facilities, dependability and effectiveness in the handling of freight, which increase supply chain costs. The inconsistencies in port performance affect Africa’s transport logistic chains and make African countries less efficient than they should be. Africa still makes up just a small percentage of global trade, with problems continuing at its ports from capability issues to inefficient handling time, poor security and, in some places, corruption.
The results from the study showed that port performance has a positive impact on trade in Africa. The findings were consistent with the empirical literature. This study argues that the success of Africa’s ports and transport logistic chains is critical to Africa’s transformation of economic potential to growth. The transportation system is a vital factor in terms of economic growth as well as having a major influence on Africa’s integration into the global market. This has not been acknowledged by several governments; they have failed to recognize ports as vital facilitators of international trade. Africa must change its understanding of the part ports can play. Based on the findings, the study recommends that African governments must invest heavily in port infrastructure. This study argues that African ports require modern infrastructure to be able to compete successfully. Africa needs to pursue an intensive course of infrastructure development so as to maintain economic growth and improve port efficiency and trade competitiveness. At the moment, African ports are inefficient, and there is congestion partly because the ports cannot accommodate further expansion without serious investments. Investment in infrastructure will ensure the accommodation of vessel arrivals/departures and safe and efficient loading/unloading.
It should also be noted that Africa must not only invest in port infrastructure but also on shoreside infrastructure and intermodal connections that serve ports. In other words, consideration should also be given to highway or rail infrastructure that develops or extends intermodal connectivity and intermodal facilities. This will ensure access to efficient transport modes of sufficient capacity. Congested transport corridors place an additional burden on ports which might make goods arrive at and leave ports slowly. Investment in Africa’s port infrastructure and the intermodal connections that serve seaports foster prosperity and provide an opportunity to bolster Africa’s trade.
Funding
This research received no external funding.
Institutional Review Board Statement
Not applicable.
Informed Consent Statement
Not applicable.
Data Availability Statement
Not applicable.
Conflicts of Interest
The authors declare no conflict of interest.
Note
| 1 | South Africa’s President, Cyril Ramaphosa, also echoed a similar sentiment in his 2020 State of the Nation Address. Mr. Ramaphosa stated that South Africa’s ports were congested and inefficient, and this resulted in delays and increased costs of conducting international business (Ramaphosa quoted in (RSA 2020). |
| 2 | This is also in line with the 2018 Lloyd list of Top 100 global container port: from Africa, only four container ports, in Morocco, Egypt and South Africa, were listed (Jaferi 2019). |
| 3 | A shorter time in the port is generally indicative of high port efficiency and trade competitiveness (UNCTAD 2019). |
| 4 | Munim and Schramm (2018) completed a study that tested the impacts of port infrastructure and logistics performance on economic growth and showed that port infrastructure contributes to higher seaborne trade. |
| 5 | The dummy variable was used to capture the unevenness of port performance in Africa. The countries included were divided into two categories: best performers and worst performers. Those that were included under the better-performing category had a median waiting time of at most 1 day, and those under the worst-performing category had a median time of at least 2 days. The dummy variable took a value of one if a country had a median waiting time of at most 1 day; 0 otherwise. |
References
- Abe, K., and J. S. Wilson. 2008. Trade, Transparency, and Welfare in the Asia Pacific. Journal of International Economic Studies 12: 35–87. [Google Scholar] [CrossRef]
- African Development Bank. 2009. Concept Note for the African Development Report 2010 on Ports, Logistics and Trade in Africa. Available online: https://www.afdb.org/fileadmin/uploads/afdb/Documents/GenericDocuments/Concept%20Note%20for%20the%20African%20Development%20Report%20210%20on%20ports%20logistics%20and%20trade%20in%20Africa.pdf (accessed on 12 February 2021).
- African Union. 2019. Africa’s Blue Economy Is a Vehicle for Sustainable Development. Available online: https://au.int/sw/node/36807 (accessed on 7 March 2021).
- Aktürk, E., and M. Özyeşil. 2019. The Effects of the Corporate Governance Quality of Companies on the Price Performance: A New Generation of Panel Data Analysis on the Companies Listed in the Borsa İstanbul Corporate Governance Index. Available online: https://dergipark.org.tr/tr/download/article-file/763952 (accessed on 12 February 2021).
- Aron, J., and J. Muellbauer. 2007. Trade Openness and Inflation. Available online: https://voxeu.org/article/trade-openness-and-inflation (accessed on 12 November 2020).
- Babatunde, M. 2017. Trade Openness and Inflation in Nigeria: A Nonlinear ARDL Analysis. Available online: https://core.ac.uk/download/pdf/234648112.pdf (accessed on 15 October 2020).
- Bai, J., and S. Ng. 2004. A Panic Attack on Unit Roots and Cointegration. Econometrica 72: 1127–77. Available online: https://www.jstor.org/stable/3598781?Seq=1#metadata_info_tab_contents (accessed on 14 March 2021).
- Bangake, C., and J. Eggoh. 2011. Pooled Mean Group Estimation on International Capital Mobility in African Countries. Journal of Economics and Sustainable Development 8. [Google Scholar] [CrossRef] [Green Version]
- Bardi, W., S. E. Ayouni, and M. Hamdaoui. 2019. Are Structural Policies in Countries Bordering Mediterranean Appropriate to Economic Convergence: Panel ARDL Application. Cogent Economics & Finance 7. [Google Scholar] [CrossRef]
- BBC. 2021. Africa’s Free-Trade Area: What Difference Will It Make? Available online: https://www.bbc.com/news/world-africa-55334345 (accessed on 15 October 2020).
- Belloumi, M. 2014. The relationship between trade, FDI and economic growth in Tunisia: An application of the autoregressive distributed lag model. Economic Systems 38: 269–87. [Google Scholar] [CrossRef]
- Benamara, H., J. Hoffmann, L. Rodriguez, and F. Youssef. 2019. Container Ports: The Fastest, the Busiest, and the Best Connected. Available online: https://unctad.org/en/pages/newsdetails.aspx?OriginalVersionID=2162&Sitemap_x020_Taxonomy=UNCTAD%20Blogs (accessed on 12 November 2020).
- Bensassi, S., J. Jarreau, and C. Mitaritonna. 2019. Regional Integration and Informal Trade in Africa: Evidence from Benin’s Borders. Journal of African Economies 28: 89–118. [Google Scholar] [CrossRef]
- Blackburne, Iii Edward F., and Mark W. Frank. 2007. Estimation of Nonstationary Heterogeneous Panels. The Stata Journal: Promoting Communications on Statistics and Stata 7: 197–208. [Google Scholar] [CrossRef]
- Booth, L. 2018. Ports Critical for Growth in Africa. Available online: https://www.commercialriskonline.com/ports-critical-growth-africa/ (accessed on 12 November 2020).
- Bottasso, A., M. Conti, C. Ferrari, O. Merk, and A. Tei. 2013. The impact of port throughput on local employment: Evidence from a panel of European regions. Transport Policy 27: 32–38. [Google Scholar] [CrossRef]
- Chang, S., Y. Huang, K. Shang, and W. Chiang. 2020. Impacts of regional integration and maritime transport on trade: With special reference to RCEP. Maritime Business Review 5: 143–58. [Google Scholar] [CrossRef]
- Chang, Y. T., S. H. Shin, and P. Lee. 2014. Economic impact of port sectors on south African economy: An input–output analysis. Transport Policy 35: 333–40. [Google Scholar] [CrossRef]
- Chelin, R., and D. Reva. 2020. As African Ports Pursue Technological Innovation to Boost Trade, New Cybersecurity Risks Will Emerge. Available online: https://issafrica.org/iss-today/security-vs-efficiency-smart-ports-in-a-post-covid-19-era (accessed on 15 October 2020).
- Chimbelu, C. 2019. Making Chinese Investment in African Ports Work Despite Risks. Available online: https://www.dw.com/en/making-chinese-investment-in-african-ports-work-despite-risks/a-49282176 (accessed on 15 October 2020).
- Chu, J., and S. K. Sek. 2015. Investigating the relationship between inflation and growth: Evidence from panel ARDL models. American Institute of Physics 1605: 943–48. [Google Scholar] [CrossRef] [Green Version]
- Chudik, A., and M. H. Pesaran. 2013. Large Panel Data Models with Cross-Sectional Dependence: A Survey. Available online: https://papers.ssrn.com/sol3/papers.cfm?abstract_id=2316333 (accessed on 15 October 2020).
- Clark, X., D. Dollar, and A. Micco. 2004. Port efficiency, maritime transport costs, and bilateral trade. Journal of Development Economics 75: 417–50. [Google Scholar] [CrossRef] [Green Version]
- Deng, P., S. Lu, and H. Xiao. 2013. Evaluation of the relevance measure between ports and regional economy using structural equation modeling. Transport Policy 27: 123–33. [Google Scholar] [CrossRef]
- Doe, L. 2018. New PwC Report Focuses on African Port Growth. Available online: https://www.porttechnology.org/news/new_pwc_report_focuses_on_african_ort_growth/ (accessed on 20 October 2020).
- Ducruet, C., H. Itoh, and O. Merk. 2014. Time Efficiency at World Container Ports. Available online: http://www.internationaltransportforum.org/jtrc/DiscussionPapers/DP201408.pdf (accessed on 3 December 2020).
- Dwarakish, G. S., and M. A. Salim. 2015. Review on the Role of Ports in the Development of a Nation. Available online: https://www.sciencedirect.com/science/article/pii/S2214241X15000413 (accessed on 14 September 2020).
- Evans, W. R. 2011. Is Openness Inflationary? Policy Commitment and Imperfect Competition. Journal of Macroeconomics 34: 1095–110. [Google Scholar] [CrossRef]
- Farahane, M., and A. Heshmati. 2020. Trade and Economic Growth: Theories and Evidence from the Southern African Development Community. Available online: http://ftp.iza.org/dp13679.pdf (accessed on 14 September 2020).
- Fauzel, F., B. Seetanah, R. Sannassee, and R. Nunkoo. 2019. Investigating the Impact of Climate Change on the Tourism Sector of SIDS. Available online: https://www.wto.org/english/tratop_e/envir_e/climate_change_mauritius.pdf (accessed on 14 September 2020).
- Fayissa, B., and C. Nsiah. 2012. Financial Development and Remittances in Africa and the Americas: A Panel Fully Modified OLS Analysis. Available online: http://capone.mtsu.edu/berc/working/WP_Series_3_14_2012.Pdf (accessed on 14 March 2021).
- Financial Times. 2015. FT Study Shows Danger to Global Trade from EM Currency Weakening. Available online: https://www.ft.com/content/0256e374-4bf9-11e5-b558-8a9722977189#axzz3n1YBM7KE (accessed on 20 September 2020).
- Fitch Ratings. 2021. African FTA Growth Impact Too Small to Affect Ratings. Available online: https://www.fitchratings.com/research/sovereigns/african-fta-growth-impact-too-small-to-affect-ratings-07-01-2021 (accessed on 20 September 2020).
- Fugazza, M., and J. Hofman. 2017. Liner Shipping Connectivity as Determinant of Trade. Available online: https://jshippingandtrade.springeropen.com/articles/10.1186/s41072-017-0019-5 (accessed on 20 October 2020).
- Ghatak, S., and J. Siddiki. 2001. The use of ARDL approach in estimating virtual exchange rates in India. Journal of Applied Statistics 11: 573–83. [Google Scholar] [CrossRef]
- Gicheru, B. 2020. Modernization Milestones at Mombasa Port, East Africa’s Regional Hub. Available online: https://www.maritime-executive.com/editorials/modernization-milestones-at-mombasa-port-east-africa-s-regional-hub (accessed on 15 October 2020).
- Heiland, I., and K. H. Ulltveit-Moe. 2020. An Unintended Crisis: COVID-19 Restrictions Hit Sea Transportation. Available online: https://voxeu.org/article/covid-19-restrictions-hit-sea-transportation (accessed on 15 October 2020).
- Humphreys, M., A. Stokenberga, M. H. Dappe, A. Iimi, and O. Hartmann. 2019. Port Development and Competition in East and Southern Africa Prospects and Challenges. Available online: https://olc.worldbank.org/system/files/Overview%20%20%20Port%20Development%20and%20Competition%20in%20East%20and%20Southe%20Africa-2.pdf (accessed on 15 October 2020).
- International Chamber of Shipping. 2020. Shipping and World Trade. Available online: https://www.ics-shipping.org/shipping-facts/shipping-and-world-trade (accessed on 15 October 2020).
- International Maritime Organization. 2018. IMO Profile. Available online: https://business.un.org/en/entities/13 (accessed on 5 February 2021).
- Jaferi, N. 2019. From Magazine: It’s Time for Africa to Stack Up Container Shipping Capacity. Available online: https://www.logupdateafrica.com/its-time-for-africa-to stack-up-container-shipping-capacity (accessed on 12 March 2021).
- Jarreua, J. 2018. Economists Are Severely Underestimating the Amount of Trade between African Countries. Available online: https://qz.com/africa/1402733/trade-between-african-countries-has-been-underestimated-by-economists/ (accessed on 5 February 2021).
- Jha. 2019. Ocean Economy & Maritime Trade: Exploring Possibilities. Available online: https://www.tpci.in/blogs/ocean-economy-maritime-trade-exploring-possibilities/ (accessed on 10 March 2021).
- Kahyarara, G. 2020. Investment in Port Infrastructures across Africa Coastlines. Available online: https://allafrica.com/stories/202008260455.html (accessed on 15 October 2020).
- Kingsland, P. 2020. Ready for the Spotlight: Emerging Ports in Africa. Available online: https://ship.nridigital.com/ship_jul18/ready_for_the_spotlight_emerging_ports_in_africa# (accessed on 14 March 2021).
- Lei, C., and Q. Bachmann. 2020. Assessing the role of port efficiency as a determinant of maritime transport costs: Evidence from Canada. Maritime Economics & Logistics 22: 562–84. [Google Scholar] [CrossRef]
- Liewa, K., K. Limb, and K. Hussainc. 2016. Exchange Rate and Trade Balance Relationship: The Experience of Asean Countries. Available online: https://www.researchgate.net/publication/23746205_Exchange_Rate_and_Trade_Balance_Relationship_The_Experience_of_ASEAN_Countries (accessed on 14 March 2021).
- Luke, D. 2020. Why Trade Matters for African Development. Available online: https://blogs.lse.ac.uk/businessreview/2020/08/25/why-trade-matters-for-african-development/ (accessed on 12 March 2021).
- Manduku, A. D. 2019. Speech by the Managing Director Dr. Arch. Daniel Manduku During the Launch of Kpa 2018–2047 Masterplan on 7 August 2019 at the Whitesands Beach Hotel. Available online: https://www.kpa.co.ke/Pages/Managing-Director%27s-Speech-during-the-launch-of the-KPA-2018-2047-Maste-Plan.aspx (accessed on 5 February 2021).
- Marleny, A. 2020. Unctad Says Maritime Transport of Goods Helps Minimise Covid-19 Economic Impacts. Available online: https://www.engineeringnews.co.za/article/unctad-says-maritime-transport-of-goods-help-minimise-covid-19-economic-impacts-2020-03-26 (accessed on 15 November 2020).
- Martin, P., and C. Rogers. 1995. Industrial Location and Public Infrastructure. Journal of International Economics 39: 335–51. [Google Scholar] [CrossRef]
- Masih, M., and H.A. Majid. 2013. Stock Price and Industrial Production in Developing Countries: A Dynamic Heterogeneous Panel Analysis. Available online: https://mpra.ub.uni-muenchen.De/58308/ (accessed on 14 March 2021).
- Menegaki, A. N. 2019. The ARDL Method in the Energy-Growth Nexus Field; Best Implementation Strategies. Economies 7: 105. [Google Scholar] [CrossRef] [Green Version]
- Munim, Z. H., and H. Schramm. 2018. The Impacts of Port Infrastructure and Logistics Performance on Economic Growth: The Mediating Role of Seaborne Trade. Available online: https://jshippingandtrade.springeropen.com/articles/10.1186/s41072-018-0027-0 (accessed on 21 November 2020).
- Nazarczuk, J. M., S. Umiński, and T. Brodzicki. 2020. Determinants of the spatial distribution of exporters in regions: The role of ownership. The Annals of Regional Science 64: 547–74. [Google Scholar] [CrossRef] [Green Version]
- Ndlendle, S. 2018. Investment in Africa’s Ports, Shipping Sector Can Accelerate Economic Growth. Available online: https://www.iol.co.za/business-report/economy/investment-in-africas-ports-shipping-sector-can-accelerate-economic-growth-14395492 (accessed on 15 November 2020).
- Neal, T. 2014. Panel cointegration analysis with xtpedroni. The Stata Journal 14: 684–92. [Google Scholar] [CrossRef] [Green Version]
- Niselow, T. 2018. Port of Durban Likely to Emerge as One of Africa’s Major Hubs—PwC. Available online: https://www.fin24.com/Economy/port-of-durban-likely-to-emerge-as-one-of-africas-major hubs-pwc-20180413 (accessed on 25 November 2020).
- Ogbechie, C., and F. O. Anetor. 2016. Determinants of capital flows into Nigeria: An autoregressive-distributed lag (ARDL) approach. Journal of Economic and Trade 1: 38–50. [Google Scholar]
- Olarreaga, M. 2016. Trade, Infrastructure, and Development. Available online: https://www.adb.org/sites/default/files/publication/218316/adbi-wp626.pdf (accessed on 21 November 2020).
- Olayungbo, D. O., and A. Quadri. 2019. Remittances, financial development and economic growth in sub-Saharan African countries: Evidence from a PMG-ARDL approach. Financial Innovation 5. [Google Scholar] [CrossRef] [Green Version]
- Osei-Assibey, K., and O. Dikgang. 2020. International Trade and Economic Growth: The Nexus, the Evidence, and the Policy Implications for South Africa. The International Trade Journal 34: 572–98. [Google Scholar] [CrossRef]
- Ospina, E. O. 2018. Does Trade Cause Growth? Available online: https://ourworldindata.org/trade-and econ-growth#note-1 (accessed on 12 March 2021).
- Oyelami, Lukman, and Adeyemi Ogundipe. 2020. An Empirical Investigation of Remittances and Financial Inclusion Nexus in Sub-Saharan Africa. Cogent Business & Management 7. [Google Scholar] [CrossRef]
- Pedroni, P. 1999. Critical values for cointegration tests in heterogeneous panels with multiple regressors. Oxford Bulletin of Economics and Statistics 61: 653–70. [Google Scholar] [CrossRef]
- Pedroni, P. 2004. Panel cointegration: Asymptotic and finite sample properties of pooled time series tests with an applicaton to the PPP hypothesis. Econometric Theory 20: 597–625. [Google Scholar] [CrossRef] [Green Version]
- Pesaran, M. H. 2007. A simple panel unit root test in the presence of cross-section dependence. Journal of Applied Econometrics 22: 265–312. [Google Scholar] [CrossRef] [Green Version]
- Pesaran, M. H., Y. Shin, and R. J. Smith. 2001. Bound Testing Approaches to the Analysis of level Relationships. Journal of Applied Econometrics 16: 289–326. [Google Scholar] [CrossRef]
- Pesaran, M. Hashem, Yongcheol Shin, and Ron P. Smith. 1999. Pooled Mean Group Estimation of Dynamic Heterogeneous Panels. Journal of the American Statistical Association 94: 621. [Google Scholar] [CrossRef]
- Phillips, P. C. B., and D. Sul. 2003. Dynamic panel estimation and homogeneity testing under cross section dependence. The Econometrics Journal 6: 217–59. [Google Scholar] [CrossRef] [Green Version]
- Pöyhönen, P. 1963. A Tentative Model for the Volume of Trade between Countries. Weltwirtschaftliches Archiv 90: 93–99. Available online: https://www.jstor.org/stable/40436776?Seq=1#metadata_info_tab_contents (accessed on 23 February 2021).
- Puertas, R., L. Martı, and L. Garcıa. 2014. Logistics performance and export competitiveness: European experience. Empirica 41: 467–80. [Google Scholar] [CrossRef]
- PWc. 2018. Strengthening Africa’s Gateways to Trade. An Analysis of Port Development in Sub-Saharan Africa: 2018. Available online: https://www.pwc.com/ua/en/industry/transportation-and-logistics/shipping-and-ports.html (accessed on 23 February 2021).
- PWc. 2019. African Ports. Available online: https://www.pwc.co.za/en/publications/african-ports.html (accessed on 23 February 2021).
- Rafindadi, A. A. 2013. An Application of panel ARDL in analysing the dynamics of financial development and economic growth in 38 Sub-Saharan African continents. Paper presented at the Conference: Kuala Lumpur International Business, Economics and Law Conference, Kuala Lumpur, Malaysia, April 8–9; vol. 2, pp. 118–35, ISBN 978-967-11350-2. [Google Scholar]
- RSA. 2020. President Cyril Ramaphosa: 2020 State of the Nation Address. Available online: https://www.gov.za/speeches/president-cyril-ramaphosa-2020-state-nation-address-13-feb-2020-0000 (accessed on 14 October 2020).
- Saggia, G. 2017. The Future of African Ports. Available online: https://www.maritime executive.com/editorials/the-future-of-african-ports (accessed on 14 October 2020).
- SAIMI. 2020. COVID-19: The Impact on Global Shipping and South Africa’s Economy. Available online: http://www.saimi.co.za/news-saimi-22May2020.html (accessed on 15 October 2020).
- Sánchez, R. J., J. Hoffmann, A. Micco, G. V. Pizzolitto, M. Sgut, and G. Wilmsmeier. 2003. Port efficiency and international trade: Port efficiency as a determinant of maritime transport costs. Maritime Economics & Logistics 5: 199–218. [Google Scholar] [CrossRef]
- Sebastian, B. 2019. Data Supporting Swifter Shipping. Available online: https://www.marinetraffic.com/blog/data-supporting-swifter-shipping/ (accessed on 12 March 2021).
- Shan, J., M. Yu, and C. Lee. 2014. An empirical investigation of the seaport’s economic impact: Evidence from major ports in China. Transportation Research Part E 69: 41–53. [Google Scholar] [CrossRef]
- Shaw, A. 2018. Accelerated Growth and Development by Strengthening Trade. Available online: https://africaports.co.za/2018/04/16/africa-ports-ships-maritime-news-173/ (accessed on 12 March 2021).
- Sok, H. 2016. Shipping: Indispensable to the World. Available online: https://www.globaltrademag.com/shipping-indispensable-world/ (accessed on 14 October 2020).
- Songwe, V. 2019. Intra-African Trade: A Path to Economic Diversification and Inclusion. Available online: https://www.brookings.edu/research/intra-african-trade-a-path-to-economic-diversification-and-inclusion/ (accessed on 10 March 2021).
- Talley, W. K. 2011. Is Port Throughput A Port Output? Advances in Maritime Logistics and Supply Chain Systems 2: 117–129. [Google Scholar] [CrossRef]
- Thien, D. 2019. Digital Ports Way of the Future. Available online: http://www.dailyexpress.com.my/news/142467/digital-ports-way-of-the-future/ (accessed on 21 November 2020).
- Tinbergen, J. 1962. An Analysis of World Trade Flows. Shaping the World Economy 5: 27–30. [Google Scholar]
- TradeMark East Africa. 2019. Trade Facilitation Agreement Facility. Available online: https://tfafacility.org/Trademark-East-Africa (accessed on 21 November 2020).
- Tralac. 2018. Maritime Trade and Africa. Available online: https://www.tralac.org/news/article/13541-maritime-trade-and-africa.html (accessed on 21 November 2020).
- Tralac. 2019. Summary of Intra-Africa Trade 2019. Available online: https://www.tralac.org/documents/publications/trade-data-analysis/3982-summary-intra-africa-trade-2019/file.html (accessed on 10 March 2021).
- UN. 2020. How to Boost Trade within Africa. Available online: https://www.un.org/africarenewal/magazine/september-2002/how-boost-trade-within-africa (accessed on 15 October 2020).
- UNCTAD. 2018a. Maritime Trade and Africa. Available online: https://unctad.org/press material/maritime-trade-and-africa (accessed on 10 March 2021).
- UNCTAD. 2018b. Review of Maritime Transport 2018. Available online: https://unctad.org/system/files/official-document/rmt2018ch4_en.pdf (accessed on 21 November 2020).
- UNCTAD. 2019. Economic Development in Africa Report 2019: Made in Africa: Rules of Origin for Enhanced Intra-African Trade. Available online: https://unctad.org/press-material/facts-figures-0 (accessed on 15 October 2020).
- UNCTAD. 2020. UNCTAD’s Review of Maritime Transport 2020: Highlights and Figures on Africa. Available online: https://unctad.org/press-material/unctads-review-maritime transport-2020-highlights-and-figuresafrica#:~:Text=Africa’s%20international%20trade%20relies%20heavily,3%25%20of20imports%20in%202020.&text=In%202019%2C%20African%20ports%20loaded,o%20this%20trade%20(imported) (accessed on 21 November 2020).
- United States Department of Transportation. 2017. Port Throughput. Available online: https://www.bts.gov/archive/publications/port_performance_freight_statistics_annual_report/2016/ch3 (accessed on 15 October 2020).
- United States Department of Transportation. 2021. Measures of Throughput and Capacity. Available online: https://www.bts.gov/archive/publications/ (accessed on 27 February 2021).
- US Government. 2021. Trade Is Key to Africa’s Economic Growth. Available online: https://ustr.gov/about-us/policy-offices/press-office/blog/trade-key-africa%E2%80%99s-economic-growth (accessed on 27 February 2021).
- Wilmsmeier, G., and J. Hoffmann. 2008. Liner shipping connectivity and port infrastructure as determinants of freight rates in the Caribbean. Maritime Economics & Logistics 10: 130–51. [Google Scholar] [CrossRef]
- World Bank. 2020. Monitoring Small-Scale Cross-Border Trade in Africa: Issues, Approaches, and Lessons. Available online: https://www.worldbank.org/en/topic/trade/publication/monitoring-small-scale-cross-border-trade-in-africa-issues-approaches-and-lessons (accessed on 15 October 2020).
- World Economic Forum. 2016. The Relationship between Trade and GDP? It’s Complicated. Available online: https://www.weforum.org/agenda/2016/10/the-relationship-between trade-and-gdp-its-complicated/ (accessed on 14 October 2020).
- Yakubu, M., U. Umar, and A. Z. Bello. 2014. Relationship between Money Supply and Government Revenues in Nigeria. Available online: https://www.econstor.eu/bitstream/10419/144784/1/861811348.pdf (accessed on 15 October 2020).
- Yeo, G. T., M. Roe, and J. Dinwoodie. 2008. Evaluating the competitiveness of container ports in Korea and China. Transportation Research Part A: Policy and Practice 42: 910–21. [Google Scholar] [CrossRef]
- Yihevis, Z., and J. Musila. 2018. The dynamics of inflation, exchange rates and the trade balance in a small economy: The case of Uganda. International Journal of Development Issues, Emerald Group Publishing 17: 246–64. [Google Scholar] [CrossRef]
Publisher’s Note: MDPI stays neutral with regard to jurisdictional claims in published maps and institutional affiliations. |
© 2021 by the author. Licensee MDPI, Basel, Switzerland. This article is an open access article distributed under the terms and conditions of the Creative Commons Attribution (CC BY) license (https://creativecommons.org/licenses/by/4.0/).