1. Introduction
According to the expected utility hypothesis, how much a participant in a consumer experiment would pay for a product or service can be predicted if we know the utility function of the consumer. However, the utility function of a consumer is nearly impossible to measure directly. This issue plays an important role in numerous consumer research projects designed to obtain measures of willingness to pay (WTP) from the participants in valuation experiments. Value elicitation techniques are widely used in field studies, including the demand for health products (
Hoffmann 2018), fuel-efficient stoves (
Berkouwer and Dean 2020), solar electricity (
Grimm et al. 2020), education programs (
Burchardi et al. 2020), improved latrines (
Yishay et al. 2017), business training (
Maffioli et al. 2020), among others.
Burchardi et al. (
2021) emphasize the importance of how WTP is measured and state that theoretically equivalent elicitation mechanisms with similar rates of comprehension differ only in practical performance. All variants of second-price auction procedures share a common structure, such that a participant enters a bid or value (their WTP), W. Then, a random price is drawn from an unknown distribution. If W is greater than the randomly obtained price, the participant purchases the product and pays the randomly obtained price; otherwise, no transaction takes place.
Burchardi et al. (
2021) underline that the rates of comprehension and optimal bidding are similar in all treatments; however, the dominant approach to WTP elicitation uses a variant of the classic
Becker et al. (
1964) (BDM) mechanism, in which a participant is asked to bid on a product or service using a single-response method to reveal the participant’s true valuation.
As a demand-revealing elicitation procedure, the BDM mechanism has a long history of use as a tool for measuring preferences (
Cason and Plott 2014). The method gives participants an incentive to respond with their true valuation by drawing a random bid price, to which the participants’ bid is compared. If the participant is acting as a seller and bids less than the random bid price, they sell the goods at the
random bid price. If the participant is acting as a buyer and bids higher than the random bid price, they will buy at an amount equal to the
random bid. Researchers using the BDM mechanism inform the participants that bidding the true value is the dominant strategy since the subject does not determine the price paid or received, but rather whether it is paid or received (
Cason and Plott 2014).
Alternative WTP elicitation mechanisms share the incentive properties of a second-price auction with different auxiliary properties, such as eliciting richer data, or providing the experimenter with practical advantages or more control over randomization. However, the advantages usually cause a loss of participant comprehension or trust in the implemented mechanism, which may result in bids that do not represent the participant’s true valuation. In addition,
Berry et al. (
2020) report that there is a substantial unobserved heterogeneity in demand estimates using either mechanism, which underscores the utility of measuring demand directly. It is critical to ensure that the participants of a BDM elicitation process comprehend the bidding procedure and, specifically, the randomly determined sale price. This important feature of a BDM type valuation is not a straightforward concept for participants, who may be unfamiliar with second-price auctions. This is a potential disadvantage of the procedure, because participants may incorrectly associate the bidding mechanism with the conventional bidding process in first-price auctions, where the highest bidder wins, causing unintentionally biased valuations. As highlighted in past research (
Kagel et al. 1987;
Ausubel 2004;
Li 2017), even highly educated participants find the second-price auctions difficult to understand. In addition, the comprehension level may decline if participants have a limited education or are not familiar with incentive structures and randomization (
Akbarpour and Li 2020). Moreover,
Bohm et al. (
1997) and
Mazar et al. (
2014) find that BDM-elicited valuations can be sensitive to the distribution of prices. Consequently, the reliability of BDM has been the subject of considerable research (
Cason and Plott 2014).
Plott and Zeiler (
2005) evaluated the potential problems of the demand-revealing value elicitation mechanisms and underlined issues that need to be addressed when conducting pricing experiments, including the BDM procedure. They concluded that results are
not to be trusted if certain controls are not implemented in the experimental procedure. These controls include anonymity, training in the bidding procedure, and a bidding outcome. According to
Plott and Zeiler (
2005), procedures should be designed to minimize or avoid “subject misconceptions”. However, the concept of “misconceptions” is not quantified nor operationally defined. They highlighted that value elicitation mechanisms might be unfamiliar and confusing to participants, and thus subtle and essential differences from similar simpler mechanisms might go unnoticed by participants. The BDM and other similar mechanisms are standard nonstrategic value elicitation tools for the researchers, but they are not necessarily familiar to all participants. Participants may assume that the bidding procedure follows common auction rules in which the highest bidder wins and pays the amount he/she offers. Even when participants are instructed to bid their true value and are told that doing so is their best interest, they may still follow strategies associated with common auctions if they do not fully understand the second-price auction procedure. As a result, the participants’ reported WTP may be significantly biased due to these comprehension issues associated with the elicitation mechanism.
In essence,
Plott and Zeiler (
2005) suggest
anonymity,
training,
practice round, and
binding outcome experience as the complete set of controls intended to eliminate subject misconceptions. The first control,
anonymity, is believed to mitigate the possibility of signaling. It is shown that the participants may adjust their actual valuations in an attempt to signal some personal characteristics to others, especially if the design of the experiment allows other participants to observe the experiment or the participants are familiar with the surveyor (
Fremling and Postner 1999). Moreover, anonymous decisions are more likely to make the participants focus on the reward and not the correct answer as viewed by others.
Fremling and Postner (
1999) hypothesize that subjects may be concerned with how others view them in the absence of anonymity, creating a bias in true valuation. For example, if a participant is known as a successful bargainer, he is expected to buy low and sell high. The same participant with a perfect understanding of the elicitation mechanism may adjust her behavior accordingly to show her bargaining skills to the other observing participants and the surveyor even though the mechanism does not reward that type of behavior.
The training provides the participants with a basic understanding of the BDM mechanism’s fine points. Following the training, a practice round helps participants understand the method. At this stage, the participants are encouraged to ask questions to clear up potential misconceptions. Finally, binding outcome experiences are employed to show the participants the consequences of their decisions. This step helps participants understand what they may lose prior to the actual experiment. This step is intended to eliminate the responses shadowed by the misconceptions of the valuation mechanism.
Within this context, the current research examines if conclusions derived from experiments utilizing the BDM procedure may be attributable to the participants’ confusion between second-price auctions and standard, highest-bidder-wins auctions. If this is the case, the results obtained from the BDM auctions may be considered biased and should be interpreted with care. To address this objective, we integrated a modified version of
Plott and Zeiler’s (
2005) proposed controls to deal with subject misconception. We offer two enhancements to improve the results obtained from BDM type valuation experiments. The first enhancement integrates a comprehension evaluation step into
Plott and Zeiler’s (
2005) controls to assess the participant comprehension level using two simple questions. This modification allows us to evaluate if the desired level of comprehension is achieved by the inclusion of controls and to compare the results obtained from the participants with different comprehension levels. The implemented design will enable researchers to isolate the biases attributable to participant comprehension-related issues.
The second enhancement is a treatment modification for participants who report an unwillingness to purchase the goods or services used in the experimental auctions. Typically, the BDM valuation method requires asking paid experimental participants if they are interested in purchasing the product or service in question. If they are willing to purchase, they are asked to make a binding bid. However, if a participant declares his or her unwillingness to purchase, the price of “zero” is entered as the participant’s bid amount. This practice conflicts with the very structure of the BDM type “demand-revealing” designs, as only those who demand the product should be considered bidders. We argue that without “willingness to purchase” one cannot test a participant’s “willingness to pay”. The enhancements will be explained in the next section in detail using the IKEA effect, a valuation effect that was reported to use a variant of the BDM type valuation.
The main contribution of this paper is to construct a conceptual bridge between the participants’ comprehension levels of the experimental process and the magnitude and statistical significance of the effect that researchers plan to test using a variant of the BDM procedure. The aim of this research is to test the hypothesis that a significant amount of subject misconception in BDM valuations causes biased results. If the misconception is an organic part of the BDM variants, researchers need to control the comprehension level to obtain accurate results that are not affected by the misconceptions.
2. The IKEA Effect
To evaluate the effectiveness of the proposed enhancements to the BDM valuation process, we employ them within the framework of the IKEA effect, introduced by
Norton et al. (
2012). The IKEA effect studies the impact of building an uncustomizable, standardized, utilitarian product, specifically, an IKEA box, on the valuation of that product, and
reportedly uses a variant of the BDM procedure for the valuation elicitation mechanism. The results suggest that building a product increases one’s valuation of the item (
Norton et al. 2012). The authors concluded that observed increases in valuation were attributable to the labor of the consumers involved in the assembly process and suggested that labor alone is sufficient to induce greater liking, and therefore higher valuation.
However, in those studies, the products were almost always hedonic and included customization opportunities, so their value may be connected to the subject’s creative contributions. In contrast,
Norton et al. (
2012) used an IKEA box with no customization opportunities, and found the same increase in valuation, which they attribute to the participant’s valuation of their labor. They concluded that observed increases in valuation could not be attributable to anything other than the labor of the consumers involved in the assembly process. Their work suggested that labor alone is sufficient to induce a greater liking. They call this phenomenon the “IKEA effect”. In the present study, for a conservative test of our hypothesis, we also utilize similar uncustomizable IKEA boxes to determine whether or not participants valuations are due to a misconception regarding the BDM second-price auction procedure.
3. Data, Models, and Methodology
3.1. Data
One hundred forty-nine students from an East Coast Liberal Arts College participated in the study (F = 73, M = 76, Mean ages: 20.7, SD: 1.49). Participants volunteered to complete the experiment and were randomly assigned to be either builders or non-builders. These conditions allowed us to control for the increased valuation due to labor (the IKEA effect) by offering a comparison between the valuations of those that performed labor (builders) as compared to those that did not perform labor to build the box (non-builders). Participants were placed in a room to complete the experiment anonymously. They were paid USD 5 to participate and told that, at the end of the experiment, they would have a chance to buy an IKEA box.
3.2. Models and Methodology
To test the effectiveness of our suggested enhancements, we re-evaluated the IKEA effect using
Plott and Zeiler’s (
2005) controls and the proposed enhancements. We reran the experiment in a highly detailed new design to address the potential participant misconceptions highlighted in
Plott and Zeiler (
2005), and added a critical evaluation step (enhancement 1) to assess the comprehension. As such, our work did not test the hypotheses already tested in
Norton et al. (
2012); that a plain IKEA box is considered a utilitarian product and that the builders prefer the boxes more than the non-builders.
Plott and Zeiler (
2005) emphasized that many researchers implemented controls to eliminate confounds but failed to agree on how to avoid subject misconceptions. Consequently,
Plott and Zeiler (
2005) suggest that controls cannot be presumed unless
all controls are exercised simultaneously. The authors highlight that the incentive-driven pricing mechanism of BDM needs to be well understood by the participants, and this is possible only when all proposed controls are simultaneously applied; otherwise, the results are not to be trusted.
Anonymity was implemented in this study by having students participate in the experiment in isolation from the other participants. Moreover, we did not collect identifying information. As such, we performed the entire experiment in a room with only one participant anonymously facing a paid surveyor, who was not known to the participant. Participants wrote their responses on a supplied form without disclosing any information to the surveyor. When finished, the participants inserted the form in a sealed box. It is important to note that
Norton et al. (
2012) performed the IKEA box building experiment with participants in the presence of others.
3.3. The Training, Practice Round, and the Binding Outcome Experience
Norton et al. (
2012) simply informed their participants about the procedure and that “at the end of the experiment, a random price from an unknown distribution will be drawn and if the participant’s bid amount were equal to or above that price, they would pay the randomly determined bid amount and take the box, and if their bid were below the random price they would not purchase the box”.
Experiment participants may not comprehend terms such as “a random price”, “an unknown distribution”, and “a randomly determined bid amount”. A participant’s lack of fully understanding these terms may lead to a subject misconception resulting in a biased answer. With this in mind, we informed the participants that, once they build or inspect the box, they will be given an opportunity to purchase the box; however, the price they are willing to pay must be higher than the price we obtain via a random drawing process. The participants are then told that there is a need to complete a training session to understand the process. In the training session, the participants are told to look at the standard college mug displayed on the shelf next to the table where the participant is seated. Once the participant is ready, the surveyor reads the following:
This is a training session, and there will be no transaction at the end. This training session will end with a practice round. Assume that you want to buy one of the mugs on display. Please consider the maximum price you are willing to pay for the mug and mark it on your sheet as your bid.
Then, we obtain the mug’s sale price using a random process, and if the sale price is higher than the participant’s bid, then no exchange takes place. However, if the price is less than their bid, they buy the mug and pay the randomly determined sale price, not the amount that they marked on the sheet. We then give a more comprehensive example to the participant by reading the following:
Assume that you saw a college mug on display in the bookstore with no price tag. You decided that you will buy the mug if the price is $4 or less. This is similar to the amount you mark on the sheet. You will find out the price of the mug when you ask for the price. If it is $3, you will pay $3 and buy it because it is less than the amount you are willing to pay. But if the price is $5, you will not buy it since it is higher than the max amount you are willing to pay. In our experiment, the price of the mug will be obtained through a random process.
Then, the participant is asked to mark the maximum price they are willing to pay for the mug. The surveyor draws the sale price of the mug from an unknown distribution and tells this price to the participant. The surveyor then asks the participant if he/she ended up purchasing the mug or no sale takes place and explains if they were right or wrong. Finally, as the binding outcome experience, the participant is asked what happens if they bid a price higher than what they are willing to pay for the mug. The surveyor provides a numeric example to show that if the randomly selected price is higher than the entered price, they will have to purchase the mug and end up paying higher than what they are willing to pay.
3.4. Measuring the Effectiveness of Training: The Quiz
Training the participants is intended to minimize the impact of a participant’s biased response attributable to the misunderstanding of the auction process. However, unless we measure the training’s effectiveness, we may not know if the training eliminates the subject misconception. To quantify the participants’ after-training comprehension level of the process, we introduce a two-question quiz:
The Quiz: You want to buy the mug on display, and the highest price you would like to pay is $3. A random drawing will determine the price of the mug.
Q1) Although you do not want to pay more than $3, you may bid a price higher than what you are willing to pay. In the end, you will pay the randomly determined sale price. Therefore, the amount you enter is essentially not important.
Answer: T( ) F( )
Q2) Although the sale price will be determined by a random process, entering a higher price increases your chance of purchasing the mug.
Answer: T( ) F ( )
The first question is intended to measure a BDM participant’s comprehension of the randomly determined sale price and its relationship with the participant’s bid. This question shows if the participants are aware of the differences in BDM-style auctions and the conventional highest-bidder-wins and pays-what-s/he-bids type of auctions. Participants who answered incorrectly (T) failed to understand the logic of randomly determined sale price in the BDM elicitations and indicated that they bid without a complete understanding of the BDM-style bidding process. The second question is intended to measure the participants’ comprehension of the price they are willing to pay. Participants who answered incorrectly (F) failed to understand how auctions work in general.
The quiz also enables us to contrast the comprehension level differences in two groups: builders and non-builders. If the comprehension level is not uniformly distributed among the participants, this may be attributable partly to the differences in the comprehension levels. For instance, if the non-builders, on average, have less comprehension of the max bid amount, this might contribute to the differences in the means and maybe highlighted as one reason why the average price offered by the non-builders is lower than the builders, rather than attributing the mean differences solely to the builders.
3.5. The First Enhancement: The Comprehension Issue
After completing the required rounds and the quiz, we move to the actual round. Following the original IKEA effect design of
Norton et al. (
2012), some participants are randomly assigned as builders to assemble a plain IKEA storage box and handed a sealed unassembled box with the assembly instructions inside. Other participants were given an assembled box and were told to inspect the box carefully. Our experiment was conducted in an East Coast Liberal Arts College with 149 randomly selected participants (F = 73, M = 76, Mean ages: 20.7, SD: 1.49). Participants volunteered to anonymously complete the experiment in a designated room. They were paid USD 5 to participate and told that, at the end of the experiment, they would have a chance to buy an IKEA box.
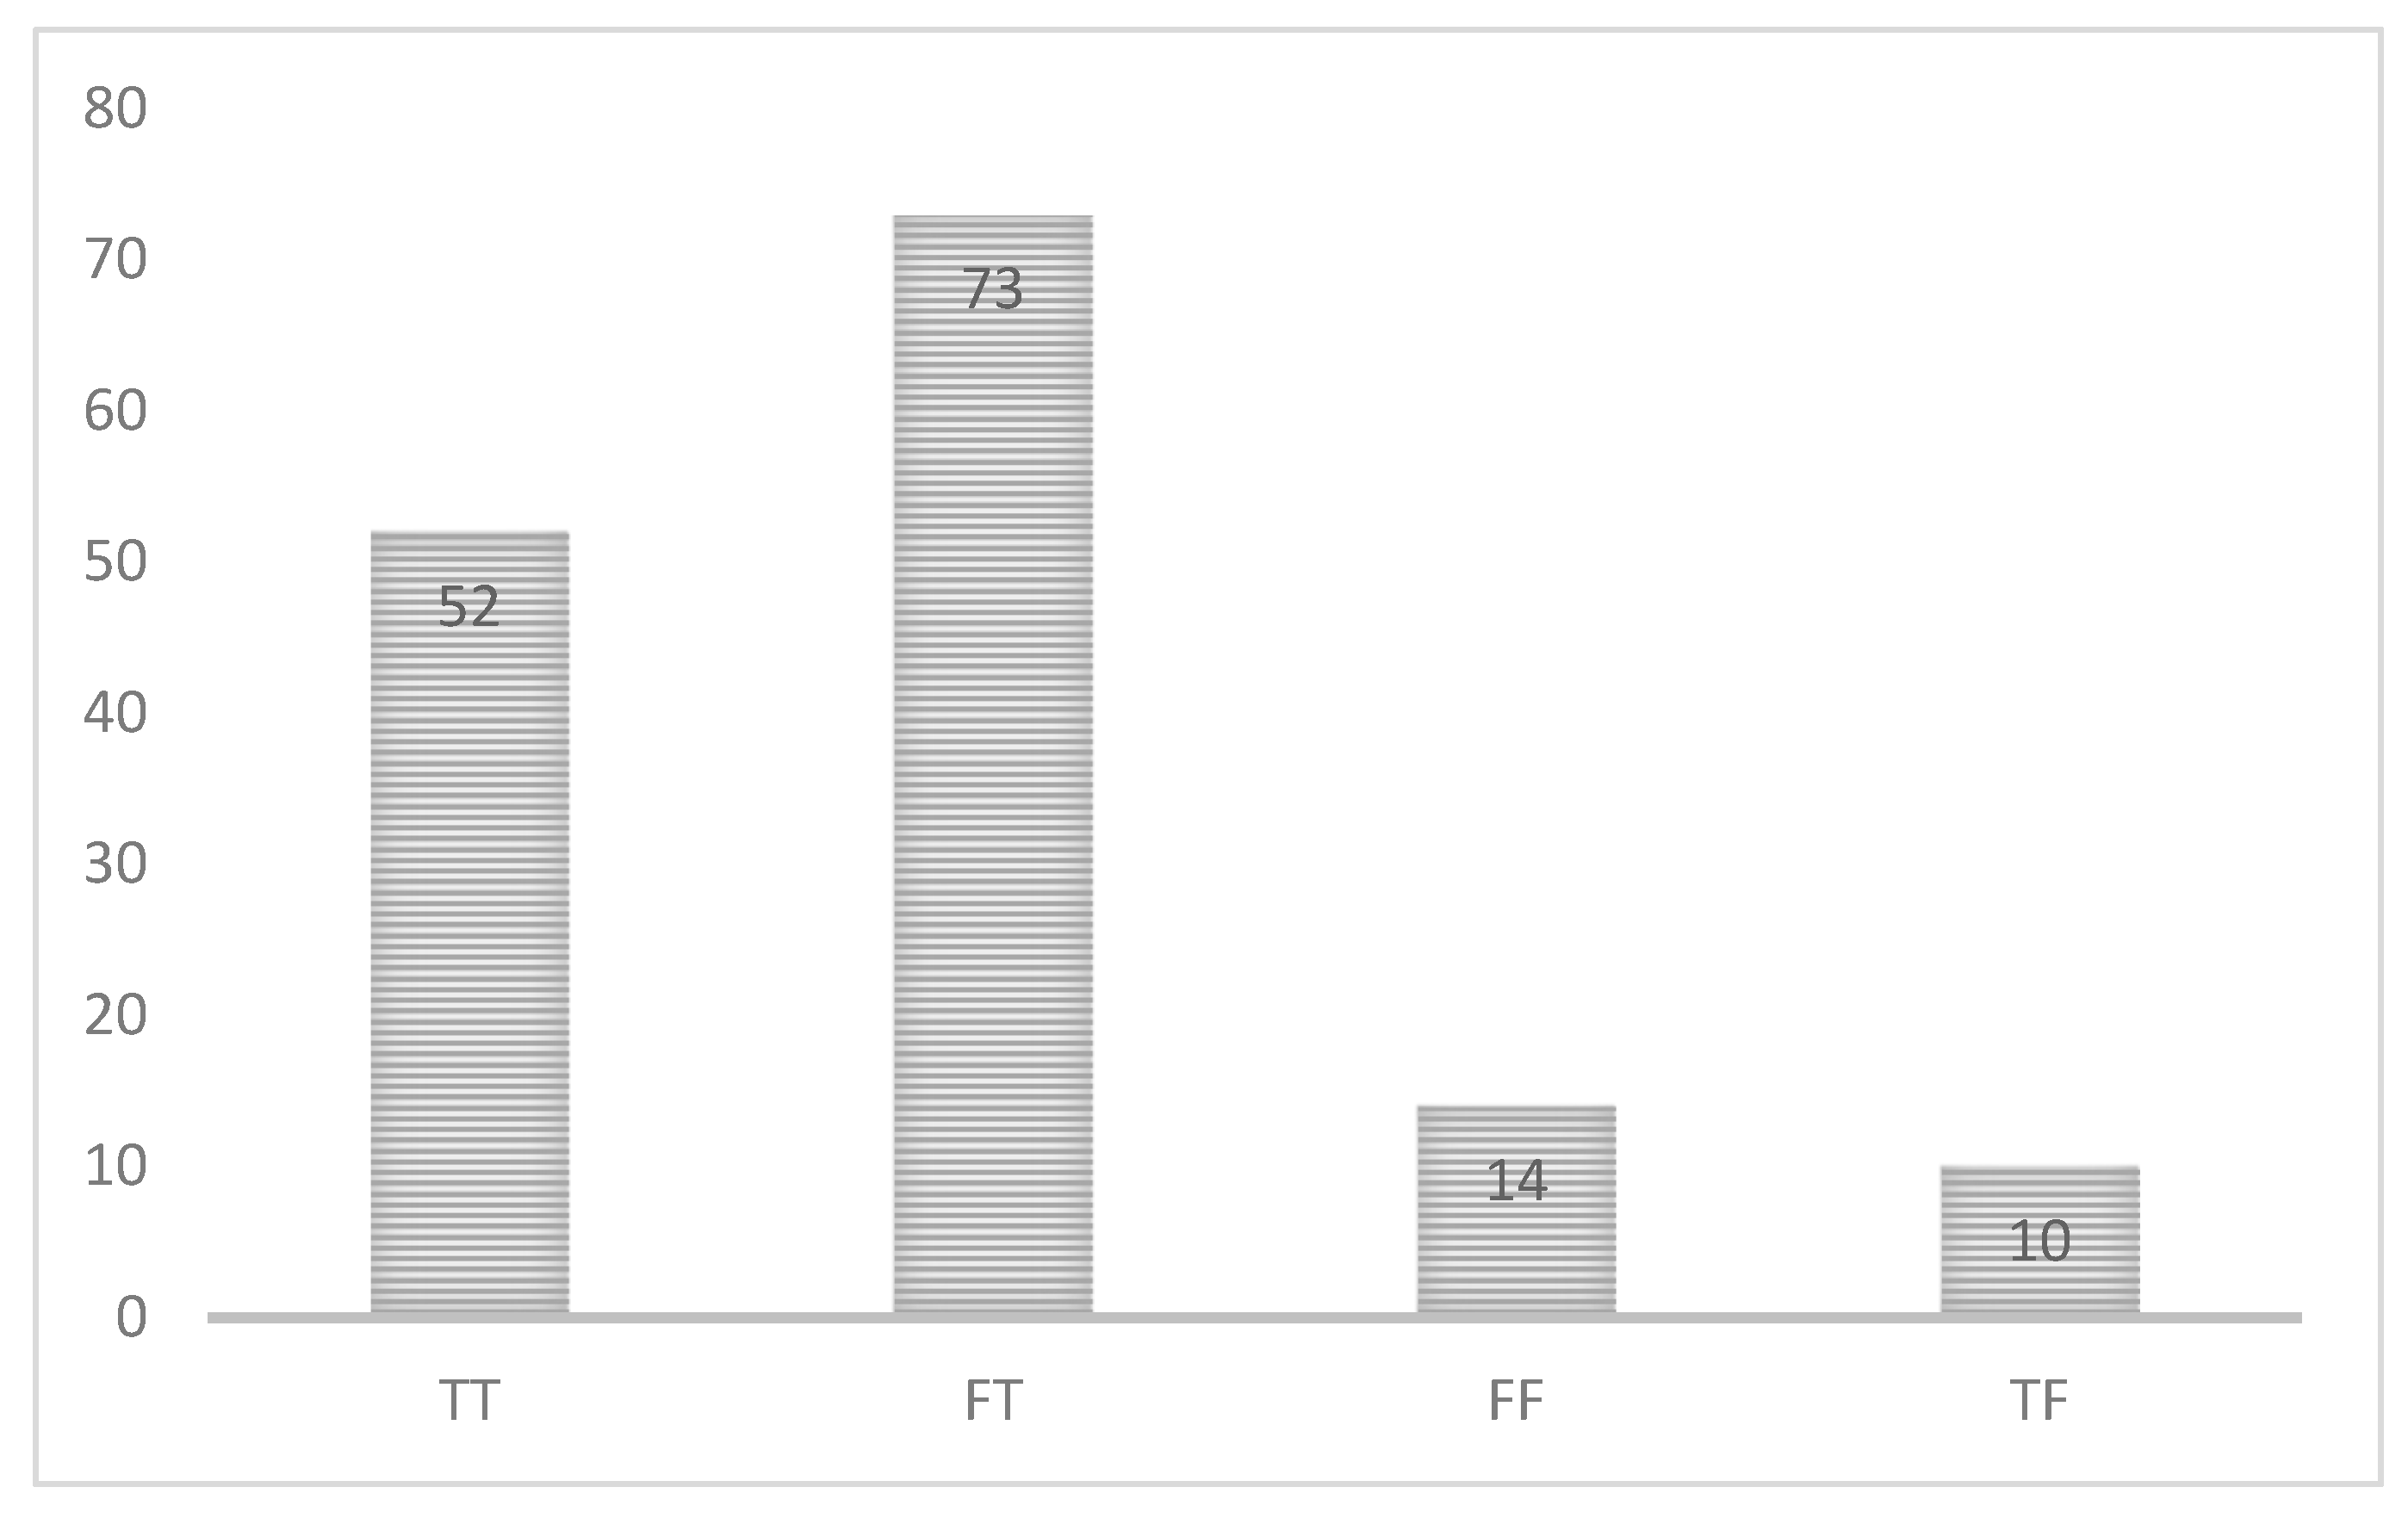
Figure 1 below summarizes the quiz results, and
Figure 2 provides us with the detailed results. A careful study of
Figure 1 and
Figure 2 show that, out of 149 participants, 10 of them (6.71%) incorrectly answered both quiz questions. Sixty-three participants (42.3%) answered the first question incorrectly, while only twenty-four participants (16.1%) answered the second question incorrectly. Seventy-three participants (49%) answered both questions correctly, and one hundred and thirty-nine participants (93.2%) answered at least one question correctly.
The first highlight of our results is that, despite the elaborate training process with repeated exercises, about 7 percent of the participants bid with very poor or no understanding of the bidding mechanism. A second highlight is that, even with the comprehensive training process, only about half of the participants bid with a complete understanding of the bidding mechanism employed. Overall, it was evident that there were comprehension issues in the BDM-type auctions and the results obtained from those experiments were not to be fully trusted.
Table 1 provides us with the group-specific quiz results and enables us to see if one group benefits more from the training than the other group. The results show that the builders benefited more from the controls compared to non-builders.
The first column of
Table 2 reports the results using the full set with 149 participants; the second column includes the participants who answered the first question correctly; the third column includes the participants who answered the second question correctly, and the fourth column includes the participants who answered at least one question correctly. Finally, the fifth column includes the participants who answered both questions correctly.
Table 2, and columns 2 through 5, show that the effect is more significant in magnitude and higher in statistical significance than the original set appearing in column 1 that includes all participants, regardless of their level of comprehension of the valuation process.
3.6. The Second Enhancement: Zero Bids
Norton et al. (
2012) participants were given USD 5 for participating in the IKEA box experiment and were told to build or inspect the IKEA box. Once completed, the participants were informed that, if they would like to purchase the box, they have the opportunity to do so. If they have no intention of purchasing the box, they can keep the USD 5 payment. For the participants who showed no interest in purchasing the IKEA box, a “zero” was entered as their bid for the box in
Norton et al.’s (
2012) experiment. However, these participants did not value the box at USD 0, they simply did not have any interest in purchasing it. Entering a zero conflicts with the BDM bidding method as a demand-revealing elicitation mechanism, since it is intended to obtain a value from the participants who would like to demand the product. Without a demand and a binding outcome, a participant simply supplies an opinion but does not engage in valuation.
We argue that an alternative elicitation, without the participants who have no intention of purchasing the box, provides us with useful information about the potential bias-inducing issue. To evaluate this impact we contrasted the results of the full sample with the alternative sample after the zero bids were removed. It is important to note that the alternative analysis is intended to run in addition to the full-set to gain additional intuition regarding the impact and is not intended as a replacement for the full-set analysis.
Table 2 in the previous section reports the results, assuming that the participants who are not interested in purchasing the box offered to pay “zero” for the box. However,
Table 3 excludes those participants and uses the bids obtained from the participants who would like to purchase the IKEA box they built or inspected. A quick comparison of
Table 2 and
Table 3 reveals that, when we exclude the participants with no desire to purchase the IKEA box, the difference in the group means and the statistical significance increases dramatically in all categories with no exceptions. When we compare the full set, the mean difference increases from USD 0.34 to USD 0.53, and the
p-value improves from 0.0636 to 0.0172. Similarly, if we compare the Q1 wrong column, we see that the mean difference increases from USD 0.60 to USD 0.84, with the
p-value improving from 0.022 to 0.006.
4. Results and Discussion
To assess the impact of excluding the zero bids on the original IKEA box experiment of
Norton et al. (
2012), we re-evaluated the results by excluding the zero bids using their original data. The results are tabulated in
Table 4A together with the additional truncation applications shown in
Table 4B,C. Truncations are common practices to eliminate the impact of extreme values. Extreme values are more common in BDM variants due to the bids resulting from
highest-bidder-wins misconceptions.
Table 4A reports the original
Norton et al. (
2012) results,
Table 4B shows the original results with truncated extreme values, and
Table 4C removes the zero bids and imposes the same truncations.
Table 4B shows that, with the zero bids in the data, the truncations lower the statistical significance of the IKEA effect as the
p-value declines from 0.039 to 0.10. If we truncate the single lowest nonzero bid, the t-value is 1.99 (
p = 0.0573), and if we truncate both the highest and the lowest values (just two observations) simultaneously, the new t-value is 1.70 (
p = 0.10).
Table 4C shows that, without the zero bids, the corresponding
p-value declines from 0.045 to 0.082. If we remove the zero bids and truncate the extreme values, we observe a dramatic decline in the
p-value down to 0.21. If we truncate the single highest bid, the t-value is 1.45 (
p = 0.153); if we truncate the single lowest bid, the t-value is 1.6 (
p = 0.117); and, finally, if we truncate both the single lowest and highest bids, the value is 1.25 (
p = 0.217). This re-evaluation using the original data shows how much the results depend on the value of a single observation.
Table 4 shows that the IKEA effect without controls is not statistically or economically significant if we truncate the extreme values and remove the zero bids.
In an attempt to test this hypothesis, we produced
Table 5 using our results, with the controls intended to deal with the comprehension-related biases.
Table 5A shows our results with the proper controls. Our t-value is 1.86 (
p = 0.064).
Table 5B shows that, with the zero bids in the data, the truncations do not change anything significantly. However, when zero bids are removed and the truncations are applied, the statistical significance of the IKEA effect increases dramatically with a t-value of 3.25 (
p = 0.017).
Table 5 is important to support the hypothesis that the results obtained from the BDM elicitation procedure are subject to a misconception bias and they do not purely reflect the IKEA effect. Therefore, researchers should use the proposed controls and impose truncations to address potential biases. The mean difference increases from 0.345 to 0.54 (56 percent increase), while the t-statistics increases from 1.87 to 3.25 (p-value improves from 0.0636 to 0.017).
5. Conclusions
If the participants’ misunderstandings of the BDM elicitation mechanism impacts the results, part of this effect may be attributable to subject misconception. The pure effect can be obtained if the participants’ valuations are not subject to the miscomprehension of the process. Our first enhancement attempts to address the potential bias by integrating an evaluation step to the proposed
Plott and Zeiler (
2005) controls to quantify whether the controls effectively achieved the desired level of comprehension. While some controls, such as anonymity, contributed to the results of the reliability, other controls intended to reduce or eliminate the subject misconception may not be uniformly effective across the participants. Our integrated comprehension evaluation step quantifies if the participants’ subject misconception issues are adequately addressed using a simple two-question quiz. Identifying the comprehension level of the data helps us to understand the effect attributable to misconception. Our study is the first in which the comprehension level of participants is embedded in the data without compromising anonymity. This feature helps us see if the alternative results improve the effect’s magnitude and statical significance. It is worth noting that the alternative results obtained from the subset of data should not be interpreted as “in place of the full-set results” but intended as “in addition to the full-set results”. This is important since the potential biases, which originated from the BDM elicitation method’s comprehension, may be correlated with the cognition and dropping observations of individuals who are prone to behavioral priming, and may introduce a different form of bias.
In other words, we tested the post-training comprehension level to identify the data obtained from the participants with poor comprehension. Using these data, we obtain valuable information about the impact of comprehension on the tested effect. Our application showed that the IKEA effect’s size and significance depended on the participants’ comprehension level of the elicitation mechanism. When the data with different comprehension levels were analyzed separately, the effect’s statistical and economic significance changed. Our results obtained from the full set yielded a USD 0.34 difference in means with a p = 0.064, while the difference in means using the participants who answered the first quiz question correctly was USD 0.60 with a p = 0.022; the difference in means with the participants who answered the second quiz question correctly was USD 0.46 with a p = 0.029. Finally, with the participants who answered both questions correctly, we obtained the highest difference in means, USD 0.68, with a p = 0.022.
If we evaluate the effect of using the participants who wished to purchase the box and answered both quiz questions correctly, the mean difference was USD 0.87 with a p-value of 0.0132. It is worth noting that, out of 149 participants, excluding only 10 who answered both quiz questions incorrectly, there were remarkable improvements in economic and statistical significance. This suggests that a researcher need not include only the participants with a full comprehension but may exclude the participants with very poor comprehension.
We also argue that considering the participants with no intention to purchase the IKEA boxes as “zero-bidders”, conflicted with the essence of the BDM mechanism. To see the impact of this modification, we obtained the alternative results (not
in place of but
in addition to full-set results) without the participants with no intention to purchase the box and observed that the modification had a remarkable impact on the size and significance of the effect. The magnitude and the statistical significance of the IKEA effect improved dramatically when the participants with no intention to buy were excluded from the valuation in our study with proposed enhancements. This is more visible in a truncated version that excludes the extreme values. Truncations are popular to eliminate the bias-inducing impacts of extreme values so that the results will not be affected by a few very high or low data. Truncations were much more important in BDM type valuations in the presence of valuation, procedure-related misconceptions that might create extreme values. The dramatic improvements in size and significance with truncations are shown in
Table 4. When the experiment was conducted without the controls and with zero bids, participants’ subject misconceptions produced results incorrectly attributable to the IKEA effect.
The results show that the degree of comprehension of the mechanism and the magnitude and statistical significance of the effect go hand-in-hand; therefore, studies designed with no assessments of comprehension may produce biased results incorrectly attributable to pure effects. Our work shows that implementing the
Plott and Zeiler (
2005) controls in demand-revealing elicitation mechanisms such as BDM is necessary as they cover multiple grounds to eliminate potential biases. Our quiz with two simple questions is not experiment-specific and can be used for any BDM elicitation experiment without modification. We emphasize that the enhancements are not “in place of” but “in addition to” the traditional use of BDM and its variants; therefore, researchers can safely adapt them with BDM variants and obtain results to compare with the traditional results without controls.
The most important policy implication of this study is to introduce a comprehension evaluation step that helps researchers to observe the direction of change in results that are tied up to variables in question, in our case, the comprehension level of the participants. Our study suggested that the BDM elicitation method was enhanced if the researchers could extract more information from the participants. This is possible by annexing an evaluation stage to the surveys using the BDM method.
If the issue is the comprehension level of the participants, our simple quiz can be used for any BDM application. On the other hand, if the issue is different, we suggest that the researchers append their survey by adding a question or two to obtain identifying information from the participants without compromising anonymity.
Another policy implication of the paper is to promote truncations for the BDM elicitation method due to the increased likelihood of comprehension issues in the method. While truncations are intended to eliminate the impact of extreme data points, the BDM elicitation method is more likely to promote the extreme data points due to participants confusing the second-price auctions with first-price auctions. This point is visible in the original IKEA effect: If a single extreme observation is removed, the IKEA effect is not statistically significant at the usual 5 percent level.


