Article

Seeing the Woods for the Trees Again: Analyzing Evolutionary Diagrams in German and US University-Level Textbooks

Biology Education Research and Learning Lab, University of Duisburg-Essen, 45117 Essen, Germany
*
Author to whom correspondence should be addressed.
Educ. Sci. 2021, 11(8), 367; https://doi.org/10.3390/educsci11080367
Submission received: 27 May 2021 / Revised: 14 July 2021 / Accepted: 16 July 2021 / Published: 21 July 2021
(This article belongs to the Section Higher Education)

Abstract

:
Phylogenetic trees are important tools for teaching and understanding evolution, yet students struggle to read and interpret them correctly. In this study, we extend a study conducted by Catley and Novick (2008) by investigating depictions of evolutionary trees in US textbooks. We investigated 1197 diagrams from 11 German and 11 United States university textbooks, conducting a cross-country comparison and comparing the results with data from the 2008 study. A coding manual was developed based on the 2008 study, with extensions focused on additional important aspects of evolutionary trees. The US and German books showed only a low number of significant differences, typically with very small impacts. In both samples, some characteristics that can render reading trees more difficult or foster misconceptions were found to be prevalent in various portions of the diagrams. Furthermore, US textbooks showed fewer problematic properties in our sample than in the 2008 sample. We conclude that evolutionary trees in US and German textbooks are represented comparably and that depictions in US textbooks have improved over the past 12 years. As students are confronted with comparable depictions of evolutionary relatedness, we argue that findings and materials from one country should easily be transferable to the other.

1. Introduction

Phylogenetic trees are graphical representations of evolutionary relationships and are fundamentally important in modern biology, particularly taxonomy and evolutionary biology [1,2,3]. Not only are they indispensable tools in teaching about evolution [2,4,5], but they are also used in a wide variety of practical applications [6,7].
Despite their importance, numerous studies have shown that students struggle with reading, interpreting, and constructing evolutionary trees, both at the university [5,8,9,10,11,12,13] and high school levels [14,15].

1.1. Historical Development of Evolutionary Trees

For many decades, mankind wanted to organize living creatures, group together similar organisms, and look for a kind of system to represent this graphically. In the earliest depictions of the organization of nature, we find linear arrangements, also called the ‘chain of being’ or ‘ladder of life’ [16]. These depictions typically depicted not only biological species or groups, but showed other aspects like elements, angels, or God. Similar hierarchical organizations of the world are known to go back to the ancient Greeks [17]. Because of the linear representation, they often imply the concept that living beings can be ordered by complexity and that some organisms are more complex or can be seen as ‘higher’ than other organisms [18]. The idea of more or less developed species is still present today and is seen as one of the most widespread learners’ misconceptions in the field of evolutionary trees [18,19,20].
Later taxonomic depictions experimented with numerous different representational styles, some of which were very complex and hard to read. In many cases, the idea of some species, especially humans, being more complex and ‘higher developed’ than others, was present [18,21]. In many cases, these depictions were not only displaying the organization of life, but also metaphysical ideas or aspects of cosmology [17]. Lamarck published the first depiction which can be seen as an evolutionary tree [22,23]; this diagram was following the idea that extant species developed from other extant species. Therefore, it was also implying the idea of different complexities or hierarchies of living beings.
The first tree diagram displaying the idea of Darwin’s theory of evolution was depicted in one of his notebooks and is widely known as the ‘I think’ tree [16,22]. In his notebooks, Darwin frequently used the analogy of a branching tree for the organization of life, even though he never used the term tree to describe his treelike depictions.
Another very important step in the history of representing the relatedness of species was Willi Hennig’s work on systematics [24], which acted as a basis for modern cladistics. Following his idea, taxonomic classifications should only be inferred from phylogenetic relatedness, thereby introducing the central concept of modern evolutionary trees: the nested organization of monophyletic groups [3].
Current developments in investigating evolutionary relatedness are expanding the perspective of viewing evolutionary trees. Because of phenomena like the evolution of genes in viruses and prokaryotes, gene trees, lateral gene transfer and general noise or uncertainty in data analysis, it is argued that the treelike depiction of evolutionary relatedness is only of limited use and that more expanded networks would better depict the relationships between different taxonomic groups [25,26,27]. These contemporary demands to alter the view on the depiction of evolutionary relatedness shows that the field of evolution is still in development and that representations need to change in order to follow theoretical and empirical findings.

1.2. Importance of Evolutionary Trees

In reference to Dobzhansky’s famous quote about the importance of evolution for general biology [28], Gould and McFadden postulated that “Nothing in Evolution makes sense without a phylogeny” [29]. There are hardly any sub-disciplines of biology in which phylogenetic analyses do not play an important role in modern science, not only for science communication but also research and education [1,4,5]. It is argued that evolutionary trees are an indispensable tool in teaching about evolution, be it in formal [30,31] or informal education [32,33], and they have been integrated into many national curricula [15].
In the past, there have been numerous practical applications of phylogenetic analysis. In the field of medicine, it was used to investigate the spread and development of the SARS-CoV-2 pandemic (e.g., [34,35]). Phylogenetics have also been used in fields like wildlife conservation [36] and forensics [37].
Despite the importance for understanding evolution in particular and biology in general, and the number of practical applications, numerous studies have shown that students are struggling with reading and interpreting evolutionary trees [8,11,14] and that numerous learners’ conceptions are widely present [19,20].

1.3. Difficulty of Reading Tree-Diagrams

The way evolutionary trees are presented to learners can heavily influence the difficulty of reading the tree and the way it is interpreted. Adding information can make it easier to interpret trees, and again, some kinds of information or characteristics can hinder the learning process. As in most fields of biology, teleological misconceptions [38] are prevalent in the context of evolutionary trees [39], but additionally, more general misconceptions about evolution can be supported by ambiguous diagrams [19].
There are several properties of an evolutionary tree that can influence the way that students, especially novice learners, read and interpret the tree. In the course of this publication, we describe a number of properties which have been covered in published articles. Many of these properties can be linked to well-known learners’ misconceptions and can potentially reinforce these erroneous ideas. Potential hurdles investigated in this study will be explained in detail during the presentation of the coding manual in the material and methods section.
As textbooks are known to have a major influence on learning outcomes and they can shape students’ view on a topic [40], educators need to be aware of the difficulties and learning opportunities they provide. In the context of evolutionary trees, it is therefore important to investigate the way they are represented in current university-level textbooks to inform educators about the prevalence of different diagrammatic properties and potential learning obstacles. Knowledge about the prevalence of ambiguous properties of evolutionary trees can allow educators to specifically discuss these properties with their students to prevent them from reinforcing learners’ misconceptions.
In a study published in 2008, Catley and Novick [41] investigated evolutionary diagrams in US textbooks for different school types, ranging from middle-school life science books to college introductory biology textbooks. They investigated 697 diagrams in 31 textbooks and concluded that many diagrams were confusing and could potentially reinforce misconceptions about (macro-) evolution. They called for changes in the way evolutionary trees are represented in textbooks and recommended that educators familiarize themselves with problematic representations to decrease their potentially negative effect on students’ learning [41].

1.4. Aim and Scope

In this study, we document the styles, properties, and usage of evolutionary diagrams in 22 modern university textbooks from Germany and the United States. For ease of reading, we refer to the English books as US books, even though they might be used internationally. This study is a revisit and extension of Catley and Novick’s 2008 investigation of US biology textbooks, as most US books examined were newer editions of books they previously investigated. We also examined additional aspects of tree diagrams and extended the sample to German textbooks to allow for a cross-country comparison of educational literature. We analyzed the extent to which the results of Catley and Novick can be replicated with variations in both time and geographic location.
We chose to include a sample from a different country, as so far only US-American textbooks have been investigated regarding their depiction of evolutionary trees. Findings from this earlier study cannot be transferred to other countries without further investigations. This study can be seen as an exemplary approach, which can be replicated by researchers from different countries to investigate diagrammatic representations of evolutionary relatedness in their educational systems. Beyond that, comparing US-American textbooks with educational material from other countries can reveal differences or insights from which educators in both countries can profit.
Because Catley and Novick [19] called for changes in life science textbooks regarding evolutionary trees, revisiting the textbooks they investigated in their current editions may show whether their shortcomings have been improved. Since that study was published more than a decade ago, significant research has been conducted on the way students read and interpret evolutionary trees, and more than 50 scientific articles have been published on the general topic of tree-reading. Among other insights, multiple aspects of tree design were identified that can have an influence on how difficult it is to read an evolutionary tree. With these new insights into the way students work with evolutionary trees, and because textbooks can differ significantly over the course of multiple editions, it is worthwhile to assess the current state of university-level textbooks. Therefore, parts of this study can be seen as a replication study with a contemporary sample, while other parts are an extension of the original design.
The results of this study provide new insights into the properties of evolutionary trees that students are confronted with in their educational material. Additionally, educators and researchers can gain insights into whether evolutionary tree diagrams used in modern textbooks represent the current thinking in evolutionary biology and can assess whether these diagrams reproduce or reduce common misconceptions. Furthermore, a cross-country comparison showing only small differences between tree diagrams in US and German textbooks could be an argument for the easy translatability of educational material from one country to the other, as students who are educated using similar books will likely profit from similar educational activities.

2. Materials and Methods

2.1. Textbook Selection

We investigated university-level textbooks about either general biology or evolution, excluding books about specific (taxonomic) groups with topics such as zoology, microbiology, or botany, to obtain a general sample of which organisms are discussed. In the next step, we excluded books with a special focus, such as social evolution or statistics of evolution, as well as books not written for university-level education. We chose to include as many books as possible from Catley and Novick’s 2008 study. Lastly, we investigated an even number of German and US textbooks to allow for a better cross-country comparison. In total, 22 university-level textbooks for general biology or evolution were included in the study: 11 German and 11 English books (see Appendix A). Some German books are translations of international textbooks (e.g., Purves Biologie, or Evolution, Ein Lese-Lehrbuch). On the first glance, it may look like this might distort the comparison of German and US textbooks. However, investigating widely used textbooks can give insights into the diagrams used in education in that country, whether these books are translations or not. Excluding books that are translated from other languages could strongly distort the study.

2.2. Diagram Selection

The selected books were searched for all forms of diagrams depicting evolutionary relatedness, both in treelike formats and in other styles. To be included as a valid diagram, at least three groups had to be presented, allowing for a three-taxon statement [42] to be made. All diagrams showing macro-evolutionary processes or the relationship of groups at or above the species level were included. Explicitly excluded, therefore, were all pedigrees or other representations that display the relationship of individual organisms. After reviewing the textbooks, a total of 1197 diagrams were included in the study: 792 diagrams from English textbooks, and 405 diagrams from German textbooks (see Appendix A).

2.3. Coding

The coding manual was designed based on the categories used in Catley and Novick’s 2008 study. While selecting the diagrams, potentially important features not included in their study were noted, and some of those features were then implemented in the coding manual after reviewing the literature. Furthermore, we included properties that could be of interest to educators and researchers, such as the number of groups or the organisms represented in the trees.
The coding manual was organized into five main categories, with a total of 26 sub-categories. The coding categories are strongly based on those used by Catley and Novick (2008), but were adjusted and extended based on newer findings in the literature. For an overview of the included categories and the extent to which they were part of Catley and Novick’s study, see Table 1.

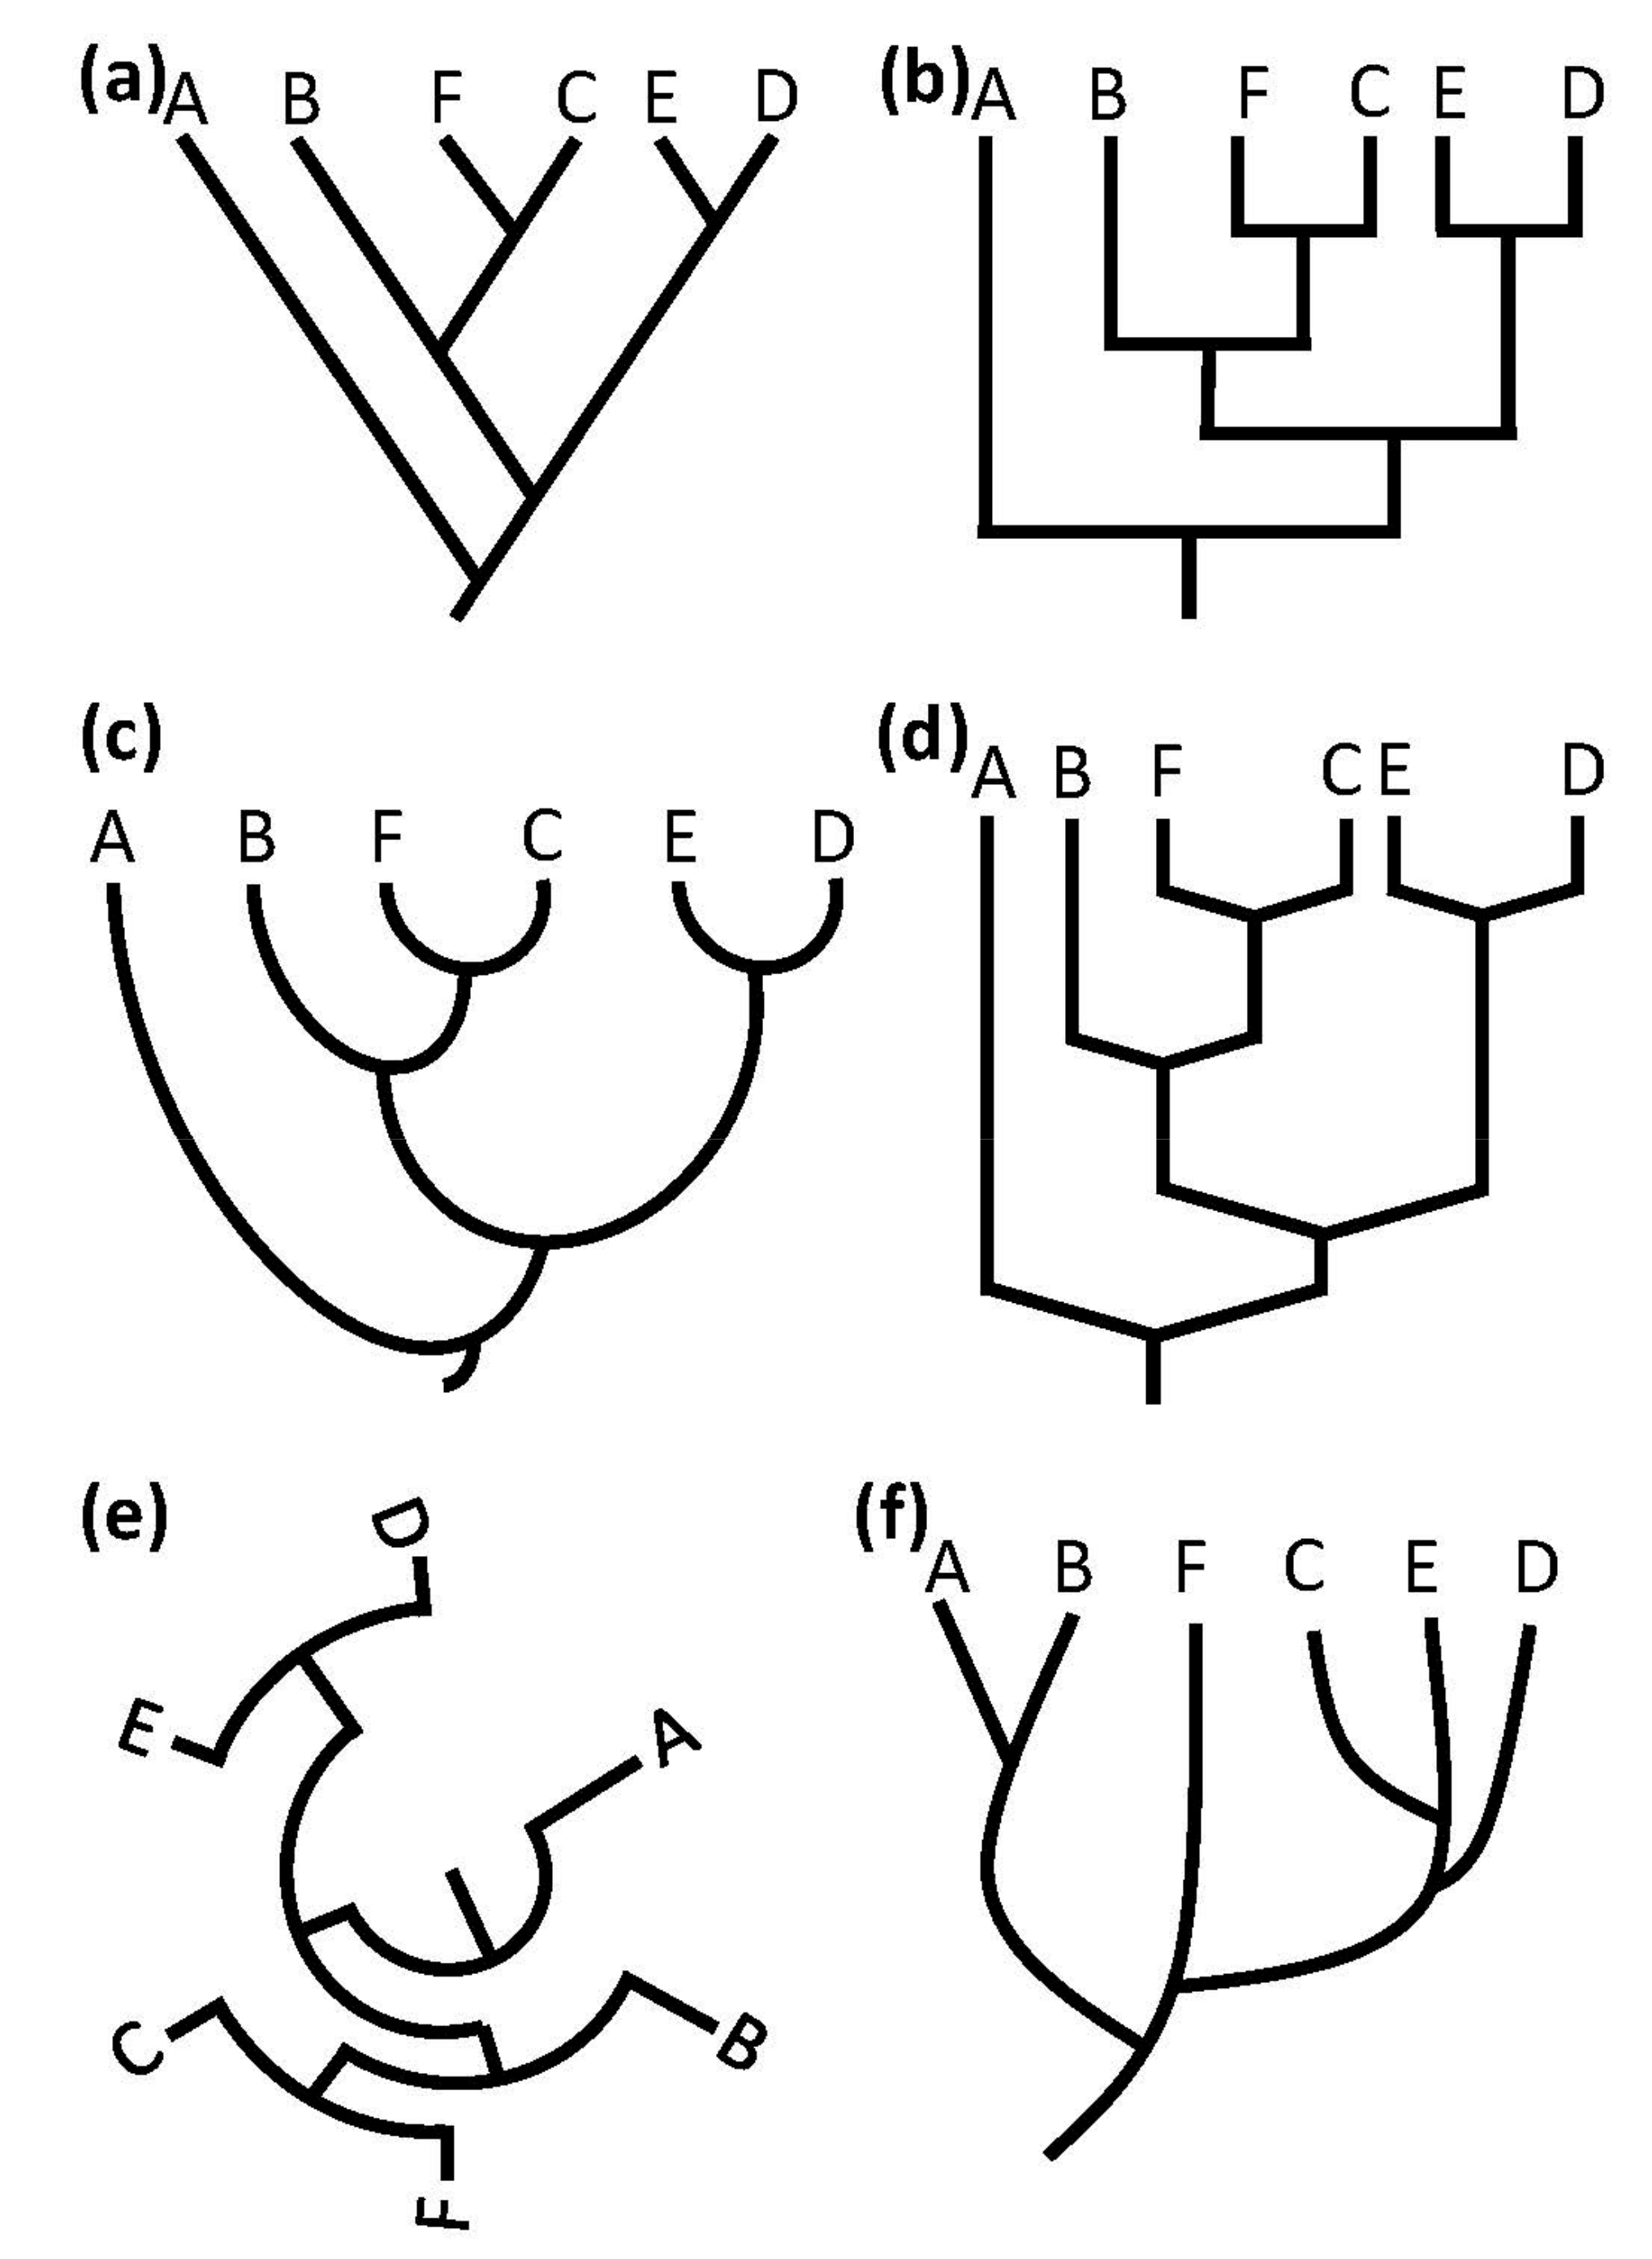
2.4. Tree Structure/Topology

The investigated diagrams were first analyzed by considering their general type. Here, we distinguished between tree and non-tree diagrams. All diagrams composed of nodes connected by lines were defined as trees. The most prominent styles used in educational literature are rectangular, diagonal, and circular trees (see Figure 1) [19]. Rectangular trees show lines diverging into two directions at each internal node, creating the form of a bracket at each branching point. In diagonal trees, the lines typically branch at acute angles. In most cases, the line leading to a branching point continues after the branching event. In circular trees, the root is in the center, and the lines lead to the outside. The general layout is like rectangular trees, but the orthogonal lines following a branching event are not straight but follow a circle’s curvature. In all three cases (rectangular, diagonal, or circular), diagrams were also included when the corners where lines meet were displayed in a rounded form. The style of a tree diagram can have a major influence on how difficult it is to read and interpret the tree. Considering the diagonal style in particular, a number of studies show that there are more misconceptions linked to this topology than to rectangular trees, and that students make more mistakes when working with diagonal trees [1,43,44,45,46]. Furthermore, teleological interpretations of trees can be fostered using a diagonal tree style [44].
In addition to the three main styles, Tree-of-Life depictions were categorized. In these cases, species are presented in a manner implying that earlier-evolved organisms might be “less developed” than others. In extreme cases, this includes historical depictions, such as Haeckel’s trees of life. The main difference between this category in our study and the corresponding one in Catley and Novick’s 2008 study is that we focused on a broader spectrum of evolutionary trees, while they addressed cladograms specifically.
If a treelike depiction could not be assigned to any of these categories, they were labeled as “other tree”. Here, we find diagrams where, for example, the connections of nodes are not represented by straight lines, but by edges arranged in an irregular form, such that they do not qualify as rectangular or diagonal. All remaining diagrams were categorized as “non-tree-diagrams”.

2.5. Branch Structure

After assessing general chart type, the structure and representation of the edges were investigated. Here, we identified different properties of the tree, some of which could not be coded with “other tree” or “non-tree diagrams” because of the nature of the representations. These properties are not mutually exclusive. A total of nine traits were investigated in this category (see Figure 2); the order does not bear any meaning:
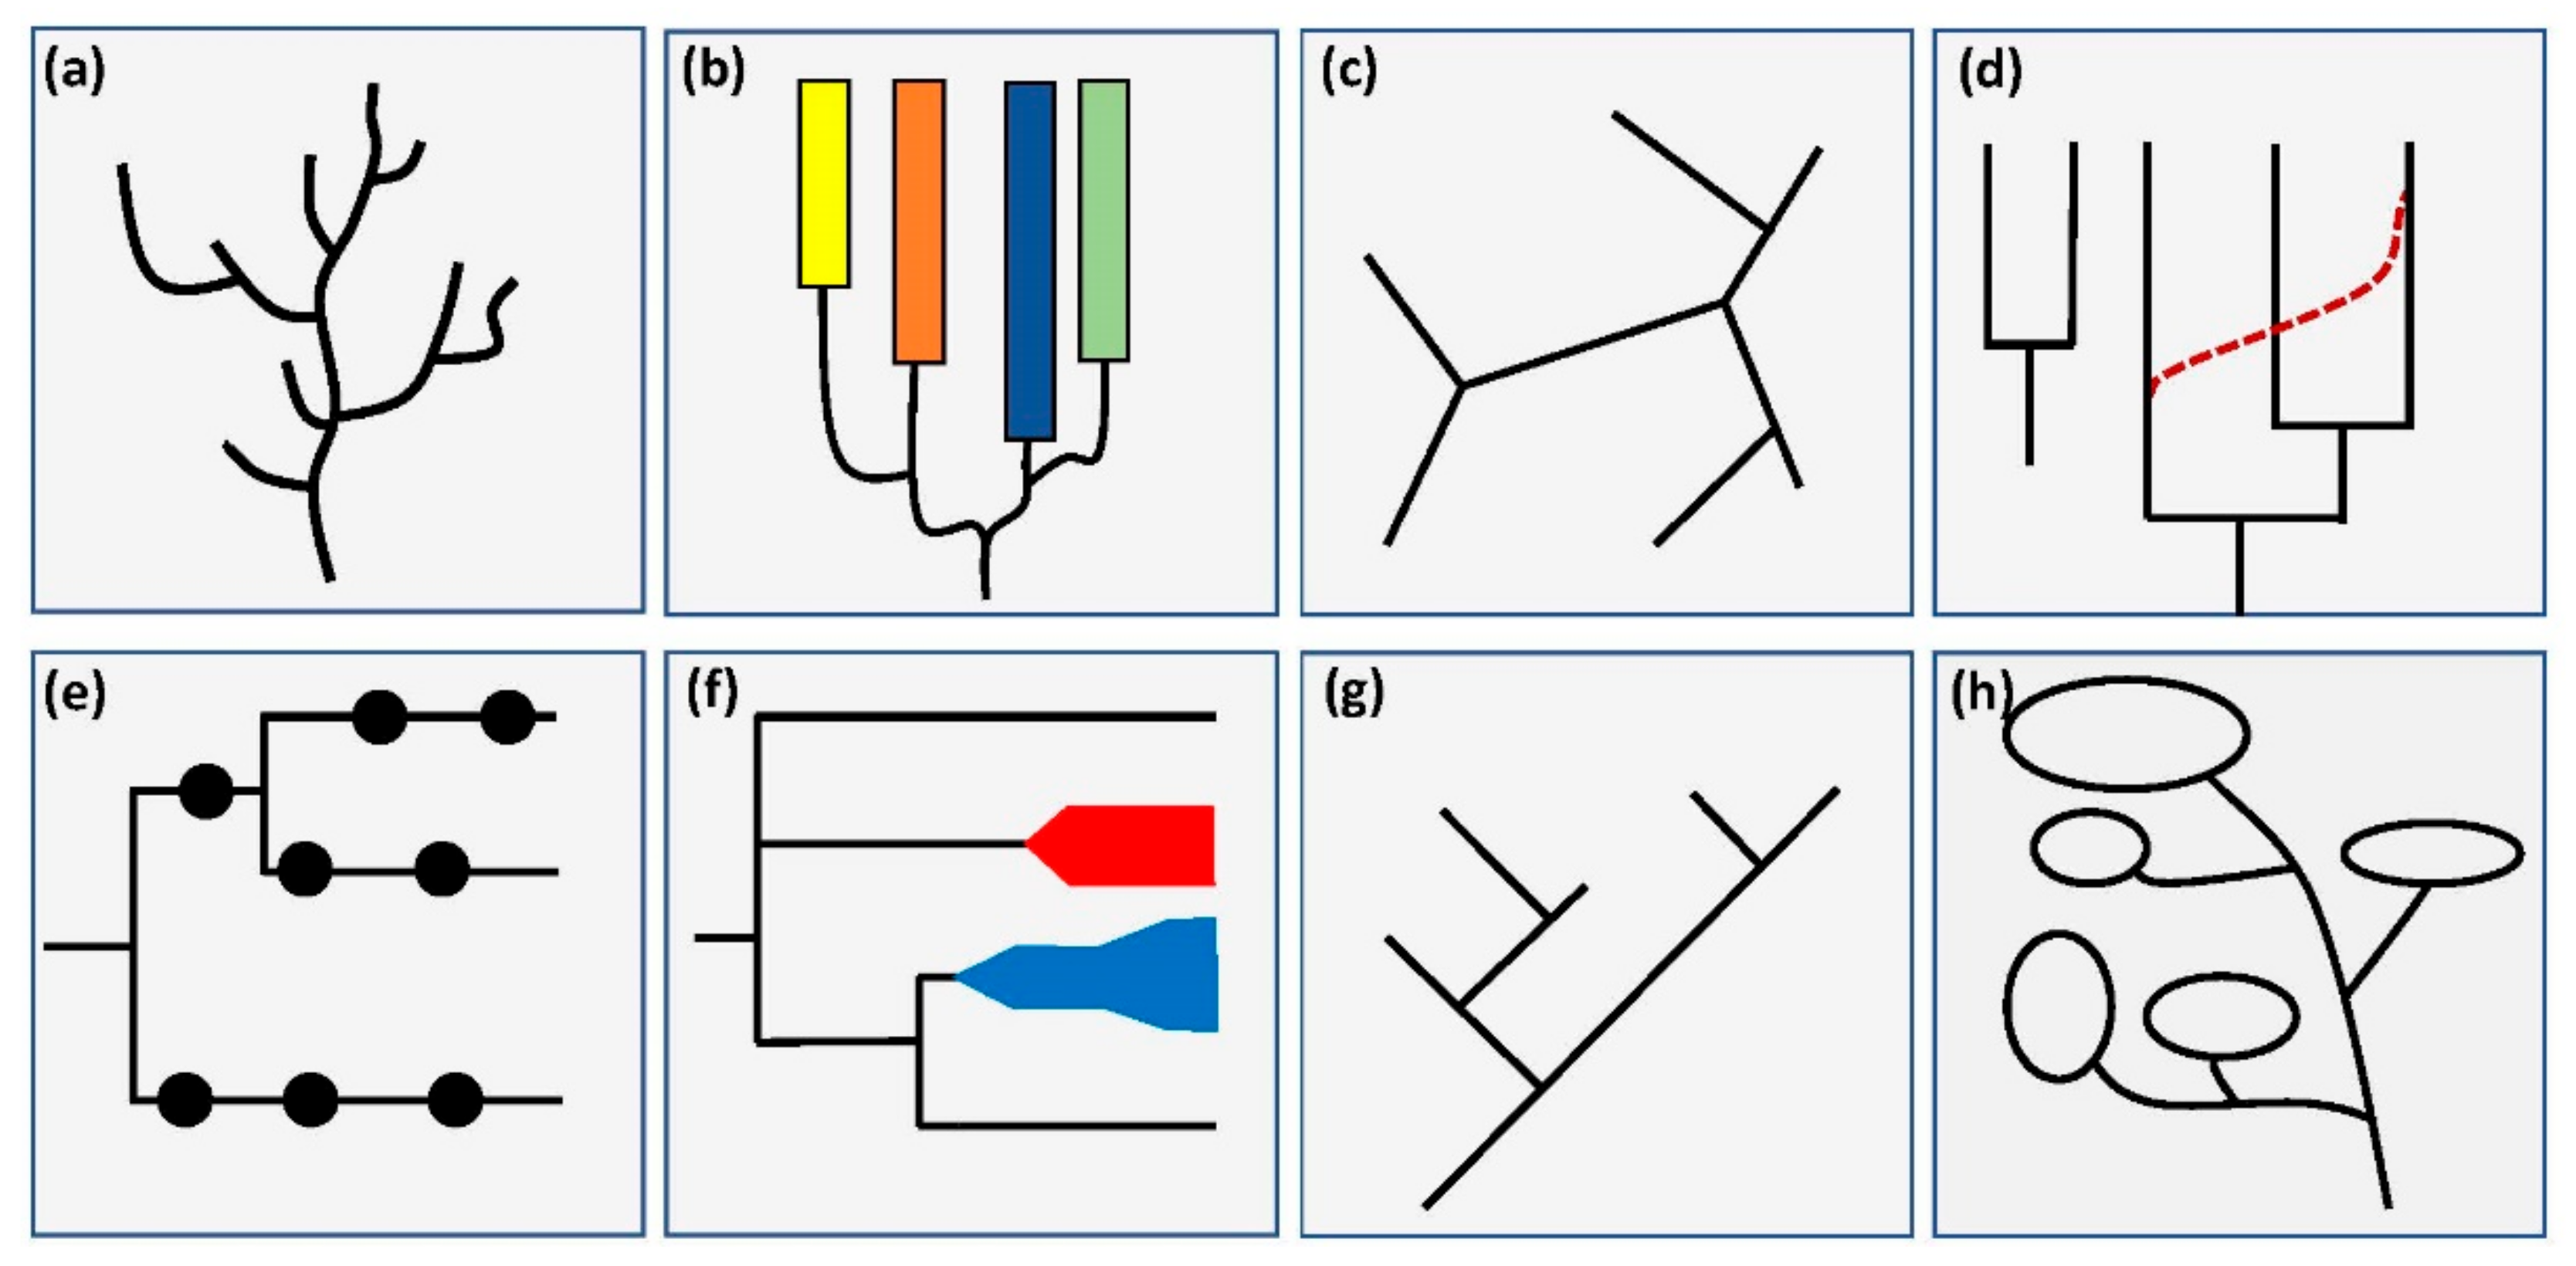
  • Non-dichotomous diagram—a node branches into at least three edges, at least at one node in the diagram. This characteristic can indicate a simplified version of a more sophisticated tree or unclear relationships between the species [3].
  • Terminal nodes at different levels—terminal nodes are not presented along a line (or at the same radius in a circular diagram). This trait can either represent species that went extinct or can be an indication for the use of some form of metric, be it time, mutation rate, or some other scale. As there are multiple potential concepts which can be indicated by this trait, it can be ambiguous to interpret, especially to novice learners [3,41].
  • Lateral gene transfer—in at least one point in the diagram, lines connect again after branching, or a lateral transfer of genes is presented in another way. Displays of lateral gene transfer violate the graph theoretical basis of tree diagrams but can visualize important events in the history of life. In many cases, lines indicating lateral gene transfers have a different meaning than other lines in a tree, which represent direct descent. Learners can potentially misinterpret lateral gene transfer as direct descent.
  • Unrooted tree—the tree diagram is presented without a root. Unrooted trees do not show the way in which evolutionary processes develop. Therefore, branches and nodes do not represent clades but rather sets of lineages. However, the actual direction of development remains unclear [3]. This category was not included in Catley and Novick’s 2008 study, but we included it to explore potential different compositions of properties from what other tree types offer.
  • Branches vary in thickness—at least some branches in the tree are not represented by lines but show differing thicknesses. In many cases, these diagrams are insufficiently labeled and can represent the population size, number of species, geographical distribution, or other concepts. The use of this diagrammatic trait is regarded as questionable [41].
  • Bar chart—the developmental lines of at least some taxa in a diagram are represented by a bar or rectangular box instead of a line. Bars displayed instead of lines can be interpreted as single, static entities instead of lineages undergoing continuous change. Thereby, learners’ misconceptions, such as the idea that evolutionary changes only happen at internal nodes [47], can be reinforced by interchanging lines with bars or boxes.
  • Anagenesis—the graph shows different taxa along a linear developmental line, implying that one species turns into another. Diagrams following this idea can foster anagenetic evolutionary concepts. A diagram displaying this trait could be interpreted in a way that the bars represent unchanging entities instead of the lineage of one species.
  • Unlinked groups—not all groups presented in the diagram are linked by the edges. This category was added to the system, as we found unlinked groups in early samples and wanted to investigate how widespread this property was.
  • Direction of the tree—this category describes the direction in which a tree is presented and was coded by investigating where the root is located and the direction in which the tree develops. Five subcategories were used: root location left/right/top/bottom and no major direction (e.g., in circular or unrooted trees). As some research indicates that the orientation of a tree can influence reading difficulty [48], this category was added to the coding manual.

2.6. Extent of Labeling

The third main category investigated the extent and type of labeling in each diagram. The following three categories were distinguished:
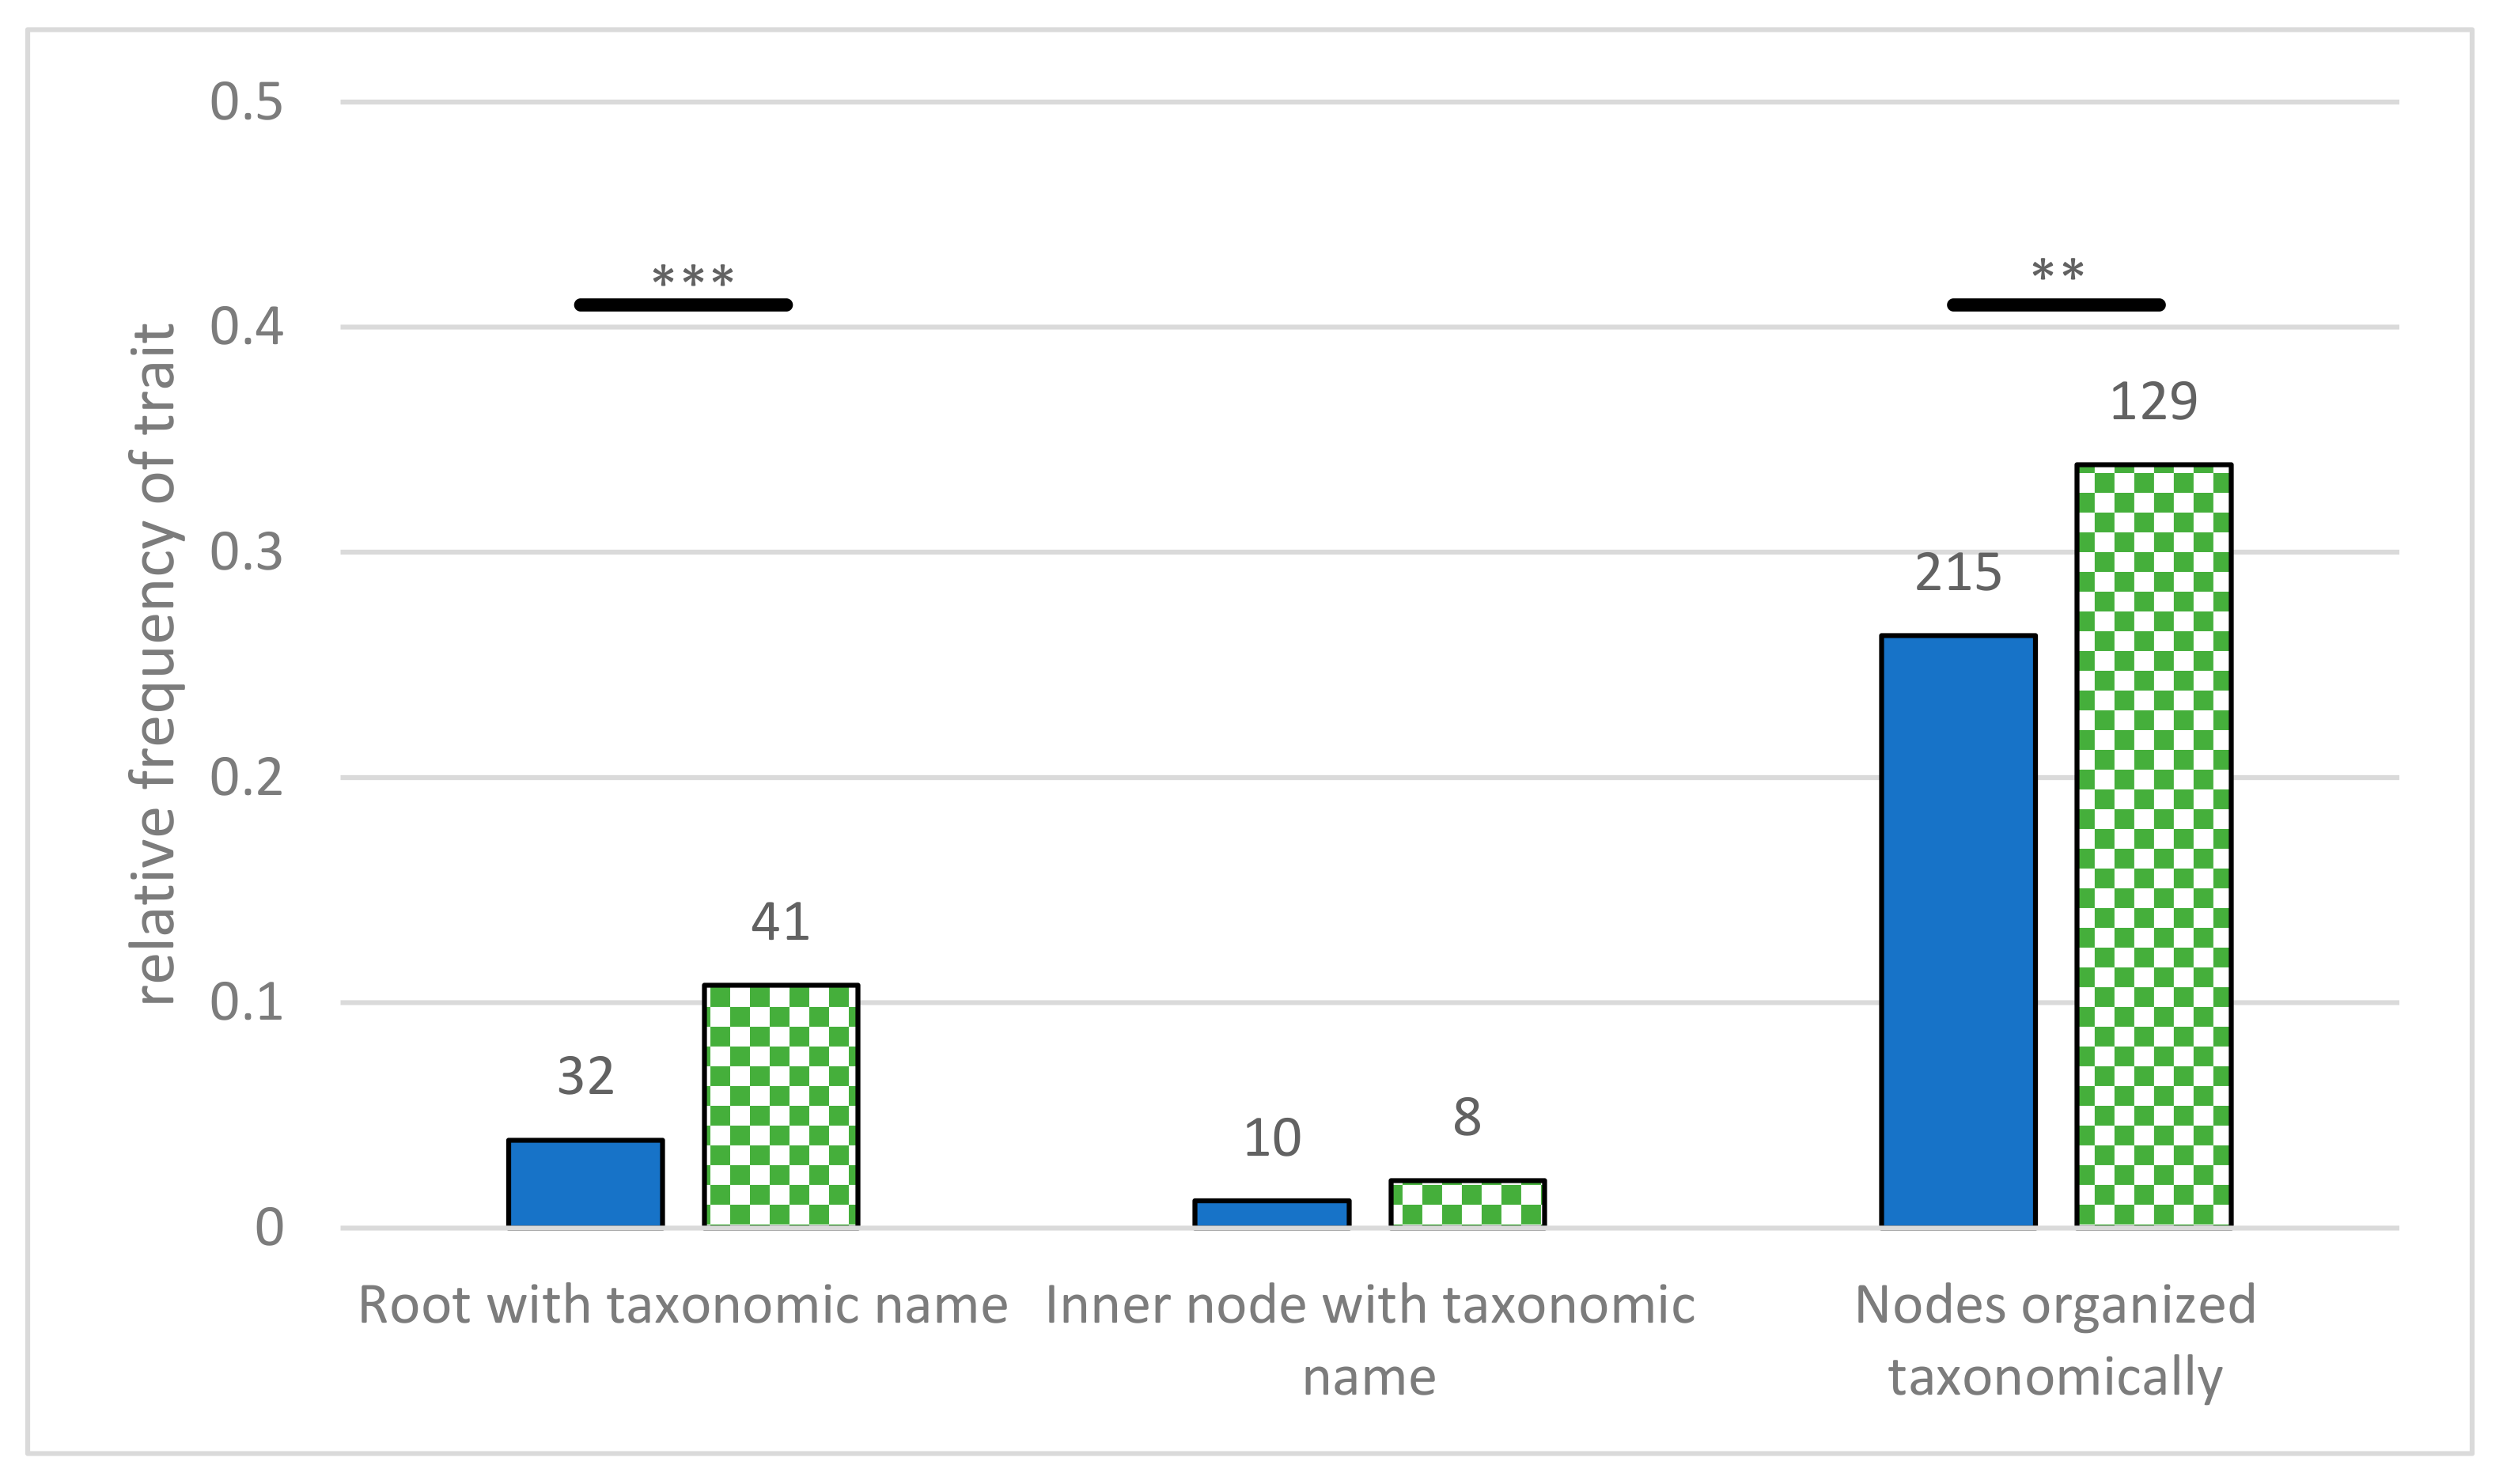
  • Root labeled with taxonomic name—the root is labeled with the name of a taxonomic group. This can taxonomically group all presented organisms, but by using the name of a species, it can imply anagenetic ideas.
  • Inner nodes labeled with taxa—non-terminal nodes were labeled with taxonomic names. These diagrams can easily be interpreted as one species turning into another, thus fostering anagenetic interpretations [41].
  • Taxonomic grouping of nodes—different groups were represented as belonging to a taxonomic group. This can be achieved by coloring the branches, adding bars or brackets along the terminal nodes, or by labeling the inner nodes with taxonomic group names. As this is a common feature in evolutionary diagrams, and it could support reading and identification processes, we wanted to investigate its prevalence.
  • Terminal nodes labeled—terminal nodes were labeled using text or graphics. We determined whether all or only some nodes were labeled. In early samples, we found trees in which nodes were only partially labeled, especially with regards to graphical labels. As the extent of labeling may influence reading difficulty, it was included in the coding manual.

2.7. Further Information

The fourth category concerned the extent to which additional information was presented in the diagram.
  • Part of figure—the evolutionary tree is part of a larger figure: for example, in combination with pictures, graphs, and/or other diagrams of evolutionary relationships. The graphical representation labeling parts of the tree are ignored. Some authors argue that adding additional information, like other diagrams connected to the species and concepts represented in a tree, can support reading processes [49,50]. Therefore, this category was included in the present investigation. In the following, this category will also be referenced under the term MER (multiple external representation).
  • Apomorphies—new evolutionary traits were labeled along the branches. This can be done in many forms; the most common are written or graphical labels along the branches. The inclusion of apomorphies in trees is known to facilitate reading processes [46]. Therefore, we investigated the prevalence of apomorphies in the evolutionary trees.
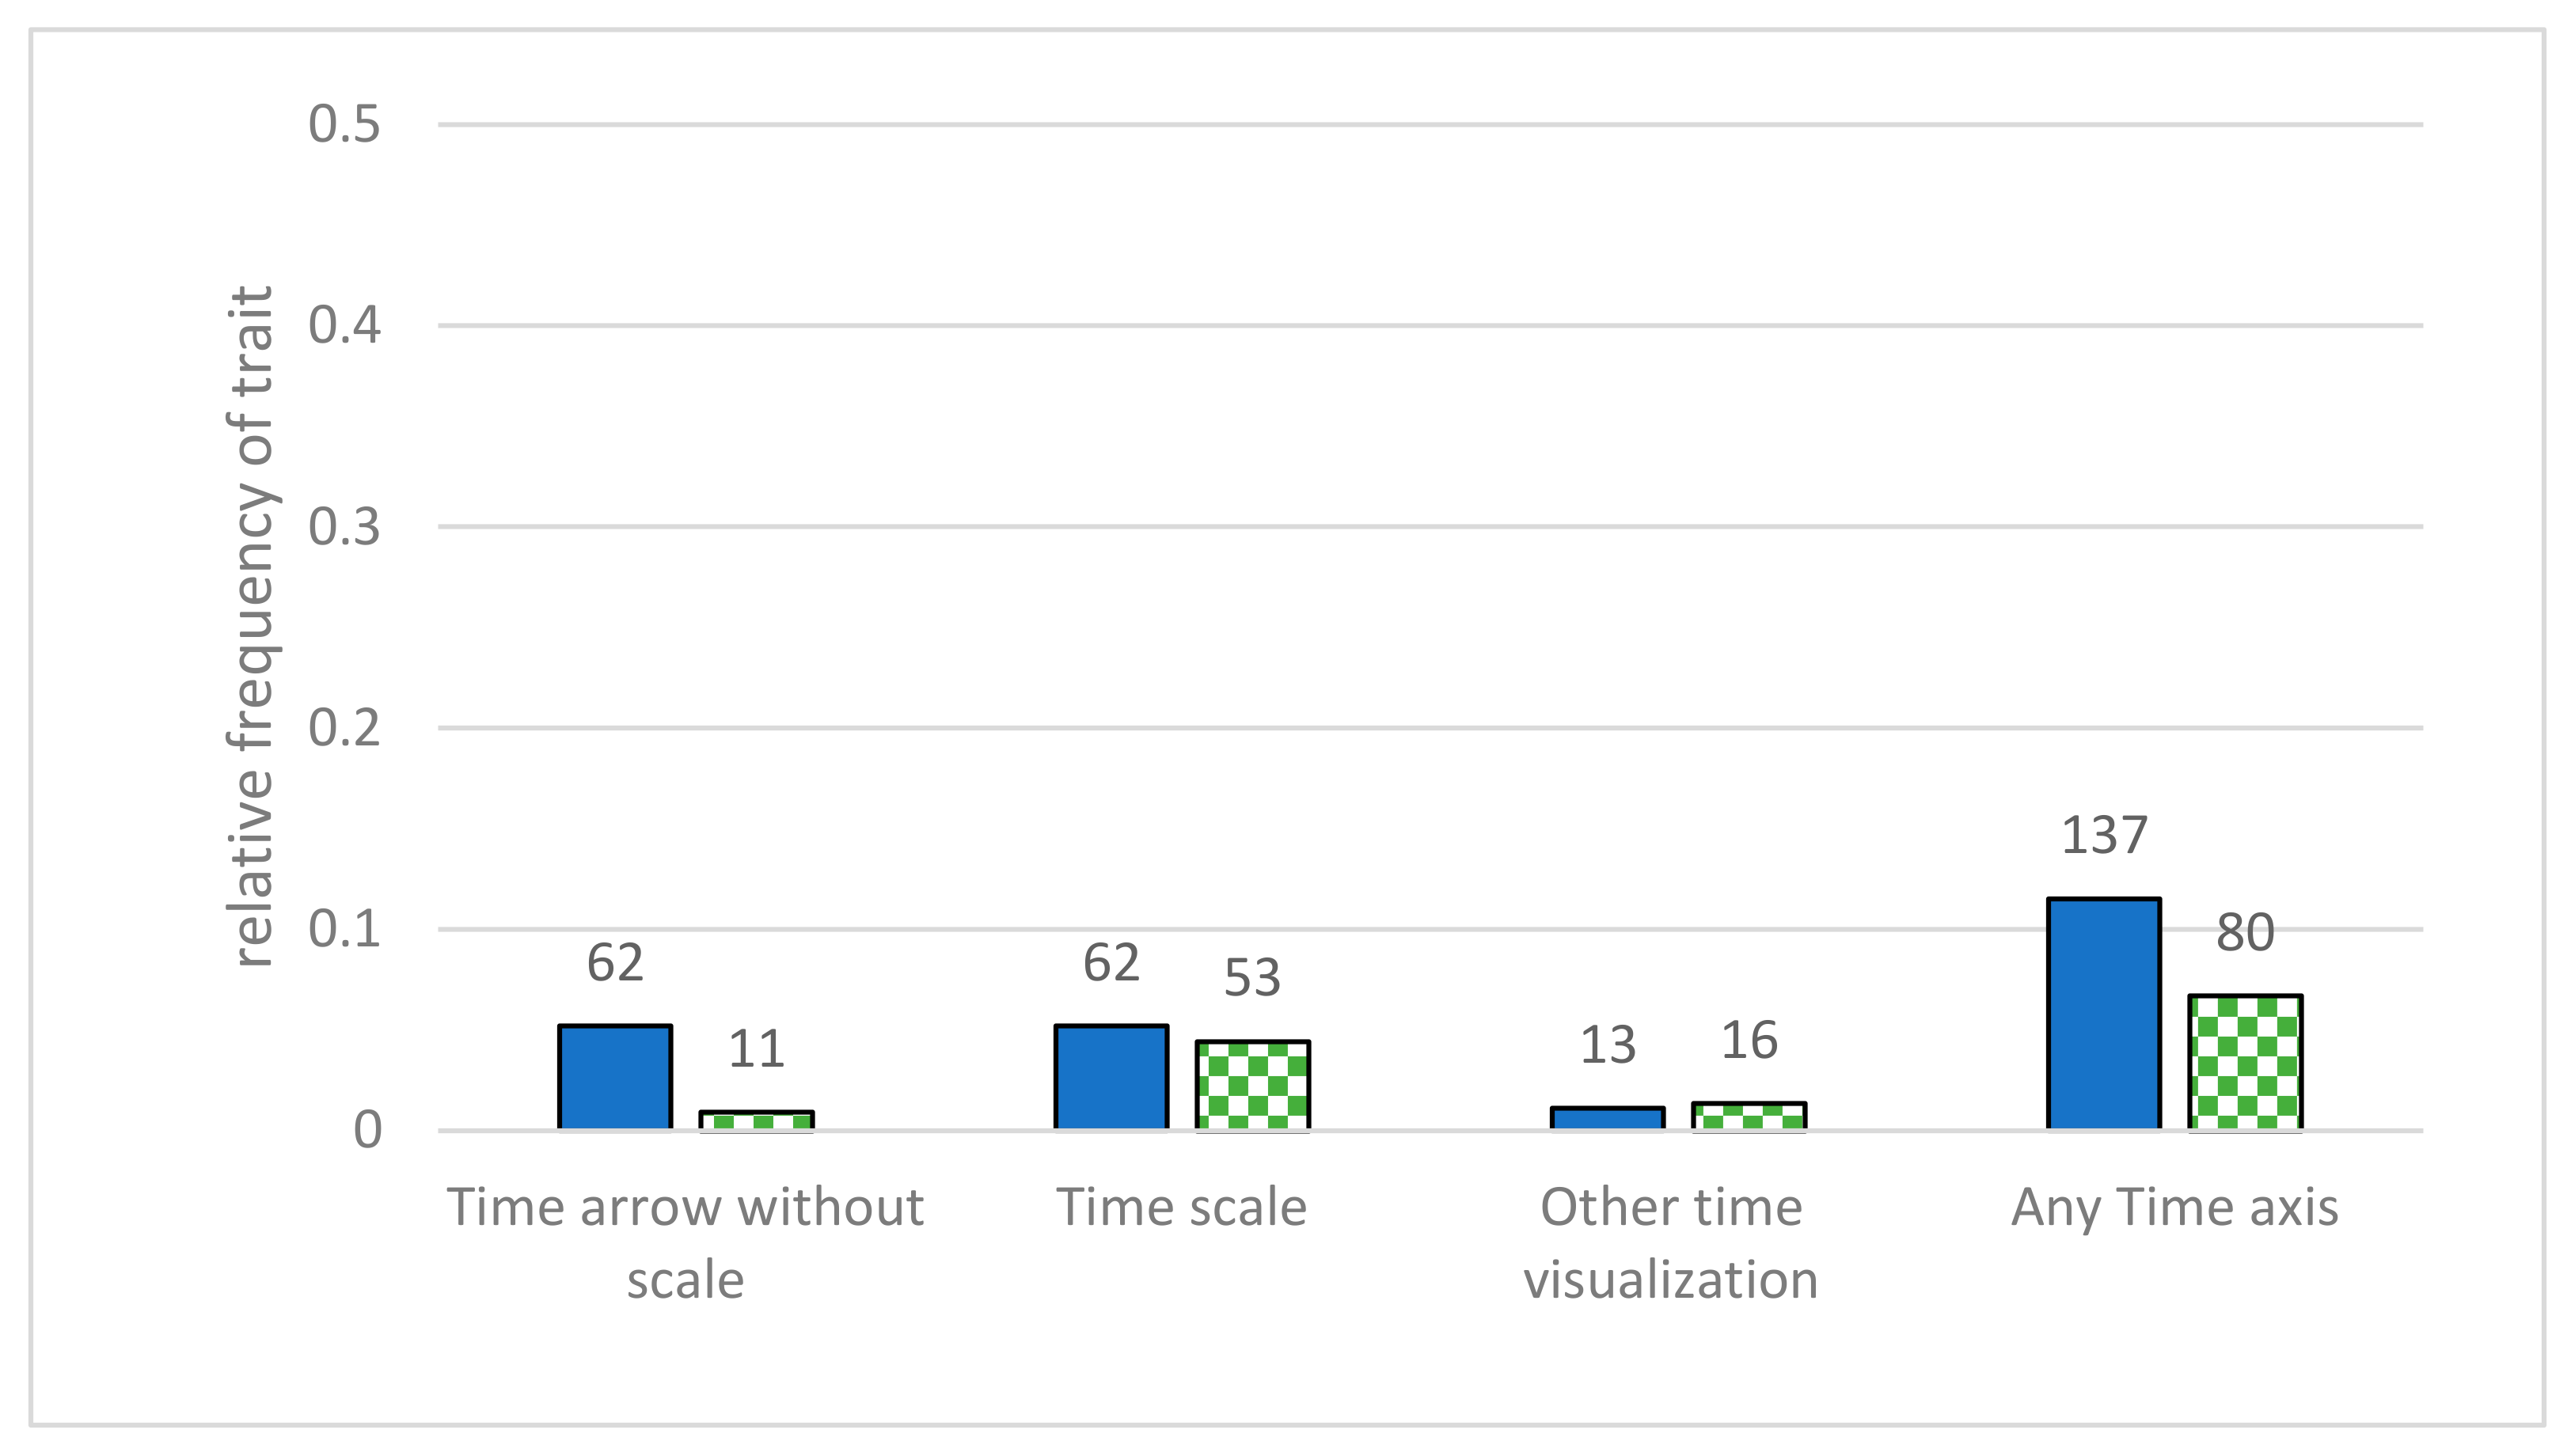
  • Time scale—time and direction were represented in some way in the diagram. We distinguished between a time axis without scaling, a time or generation axis with a timescale, and other time representations (axis of mutation rate, singular points of time, or similar). This category was added to the coding manual, as students often misinterpret the direction of the flow of time [11,19], and adding an indication of the direction of time can reduce this risk [51,52]. In the study of Novick and Catley, they only investigated whether any indication of time is displayed in any given diagram [41]; in this study, this was extended by further investigating in which way time is displayed.

2.8. Presented Organisms

In the last category we investigated the presented organisms.
  • Number of terminal nodes—the number of terminal nodes indicates the size of the presented tree. This was coded in steps of five nodes per level, with the highest level being more than 25 nodes. Because tree size may influence the difficulty of obtaining information, this category was included. Additionally, this could be beneficial in the design of educational materials and research instruments by informing educators of what tree sizes students have the most exposure to.
  • Represented organisms—this indicates which groups of organisms are represented in the diagram. Because item-feature effects in the context of evolution are well known [53], we wanted to investigate which species are present in evolutionary trees. If at least one species from one of the predetermined groups was represented, this group was categorized, leading in many cases to multiple entries per tree. The groups investigated were animals (only when a node labeled animals is presented in the tree), non-mammalian animals, non-human mammals, (early) humans, plants, fungi, protozoa, genes, viruses, abstract/no context/no labeling, and non-biological context. In the previous study, special focus was put on diagrams only displaying hominid evolution [41]; in this study, investigating displayed organisms was done in more detail.
  • Focal taxon—a certain group in the tree is placed in a special, emphasized position, leading to a focal taxon. This category was included in the investigation because focal taxa can support common misconceptions [1,52], and their prevalence in educational literature has not been investigated before. For example, humans are often presented in the far right, top, or bottom of a tree, giving novice learners the idea that they are “more developed” than other species. We coded this category separately for humans, mammals, and animals.
To compare the samples in this study, two statistical procedures were used: the chi-squared test (χ2) and Fisher’s exact test (FET). Chi-squared analyses were used in most cases, while FETs were used in analyses including cells containing values less than 5 [54].
Coding methods were trained using a separate sample of 200 diagrams not included in the study. After coding the study diagrams, a randomly selected subsample of 250 diagrams (20.88% of the whole sample), 125 German and 125 US diagrams, were coded separately by a second person, and κ-values are presented in the results section.

3. Results

A total of 1197 diagrams were coded using the software MAXQDA [55], and 250 randomly selected diagrams (125 US and 125 German) were coded by a second coder following the same manual. The inter-coder reliability was calculated for each coding category. Most categories achieved substantial (κ > 0.6) to almost perfect agreement (κ > 0.8) [56]. Three categories (unlinked groups in the category branch structure, inner nodes labeled with taxonomic names in the labeling category, and other organisms in the category presented organisms) showed only moderate agreement (0.6 > κ > 0.4), with the lowest value being κ = 0.5. As these categories were not the focus of the evaluation and diagrams with these traits showed up rarely in the main sample, we decided to present the findings regarding these categories, despite their low Kappa values. Kappa values are presented in Appendix B.

3.1. Tree Style or Topology

In the first main category, we investigated the tree topology of all diagrams (Figure 3). Rectangular trees made up the largest portion of the diagrams by far (US: 87.1%, Ger: 75%), followed by a wide gap between diagonal (US: 6%, Ger: 9.7%) and other tree diagrams (US: 5.9%, Ger: 11.3%) (Figure 3). Circular trees, Tree-of-Life representations, and other diagrams constituted only a small fraction of the investigated diagrams. Comparing the two samples, we can see that the relative distribution followed the same pattern. Statistical analysis following FET revealed a significant difference in the prevalence of different tree styles by country (p < 0.001, FET = 30.481), with a small effect size (V = 0.163).

3.2. Branch Structure

The most common branch structure features were non-dichotomous formats and diagrams where the terminal nodes were shown at different levels (Figure 4). German textbooks contained almost twice as many non-dichotomous diagrams as American textbooks. The χ2 test showed no significant differences in the percentage of trees with a non-dichotomous style according to the language of the textbook (χ2 [1, n = 1197] = 3.204, p = 0.073, φ = 0.052).
A bigger difference was displayed in the category “terminal nodes on different levels” (Figure 4), with 12.9% of the US trees and 24.2% of the German trees showing this feature. The χ2 test showed a significant difference in the share of trees with this characteristic, and the country exhibited a small effect size (χ2 [1, n = 1197] =24.338, p < 0.001, φ = 0.143). The third notable difference between the countries was in the category “edges vary in thickness”, with 1.6% of the US trees and 10.3% of the German trees showing this trait. This difference was also found to be significant with a small effect size (χ2 [1, n = 1197] = 46.938, p < 0.001, φ = 0.198).
Investigating tree orientation, whether the time axis is oriented from left to right (root left), from the bottom to the top (root below), or in another direction, revealed that two orientations are predominant in both samples: the root on the left, and the root at the bottom (Figure 5). Even though both countries showed a strong focus on these two orientations, there was a difference between them. In German books, there is a stronger focus on diagrams with the root at the left (68.7%) than in the US books (54.0%). The share of trees with the root presented at the bottom was higher in the US sample (41.0%) than in the German sample (28.7%). Following FET, we found a significant difference in tree orientation between German and US diagrams (p < 0.001, FET = 23.498) with a small effect size (V = 0.141).

3.3. Extent of Labeling

Taking a closer look at the labeling of the diagrams (Figure 6), we saw that 3.9% of US trees contained roots labeled with a taxonomic name (a specific species name, not a larger group name), and 1.2% exhibited inner nodes labeled with taxonomic names. In the German sample, 10.8% and 2.1% of diagrams contained these labels, respectively. The difference between the samples was found to be significant for the roots labeled with taxonomic names, with a small effect size (χ2 [1, n = 1197] = 21.393, p < 0.001, φ = 0.134), but the difference was not significant for labeled inner nodes.
Terminal nodes were grouped taxonomically by coloring or labeling the edges, presenting bars or brackets at the end, or by other similar means, in 26.3% of the US and 33.9% of the German trees. These values differed significantly between the samples, with a very small effect size (χ2 [4, n = 1197] = 7.376, p = 0.007, φ = 0.078).
The general distribution of terminal nodes with written and graphical labels was similar for both samples (Table 2). Focusing on written labels alone, we found a significant difference (χ2 [2, n = 1197] = 15.403, p < 0.001, φ = 0.113). We can see that 15.5% of the US trees show no written labels, compared to 7.4% of the German trees. All nodes were labeled in 77.5% of the US trees and in 84.7% of the German trees. Partial labeling was observed in 7% of the US trees and in 7.9% of the German trees.
Regarding graphical labels, we found no significant differences between the samples (χ2 [2, n = 1197] = 4.091, p = 0.129). The largest portion of investigated trees did not show graphical labels (US: 59.6%, Ger: 65.5%), about a third showed all terminal nodes labeled with graphics (US: 29.3%, Ger: 25.8%), and a small portion exhibited only some nodes labeled graphically (US. 11.1%, Ger: 8.7%).

3.4. Additional Information in the Diagrams

The distribution of the representation of apomorphies was very similar in both samples (Figure 7), and no significant difference was observed (χ2 [3, n = 1197] = 5.197, p = 0.158). Even though apomorphies are known to make evolutionary trees easier to read, less than a third of investigated trees included some form of display of evolutionary new traits (US: 30.4%, Ger: 27.9%).
Of the investigated diagrams, 11.5% of US trees and 6.7% of German trees showed some form of visualization of the flow of time (Figure 8). This includes time arrows with or without a scale, singular time points within the diagram, and axes or bars of mutational rates. In the US sample, time arrows without a scale and axes with a scale were equally prevalent, accounting for 5.2% of all trees. In the German sample, time scales were more prevalent (4.4% of all trees), in comparison to arrows without a scale (0.9% of all trees). Other types of time axis were rare in both samples (US: 1.1%, Ger: 1.3%). We found a small significant difference between the samples regarding the displays of the direction of time flow (χ2 [4, n = 1197] = 28.271, p < 0.001, φ = 0.154).

3.5. Presented Organisms

All diagrams were investigated in terms of the number of terminal nodes. To allow for an easier comparison, the numbers were coded in groups of five (0 to 5 nodes, 6 to 10, etc., up to more than 25 nodes). Both samples showed a similar share of trees with five or fewer nodes. The US sample showed a higher share of trees with 6 to 10 nodes (US: 38.1%, Ger: 30.3%), whereas the German sample showed a higher percentage of trees with 11 to 15 (US: 7.8%, Ger: 13.4%) and more than 25 terminal nodes (US: 6.9%, Ger: 11.3%). Although the general distribution seemed comparable in both samples (Figure 9), we observed a significant difference in the distribution between the US and German samples (χ2 [5, n = 1197] = 20.844, p = 0.001, φ = 0.132). Nevertheless, it could be generalized that both US and German students are mostly confronted with smaller trees, containing up to 10 terminal nodes (US: 73.8%, Ger: 66.4%).
Focusing on the organisms presented in the investigated diagrams, we found a similar pattern across both samples (Figure 10). In general, the trees seemed to focus strongly on animals, rather than plants, fungi, or other groups. It should be noted that multiple types of organisms can be present in a single tree. Especially in the case of animals, there are often nodes from different groups present in a single tree; for example, a tree containing a human, a chimp, and a fish would fall into three categories: non-mammals, non-human mammals, and (early) humans, so it is difficult to compare the numbers of these groups with other groups such as plants or fungi.
At least 40% of all trees in both samples showed any type of animal. About 10% of trees in both samples showed humans or their ancestors. Approximately 17% of the trees showed plants, 8 to 10% included fungi, 3 to 5% represented the evolution of genes, roughly 13% described single-celled organisms, and approximately 1% included viruses. Within all these groups, we did not find a significant difference between the samples, except for the category of abstract or context-less trees. Here, we found a very small significant difference between the samples (US: 20.6%, Ger: 13.9%) (χ2 [1, n = 1197] = 7.541, p = 0.006 φ = 0.08).
We observed that more than 10% of diagrams in both samples showed humans, or large groups encompassing humans (animals and mammals), at the outer or highest point of a tree (Figure 11). We also noticed that the group of vertebrates is in some cases presented in a focal position, but this was not investigated in the study. Terminal nodes labeled as ‘animals’ were very rarely placed in a focal position (US: 2.3%, Ger: 0.8%), while mammals (US: 5%, Ger: 7.4%) and humans (US: 4.4%, Ger: 4.7%) were more commonly present as focal points. Considering that humans were only present in about 10% of the trees, this means that in half of the cases where humans were depicted, they were placed in a focal position.

4. Discussion

In this study, we analyzed diagrams of evolutionary relatedness in 11 US and 11 German university-level textbooks. In total, 1197 diagrams regarding 24 sub-categories were investigated, organized into six main categorical groups. In addition to the cross-country comparison of the investigated diagrams, we took results from a previous study on evolutionary trees from 2008 and compared them to our current findings.

4.1. Tree Structure/Topology

In many, if not most cases, we found comparable results between the German and US samples. In both samples, we found a strong focus on rectangular trees, even though German books showed a higher proportion of diagonal and other tree types. The prevalence of rectangular trees is beneficial from an educational perspective, as they are easier to read than other tree styles. Comparing these findings with the data from Catley and Novick [41], we see a very different picture. They further distinguished diagrams into cladograms and almost cladograms, which we did not perform in this study; therefore, we had to reconstruct some values from their percentages. Of all diagrams investigated by them, 45% were diagonal and 39% rectangular. Tree-of-Life representations were more common in their sample with 34 diagrams, accounting for 4.9% of the diagrams (0.4% in our US sample and 1.8% in our German sample). As previously mentioned, diagonal trees can be harder to understand, but fortunately, we found that the US sample showed fewer diagonal trees than Catley and Novick [41] found in their study. This indicates that US textbooks have changed in this regard, potentially in response to the 2008 study. Additionally, US textbooks appear to be a step ahead of German ones in this regard, especially considering that they show fewer diagrams categorized as “other trees.” These diagrams do not follow general conventions on how evolution is presented in trees and have the potential to irritate (novice) learners, leading to problematic or erroneous interpretations of the trees [41].

4.2. Branch Structure

In both our samples, we found a similar pattern of properties in the “branch structure” category. Fortunately, most tree traits that can hinder the learning process are very rare. For example, bar-charts and unlinked or anagenetic diagrams only appeared in approximately five percent of the samples. Other traits were observed that may influence the difficulty of reading evolutionary trees, but overall contribute positively to understanding. Non-dichotomous diagrams, for example, are important in cases where the relationship between groups is unknown or disputed, such as in unrooted trees [3]. Catley and Novick [41] reported approximately 8% of the investigated trees as non-dichotomous (compared to 19.0% in the US sample and 14.7% in the German sample). Note here that they did not code all investigated trees for this trait, but only the ones classified as “almost a tree” or “almost a ladder,” which comprised approximately 13% of their total sample.
Lateral gene transfer models could further explain the history of different groups; moreover, varying the width of edges could give an impression of the biodiversity of different groups. Having nodes at different levels is also not a necessarily bad design, as it can indicate that different groups went extinct over time, showing that extinction events are a natural phenomenon often overlooked in biology. Interestingly, of the 105 US diagrams showing nodes on different levels, only 34 showed any display of time in the diagram (Germany: 92 diagrams, with 32 showing any display of time), even though time scales are often beneficial to interpret why nodes end on different levels. Learners can interpret trees with nodes on different levels to falsely believe that some groups are “less evolved,” as they evolved earlier or their development ended [41]. Here, it is important to indicate that lines ending earlier represent extinct groups [3]. Comparing our results with previous findings, we see a much lower number of trees showing this trait than Catley and Novick did in their 2008 study (52% of the rectangular trees and 55% of diagonal trees showed this trait).
While about 10% of the German trees contained edges varying in their thickness, this trait was rare in US textbooks (less than 2% of all investigated diagrams). This trait can convey additional information in the diagram: for example, the biodiversity of the node or geographical distribution of the taxa. If this characteristic is not explained in the diagram, it can be ambiguous and at worst lead to misinterpretations of the relative relationship presented in the diagram. Here again, we compare our findings with those of Catley and Novick’s study, which found that 15% of all diagrams showed edges varying in thickness. We see a significant difference between their US sample and ours. Even though the German sample shows a closer value, there is still a difference of approximately 5% from Catley and Novick’s sample [41].
Although we found a small significant difference between the samples regarding trees with left-adjusted and bottom-oriented roots, the distribution of the direction of the trees was comparable in both samples. Most trees were oriented from left to right, and the second most common orientation was from the bottom up. Phillips et al. [48] argued that the orientation of a tree can influence how it is interpreted, especially regarding anthropocentric interpretations. They found that trees oriented from left to right trigger less interpretations based on misconceptions versus trees oriented from the bottom upwards. Therefore, the strong prevalence of trees from left to right is encouraging.

4.3. Extent of Labeling

Both samples in the study samples showed several trees where nonterminal nodes are labeled with taxonomic names. If these names are not the general names of the groups to which all following nodes are counted (in that case, the tree was put in the category “nodes organized taxonomically”), labeling internal nodes can easily lead students to interpret the tree in an anagenetic way by assuming that the terminal taxon evolved “out of” the preceding taxon [41]. In the German sample, approximately 10% of trees contained a root labeled with a taxonomic name (this does not include labels such as “ancestral species” or “early mammals”), while US books presented fewer trees with this characteristic (3.9%). Comparing our numbers (non-terminal nodes labeled: US: 5.1%, Ger: 12.9%) with the results of Catley and Novick [41] (5.2% of the trees show labeled non-terminal nodes), we can see that the US books did not change over the last decade in this regard.
Regarding labeling on terminal nodes, we see that most investigated trees have all terminal nodes labeled (US: 76.8%, Ger: 84.7%), while more than half of all trees have no graphical labels at all. There is currently no research on how adding graphical labels to a tree affects the difficulty or the incidence of misconceptions, although some authors argue that adding additional information to a tree can help students better understand what they are presented with and how to situate presented species [49,50].

4.4. Further Information

Novick et al. [46] showed that adding apomorphies to a given tree increases students’ understanding by making it easier to investigate the underlying branching structure. They argued that apomorphies could break the Gestalt principle of good continuation, thus leading to an easier perception of different parts of the evolutionary tree. Furthermore, apomorphies can be used to explain the developmental history of a tree and act as evidence for branching patterns. Nevertheless, learners may see given apomorphies as the only developmental difference between the presented species and therefore think that they are the only rationale for the presented tree hypothesis. Following this line of thought, it is good that about 30% of the trees in both samples of our study (US. 30.4%; Ger: 27.9%) showed apomorphies.
Trees showing apomorphies along the branches can only show a small selection of evolutionary changes, leaving out many other characteristics. Additionally, most modern trees are not created based on morphological comparisons but on genetic analyses. Therefore, apomorphies can help students understand evolutionary trees, but may also support problematic interpretations of evolutionary trees. Further research could shed light on this topic.
In particular, novice learners frequently misinterpret the direction of the flow of time in an evolutionary tree [11,13,19]. Adding a visualization of the flow of time can ease students’ reading processes and possibly reduce typical misconceptions and bad habits, like reading across the tips [51,57]. Unfortunately, only 11.5% of the US sample (Ger: 6.7%) showed any visualization of the direction of time. This number is very close to the 11.6% reported by Catley and Novick [41], indicating that the US textbooks have not changed in the recent past regarding this characteristic. The presence of a visualization of time is especially important in the case of diagrams where not all terminal nodes are at the same level. Students might misinterpret earlier ending points as the “end of development” or as a sign for a “less developed” group. Marking extinct groups explicitly and giving an indication of time might reduce this risk and allow students to better interpret these trees. Unfortunately, of all 140 trees in the US sample showing nodes at different levels, only 34 (24.2%) also provided information about time. In the German sample, this proportion was larger, with 49 out of 81 trees (60.5%).

4.5. Presented Organisms

Even though some significant differences were shown, it seems safe to say that German and US students are provided with similar presentations of evolutionary trees. Regarding the number of presented organisms, we found only minor differences between the samples. The same was true for the taxonomic groups present in the trees. In general, German and US textbooks use the same proportions of groups to contextualize their trees, with a major focus on the animal kingdom (US: 55.2%, Ger: 60.0% of all investigated trees contained any animal), followed by plants (US: 16.0%, Ger: 18.9%), and abstract trees (US: 20.6%, Ger: 13.9%).
As humans tend to be anthropocentric [58], we tend to put a special focus on humans or groups containing humans (e.g., animals or mammals) [59]. We investigated the extent to which this special focus on these taxa was supported by their positions within trees. In approximately 10% of trees, animals, mammals, or humans (depending on which of these groups was present in a tree) were presented in a prominent position, in most cases at the outermost or highest position in the tree. This number must be considered in future studies. As 55–60% of all trees showed any animal, the number of trees that can place the mentioned groups in a special position in the first place does not constitute the whole sample. This is especially clear in the case of humans. As previously mentioned, half of all trees containing humans in this study put them in a focal position, despite there being no taxonomical basis for this positioning [60]. To decrease anthropocentric interpretations of evolutionary trees, it would be very helpful to present students with more trees where humans (or apes, mammals, vertebrates, animals, etc.) are presented in a non-prominent position.
In summary, we show that German and US textbooks present evolutionary trees in a very similar fashion. Some statistical differences were found between the samples, typically with a (very) small effect size, leading to the conclusion that the representation of evolutionary trees is very comparable between the countries. Taking the study of Catley and Novick [19] into account, we show that there has been a change in the way evolutionary trees are presented in US textbooks. In general, diagonal trees were not found to be used as much in recent texts as was found in Catley and Novick’s 2008 study. Considering some potentially problematic tree characteristics (edges varying in thickness, nodes on different levels, and adding a timeline), we can see that a much lower number of trees show these traits than Catley and Novick found in 2008. In some other cases, the numbers remained at a comparable level (non-dichotomous trees and anagenetic diagrams). Therefore, we conclude, based on our sample and the data we could extract from Catley and Novick’s paper, that the representation of evolutionary trees in US textbooks has improved since 2008. Nevertheless, there is still room to improve tree diagrams in German and US literature.

4.6. Applications and Limitations

We presented the prevalence of a variety of characteristics of evolutionary trees in university-level textbooks. In the following we will discuss how these findings can or should influence practical education.
As the prevalence of rectangular trees dramatically increased in comparison to the study from 2008, the importance of diagonal trees in educational literature decreased strongly. Educators do not need to spend much time on teaching different tree styles or how to transform one style into another. As diagonal trees are seen to be more difficult to read and are linked to more learners’ misconceptions, it is desirable that their presence in educational literature further decreases in the future [13,19,61]. Nevertheless, educators should at least inform their students that trees can also be presented in other styles. Even though diagonal and other trees are less present in educational literature, they might still be frequently used in museums or other places of informal education [33].
Considering properties of the branch structure, educators should include both non-dichotomous diagrams and diagrams with nodes on different levels into their lessons. Both properties can be misinterpreted, especially by novice learners, even though including them into diagrams can have theoretical and practical reasons. By explaining the rationale for the use of these traits, students’ risk of misinterpreting might be reduced. A special focus should be put on diagrams where terminal nodes are not on the same level with regards to a potential time axis. Adding a time axis gives the earlier ending lineages meaning; without it, readers potentially need to guess or deduce from the context why lineages are ending earlier. Therefore, students need to know what kind of metrics can be used in a tree, in which ways they differ, and how a reader can identify which metric is used, especially when no labeled time axis is used.
Educators in Germany should also consider including evolutionary trees in their lessons which show edges with a varying thickness, as about every tenth investigated diagram of this sub-sample showed this trait. Modifying the width of edges can represent different contexts and readers need to pay attention to what the thickness of the branches represents in the specific diagram at hand to interpret it correctly.
As up to 30% of the diagrams in each sample display apomorphies in some way, it seems reasonable to include this characteristic into teaching practices. Furthermore, different approaches of modeling the concept of tree-reading include the ability of correctly interpreting apomorphies displayed in evolutionary trees [31,47,61,62]. There is no insight into whether students show difficulties or special learners’ misconceptions while interpreting apomorphies in a given tree, but there is evidence that the display of apomorphies reduces the difficulty of reading and correctly interpreting a tree [46]. If this effect can be corroborated by further studies, it could be advisable to present trees displaying apomorphies to learners, especially to novice learners.
One of the most important insights from this work is that humans are still very often displayed in a prominent position in evolutionary trees, either at the top or one of the outermost positions. Different authors argue that this positioning can reinforce learners’ misconceptions [1,4,48,59]. As about half of all diagrams including humans presented them in a prominent position, educators need to bring up this topic to reduce the risk of fostering learners’ misconceptions linked to the idea of different species being distinguishable by their complexity. By visualizing the option to rotate internal nodes in a tree without altering the relationships displayed, students can learn that more prominent positions in a tree-diagram bear no deeper meaning. This visualization can be done by comparing different trees, by card-laying tasks [63,64], or by creating three-dimensional models [51,65].
Using these insights into widespread tree characteristics that can potentially render them more difficult to read, educators can better prepare their students for being confronted with such diagrams. By being aware of the shortcomings of these traits and how to correctly interpret them, students might be less prone to fall to common learners’ misconceptions.
As stated earlier, some textbooks included in the German sample are translations of textbooks from other languages: two books have been translated from English, one from French, and one from Czech. In the context of this study, the two translations of US-American books need to be discussed, as one could argue that the inclusion of those books might distort the results. In both books, graphical representations have only been altered slightly. Most figures were adopted without any changes, and in some cases, minor changes to the extent of labeling were made. Therefore, we did not investigate changes based on translations in detail. As only the second research question covers diagrams in German textbooks, the inclusion of translated books needs to be discussed only in this context. The second research question aims at comparing the way evolutionary trees are displayed in German and US-American textbooks to work out differences in educational material that students in these countries are confronted with. Being confronted with trees showing ambiguous traits or ones which are potentially establishing or reinforcing learners’ misconceptions can prove to be a problem, especially for novice learners. As the two books translated from English are amongst the most popular university-level texts about general biology in Germany, it is to be expected that their depictions of evolutionary trees can have a major influence on students. Therefore, results regarding the second research question would in fact be distorted by excluding the translated books.
Another limitation of this work is the exclusive focus on the diagrams themselves. Accompanying information was not investigated, be it in the figure caption, as part of a multiple external representation, or in the text accompanying the figure. Future projects should investigate these aspects of additional information and the implementation of diagrams into the wider context of the textbooks. There are multiple aspects which could be of special interest. For example, it seems worthwhile to investigate how diagrams are referred to in the text, and whether there are instructions or explicit tasks about how to interpret evolutionary trees. Furthermore, it might be interesting to investigate which more significant aspects of evolution are taught using evolutionary trees. Are there diagrams in contexts such as the Last Universal Common Ancestor, punctuated equilibrium, symbiosis, or other more significant, overarching aspects of evolution?

5. Conclusions

The results from this study give insights into how evolutionary trees are presented in contemporary university-level textbooks in Germany and the USA. By investigating the prevalence of different traits, some of which are regarded as enhancing learning processes while others are reported as being ambiguous or linked to learners’ misconceptions, we can highlight several potential difficulties students are facing when working with educational material. By being confronted with evolutionary trees displaying disputed or disadvantageous characteristics, students might establish or reinforce problematic learners’ misconceptions. Educators being aware of these characteristics and implementing them in their teachings can prepare students for not misinterpreting trees displaying them.
Regarding the research questions, it was shown, that contemporary textbooks improved in the depiction of evolutionary trees by displaying less problematic traits than the sample from 2008 [41]. Furthermore, the comparison of contemporary German and US-American university-level textbooks showed only minor differences regarding the characteristics of evolutionary trees students will be confronted with in their textbooks. Therefore, it seems reasonable to assume that learners’ misconceptions and general ideas about the display of evolutionary trees based on the educational literature are comparable between the two countries.

Author Contributions

Conceptualization, T.S. and P.S.; Data curation, T.S. and A.J.; Formal analysis, T.S.; Funding acquisition, P.S.; Investigation, T.S. and A.J.; Methodology, T.S.; Project administration, P.S.; Supervision, P.S.; Visualization, T.S.; Writing—original draft, T.S.; Writing—review & editing, T.S. and P.S. All authors have read and agreed to the published version of the manuscript.

Funding

This project is funded by the German Federal Ministry of Education and Research under Grant Number 01PL16075. Additional funding was provided by the Interdisciplinary Centre for Educational Research (IZfB) of the University Duisburg-Essen for professional language editing services and by the Open Access Publication Fund of the University of Duisburg-Essen by covering the APC. The responsibilities for the content of this publication lie with the authors.

Institutional Review Board Statement

Not applicable.

Informed Consent Statement

Not applicable.

Data Availability Statement

Data are available on reasonable request from the authors.

Conflicts of Interest

The authors declare no conflict of interest.

Appendix A

Table A1. Overview of the books included in the study.
AuthorsNameYearEditionCountryNumber of Diagrams
US Sample
Audesirk; Audesirk; ByersBiology-Life on Earth with Physiology *201711US16
Bergstrom; DugatkinEvolution20162US219
Brooker et al.Principles of Biology20182US49
Freemen et al.Biological Science *20176US126
Hoefnagels; TaylorBiology-The Essentials20152US78
Mader; WindelspechtBiology *20154US21
Raven et al.Biology *201711US98
Sadava; Hillis; HellerLife-The Science of Biology *201711US101
Simon; Dickey; Hogan; ReeceCampbell Essential Biology with Physiology *20165US33
Starr; Dickey; Hogan; ReeceBiology: The Unity and Diversity of Life *201614US20
Taylor et al.Biology-Concepts & Connections *20189US31
German sample
Campbell et al.Campbell Biologie 201610Ger99
KleesattelDie Evolution20111Ger15
KutscheraEvolutionsbiologie20154Ger45
MunkGrundstudium Biologie20001Ger19
Munk; BroseÖkologie-Evolution20091Ger23
OschmannEvolution der Erde20161Ger18
Richard et al.Biologie im Überblick20131Ger3
Sadava et al.Biologie 20119Ger79
Storch; Welsch; WinkEvolutionsbiologie20133Ger69
Tomiuk; LoeschkeGrundlagen der Evolutionsbiologie und Formalen Genetik20161Ger6
Zrzavý et al.Evolution-Ein Lese-Lehrbuch20132Ger29
Total:1197
Books marked with * were included in Catley and Novick’s 2008 study [19] in earlier editions. German books marked with are translations of US textbooks.

Appendix B

Table A2. Inter-Coder Reliability.
CategoryKappaFrequency in Dual Coding Sample
Tree Topology0.91250
non-dichotomous0.8255
Terminal nodes on different levels0.8536
Lateral gene transfer0.916
Unrooted tree0.754
Branches vary in thickness0.666
Bar chart1.002
Anagenesis0.827
Unlinked groups0.503
Direction of the tree0.92250
Inner nodes labeled with taxa0.574
Taxonomic grouping of nodes0.7883
Terminal nodes labeled graphically completely0.77215
Terminal nodes labeled graphically partially0.6413
Terminal nodes labeled/written completely0.8249
Terminal nodes labeled/written partially0.8525
Part of Figure/MER0.88104
Apomorphies0.8079
Time axis without scale0.7412
Time axis0.9022
Other kind of time representation0.725,00
Number of terminal nodes0.93250
Animals0.8017
non-mammalian animal0.8781
non-human mammal0.9658
(early) human0.9427
Plant0.9058
Fungi0.9229
Gene0.666
Single celled organisms0.8331
Virus1.003
Abstract/no context0.9042
Non-biological1.001
Other0.503
Limited on humans0.7912
limited on horses1.002
Animals focused0.668
Mammals focused0.8017
Humans focused0.8313

References

  1. Meisel, R.P. Teaching Tree-Thinking to Undergraduate Biology Students. Evolution 2010, 3, 621–628. [Google Scholar] [CrossRef] [PubMed] [Green Version]
  2. Nehm, R.H.; Kampourakis, K. History and Philosophy of Science and the Teaching of Macroevolution. In International Handbook of Research in History, Philosophy and Science Teaching; Matthews, M.R., Ed.; Springer: Dordrecht, The Netherlands, 2014; pp. 401–421. [Google Scholar]
  3. Baum, D.A.; Smith, S.D. Tree Thinking: An Introduction to Phylogenetic Biology; Roberts and Company Publishers: Greenwood Village, CO, USA, 2013. [Google Scholar]
  4. Baum, D.A.; Smith, S.D.; Donovan, S.S.S. Evolution. The tree-thinking challenge. Science 2005, 310, 979–980. [Google Scholar] [CrossRef] [PubMed] [Green Version]
  5. Catley, K.M.; Novick, L.R.; Funk, D. The Promise and Challenges of Introducing Tree Thinking into Evolution Education. In Evolution Challenges: Integrating Research and Practice in Teaching and Learning about Evolution; Rosengren, K.S., Brem, S.K., Evans, E.M., Eds.; Oxford University Press: Oxford, UK, 2012; pp. 93–101. [Google Scholar]
  6. Yates, T.L.; Mills, J.N.; Parmenter, C.A.; Ksiazek, T.G.; Parmenter, R.R.; Vande Castle, J.R.; Calisher, C.H.; Nichol, S.T.; Abbott, K.D.; Young, J.C.; et al. The Ecology and Evolutionary History of an Emergent Disease: Hantavirus Pulmonary Syndrome. BioScience 2002, 52, 989. [Google Scholar] [CrossRef] [Green Version]
  7. Searls, D.B. Pharmacophylogenomics: Genes, evolution and drug targets. Nat. Rev. Drug Discov. 2003, 2, 613–623. [Google Scholar] [CrossRef]
  8. Blacquiere, L.D.; Hoese, W.J. A valid assessment of students’ skill in determining relationships on evolutionary trees. Evol. Educ. Outreach 2016, 9, 979. [Google Scholar] [CrossRef]
  9. Dees, J.; Momsen, J.L.; Niemi, J.; Montplaisir, L. Student interpretations of phylogenetic trees in an introductory biology course. CBE Life Sci. Educ. 2014, 13, 666–676. [Google Scholar] [CrossRef] [PubMed] [Green Version]
  10. Halverson, K.L. Improving Tree-Thinking One Learnable Skill at a Time. Evol. Educ. Outreach 2011, 4, 95–106. [Google Scholar] [CrossRef] [Green Version]
  11. Meir, E.; Perry, J.; Herron, J.C.; Kingsolver, J. College Students’ Misconceptions About Evolutionary Trees. Am. Biol. Teach. 2007, 69, e71–e76. [Google Scholar] [CrossRef]
  12. Omland, K.E.; Cook, L.G.; Crisp, M.D. Tree thinking for all biology: The problem with reading phylogenies as ladders of progress. Bioessays 2008, 30, 854–867. [Google Scholar] [CrossRef]
  13. Omland, K.E. Interpretation of Phylogenetic Trees. In The Princeton Guide to Evolution; Losos, J.B., Ed.; Princeton University Press: Princeton, NJ, USA; Woodstock, UK, 2014; pp. 51–59. [Google Scholar]
  14. Bokor, J.R.; Landis, J.B.; Crippen, K.J. High school students’ learning and perceptions of phylogenetics of flowering plants. CBE Life Sci. Educ. 2014, 13, 653–665. [Google Scholar] [CrossRef] [Green Version]
  15. Catley, K.M.; Phillips, B.C.; Novick, L.R. Snakes and Eels and Dogs!: Oh, My! Evaluating High School Students’ Tree-Thinking Skills: An Entry Point to Understanding Evolution. Res. Sci. Educ. 2013, 43, 2327–2348. [Google Scholar] [CrossRef]
  16. Pietsch, T.W. Trees of Life: A Visual History of Evolution; Johns Hopkins University Press: Baltimore, MD, USA, 2012. [Google Scholar]
  17. Gontier, N. Depicting the Tree of Life: The Philosophical and Historical Roots of Evolutionary Tree Diagrams. Evol. Educ. Outreach 2011, 4, 515–538. [Google Scholar] [CrossRef] [Green Version]
  18. Mogie, M. Historical baggage in biology: The case of ‘higher’ and ‘lower’ species. Bioessays 2000, 22, 868–869. [Google Scholar] [CrossRef]
  19. Gregory, T.R. Understanding Evolutionary Trees. Evol. Educ. Outreach 2008, 1, 121–137. [Google Scholar] [CrossRef] [Green Version]
  20. Kummer, T.A.; Whipple, C.J.; Jensen, J.L. Prevalence and Persistence of Misconceptions in Tree Thinking. J. Microbiol. Biol. Educ. 2016, 17, 389–398. [Google Scholar] [CrossRef] [PubMed] [Green Version]
  21. Matuk, C. Images of Evolution. J. Biocommun. 2007, 33, E54–E61. [Google Scholar]
  22. Archibald, J.D. Aristotle’s Ladder, Darwin’s Tree: The Evolution of Visual Metaphors for Biological Order; Columbia University Press: New York, NY, USA, 2014. [Google Scholar]
  23. Kutschera, U. From the scala naturae to the symbiogenetic and dynamic tree of life. Biol. Direct. 2011, 6, 33. [Google Scholar] [CrossRef] [Green Version]
  24. Hennig, W. Grundzüge Einer Theorie der Phylogenetischen Systematik; Deutscher Zentralverlag: Berlin, Germany, 1950. [Google Scholar]
  25. Morrison, D.A. Is the tree of life the best metaphor, model, or heuristic for phylogenetics? Syst. Biol. 2014, 63, 628–638. [Google Scholar] [CrossRef] [Green Version]
  26. Bapteste, E.; van Iersel, L.; Janke, A.; Kelchner, S.; Kelk, S.; McInerney, J.O.; Morrison, D.A.; Nakhleh, L.; Steel, M.; Stougie, L.; et al. Networks: Expanding evolutionary thinking. Trends Genet. 2013, 29, 439–441. [Google Scholar] [CrossRef] [PubMed]
  27. Posada, D.; Crandall, K.A. Intraspecific gene genealogies: Trees grafting into networks. Trends Ecol. Evol. 2001, 16, 37–45. [Google Scholar] [CrossRef]
  28. Dobzhansky, T. Nothing in Biology Makes Sense except in the Light of Evolution. Am. Biol. Teach. 1973, 35, 125–129. [Google Scholar] [CrossRef]
  29. Gould, G.C.; MacFadden, B.J. Chapter 17: Gigantism, Dwarfism, and Cope’s Rule: “Nothing in Evolution Makes Sense without a Phylogeny”. Bull. Am. Mus. Nat. Hist. 2004, 285, 219–237. [Google Scholar] [CrossRef]
  30. Young, A.; White, B.; Skurtu, T. Teaching undergraduate students to draw phylogenetic trees: Performance measures and partial successes. Evol. Educ. Outreach 2013, 6, 16. [Google Scholar] [CrossRef] [Green Version]
  31. Novick, L.R.; Catley, K.M. Fostering 21st-Century Evolutionary Reasoning: Teaching Tree Thinking to Introductory Biology Students. CBE Life Sci. Educ. 2016, 15. [Google Scholar] [CrossRef] [Green Version]
  32. Novick, L.R.; Pickering, J.; MacDonald, T.; Diamond, J.; Ainsworth, S.; Aquino, A.E.; Catley, K.M.; Dodick, J.; Evans, E.M.; Matuk, C.; et al. Depicting the tree of life in museums: Guiding principles from psychological research. Evol. Educ. Outreach 2014, 7, 669. [Google Scholar] [CrossRef] [Green Version]
  33. MacDonald, T.; Wiley, E.O. Communicating Phylogeny: Evolutionary Tree Diagrams in Museums. Evol. Educ. Outreach 2012, 5, 14–28. [Google Scholar] [CrossRef] [Green Version]
  34. Du Plessis, L.; McCrone, J.T.; Zarebski, A.E.; Peacock, S.; Pybus, O. COG-UK Consortium. Establishment & lineage dynamics of the SARS-CoV-2 epidemic in the UK. Science 2021. [Google Scholar] [CrossRef]
  35. Morel, B.; Barbera, P.; Czech, L.; Bettisworth, B.; Hübner, L.; Lutteropp, S.; Serdari, D.; Kostaki, E.; Mamais, I.; Kozlov, A.M.; et al. Phylogenetic Analysis of SARS-CoV-2 Data Is Difficult. Mol. Biol. Evol. 2021, 38, 1777–1791. [Google Scholar] [CrossRef]
  36. Kaustuv, R.; Hunt, G.; Jablonski, D. Phylogenetic conservatism of extinctions in marine bivalves. Science 2009, 325, 733–737. [Google Scholar] [CrossRef] [Green Version]
  37. Scaduto, D.I.; Brown, J.M.; Haaland, W.C.; Zwickl, D.J.; Hillis, D.M.; Metzker, M.L. Source identification in two criminal cases using phylogenetic analysis of HIV-1 DNA sequences. Proc. Natl. Acad. Sci. USA 2010, 107, 21242–21247. [Google Scholar] [CrossRef] [Green Version]
  38. Stern, F.; Kampourakis, K.; Huneault, C.; Silveira, P.; Müller, A. Undergraduate Biology Students’ Teleological and Essentialist Misconceptions. Educ. Sci. 2018, 8, 135. [Google Scholar] [CrossRef] [Green Version]
  39. Schramm, T.; Schmiemann, P. Teleological pitfalls in reading evolutionary trees and ways to avoid them. Evol. Educ. Outreach 2019, 12, 20. [Google Scholar] [CrossRef] [Green Version]
  40. Valverde, G.A.; Bianchi, L.J.; Wolfe, R.G.; Schmidt, W.H.; Houang, R.T. According to the Book: Using TIMSS to Investigate the Translation of Policy into Practice Through the World of Textbooks; Springer: Dordrecht, The Netherlands, 2002. [Google Scholar]
  41. Catley, K.M.; Novick, L.R. Seeing the Wood for the Trees: An Analysis of Evolutionary Diagrams in Biology Textbooks. BioScience 2008, 58, 976. [Google Scholar] [CrossRef] [Green Version]
  42. Nelson, G.; Platnick, N.I. Three-Taxon Statement: A More Precise Use of Parsimony? Cladistics 1991, 7, 351–366. [Google Scholar] [CrossRef]
  43. Crisp, M.D.; Cook, L.G. Do early branching lineages signify ancestral traits? Trends Ecol. Evol. 2005, 20, 122–128. [Google Scholar] [CrossRef] [PubMed]
  44. Novick, L.R.; Catley, K.M. Understanding phylogenies in biology: The influence of a Gestalt Perceptual Principle. J. Exp. Psychol. Appl. 2007, 13, 197–223. [Google Scholar] [CrossRef]
  45. Morabito, N.P.; Catley, K.M.; Novick, L.R. Reasoning about evolutionary history: Post-secondary students’ knowledge of most recent common ancestry and homoplasy. J. Biol. Educ. 2010, 44, 166–174. [Google Scholar] [CrossRef]
  46. Novick, L.R.; Catley, K.M.; Funk, D. Characters Are Key: The Effect of Synapomorphies on Cladogram Comprehension. Evol. Educ. Outreach 2010, 3, 539–547. [Google Scholar] [CrossRef] [Green Version]
  47. Kummer, T.A.; Whipple, C.J.; Bybee, S.M.; Adams, B.J.; Jensen, J.L. Development of an Evolutionary Tree Concept Inventory. J. Microbiol. Biol. Educ. 2019, 20. [Google Scholar] [CrossRef] [PubMed] [Green Version]
  48. Phillips, B.C.; Novick, L.R.; Catley, K.M.; Funk, D. Interactive Effects of Diagrammatic Format and Teleological Beliefs on Tree Thinking.; Catrambone, R., Ohlsson, S., Eds.; Curran Associates Inc.: Red Hook, NY, USA, 2011. [Google Scholar]
  49. Mead, L.S. Transforming Our Thinking about Transitional Forms. Evo. Edu. Outreach 2009, 2, 310–314. [Google Scholar] [CrossRef] [Green Version]
  50. Padian, K. Trickle-down evolution: An approach to getting major evolutionary adaptive changes into textbooks and curricula. Integr. Comp. Biol. 2008, 48, 175–188. [Google Scholar] [CrossRef] [Green Version]
  51. Baum, D.A.; Offner, S. Phylogenics & Tree-Thinking. Am. Biol. Teach. 2008, 70, 222–229. [Google Scholar] [CrossRef]
  52. Novick, L.R.; Catley, K.M. When Relationships Depicted Diagrammatically Conflict With Prior Knowledge: An Investigation of Students’ Interpretations of Evolutionary Trees. Sci. Ed. 2014, 98, 269–304. [Google Scholar] [CrossRef]
  53. Nehm, R.H.; Ha, M. Item feature effects in evolution assessment. J. Res. Sci. Teach. 2011, 48, 237–256. [Google Scholar] [CrossRef]
  54. Kim, H.Y. Statistical notes for clinical researchers: Chi-squared test and Fisher’s exact test. Restor. Dent. Endod. 2017, 42, 152–155. [Google Scholar] [CrossRef] [PubMed]
  55. MAXQDA 2020; VERBI Software: Berlin, Germany, 2019.
  56. Landis, J.R.; Koch, G.G. The Measurement of Observer Agreement for Categorical Data. Biometrics 1977, 33, 159. [Google Scholar] [CrossRef] [PubMed] [Green Version]
  57. Novick, L.R.; Schreiber, E.G.; Catley, K.M. Deconstructing evolution education: The relationship between micro- and macroevolution. J. Res. Sci. Teach. 2014, 51, 759–788. [Google Scholar] [CrossRef]
  58. Kattmann, U. Learning biology by means of anthropomorphic conceptions. In Biology in Context: Learning and Teaching for the Twenty-First Century; Hammann, M., Reiss, M., Boulter, C., Eds.; Institute of Education Press: London, UK, 2008; pp. 7–17. [Google Scholar]
  59. Sandvik, H. Anthropocentricisms in cladograms. Biol. Philos. 2009, 24, 425–440. [Google Scholar] [CrossRef] [PubMed] [Green Version]
  60. Nee, S. The great chain of being. Nature 2005, 435, 429. [Google Scholar] [CrossRef]
  61. Halverson, K.L.; Friedrichsen, P. Learning Tree Thinking: Developing a New Framework of Representational Competence. In Multiple Representations in Biological Education; Treagust, D., Tsui, C.Y., Eds.; Springer: Dordrecht, The Netherlands, 2013; pp. 185–201. [Google Scholar]
  62. Schramm, T.; Jose, A.; Schmiemann, P. Modeling and Measuring Tree-Reading Skills in Undergraduate and Graduate Students. CBE Life Sci. Educ. 2021, 20, ar32. [Google Scholar] [CrossRef]
  63. Gibson, J.P.; Cooper, J.T. Botanical Phylo-Cards: A Tree-Thinking Game to Teach Plant Evolution. Am. Biol. Teach. 2017, 79, 241–244. [Google Scholar] [CrossRef]
  64. Goldsmith, D.W. The Great Clade Race. Am. Biol. Teach. 2003, 65, 679–682. [Google Scholar] [CrossRef]
  65. Halverson, K.L. Using Pipe Cleaners to Bring the Tree of Life to Life. Am. Biol. Teach. 2010, 72, 223–224. [Google Scholar] [CrossRef]
Figure 1. Exemplary tree styles and formats: (a) diagonal tree, (bd) different kinds of rectangular trees, (e) circular tree, (f) other type of tree.
Education 11 00367 g001
Figure 2. Properties of evolutionary trees. (a) Tree of life representation, (b) bar chart, (c) unrooted tree, (d) rectangular tree with unlinked groups and lateral gene transfer, (e) rectangular anagenetic tree, (f) non-dichotomous rectangular tree with varying thickness of branches, (g) diagonal tree with terminal nodes at different levels, (h) other tree type.
Education 11 00367 g002
Figure 3. Tree Topology Bars show the relative shares of the investigated diagrams, numbers above the bars show total values. Solid bars show the US sample, checkered bars show the German sample. Categories are mutually exclusive. The two samples’ distributions differ significantly (p < 0.001, FET = 30.481, V = 0.163).
Education 11 00367 g003
Figure 4. Overview of the share of characteristics in the category ‘branch structure’. Bars show the relative shares of the investigated diagrams, numbers above the bars show total values. Solid bars show the US sample, and checkered bars show the German sample. *** indicates a significant difference with p < 0.001 following a χ2 analysis. *** represents a significance level of p < 0.001.
Education 11 00367 g004
Figure 5. Orientation of evolutionary diagrams. Bars show the relative shares of the investigated diagrams, numbers above the bars show total values. Solid bars show the US sample, and checkered bars show the German sample.
Education 11 00367 g005
Figure 6. Labeling of evolutionary diagrams. Bars show the relative shares of the investigated diagrams, numbers above the bars show total values. Solid bars show the US sample, and checkered bars show the German sample. *** represents a significance level of p < 0.001, ** represents a significance level of p < 0.01.
Education 11 00367 g006
Figure 7. Display of apomorphies. Bars show the relative shares of the investigated diagrams, numbers above the bars show total values. Solid bars show the US sample, and checkered bars show the German sample. *** represents a significance level of p < 0.001. Diagrams included in the written and graphical groups were also included in both other groups.
Education 11 00367 g007
Figure 8. Display of time. Bars show the relative shares of the investigated diagrams, numbers above the bars show total values. Solid bars show the US sample, and checkered bars show the German sample. The bars labeled ‘any time axes’ are the summed values of the three other categories.
Education 11 00367 g008
Figure 9. Number of groups presented in the diagram. Bars show the relative shares of the investigated diagrams, numbers above the bars show total values. Solid bars show the US sample, and checkered bars show the German sample. Both samples differed significantly from each other.
Education 11 00367 g009
Figure 10. Organisms presented in the diagrams. Groups were coded if at least one terminal node could be identified as belonging to the group. The group ‘animals’ was only coded if a node was labeled ‘animals’ or ‘animalia’. Bars show the relative shares of the investigated diagrams, numbers above the bars, and total values. Solid bars show the US sample, and checkered bars show the German sample. ** represents a significance level of p < 0.01.
Education 11 00367 g010
Figure 11. Focal positioning of groups. Bars show the relative shares of the investigated diagrams, numbers above the bars show total values. Solid bars show the US sample, and checkered bars show the German sample.
Education 11 00367 g011
Table 1. Overview of the coding categories and their links to Catley and Novick’s 2008 study.
Main CategoriesCoding CategoriesInclusion in Catley and Novick’s 2008 Study
Tree structure/Topology
Tree Diagram
Rectangular treeChanged
Diagonal treeChanged
Circular treeChanged
Tree of LifeSimilar
Other treeSimilar
Non-tree diagramNew
Branch structure
Non-dichotomous diagramSimilar
Terminal nodes on different levelsSimilar
Lateral gene transferSimilar
Unrooted treeNew
Branches vary in thicknessSimilar
Bar chartSimilar
AnagenesisSimilar
Unlinked groupsNew
Direction of the treeNew
Extent of labeling
Inner nodes labeled with taxaSimilar
Taxonomic grouping of nodesNew
Terminal nodes labeledNew
Further Information
Part of figure/MERNew
ApomorphiesNew
Time scaleChanged
Task of representation
FigureNew
Advanced organizerNew
TaskNew
OtherNew
Presented organisms
Number of terminal nodesNew
Represented organismsNew
Limited on special groupChanged
Focal taxonNew
Table 2. Graphical and written labeling of terminal nodes.
US
graphical labels
all nodessome nodesnone
written labelsall nodes25%8.9%42.9%
20973351
some nodes0.2%1.8%4.9%
21540
none3.4%0.3%11.7%
28396
Germany
graphical labels
all nodessome nodesnone
written labelsall nodes22.9%5%56.8%
8719216
some nodes0.2%3.2%4.5%
11217
none2.6%0.5%4.2%
10216
Publisher’s Note: MDPI stays neutral with regard to jurisdictional claims in published maps and institutional affiliations.

