Article

Investigative Activities for Statistics Learning with 1st Grade Portuguese Students

1
Colégio D. Diogo de Sousa, 4710-294 Braga, Portugal
2
Research Centre on Education (CIEd), University of Minho, 4710-057 Braga, Portugal
3
CIDTFF—Research Centre on Didactics and Technology in the Education of Trainers, 3810-193 Aveiro, Portugal
4
University of Trás-os-Montes e Alto Douro, 5000-801 Vila Real, Portugal
5
CIDTFF—Research Centre on Didactics and Technology in the Education of Trainers, University of Aveiro, 3810-193 Aveiro, Portugal
*
Author to whom correspondence should be addressed.
Educ. Sci. 2022, 12(10), 665; https://doi.org/10.3390/educsci12100665
Submission received: 5 August 2022 / Revised: 22 September 2022 / Accepted: 26 September 2022 / Published: 29 September 2022

Abstract

:
The relevance of data exploration in mathematics programmes at all levels of education led us to develop a learning experience with 1st grade students with the aim of investigating the contribution of investigative activities in the learning of statistics. To achieve this objective, the following research questions were outlined: How do students implement investigative activities when learning statistics? What difficulties do students have in carrying out investigative activities when learning statistics? Adopting a qualitative and interpretative approach, data were collected through students’ written records, the reflections of the teacher, and a written test applied before and after the learning experience. The results obtained suggest that students were able to carry out investigative activities when learning statistics although with some weaknesses, namely defining the topic and research questions, and analysing the data due to the greater complexity of the research proposed by them. Students were able to formulate conclusions, although in some groups the conclusions were underdeveloped. Students were most confident in data collection, organization, and representation activities, with limitations typical of their young age (e.g., written communication). Students also showed difficulties in managing group work and knowledge of statistics, notably concerning strategies of data organization and representation and statistical measures.

1. Introduction

The technological evolution we witness in current times has implications for how information is processed in the most varied situations. This evolution challenges schools to provide students with educational activities that allow them to develop and structure their thinking through analysis and interpretation of situations from their lived reality [1], to which the subject of mathematics can contribute significantly. Such analysis and interpretation tends to train students for an active and competent citizenship, able to mobilize and apply the knowledge learnt at school in the most diverse situations of their daily lives, both in interpretation and decision-making [2,3,4,5]. It is thus a matter of equipping students “with multiple literacies that allow them to critically analyse and question reality, evaluate and select information, formulate hypotheses and make informed decisions in their daily lives” [6] (p. 16), making them responsible and active citizens. The aim is to develop students’ ability to make sense of what they learn in different subjects of the school curriculum, especially the ability to read, interpret, and evaluate statistical information present in different information media.
The convergence of the discussion about teaching methodologies that value student activity leads [2] to consider that mathematics lessons must allow students to learn mathematics in a meaningful way. Investigative activities thus emerge as a methodology that allows students to achieve the objectives of the subject and develop their conceptions of mathematics [7,8]. In investigative activities, students assume a prominent role both in the development of their own learning and of the investigation itself, which in turn requires the development of a resolution strategy and the formulation of research questions [9,10]. The investigative process is essentially carried out in four stages: (a) exploration and formulation of questions; (b) formulation of conjectures; (c) testing and reformulation; and (d) justification and evaluation of the work done [10]. The implementation of investigative activities allows students to develop their mathematical skills in context, develop and consolidate specific notions and mathematical ideas, and develop mathematical argumentation with moments of discussion and interaction among peers [1,11]. Several authors refer to the importance of investigative activities as they provide opportunities for the involvement of all students, even those uninterested and with the most difficulties [12,13,14].
The implementation of investigative activities in learning statistics is relevant not only for the reasons mentioned above, but also due to the importance and prominence of statistical knowledge in diverse aspects of society. Statistics is becoming increasingly visible in mathematics curricula, which thus takes on the aims of developing students’ abilities to collect, organize, and analyse information related to different contexts and developing statistical literacy [1]. For these reasons, there are several documents that mention the relevance of using investigative activities for learning statistics [4,15,16]. From early school years these activities provide situations where it is necessary to interpret and think about statistical information, thus providing opportunities for promoting statistical literacy—the ability to understand, interpret, and reason about information [17,18].
Considering the assumptions outlined above, we enquired about the contribution of investigative activities in learning statistical knowledge. In order to achieve this objective we will answer the following research questions: How do students implement investigative activities when learning statistics? What difficulties do students have in carrying out investigative activities when learning statistics?

2. Investigative Activities in Learning Statistics

In everyday life, whether through the media or other means, people come across statistical information presented in a variety of ways, such as tables and statistics graphics. This requires certain knowledge [19,20] necessary for reading and interpretating statistical information in order to make certain decisions [21]. The value of statistics is increasingly recognized, both for the knowledge used in support of various areas [22] and for the assigned to the development of statistical thinking [4]. Therefore, it is becoming increasingly essential to develop statistical knowledge not only in professionals in the area, but also in all citizens [19].
Statistics is one of the more recent branches of Mathematics [7] and has been understood as the science that deals with data [21]. Fernandes and Portela define statistics as a set of appropriate techniques to collect, classify, present, and interpret data sets [19]. Statistics involves situations of uncertainty that do not allow accurate solutions [23], which generates methodological strategies to analyse and interpret data [4]. Such considerations are mentioned by the National Council of Teachers of Mathematics (NCTM) when it refers to statistics as a tool for organizing, representing, and processing data related to real situations, which enables students to acquire the ability to appreciate, in a critical way, the uses data have in various areas of life in society [16].
Currently, most countries show an interest in statistical education, which directly influences its recent presence and visibility (compared to other topics) in school curricula [19,24,25,26], being one of the topics that is covered in all school years [16]. Statistics is therefore included in the school curriculum from the most elementary levels of schooling with the aim of developing a responsible citizenship in students [21], seeking to lead students to “know the world in which [they] live, to the point of knowing how to predict how [they] can react to the variability and uncertainty of the phenomena (…) around [them]” [27] (p. 23). Several authors reinforce this idea when discussing the promotion of students’ statistical reasoning [28,29,30]. Statistical reasoning involves an explicit process where facts are identified, relationships are established, and inferences are made [21]. For Garfield and Franklin [31], statistical literacy, thinking, and reasoning can be seen as a categorisation of the cognitive learning outcomes of statistics. These three components (statistical literacy, thinking, and reasoning) are thus interrelated and can be considered as part of a broader concept, commonly referred to as statistical competence [32].
The teaching of statistics thus seeks to develop students’ knowledge for the analysis and interpretation of tables and graphs so that they are able to investigate the data represented [21] being based on “one of the important aspects of work in statistics from the early years” [2] (p. 99). With respect to graphical representations, Curcio [33] defined three successive levels for graph comprehension: (1) reading the data; (2) reading between the data; and (3) reading beyond the data. The first level involves reading the graphs literally, not requiring interpretation of the data. The second level involves interpreting and integrating the data of the graph, requiring statistical knowledges and the capacity to make comparisons between the data. Finally, the third level requires more complete processes, including extrapolation, prediction, or inference from the graphical representation.
In the reference curriculum for mathematics of the 1st and 2nd cycles of Basic Education (years 1–6) in Portugal (The Portuguese system includes 12 years of school up to higher education: nine years of Basic Education (BE) followed by three of Secondary Education (SE). BE consists of three cycles: the first with four years (with a single teacher), the second with two years, and the third with three years. In SE, students are oriented to different areas, namely Science, Humanities, Arts, or Technology, and the Mathematics curriculum varies depending on the chosen area), statistics is studied in the topic called Organization and Treatment of Data, where it is recommended that students “develop the ability to understand statistical information represented in different ways” [1] (p. 5). Students should read and interpret data organized in the form of tables, graphs, and diagrams, as well as conduct studies in which they collect data of a varied nature—qualitative and discrete quantitative—and organize and represent the information collected [1].
Considering the current curriculum guidelines for the teaching of statistics, it is essential that the teacher provides opportunities and time for students to think, share, and discuss amongst themselves the mathematical productions performed during the exploration of a task, and to systematize collectively the mathematical learning that emerges [1]. The teaching and learning of statistics should therefore allow students to develop the competence to conduct statistical research, as well as to appreciate the results of statistical studies [21]. Furthermore, it can promote the learning of other topics in the mathematics curriculum due to its interdisciplinary nature, which also enables students to understand content from other areas of knowledge [7,26,28,29]. Thus, it is essential that students use work with mathematical investigations in learning activities of mathematics topics, as this contributes to the students’ mathematical experience and develops their own mathematical activity [7,34].
However, if on the one hand it is generally accepted that carrying out mathematical investigations is to learn mathematics significantly, on the other hand, the concept of investigation is not understood in a similar way by all authors. Some characterize it as taking into account the comparison with other activities, especially with the formulation and resolution of problems, others consider it part of mathematical activity, and still others characterize it as taking into account the mathematical processes involved [35,36]. For Ernest [37], this issue is due to the term investigation consisting of both a process (of enquiry) and a noun (which relates the investigation to its starting point, initial situation, or questions). Investigative activities and problems are two pedagogical approaches to mathematics [37] that have some common aspects, namely the experiences provided to the students and their rather complex thinking processes, in which they have the opportunity to experience, discuss, formulate, conjecture, generalise, prove, communicate their ideas, and make decisions [38].
Several statisticians and statistics educators suggest investigative activities in learning statistics, since it engages all phases of the investigative cycle [15,39,40]. In these processes of teaching and learning statistics, students are actively involved in the construction of knowledge, from beginning to end: at the starting point, with the identification of a topic of interest and the formulation of questions, thus defining the problem under study; then, the collection of important and necessary data for the topic and questions under study, to analyse and interpret them according to the questions they want to investigate; and, finally, reach conclusions.
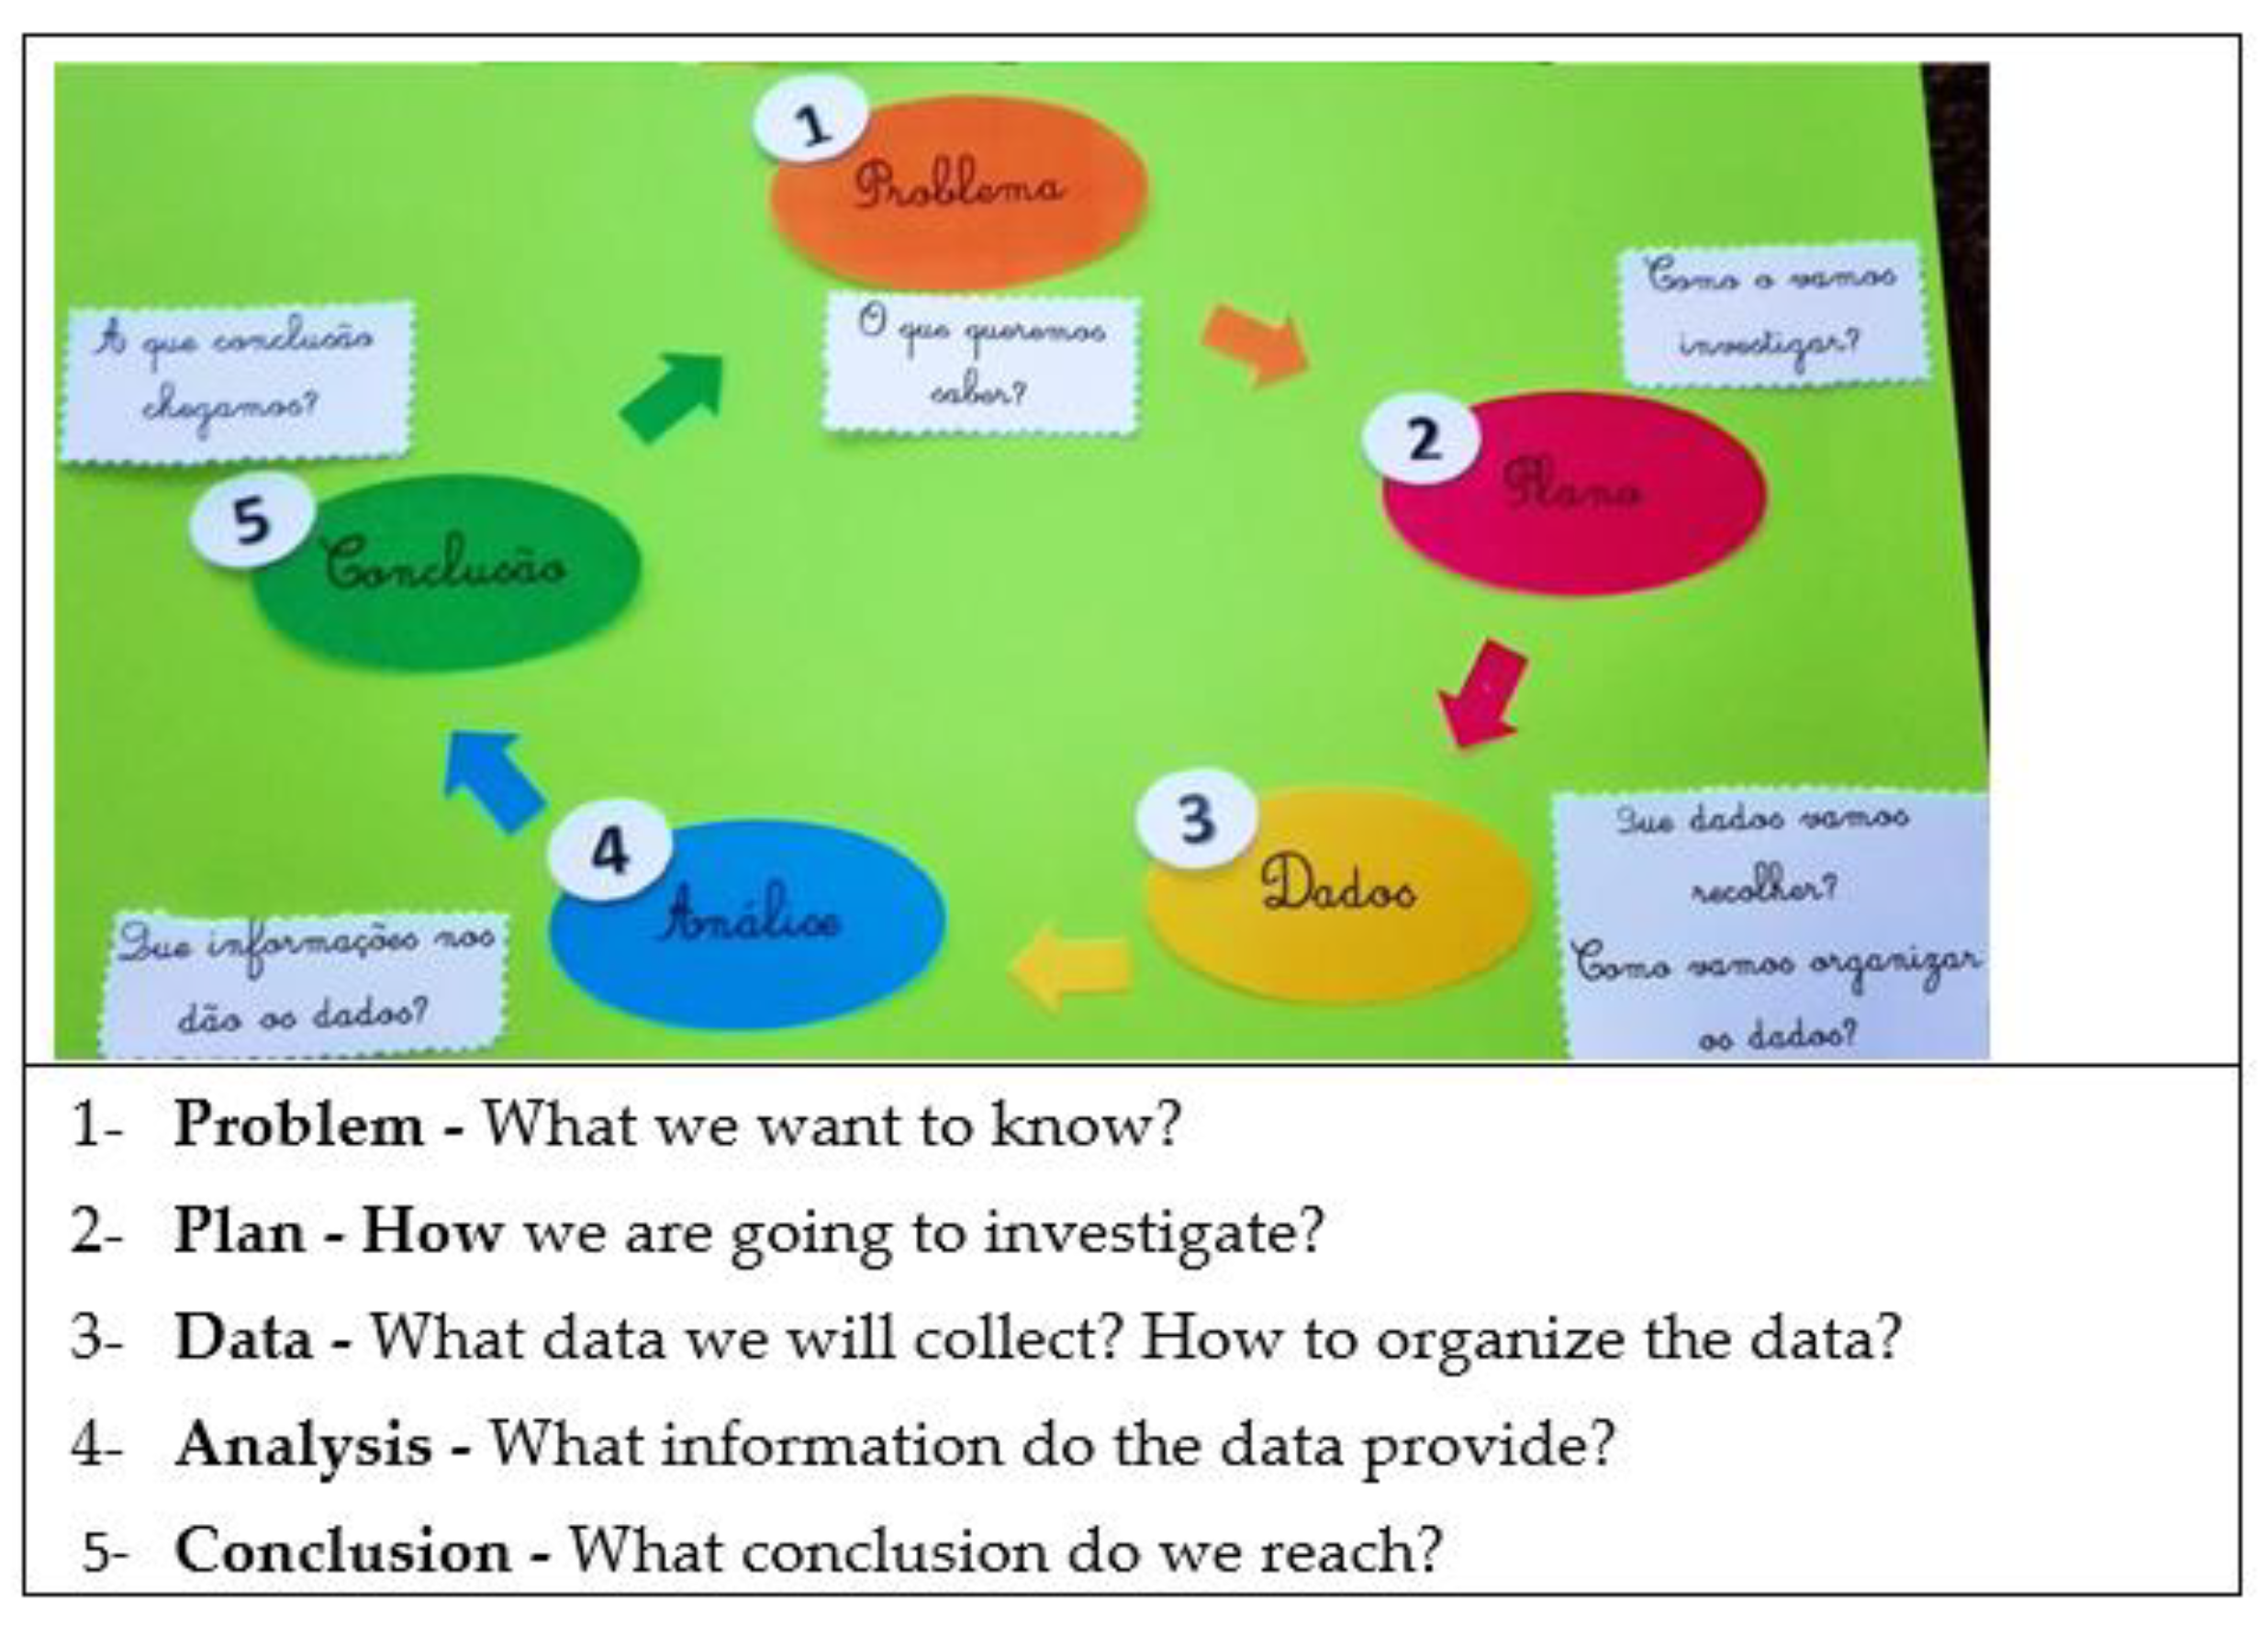
In carrying out this study, we follow the structure of the investigative cycle presented by Wild and Pfannkuch [41] called PPDAC (Problem, Plan, Data, Analysis, and Conclusions), considering the actions, processes, and thoughts involved over the course of a statistical investigation (Figure 1).
For Shaughnessy, the PPDAC investigative cycle is the basis of thinking for all statistical investigations and is “reminiscent of Pólya presenting a seemingly timeless four-step model of mathematical problem solving” [42] (p. 963), associating statistical investigations with problem solving and defining the cycle as the thinking intrinsic to a statistical investigation.
When implementing investigative activities in the mathematics classroom, Burgess [43] considers that the teacher can use two different approaches: one that starts by providing students with data on which they ask questions, analyse, and conclude, and another that begins with problem definition and data collection, encompassing a full investigative cycle.
A lesson or set of lessons with investigative activities can be structured in three key moments: (a) the introduction of the task, in which the teacher makes the proposal to the class, orally or in writing; (b) the performance of the task, individually, in pairs, in small groups or with the whole class; (c) presentation of results and the final discussion, in which students report to the class the work done [10,14]. According to these authors, the three moments also play an important role in the success of the investigative activity itself. The introduction has its own style and dynamic that defines the success of the investigation, because it is at this moment that the interest and motivation of students for the investigation is triggered. It is followed by the performance of the investigative activity, in which the execution of the task unfolds. The final moment is the presentation and discussion of results, which is essential insofar as it contributes to the development of conceptions about what it means to investigate, of the students’ argumentative and communicative capacity in mathematics and provides the opportunity to reflect on the work done [10]. The same authors advocate that without this final moment there is a risk of losing the meaning of investigation [10].
In line with Veia et al. [44], we believe that carrying out experiments that include making decisions about data to be collected to answer a given question, as well as making decisions about the appropriate processes for collecting, recording and analysing the data, constitutes a challenge for research in Didactics of Mathematics. This requires carrying out research in order to understand students’ actions during statistic investigative activities, especially in the first grades, and how teachers support these activities.

3. Method

This study aims to investigate the contribution of investigative activities in the learning of statistics by 1st grade students. To achieve this objective and research questions outlined, we adopted a qualitative and interpretive approach with the purpose of understanding the meaning of the students’ activity in the classroom context [45].

3.1. Participants

In this study, one of the authors conducted a learning experience based on the implementation of investigative activities, during five lessons, in a 1st grade class consisting of 20 students aged 6 to 7 years old, 10 of whom were female and 10 of whom were males. No students were identified as having special educational needs. In order to identify some characteristics of students, the teacher asked them individually about their preferred subjects, both before the learning experience and two months after the beginning of the school year. As preferred subject, 40% of the students indicated Mathematics, 30% indicated Environmental Studies, and 25% indicated Portuguese. Only one student indicated Artistic Expressions. As the subject they least preferred, the highest percentage, around 35%, was Portuguese. With same percentages, the students indicated Mathematics and Environmental Studies, each subject with 30% of the answers. It should be noted that the majority of students obtained, throughout the school year, classifications of ‘Good’ and ‘Very Good’ in Mathematics and Portuguese, and just one student obtained ‘Sufficient’ and ‘Insufficient’. In carrying out the investigative activities, the 20 students the class were organized into groups of five. In setting up the groups, the students’ heterogeneity in terms of gender and performance in mathematics was taken into consideration. This meant that there were two groups with two girls and three boys, and two groups with three girls and two boys. All the groups had students with ‘Very Good’ mathematics performance.

3.2. Procedures

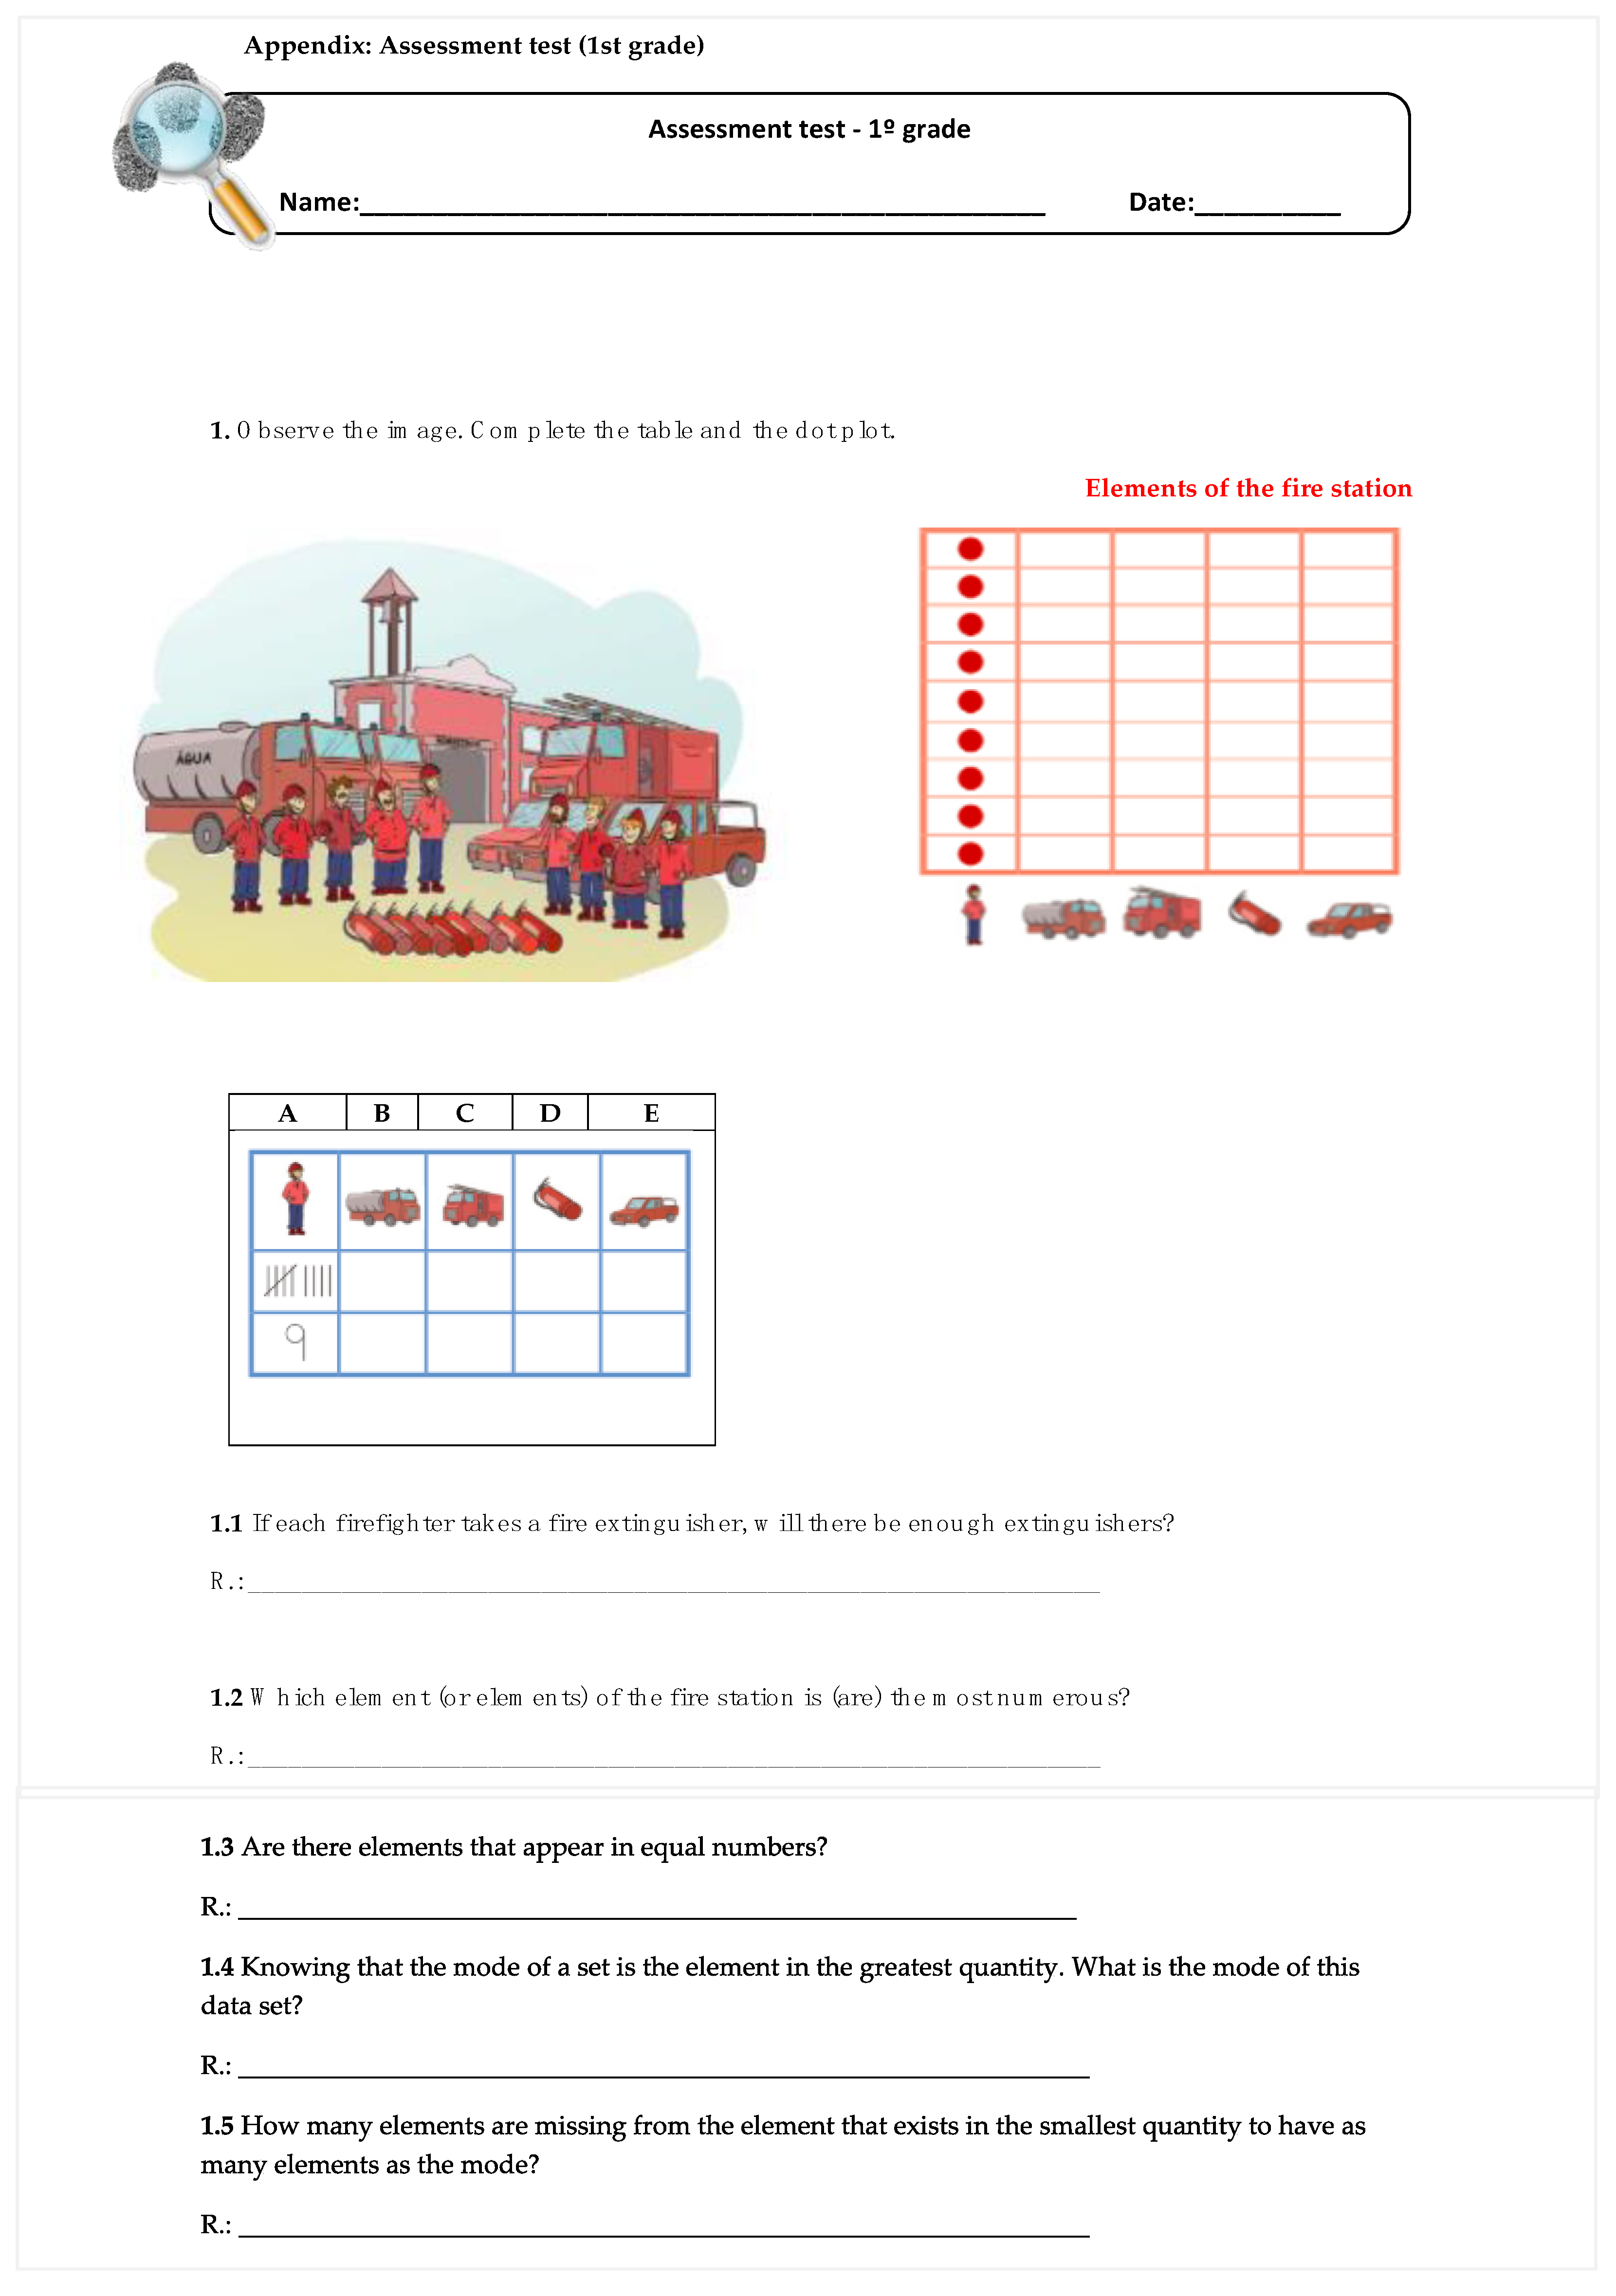
Before and after the learning experience, the students took a test (referred to in the study as pre-test and post-test). The test consisted of questions that addressed the representation of data in point graphs and pictograms (in which each illustrative figure represents an observational unit) aiming to assess students’ interpretation to the presented situations and their understanding of statistical measures, namely the mode (Appendix A). All questions were read to the students by the teacher. This was followed by the reading and interpretation of a story in order for the students to identify the phases of the investigative cycle. Then, each group of students carried out their own investigative activity, involving: (a) the elaboration of a questionnaire on a previously chosen theme, by each group. To construct the questionnaire, due consideration had to be given to students’ writing limitations. Students were first asked to think about what questions to ask their classmates to find out more about the problem they were investigating and only then ask the teacher for help in recording them. The questionnaire was prepared in digital format by the teacher and some questions were reformulated based on the first draft by the students; (b) application of the questionnaire to the students of the class ( n = 20 ) and to another 1st grade class of the same school ( n = 19 ), with 39 respondents in total, of which 20 were boys and were 19 girls, with ages between the ages of 6 ( n = 30 ) and 7 ( n = 9 ); (c) the organization and analysis of the data collected; and (d) the communication of the conclusions of the study to the 1st grade students.
Data were collected from the written records produced by the students in groups of five during the investigative activities, the reflections of the teacher who conducted the learning experience, and a test applied both at the beginning of the experience (pre-test) and at the end of the experience (post-test). Given the students’ young age and their initiation in formal education, the proposed activities were based on playful moments, associated with games and exploration of books, and connected to the students’ daily lives [21]. Informed consent was obtained from all participants by a form that was delivered to children’s legal guardians. Data protection was assured by following the institutional protocol in place that regulates the practice component of pre-service teacher (PST) training, including data collection procedures.

3.3. Method of Analysis

The information from the analysis of the data collected in the pre- and post-test is presented in tables in the form of percentages of the type of response given by students (correct, incorrect, and no response). Data processing was based on the content analysis of the activities performed by students, whose information is identified by A# (where # represents a different number identifying the student, ranging from 1 to 20), and the reflections of the teacher who conducted the learning experience, whose information is presented by RA# (where # represents the number of the lesson taught, ranging from 1 to 5). The study was carried out, and the analysis is here presented, in the following three stages: (i) Development of the statistical investigative activity; (ii) Presentation of the investigative activity; (iii) Evaluation of the learning experience.

4. Results and Discussion

The performance of the investigative activity in small groups was preceded by a set of activities aiming to familiarize students with this form of work, developing the students’ notion of investigative activity and an understanding of its phases and processes. Regardless of age, students’ perceptions of the notion of investigating and the investigative cycle are essential for the accomplishment of an investigation [10,41]. Our activity was based on an exploration of the adapted reading of a story of the book ‘O Cuquedo’ [46], which proved to be “a good ally for understanding the notion of investigating” (RA1). During the exploration of the story, an investigation was conducted about the Cuquedo, taking into account the phases of the investigative cycle: identifying the problem (discovering the Cuquedo); designing a plan (exploring the book, by reading and interpreting the story, and collecting data); collecting and organising the data (by reading and recording the data collected about the Cuquedo on the board); analysing the data (characteristics of the Cuquedo); and concluding the problem (discovering what the Cuquedo is). As noted by the teacher, the students “became aware of the phases of a mathematical investigation and show a great interest in carrying out investigations” (RA1), allowing them to gain familiarity with the investigative cycle (Figure 2).
Then, the group investigative activity was started with the presentation of a proposal to learn topics of Statistics from the subject Environmental Studies.

4.1. Execution of the Statistical Investigative Activity

In the execution of the investigative activity, the phases of the cycle proposed by Wild and Pfannkuch [41] were followed: (1) Problem; (2) Plan; (3) Data collection and organization; (4) Data analysis; and (5) Conclusion.

4.1.1. Stage 1: Problem

In the first stage of the investigative activity, students were asked about what topics they would like to investigate in order to take advantage of the interdisciplinary nature of Statistics and research [7,28,29]. In particular, the students were asked to suggest topics from the area of Environmental Studies, which is a subject in the 1st year of primary school curriculum. Students suggested several themes: “cars; juices; friends; colours; cartoons; fruits; plants; food; animals” (RA4). So that all groups could carry out similar investigations in terms of difficulty and exploration, the students’ preferences were used to define the groups, who then chose their topic: (G1) Animals; (G2) Cartoons; (G3) Fruits; and (G4) Colours.

4.1.2. Stage 2: Plan

In the next stage, students planned how the investigation would be carried out. Discussion of the plan was held as a class group after a brief interaction within groups so that it was easier to see if all groups had understood what they were expected to do in carrying out their investigation. In this dialogue, the groups decided that the data analysis would be done by gender, which means they considered the preferences of boys and girls separately.

4.1.3. Stage 3: Collecting and Organizing Data

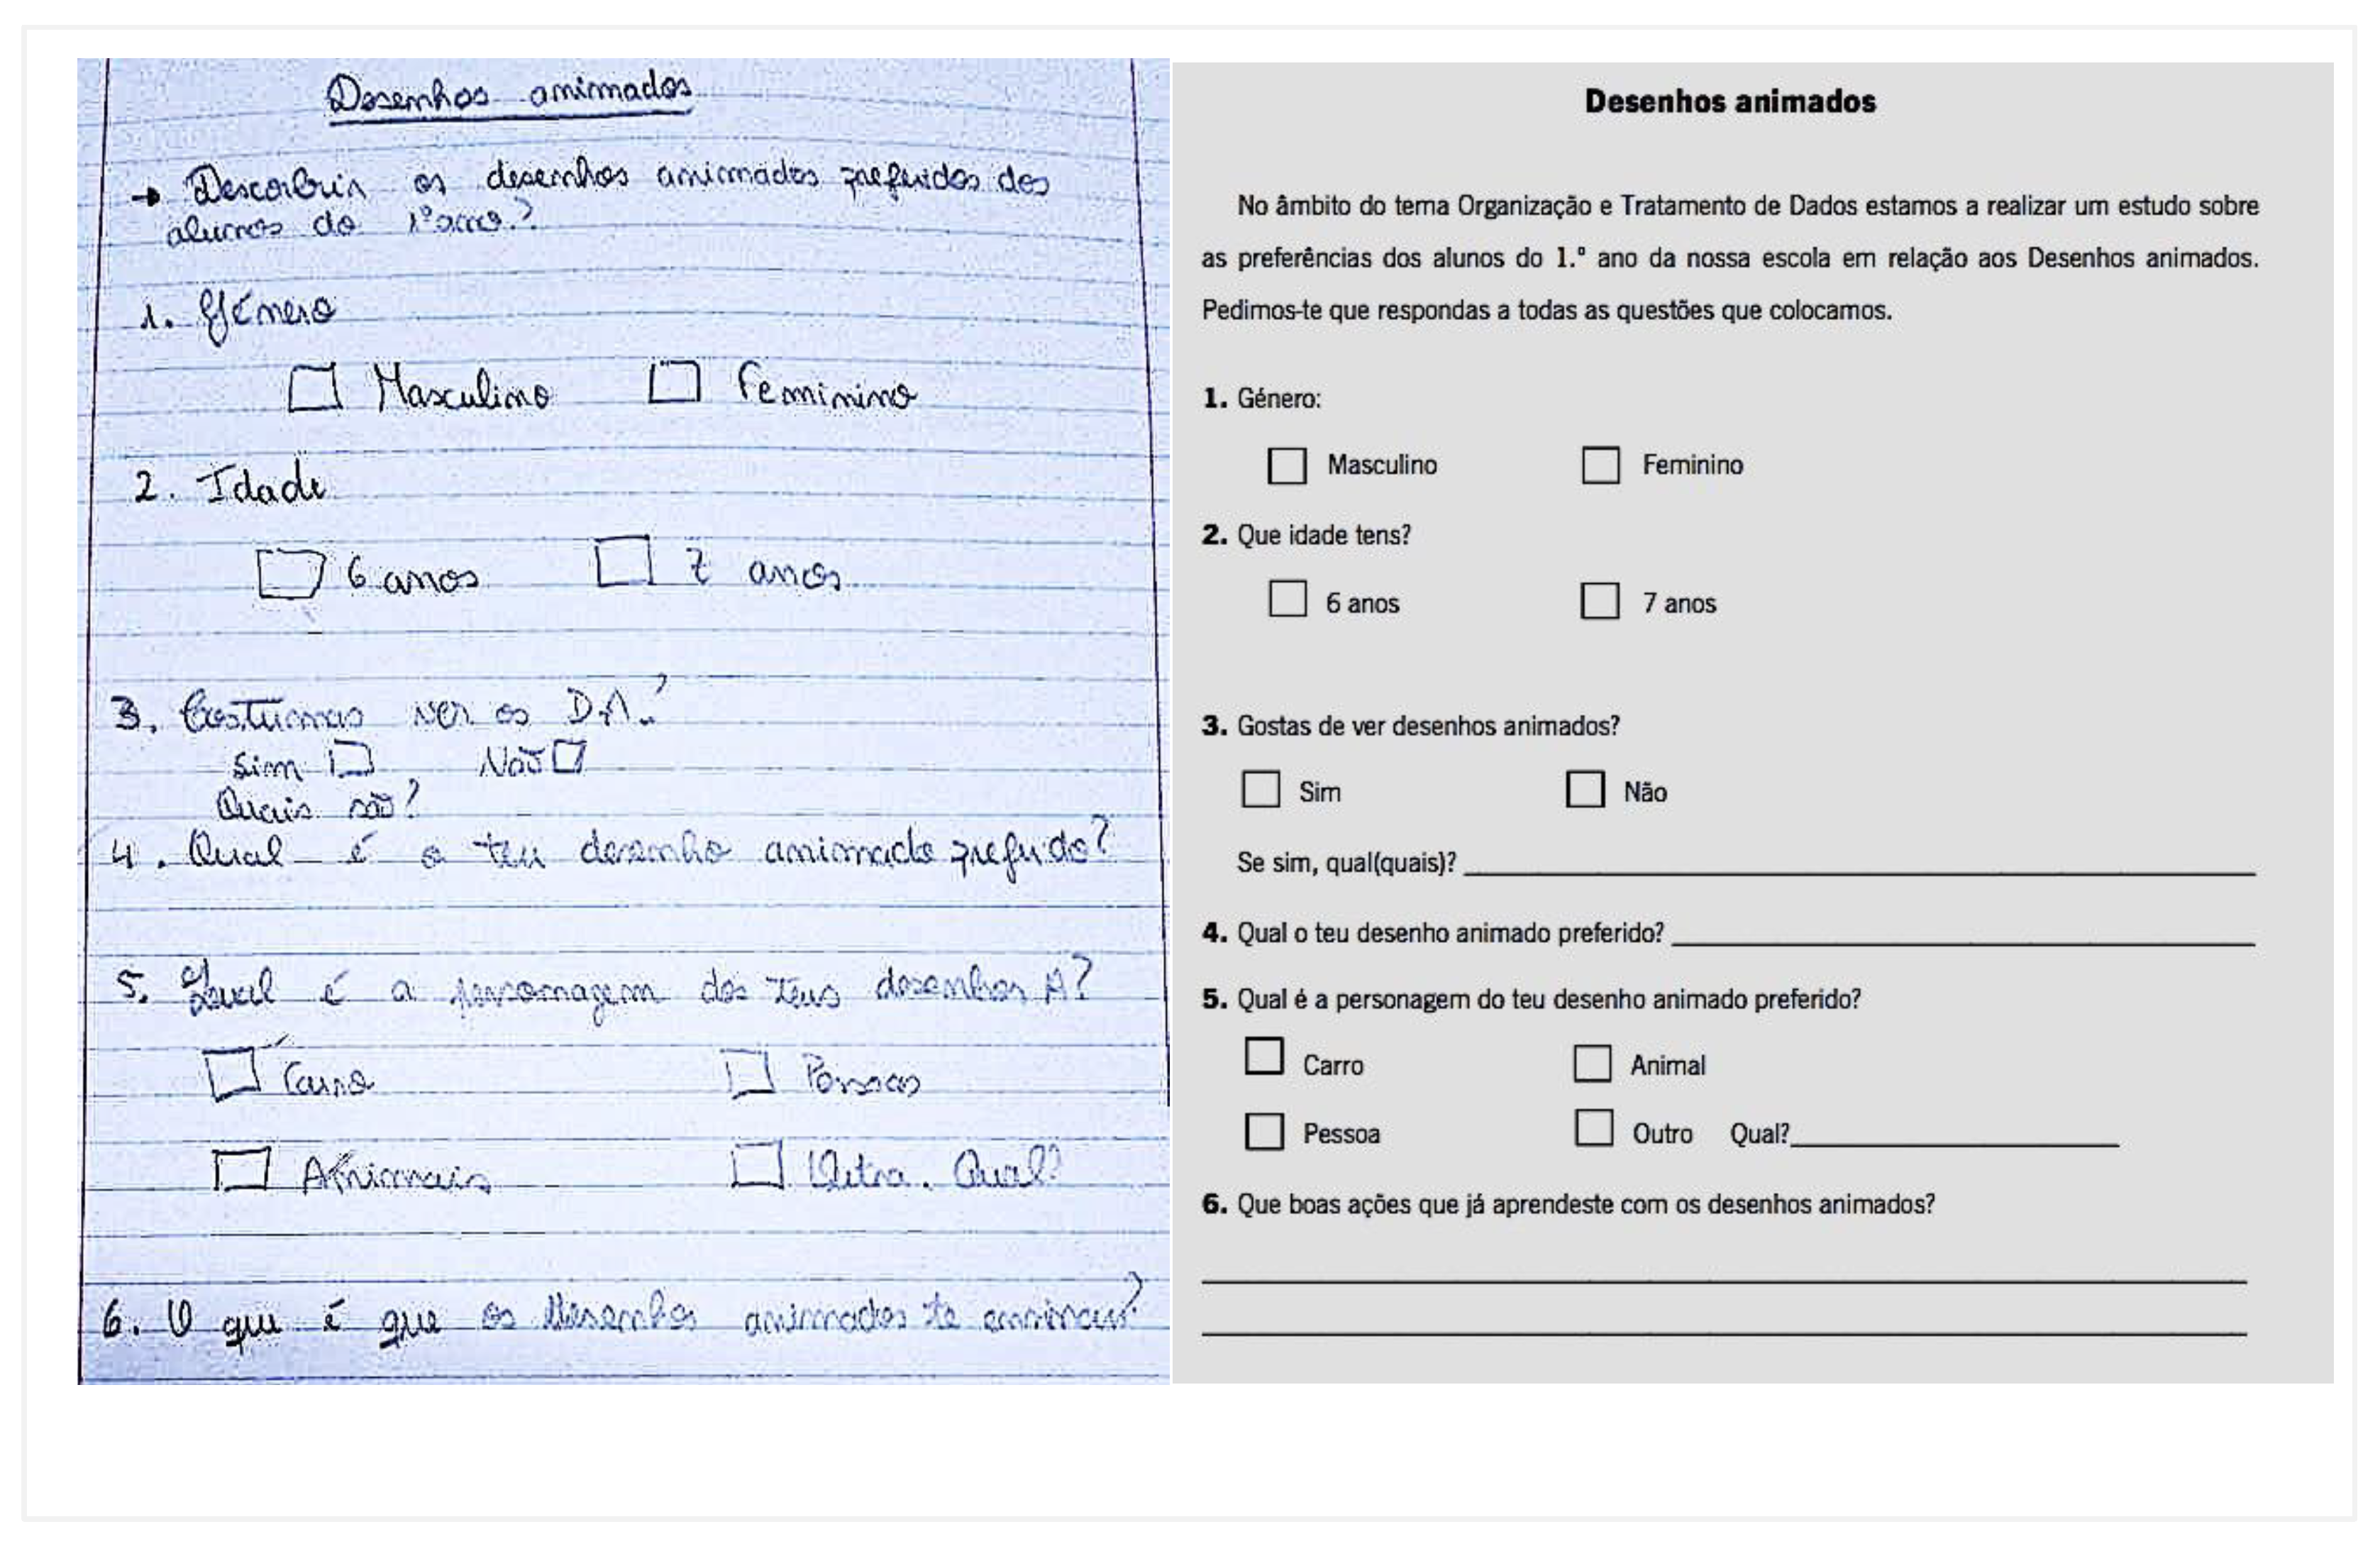
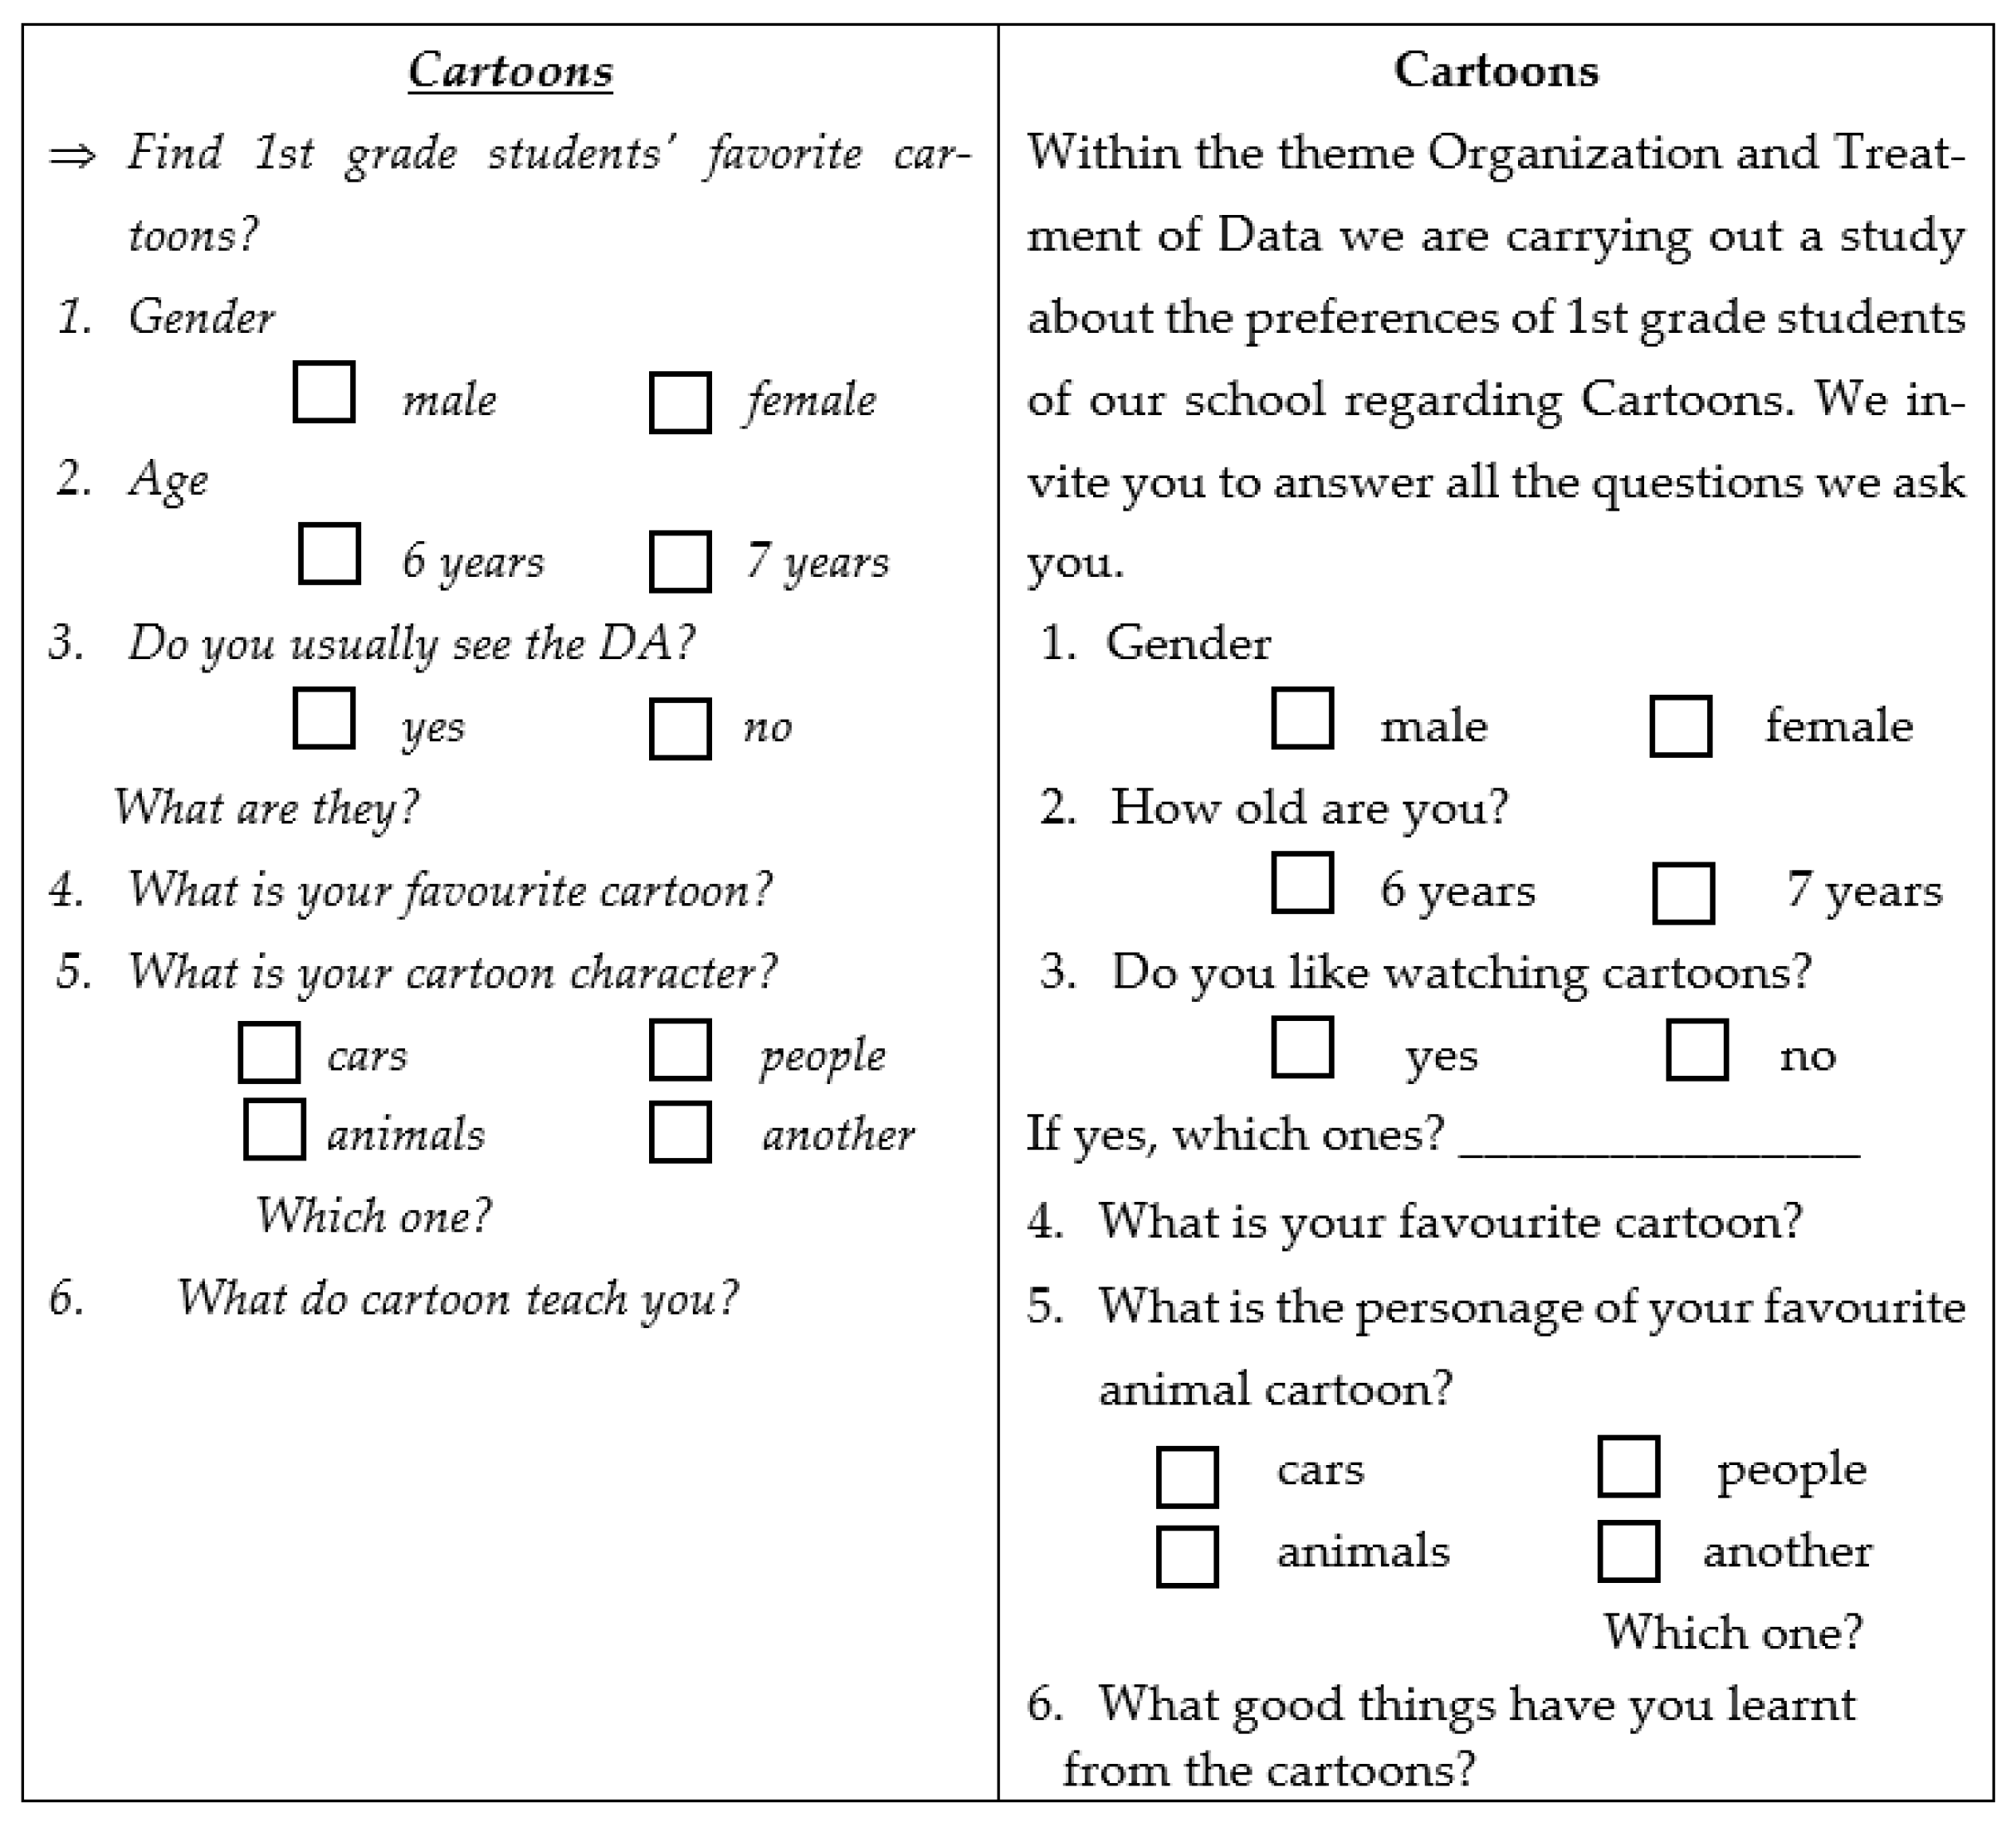
The third stage of the investigative cycle was carried out through a questionnaire survey designed by each group. Figure 3 illustrates the work performed by group G2 and the respective correction made by the teacher (translate by the authors). The original texts can be found in Appendix B.
The analysis of the questionnaire allows us to conclude that the group was able to formulate questions, the first relating to the identification of the respondents and the others to the theme chosen for the investigation. In general, all groups were able to formulate questions around their theme for the data collection. G4 was the only group that initially showed difficulties, but with guidance from the teacher they managed to overcome.
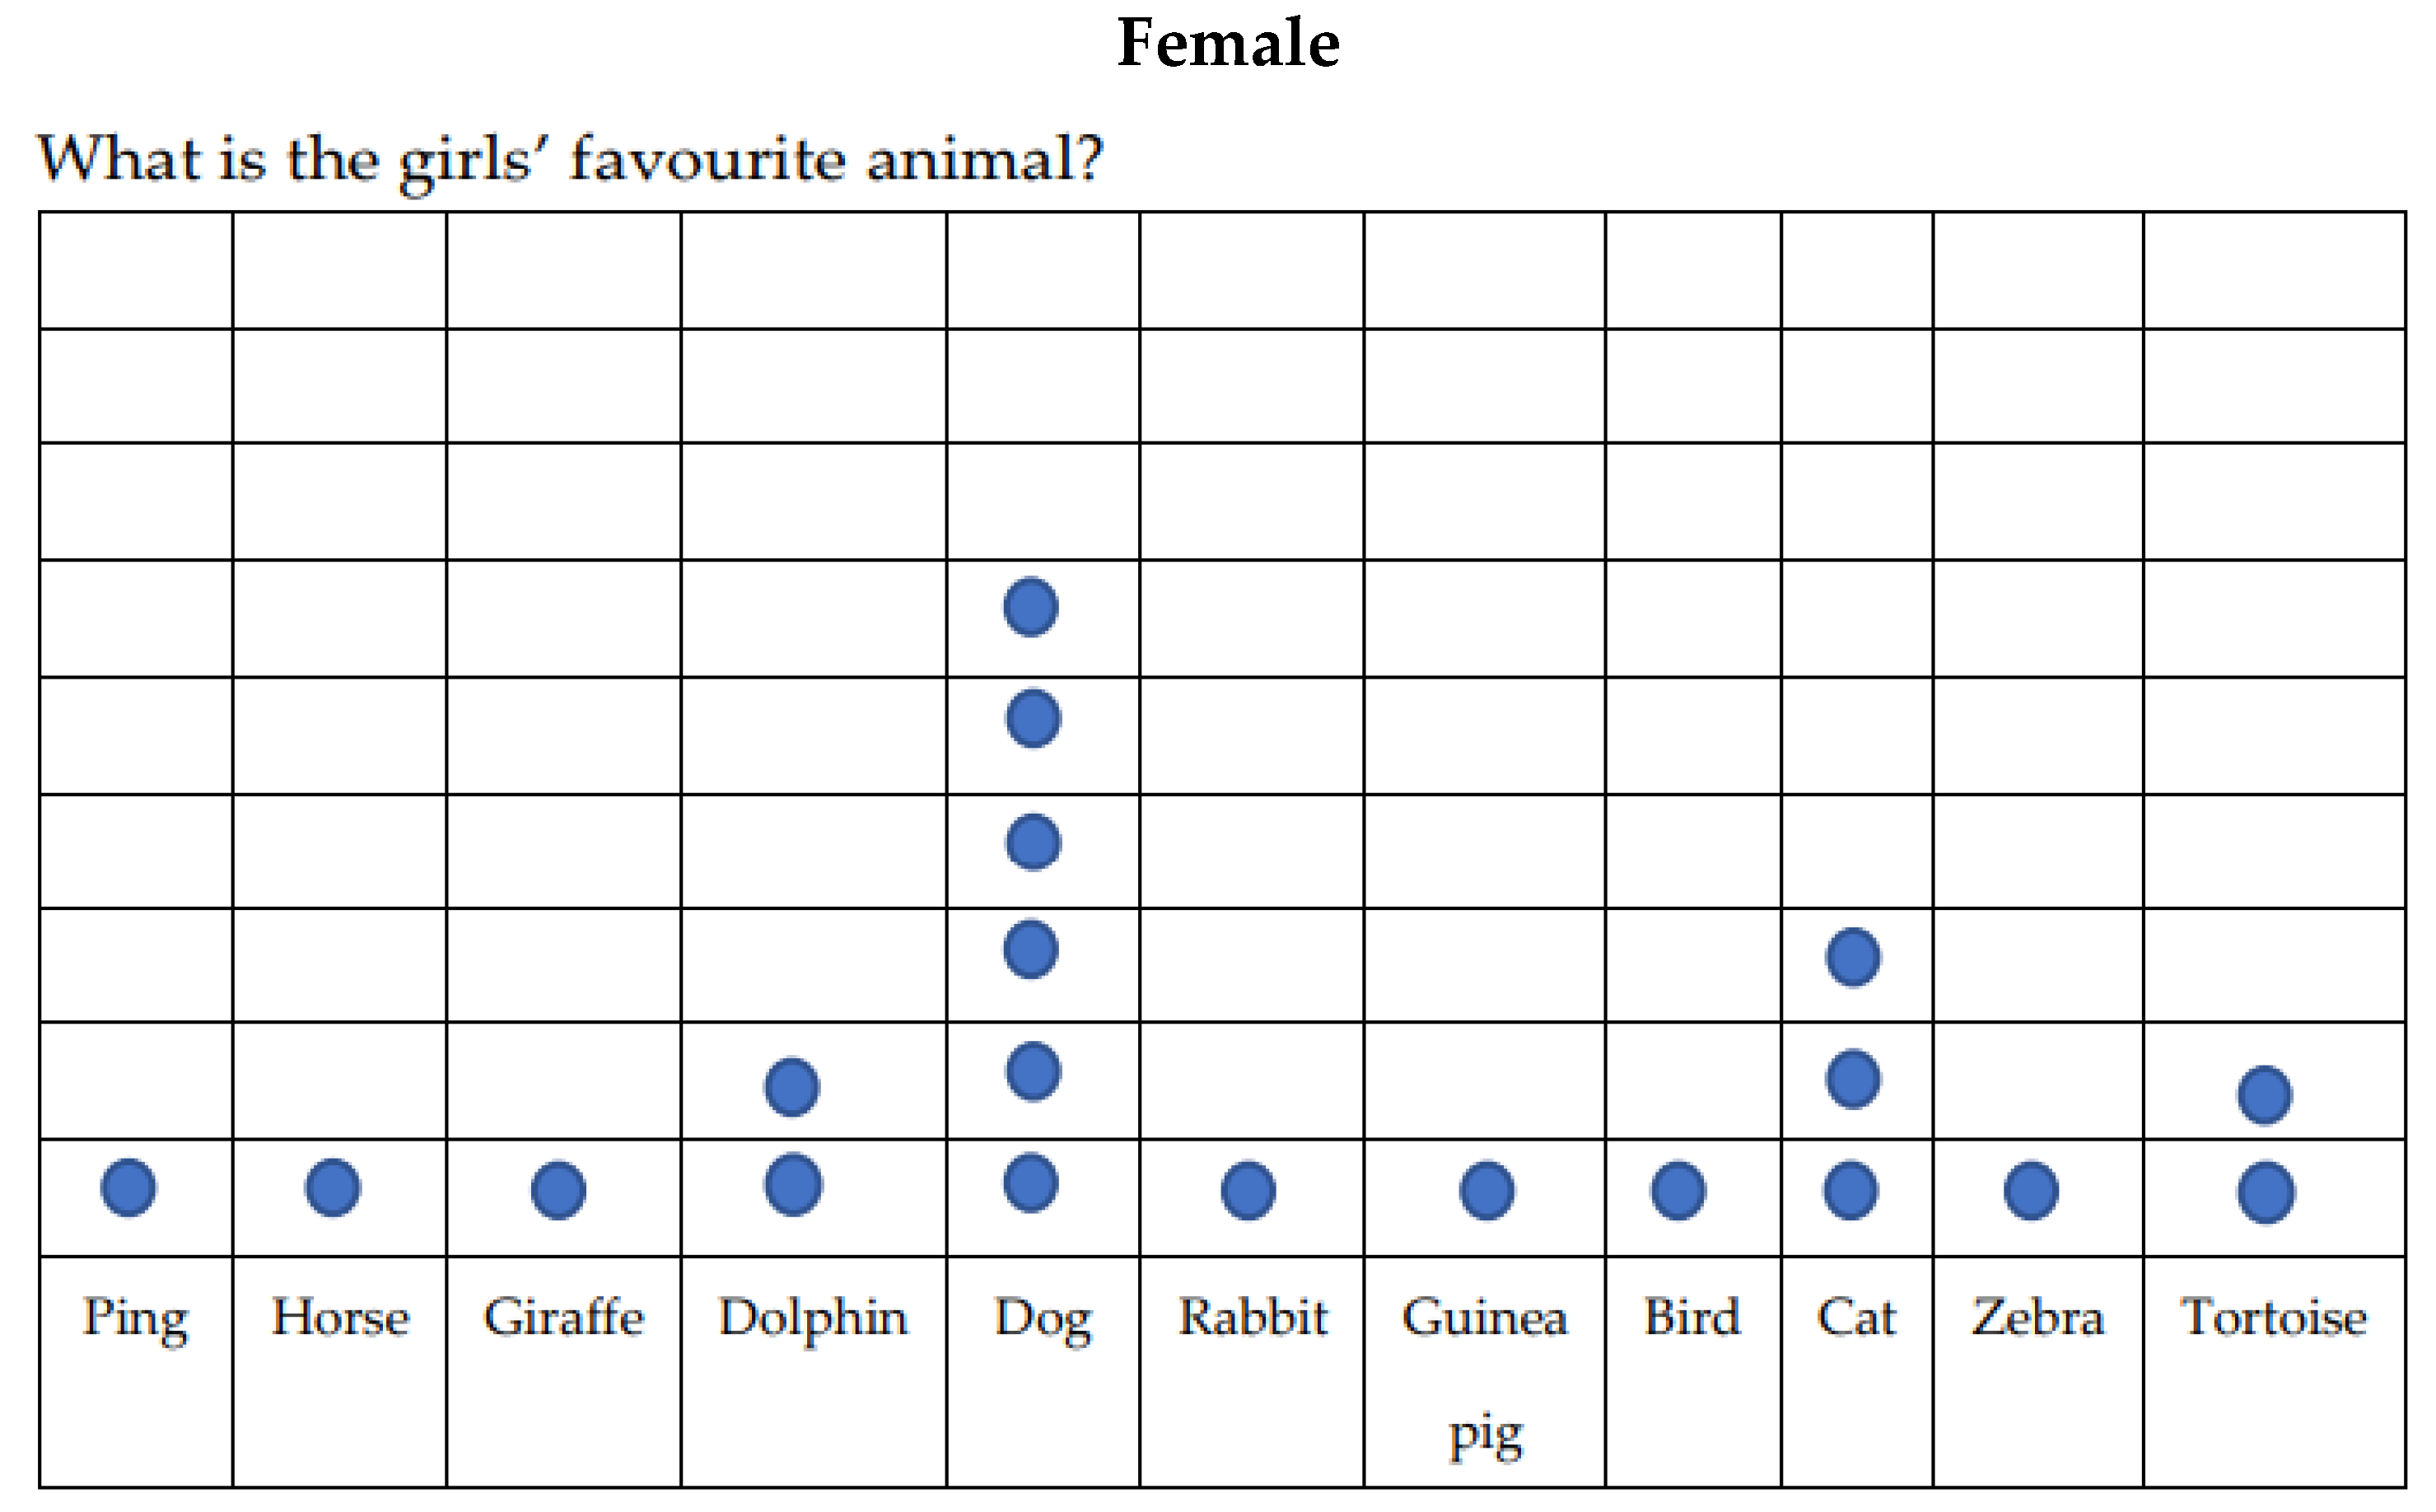
After the data were collected with the questionnaire, the next step was to organize it using the dot plot. Figure 4 (translate by the authors) presents the data organization elaborated by G1 about the favourite animal by the girls. The original graphic can be found in Appendix C.
In terms of data organisation strategies, most groups showed care in the construction and presentation of graphs. The groups showed no difficulties in organising and processing the data collected. These aspects were evidenced by written records produced by the students in groups, the final products (posters), and also from the reflections of the teacher that implemented the experience.

4.1.4. Stage 4: Data Analysis

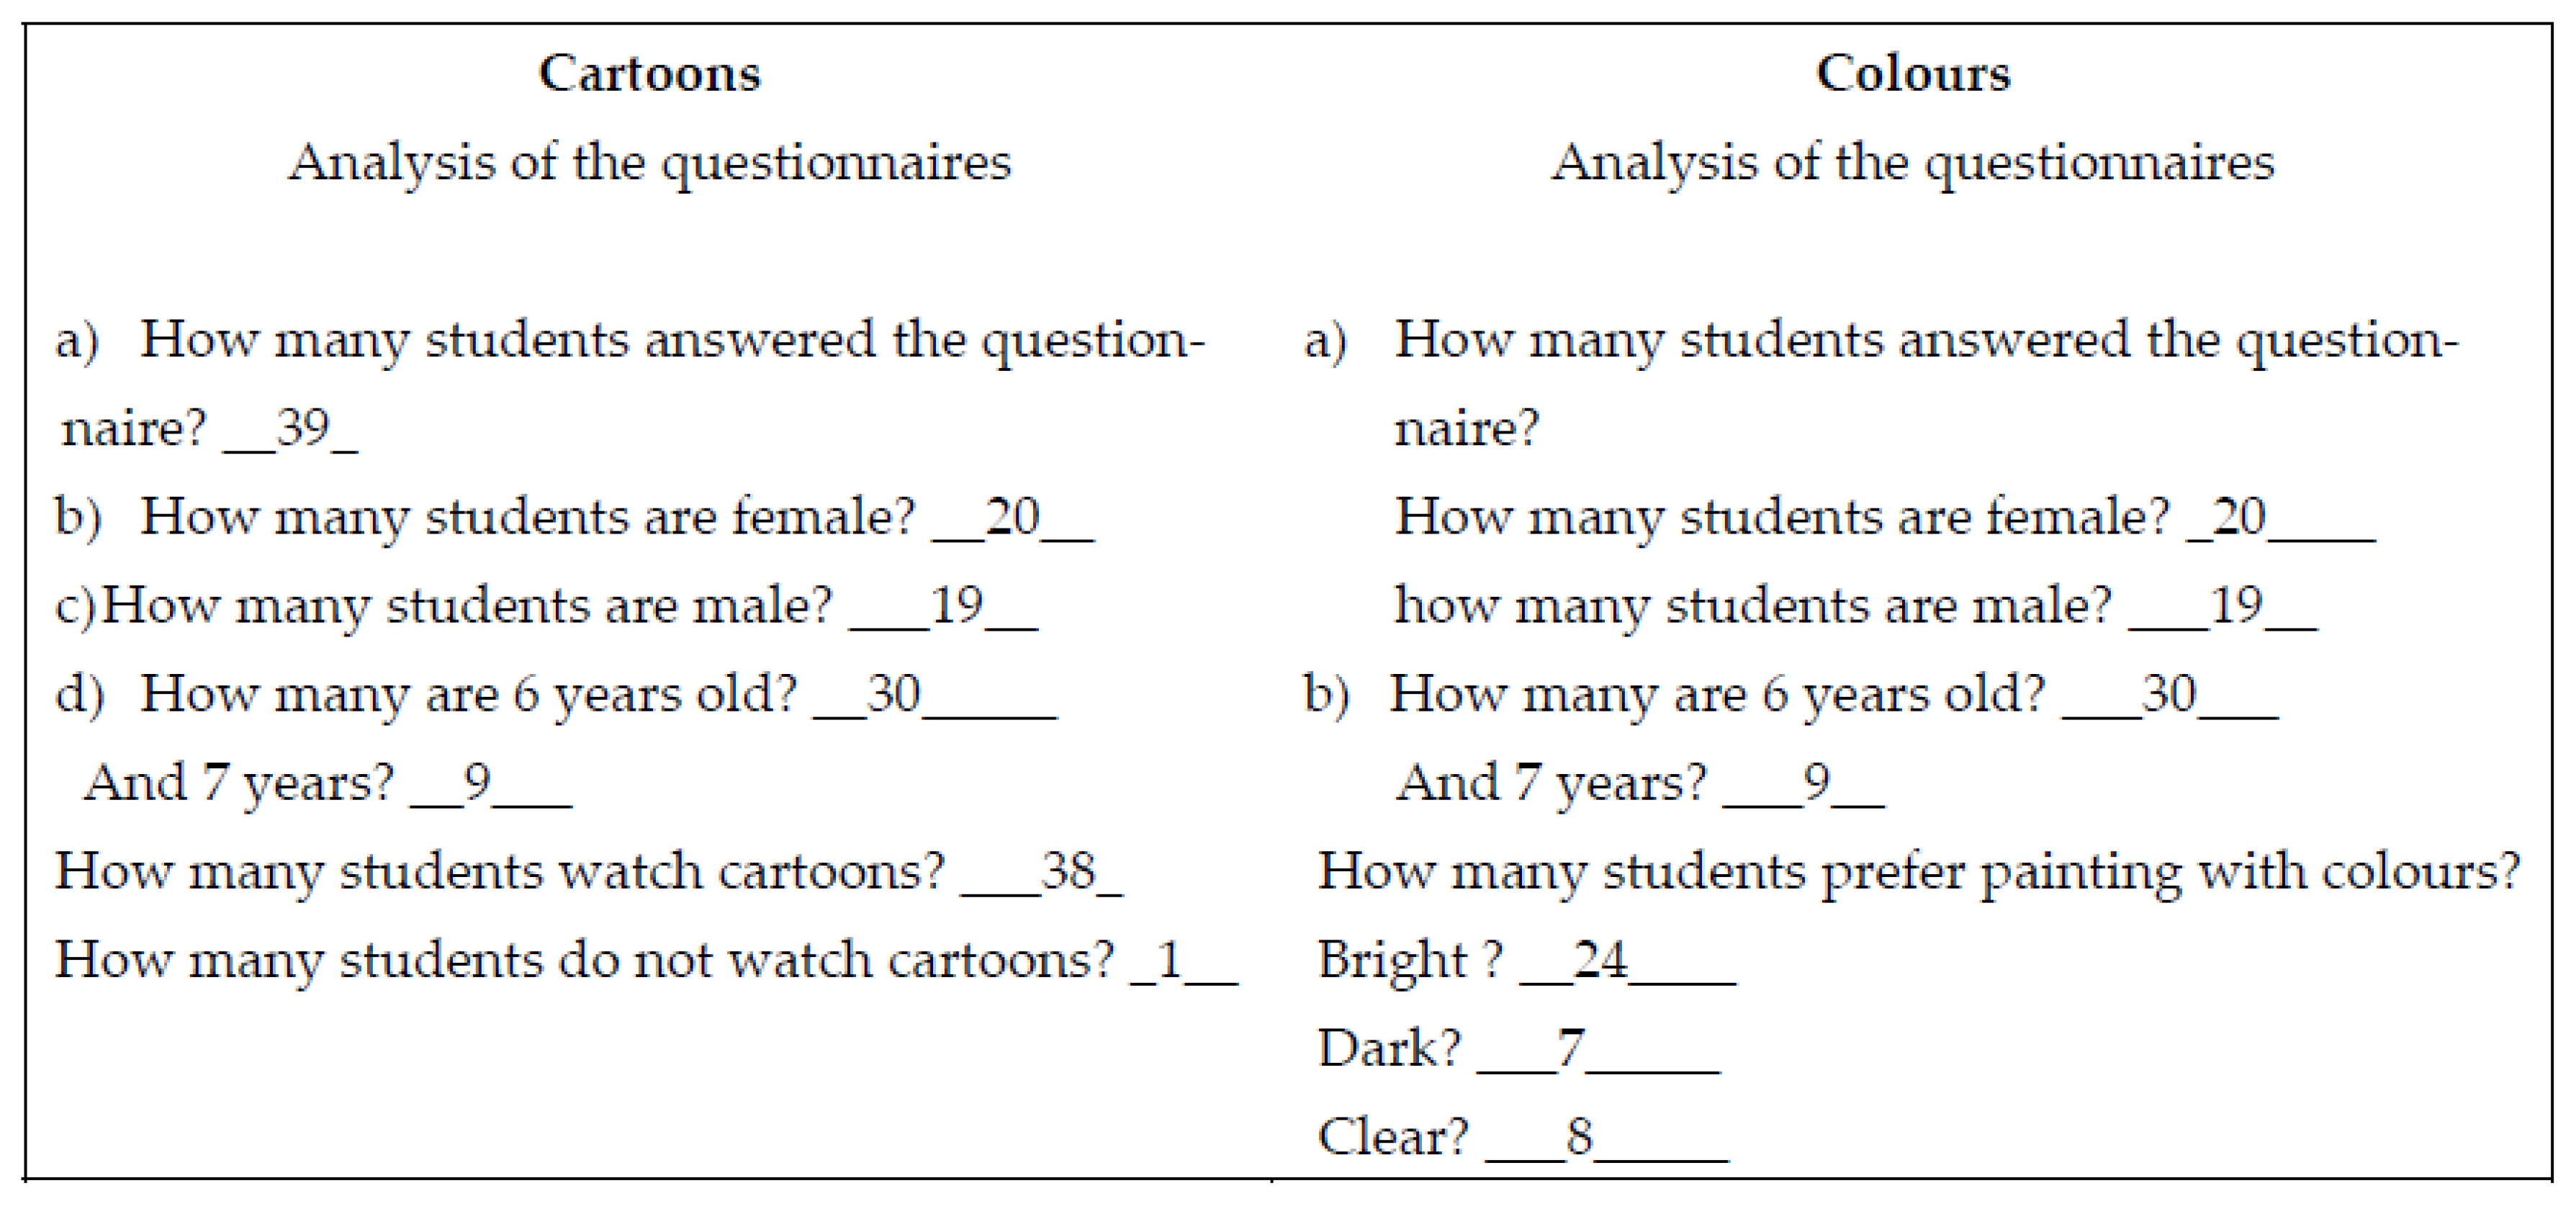
The fourth stage involved exploration and analysis of the data. In analysing the graphs, most students simply read the data. However, later, in dialogue with each of the groups, the students showed that they were able to read between the data, interpreting and comparing the quantities of each category described in the graph [33]. Figure 5 shows the analysis of questionnaires performed by Groups G2 and G4 (translated by the authors). The original texts can be found in Appendix D.
All four groups showed no difficulties in answering the questions meant to help with the data analysis, as illustrated by the examples in Figure 5. In this analysis, most students stayed at level one, reading the data [33]. Since the students had already shown the ability to reach the second level, the teacher guided them to analyse the graphs of each of the groups to help them analyse the data better and thus be able to read between the data [33]. At this point, both G1 and G3 were capable of performing more autonomous work, and it was at this stage that “a greater mismatch of the pace of the groups and the work done” was observed (RA5).

4.1.5. Stage 5: Conclusion

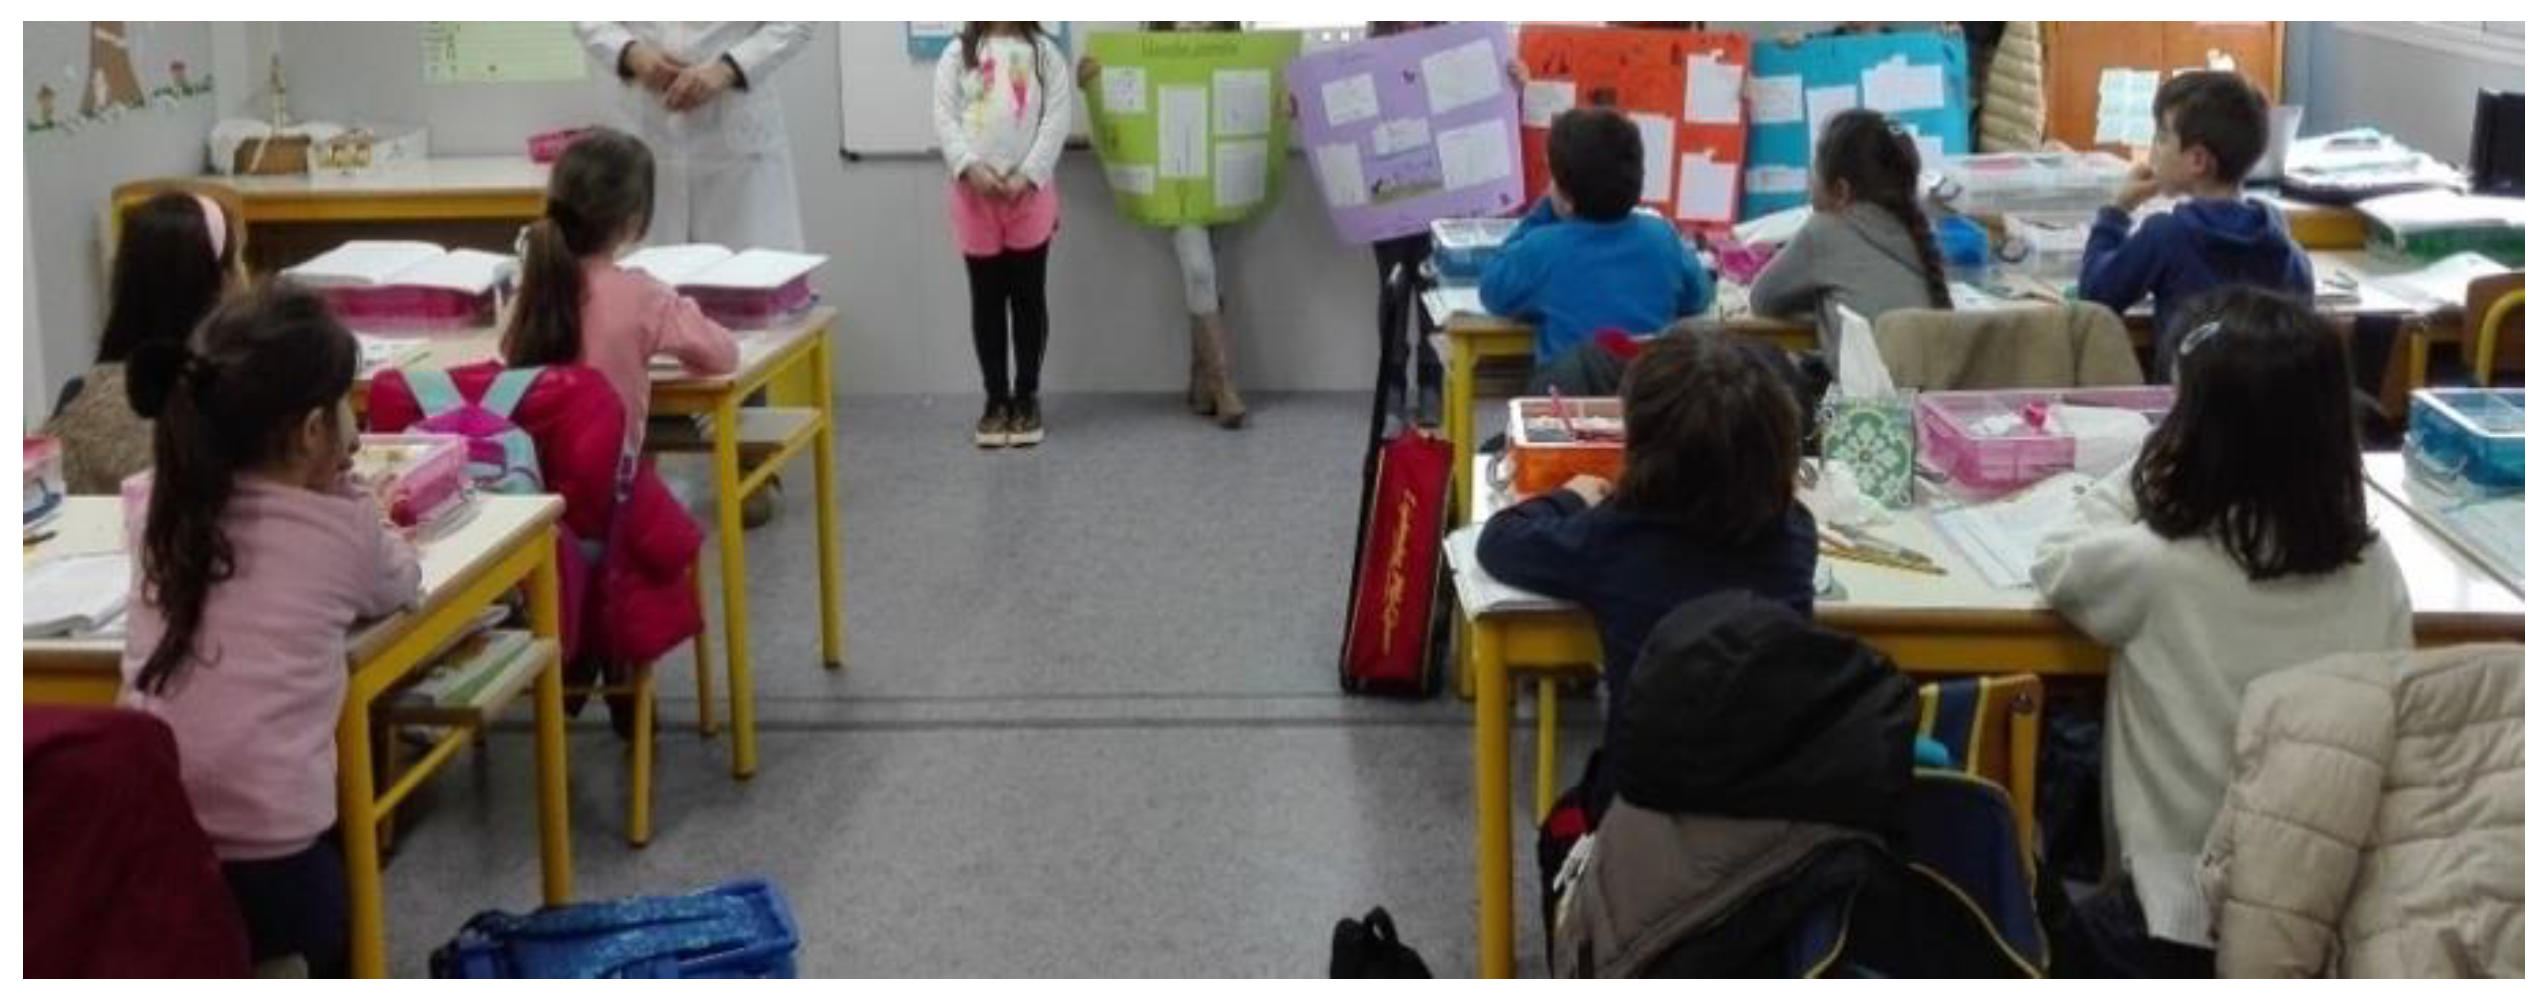
In the final stage, students were expected to interpret and conclude the problem under study, taking into account the data collected [41]. Thus, it was proposed that each group record their conclusions from the analysis of the graphs in a poster which would serve both as a support for presenting the research and as an assessment instrument, specifically a simplified investigation report given their writing limitations. As most of the students did not yet write very well, the conclusions were recorded on the poster through illustrations that the students made in order to involve them actively in the work. In presenting the conclusions drawn from the analysis and interpretation of the dot-graphs constructed about the preferences of students, none of the groups had any difficulties. This was followed by a presentation to the class of the work done by each group, as exemplified in Figure 6.
The conclusions presented by the groups covered mainly issues concerning the students’ preferences, as shown in the drawing on the poster of the favourite animal.

4.2. Presentation of the Investigative Activity

The final moment of the investigative activity consisted of the presentation of the results obtained by each group to the whole class. For this purpose, the groups were asked to elect a spokesperson to present the work carried out. The final presentation thus constituted a moment when students were proficient interlocutors about the activities performed, which will have implications in their learning [47]. Figure 7 illustrates the presentation of the work to the class by the group spokespersons.
During the presentation, students’ attention was visibly focused on the conclusions of each theme, and it was perceptible that “they did not expect that these results would come from the questionnaires they answered” (RA5), this moment being essential to “understand and evaluate the learning of the students” (RA5).

4.3. Evaluation of the Learning Experience

To evaluate the teaching strategies implemented, we compared the students’ results in a test at two different moments, before the learning experience (pre-test) and after (post-test)—Appendix A. The interpretations needed to answer the test questions required students to have Curcio’s level one and two comprehension skills [33], namely reading the data and reading between the data.
The first question of the test referred to the organization of data presented in an image, which gave rise to the preparation of a dot plot (Appendix A). Table 1 shows the distribution of the students’ answers in both tests (pre and post).
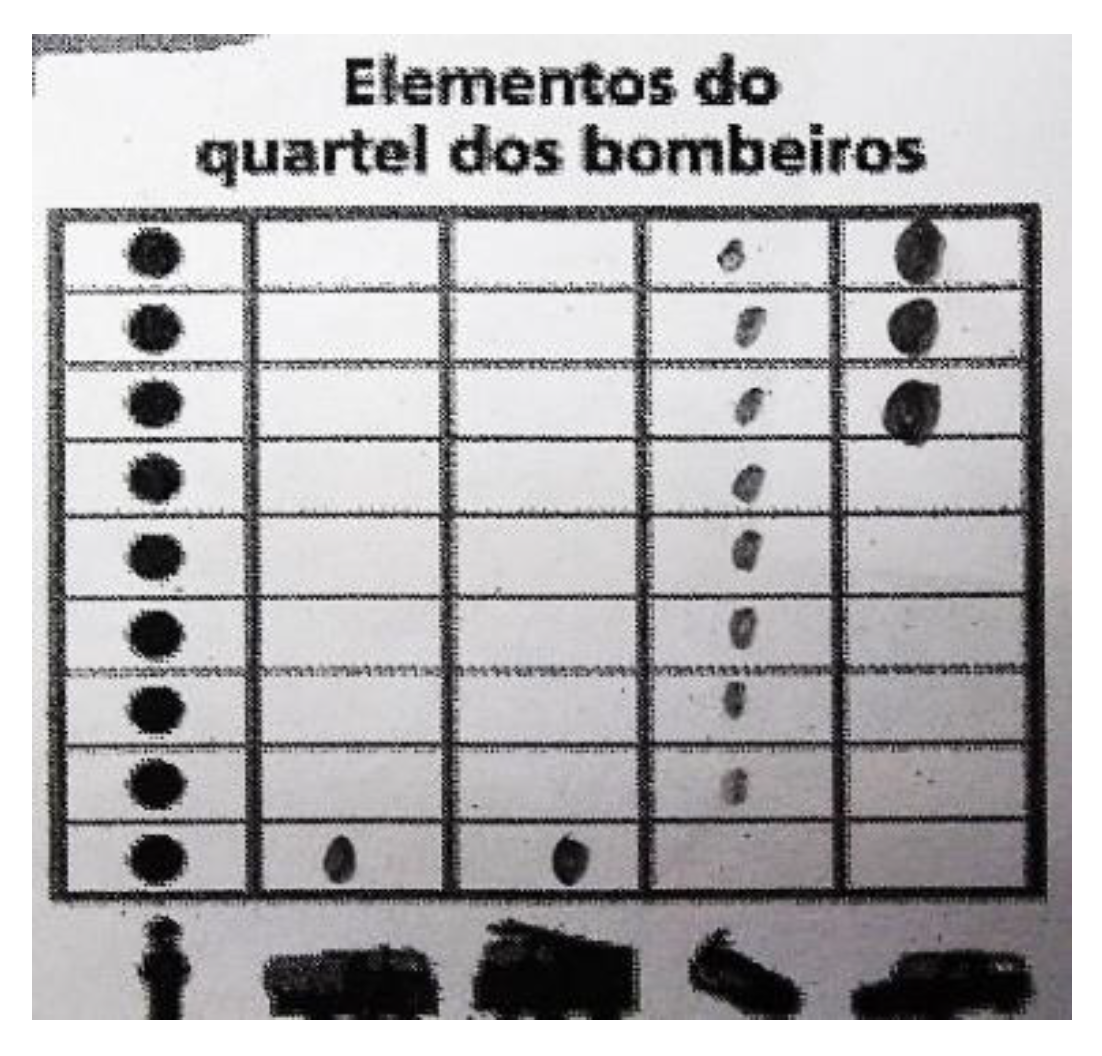
In the pre-test, when representing the data in the dot plot (Question 1), most students had difficulties (85%), which was expected since they had never acquired knowledge in this domain, but 15% of the students were already able to do it correctly. Figure 8 illustrates two of the most common mistakes made by students in the pre-test: not correctly counting the number of elements of the same category and not agreeing on an order of presentation of the results.
At the end of the learning experience, in the post-test, most students represented the data in the dot plot correctly (Figure 9).
In the question 1.4 about mode, in the pre-test two of the students understood what was meant by mode and answered correctly. In the post-test, all students answered this question correctly.
In the remaining questions related to the interpretation of the dot plot, students also showed progress from pre-test to post-test. This progress reflects the acquisition of knowledge by the students, given that when they took the pre-test they had entered basic education a little over three months before.
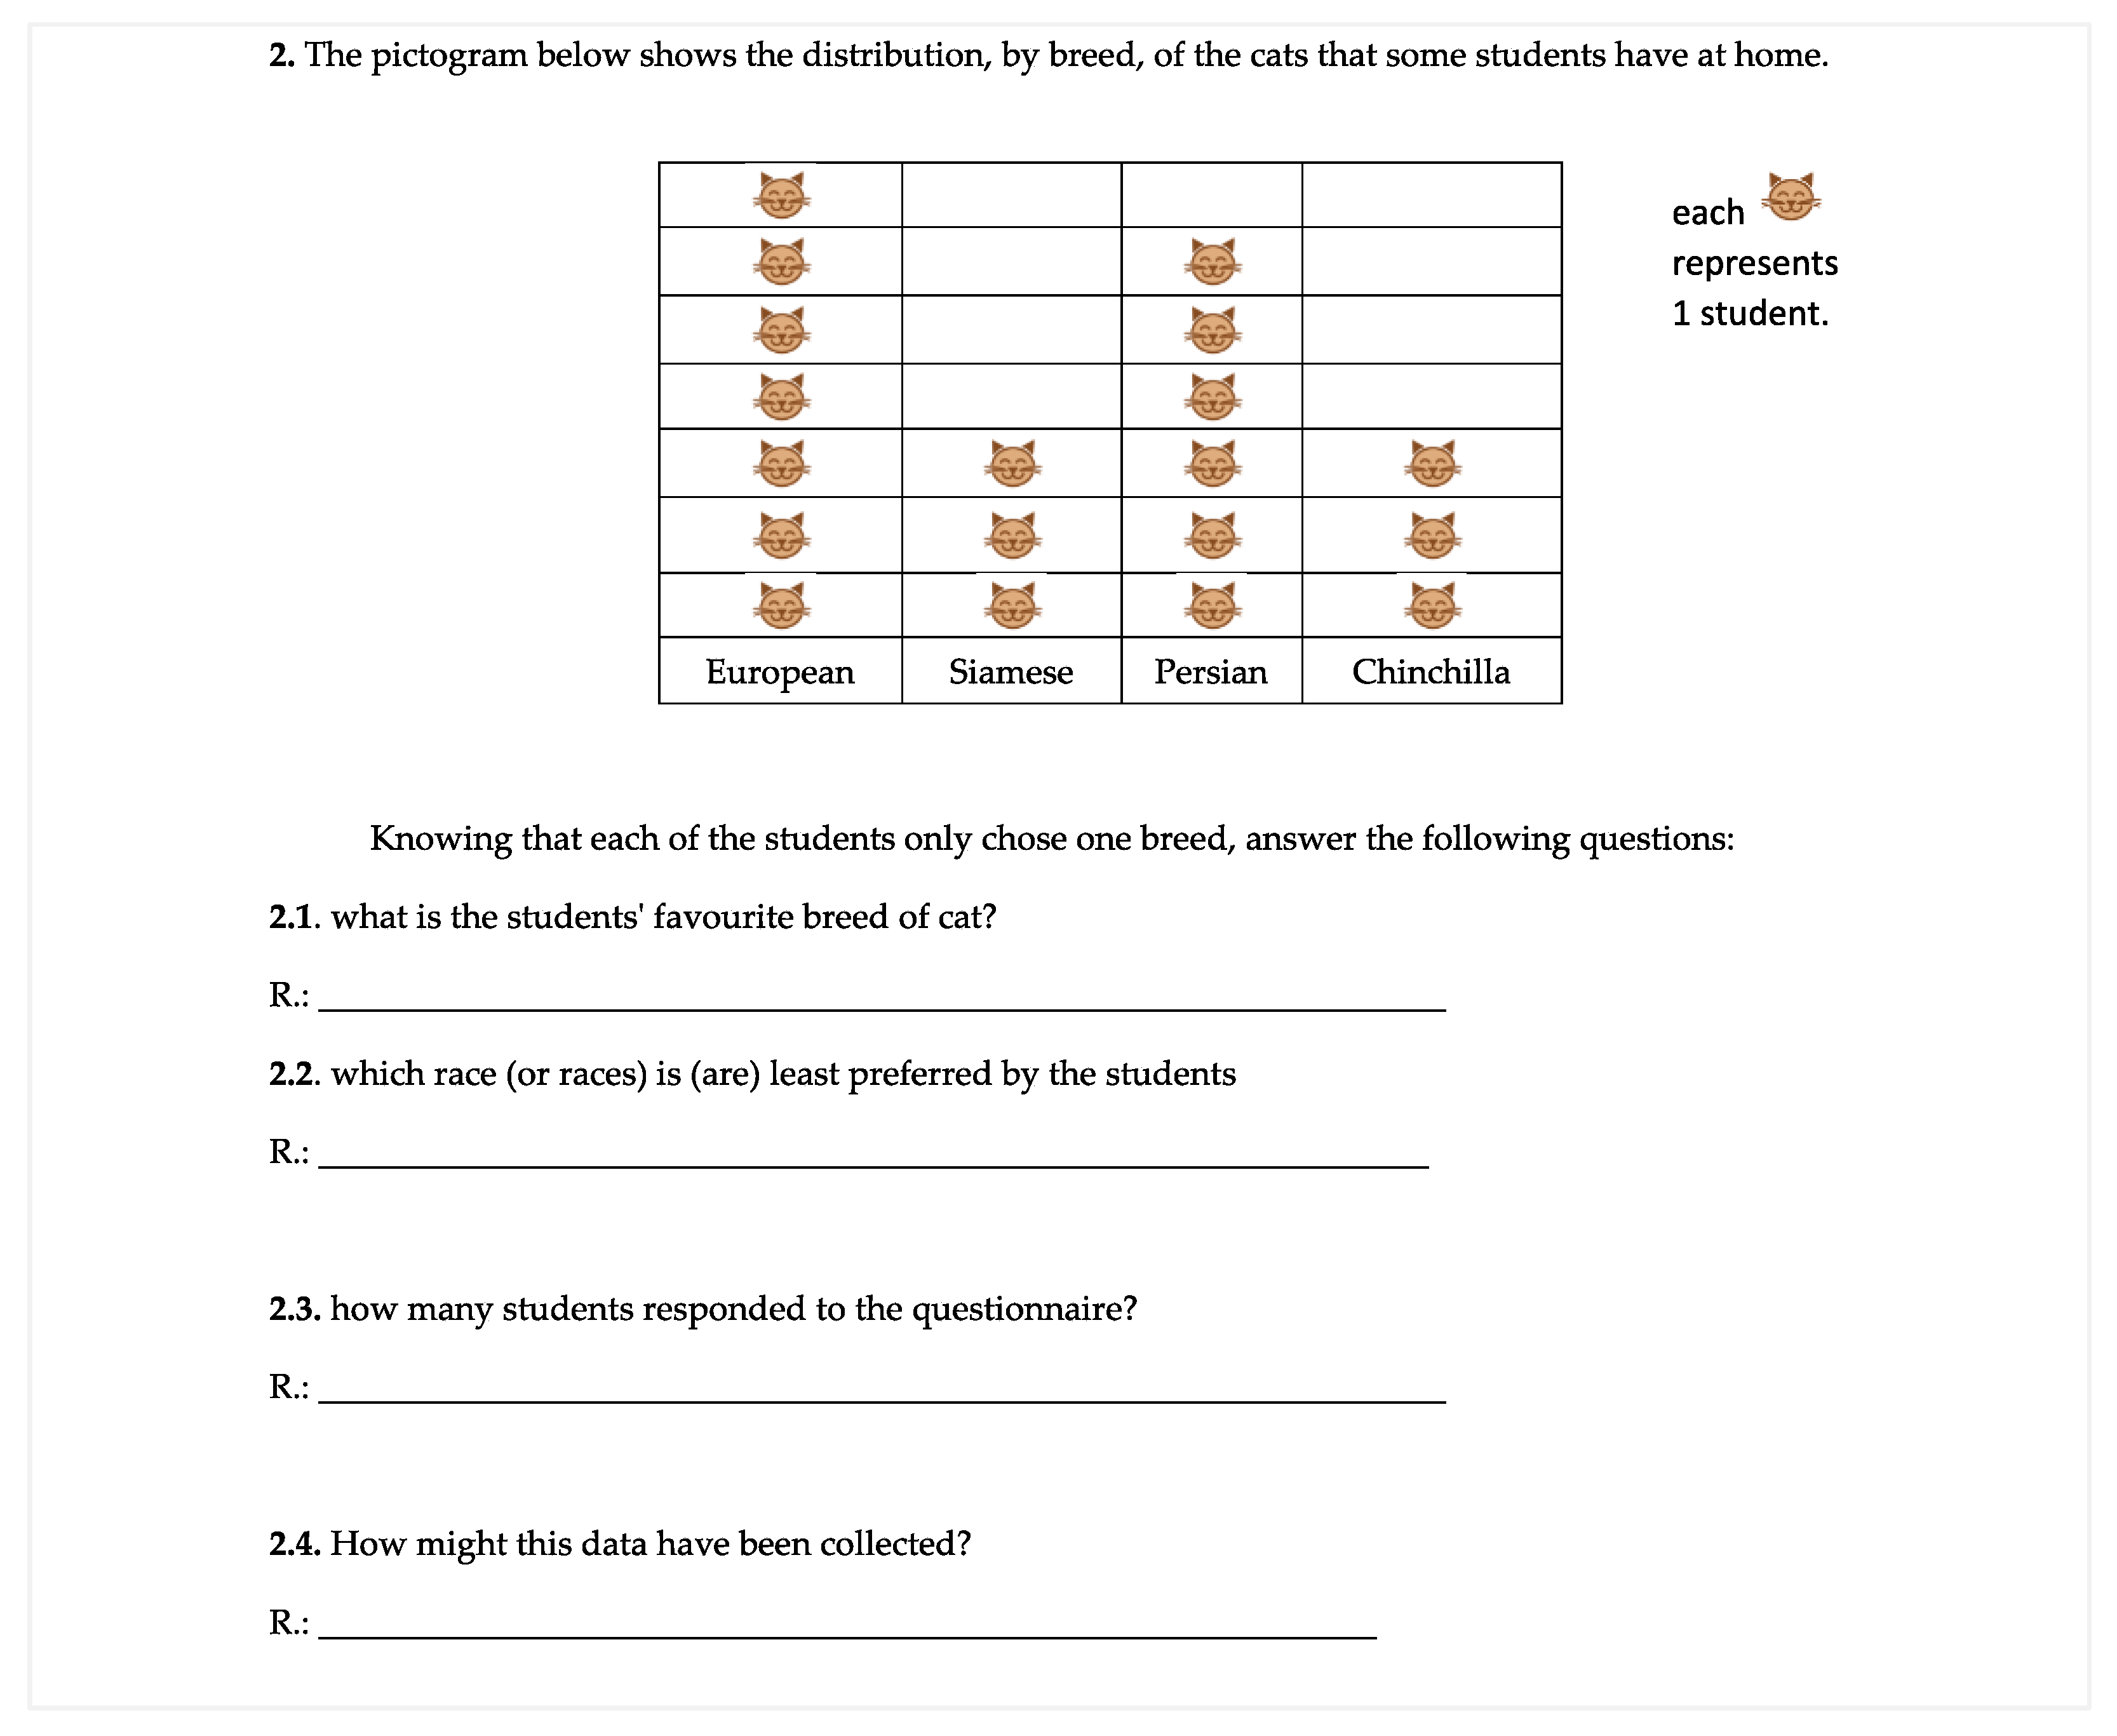
In Table 2 we present the results of the students’ answers to question 2, which consisted of four items, where a pictogram was shown concerning the distribution by breed of the cats that some students have at home.
In the interpretations concerning the pictogram, students were fast in reading the data and between the data [33]. In the pre-test, students revealed difficulty in identifying categories with the same quantity. In addition, students could not understand how to determine the number of students who responded to the survey (Question 2.3), with only 10% of students answering correctly. In the last question (2.4), students were initially unaware of the strategies of data collection, as 85% did not answer and the rest answered incorrectly. In the post-test, these difficulties were overcome.

5. Conclusions

In carrying out investigative activities, students first defined the problem to be investigated. In the design of the problem, students chose themes studied in the elementary school subject Environmental Studies. This result highlights the relevance of interdisciplinarity in students’ learning activities, giving meaning to what they learn in the subjects of their school curriculum. This was evidenced in this study in the communication to the class of the work done in groups [47]. In the definition of the plan stage, the teacher’s guidance emerged as the students were not familiar with this type of activity. Nonetheless, the students did collect and organise the data. In the data analysis stage, students were able to explore and analyse the data, but needed guidance to read the data and between the data, levels of understanding of graphs identified by Curcio [33]. In the conclusions, the students were able to interpret their data representations, formulating conclusions which however were poorly argued due to the limitations of their verbal and statistical skills. The execution of the investigative activity by the students indicated that, despite students’ limitations and the fact that they were still unable to attend to some processes inherent to the investigative cycle, they developed skills that allowed them to collect, organise, process, and interpret data.
In general, the work carried out by the groups was different, with some groups revealing more difficulties than others at certain moments, which were overcome with individual support given to the groups. Students felt most fragile in defining the research questions and analysing the data. The students showed they were able to formulate conclusions in light of the data, even if in some groups they were poorly developed. Such results were also found in the studies conducted by Sousa [20] and [48], in which the students also denoted some weaknesses in their implementation due to their lack of familiarity with the methodology, which requires frequent recourse to these practices to have more evident results. It should also be noted that the investigative activities carried out allowed all students, in particular the students with classifications of ‘Sufficient’ and ‘Insufficient’ in Mathematics, to be able to engage in the activities, as previously found in the study conducted by Dias et al. [13].
Some difficulties appeared when carrying out the investigative activity, which can be said to be a consequence of the students’ first experience with this type of activity. Students showed difficulties in defining the questions to be included in the questionnaire survey, as also observed in the study by Burgess [42] and Ponte [49]. Students also experienced difficulties in the data exploration and conclusions stages, requiring orientation from the teacher, which is reported by Andrade [50] in her study with primary school students. According to Fernandes et al. [51], some of the difficulties in students’ work with investigative activities result from the characteristics of this methodology, which needs to become familiar to students, requiring persistence and dedication from them and the teachers.
Students experienced difficulties in the construction, analysis, and interpretation of strategies for the organization and representation of data and statistical measures, which led them to make certain errors, as highlighted by Martins et al. [52]. This was especially so in the data processing and analysis, where the need for statistical knowledge is more evident, and in the performance of the test. The mistakes made by first grade students relate to the organization and representation of data, particularly in the construction of dot plots graphs. It is important to note that students were able to identify the mode of a data set, although it is a statistical concept that is only studied in the 5th grade [1].
Empirical studies show difficulties in students’ learning, and the results of international studies report errors and difficulties “both in the conceptual field and in computational aspects” [21] (p. 11). For example, the studies by Andrade [50] and Carvalho [53] point out data analysis and interpretation as the students’ main difficulty. Santos [11] and Vieira [48] add difficulties experienced in the construction of graphical representations and in understanding concepts related to statistical measures, drawing both from their own studies and other research.
The conclusions presented about the learning of statistics topics through investigative activities confirm that this methodology is an important strategy to be used, since students become both producers and consumers of statistical information [54]. Younger students, with their age limitations, are able to develop statistical investigative activities, requiring only some logistical support and playful situations to remain involved to learn. Finally, it should be noted that the investigative activities carried out in this study challenged students to become actively involved in the construction of their own learning in the area of statistics. Thus, this is an option that teachers should consider for their teaching practices, even with students at the most elementary levels.
This research work involved the following limitations: The context was the practice component of pre-service teachers, with time limitations on pedagogical actions. The pedagogical actions developed in the learning experience took place in only five lessons. These actions focused on students’ activity in learning statistics and appealing to their experiences, instead of teaching strategies that value the transmission of content. The implications in terms of metacognition, motivation, and language skills and their impact in learning statistics should also be studied in future work.

Author Contributions

Conceptualization, A.C.S., F.V., A.P.A. and T.B.N.; methodology, A.C.S., and F.V.; formal analysis, A.C.S., F.V., A.P.A. and T.B.N.; investigation, A.C.S., and F.V.; writing-original draft preparation, A.C.S. and F.V.; writing-review and editing, F.V., A.P.A. and T.B.N.; supervision, F.V., A.P.A. and T.B.N.; funding acquisition, F.V., A.P.A. and T.B.N.; All authors have read and agreed to the published version of the manuscript.

Funding

This work was financially supported by National Funds through FCT - Fundação para a Ciência e a Tecnologia, I.P., under the project UIDB/00194/2020.

Institutional Review Board Statement

Ethical review and approval were waived for this study, due to data protection being assured by following the institutional protocol in place that regulates the practice component of PST training, including data collection procedures.

Informed Consent Statement

Informed consent was obtained from all participants by a form that was delivered to children’s legal guardians.

Conflicts of Interest

The authors declare no conflict of interest.

Appendix A

Education 12 00665 g0a1aEducation 12 00665 g0a1b

Appendix B

Education 12 00665 g0a2

Appendix C

Education 12 00665 g0a3

Appendix D

Education 12 00665 g0a4

References

  1. Ministério da Educação e Ciência [MEC]. Aprendizagens Essenciais de Matemática para o Ensino Básico; Ministério de Educação e Ciência: Lisboa, Portugal, 2018. [Google Scholar]
  2. Abrantes, P.; Serrazina, L.; Oliveira, I. A Matemática na Educação Básica; Ministério da Educação, Direcção-Geral de Inovação e Desenvolvimento Curricular: Lisboa, Portugal, 1999; ISBN 9727421237. [Google Scholar]
  3. Batanero, C. Didáctica de la Estadística; Departamento de Didáctica de la Matemática, Universidad de Granada: Granada, Spain, 2001; ISBN 84-699-4295-6. [Google Scholar]
  4. Batanero, C.; Los Retos de la Cultura Estadística. Jornadas Interamericanas de Enseñanza de la Estadística. Buenos Aires: Conferência Inaugural. 2002. Available online: https://www.ugr.es/~batanero/pages/ARTICULOS/CULTURA.pdf (accessed on 10 July 2022).
  5. Ponte, J.P.; Noll, J. Building capacity in statistics teacher education. In The International Handbook of Research in Statistics Education; Springer International Handbooks of Education: Cham, Switzerland, 2017; pp. 433–455. ISBN 978-3-319-66193-3. [Google Scholar] [CrossRef]
  6. Martins, G.D.O.; Gomes, C.A.S.; Brocardo, J.; Pedroso, J.V.; Camilo, J.L.A.; Silva, L.M.U.; da Encarnacao, M.M.G.A.; Horta, M.J.d.V.C.; Calcada, M.T.C.S.; Nery, R.F.V.; et al. Perfil do Aluno à Saída da Escolaridade Obrigatória; Ministério de Educação e Ciência: Lisboa, Portugal, 2016; Available online: https://dge.mec.pt/sites/default/files/Curriculo/Projeto_Autonomia_e_Flexibilidade/perfil_dos_alunos.pdf (accessed on 5 July 2022).
  7. Ponte, J.P.; Serrazina, L. Didática da Matemática para o 1.º Ciclo do Ensino Básico; Universidade Aberta: Lisboa, Portugal, 2000. [Google Scholar]
  8. Ponte, J.P. Investigações Matemáticas e Investigações na Prática Profissional, 1st ed.; Editora Livraria da Física: Lisboa, Portugal, 2018; ISBN 9788578614881. [Google Scholar]
  9. Ponte, J.P. Gestão Curricular em Matemática; Associação dos Professores de Matemática: Lisboa, Portugal, 2005; pp. 11–34. ISBN 972-8768-16-8. [Google Scholar]
  10. Ponte, J.P.; Brocardo, J.; Oliveira, H. Investigações Matemáticas na Sala de Aula, 1st ed.; Autêntica: Belo Horizonte, Brasil, 2003. [Google Scholar]
  11. Santos, R.F.M. O Conhecimento de Estatística e da sua Didática de Futuros Professores. Ph.D. Thesis, Universidade de Lisboa, Lisboa, Portugal, 2015. [Google Scholar]
  12. Almeida, M.R. Imagens Sobre o Ensino e a Aprendizagem da Estatística; Instituto de Inovação Educacional: Lisboa, Portugal, 2002. [Google Scholar]
  13. Dias, E.; Viseu, F.; Cunha, M.C.; Martins, P.M. A natureza das tarefas e o envolvimento dos alunos nas atividades da aula de matemática. In Proceedings of the Atas do XII Congresso Internacional Galego-Português de Psicopedagogia, Braga, Portugal, 11–13 September 2013. [Google Scholar]
  14. Vara Pires, M. Investigações matemáticas: Aprender matemática com compreensão. Saber Educ. 2015, 20, 42–51. [Google Scholar] [CrossRef]
  15. MacGillivray, H.; Pereira-Mendoza, L. Teaching statistical thinking through investigative projects. In Teaching Statistics in School Mathematics—Challenges for Teaching and Teacher Education: A Joint ICMI/IASE Study: The 18th ICMI Study; Burrill, G., Reading, C., Batanero, C., Eds.; Springer: Berlin/Heidelberg, Germany, 2011; pp. 109–120. [Google Scholar]
  16. NCTM. Principles and Standards for School Mathematics; National Council of Teachers of Mathematics, Inc.: Reston, VA, USA, 2002; ISBN 0-87353-480-8. [Google Scholar]
  17. Gal, I. Understanding statistical literacy: About knowledge of contexts and models. In Proceedings of the Actas del Tercer Congreso Internacional Virtual de Educación Estadística (CIVEEST), Granada, Spain, 21–24 February 2019. [Google Scholar]
  18. Gould, R. Data literacy is statistical literacy. Stat. Educ. Res. J. 2017, 16, 22–25. [Google Scholar] [CrossRef]
  19. Fernandes, J.A.; Portela, J. Elementos de estatística descritiva—A folha de cálculo no estudo de estatística. In Elementos da Matemática para Professores do Ensino Básico; Palhares, P., Ed.; Lidel: Lisboa, Portugal, 2004; pp. 53–112. [Google Scholar]
  20. Sousa, O. Investigações estatísticas no 6.º ano. In Reflectir e Investigar Sobre a Prática Profissional; GTI, Ed.; Associação dos Professores de Matemática: Lisboa, Portugal, 2002; pp. 75–97. [Google Scholar]
  21. Martins, M.E.; Ponte, J.P. Organização e Tratamento de Dados; Ministério da Educação, Direcção-Geral de Inovação e Desenvolvimento Curricular: Lisboa, Portugal, 2010. [Google Scholar]
  22. Martins, M.E.G.; Loura, L.C.C.; Mendes, M.F. Análise de Dados: Texto de apoio Para Professores do 1.º ciclo; Ministério da Educação, Direcção-Geral de Inovação e Desenvolvimento Curricular: Lisboa, Portugal, 2007. [Google Scholar]
  23. Fernandes, J.A.; Carvalho, C.F.; Correia, P.F. Contributos para a Caracterização do Ensino da Estatística nas Escolas. Bolema 2011, 24, 585–606. Available online: https://www.periodicos.rc.biblioteca.unesp.br/index.php/bolema/article/view/5109 (accessed on 3 June 2022).
  24. Batanero, C.; Godino, J.D. Prespectivas de la esducación estadística como área de investigación. In Líneas de Investigacional en Didática de las Matemáticas; Luengo, R., Ed.; Universidad de Extremadura: Extremadura, Spain, 2005; pp. 203–226. [Google Scholar]
  25. Ponte, J.P.; Fonseca, H. Orientações curriculares para o ensino da estatística: Análise comparativa de três países. Quadrante 2001, 10, 93–115. [Google Scholar]
  26. Alsina, A.; Annexa, E. Estadistica en contexto: Desarrollando un enfoque escolar comun para promover la alfabetizacion. TANGRAM 2021, 4, 71–98. [Google Scholar] [CrossRef]
  27. Branco, J.A. Mudanças no Ensino da Estatística. Bol. Soc. Port. Estatística, 2006; 19–23. [Google Scholar]
  28. Batanero, C.; Godino, J.D.; Roa, R. Training teachers to teach probability. J. Stat. Educ. 2004, 12, 1–19. [Google Scholar] [CrossRef]
  29. Chick, H.L.; Pierce, R.U. Teaching Statistics at the primary school level: Beliefs, affordances, and pedagogical content knowledge. In Proceedings of the ICMI Study 18, Monterrey, Mexico, 30 June–4 July 2008. [Google Scholar]
  30. Gal, I. Adults’ statistical literacy: Meanings, components, responsabilities. Int. Stat. Rev. 2002, 70, 1–25. [Google Scholar] [CrossRef]
  31. Garfield, J.; Franklin, C. Assessment of learning, for learning, and as learning in Statistics Education. In Teaching Statistics in School Mathematics—Challenges for Teaching and Teacher Education: A Joint ICMI/IASE Study; Batanero, C., Burril, G., Reading, C., Eds.; Springer: Dordrecht, The Netherlands, 2011; pp. 133–145. [Google Scholar]
  32. Rumsey, D.J. Statistical Literacy as a Goal for Introductory Statistics Courses. J. Stat. Educ. 2002, 10, 1–12. [Google Scholar] [CrossRef]
  33. Curcio, F. Developing Graph Comprehension: Elementary and Middle School Activities; NCTM: Reston, VA, USA, 1994. [Google Scholar]
  34. Santos, L.; Brocardo, J.; Pires, M.; Rosendo, A.I. Investigações matemáticas na aprendizagem do 2.º ciclo do ensino básico ao ensino superior. In Actividades de Investigação na Aprendizagem da Matemática e na Formação de Professores; Ponte, J.P., Costa, C., Rosendo, A.I., Maia, E., Figueiredo, N., Dionísio, A.F., Eds.; Secção de Educação Matemática da Sociedade Portuguesa de Ciências da Educação: Lisboa, Portugal, 2002; pp. 83–106. [Google Scholar]
  35. Brocardo, J. As Investigações na Aula de Matemática: Um Projecto Curricular no 8.º ano. Ph.D. Thesis; Universidade de Lisboa: Lisboa, Portugal, 2001. [Google Scholar]
  36. Fertuzinhos, M.L.R. As Tarefas de Natureza Investigativa na Aprendizagem de Conteúdos do Tema Funções do 10.º ano; Master´s Thesis, Universidade do Minho: Braga, Portugal, 2014. [Google Scholar]
  37. Ernest, P. Investigações, resolução de problemas e pedagogia. In Investigar para Aprender Matemática: Textos Selecionados; Abrantes, P., Leal, L., Ponte, J.P., Eds.; APM: Lisboa, Portugal, 1996; pp. 25–47. [Google Scholar]
  38. Serrazina, L.; Vale, I.; Fonseca, H.; Pimentel, T. Investigações matemáticas e profissionais na formação de professores. In Actividades de Investigação na Aprendizagem da Matemática e na Formação de Professores; Ponte, J.P., Costa, C., Rosendo, A.I., Maia, E., Figueiredo, N., Dionísio, A.F., Eds.; Secção de Educação Matemática da Sociedade Portuguesa de Ciências da Educação: Lisboa, Portugal, 2002; pp. 41–58. [Google Scholar]
  39. Batanero, C.; Arteaga, P.; Gea, M.M. El Currículo de estadística: Reflexiones desde uma prespectiva internacional. UNO 2012, 59, 9–17. [Google Scholar]
  40. PfannKuch, M.; Horring, J. Developing statistical thinking in a secondary school: A collaborative curriculum development. In Curricular Development in Statistics Education International Associations for Statistical Educacion; Burril, G., Camden, M., Eds.; International Statistical Institute: Lund, Sweden, 2004; pp. 204–218. [Google Scholar]
  41. Wild, C.J.; Pfannkuch, M. Statistical thinking in empirical enquiry. Int. Stat. Rev. 1999, 67, 223–265. [Google Scholar] [CrossRef]
  42. Shaughnessy, J.M. Research on statistics learning and reasoning. In The Second Handbook of Research on Mathematics; Lester, F.K., Ed.; NCTM: Reston, VA, USA, 2007; pp. 957–1010. [Google Scholar]
  43. Burgess, T.A. Teacher Knowledge of and for Statistical Investigations. In Teaching Statistics in School Mathematics- Challenges for Teaching and Teacher Education: A Joint ICMI/IASE Study; Batanero, C., Burril, G., Reading, C., Eds.; Springer: Dordrecht, The Netherlands, 2011; pp. 259–270. [Google Scholar]
  44. Veia, L.; Brocardo, J.; Ponte, J.P. Uma tarefa de investigação em organização e tratamento de dados no 1. º ciclo: Realização da tarefa e reflexão da professora. In Proceedings of the Atas do XXV Seminário de Investigação em Educação Matemática, Braga, Portugal, 9–10 April 2014; Martinho, M.H., Ferreira, R.A., Boavida, A.M., Menezes, L., Eds.; 2014; pp. 229–242. [Google Scholar]
  45. McMillan, J.; Schumacher, S. Research in Education Evidence-Based Inquiry, 7th ed; Pearson Education Limited: London, UK, 2014. [Google Scholar]
  46. Cunha, C.; Galindro, P. O Cuquedo; Livros Horizonte: Lisboa, Portugal, 2011. [Google Scholar]
  47. Sfard, A. Thinking as Communicating: Human Development, the Growth of Discourses, and Mathematizing; Universtity Press: Cambridge, UK, 2008. [Google Scholar] [CrossRef]
  48. Vieira, I.S. Organização e Tratamento de Dados Estudo de Caso no 5.º ano de Escolaridade. Master’s Thesis, Instituto Politécnico de Leiria, Leiria, Portugal, 2012. [Google Scholar]
  49. Ponte, J.P. Investigations and explorations in the mathematics classroom. ZDM 2007, 39, 419–430. [Google Scholar] [CrossRef] [Green Version]
  50. Andrade, N.M.G. Aprendizagem da Estatística no 2.º ano de Escolaridade Através de Atividades Investigativas. Master’s Thesis, Universidade do Minho, Braga, Portugal, 2012. [Google Scholar]
  51. Fernandes, J.A.; Carvalho, C.F.; Ribeiro, S.A.L. Caracterização e implementação de tarefas de Estatística: Um exemplo no 7.º ano de escolaridade. Zetetiké 2007, 15, 27–61. [Google Scholar]
  52. Martins, C.; Pires, M.V.; Barros, P.M. Conhecimento estatístico: Um estudo com futuros professores. In Proceedings of the Actas do XIX Encontro de Investigação em Educação Matemática, Números e Estatística—Refletindo no Presente, Perspetivando o Futuro, Vila Real, Portugal, 6–9 July 2009; Secção de Educação Matemática da Sociedade Portuguesa de Ciências da Educação: Lisboa, Portugal, 2009; pp. 1–12. [Google Scholar]
  53. Carvalho, C. Interação Entre Pares: Contributos Para a Promoção do Desenvolvimento Lógico e do Desempenho Estatístico, no 7.º ano de Escolaridade. Ph.D. Thesis, Universidade de Lisboa, Lisboa, Portugal, 2001. [Google Scholar]
  54. Balachowski, M.M. Trends in the statistics classroom since NCTM standards. In Proceedings of the Fifth International Conference on Teaching of Statistics, Singapore, 21–26 June 1998; Volume 1, pp. 75–76. [Google Scholar]
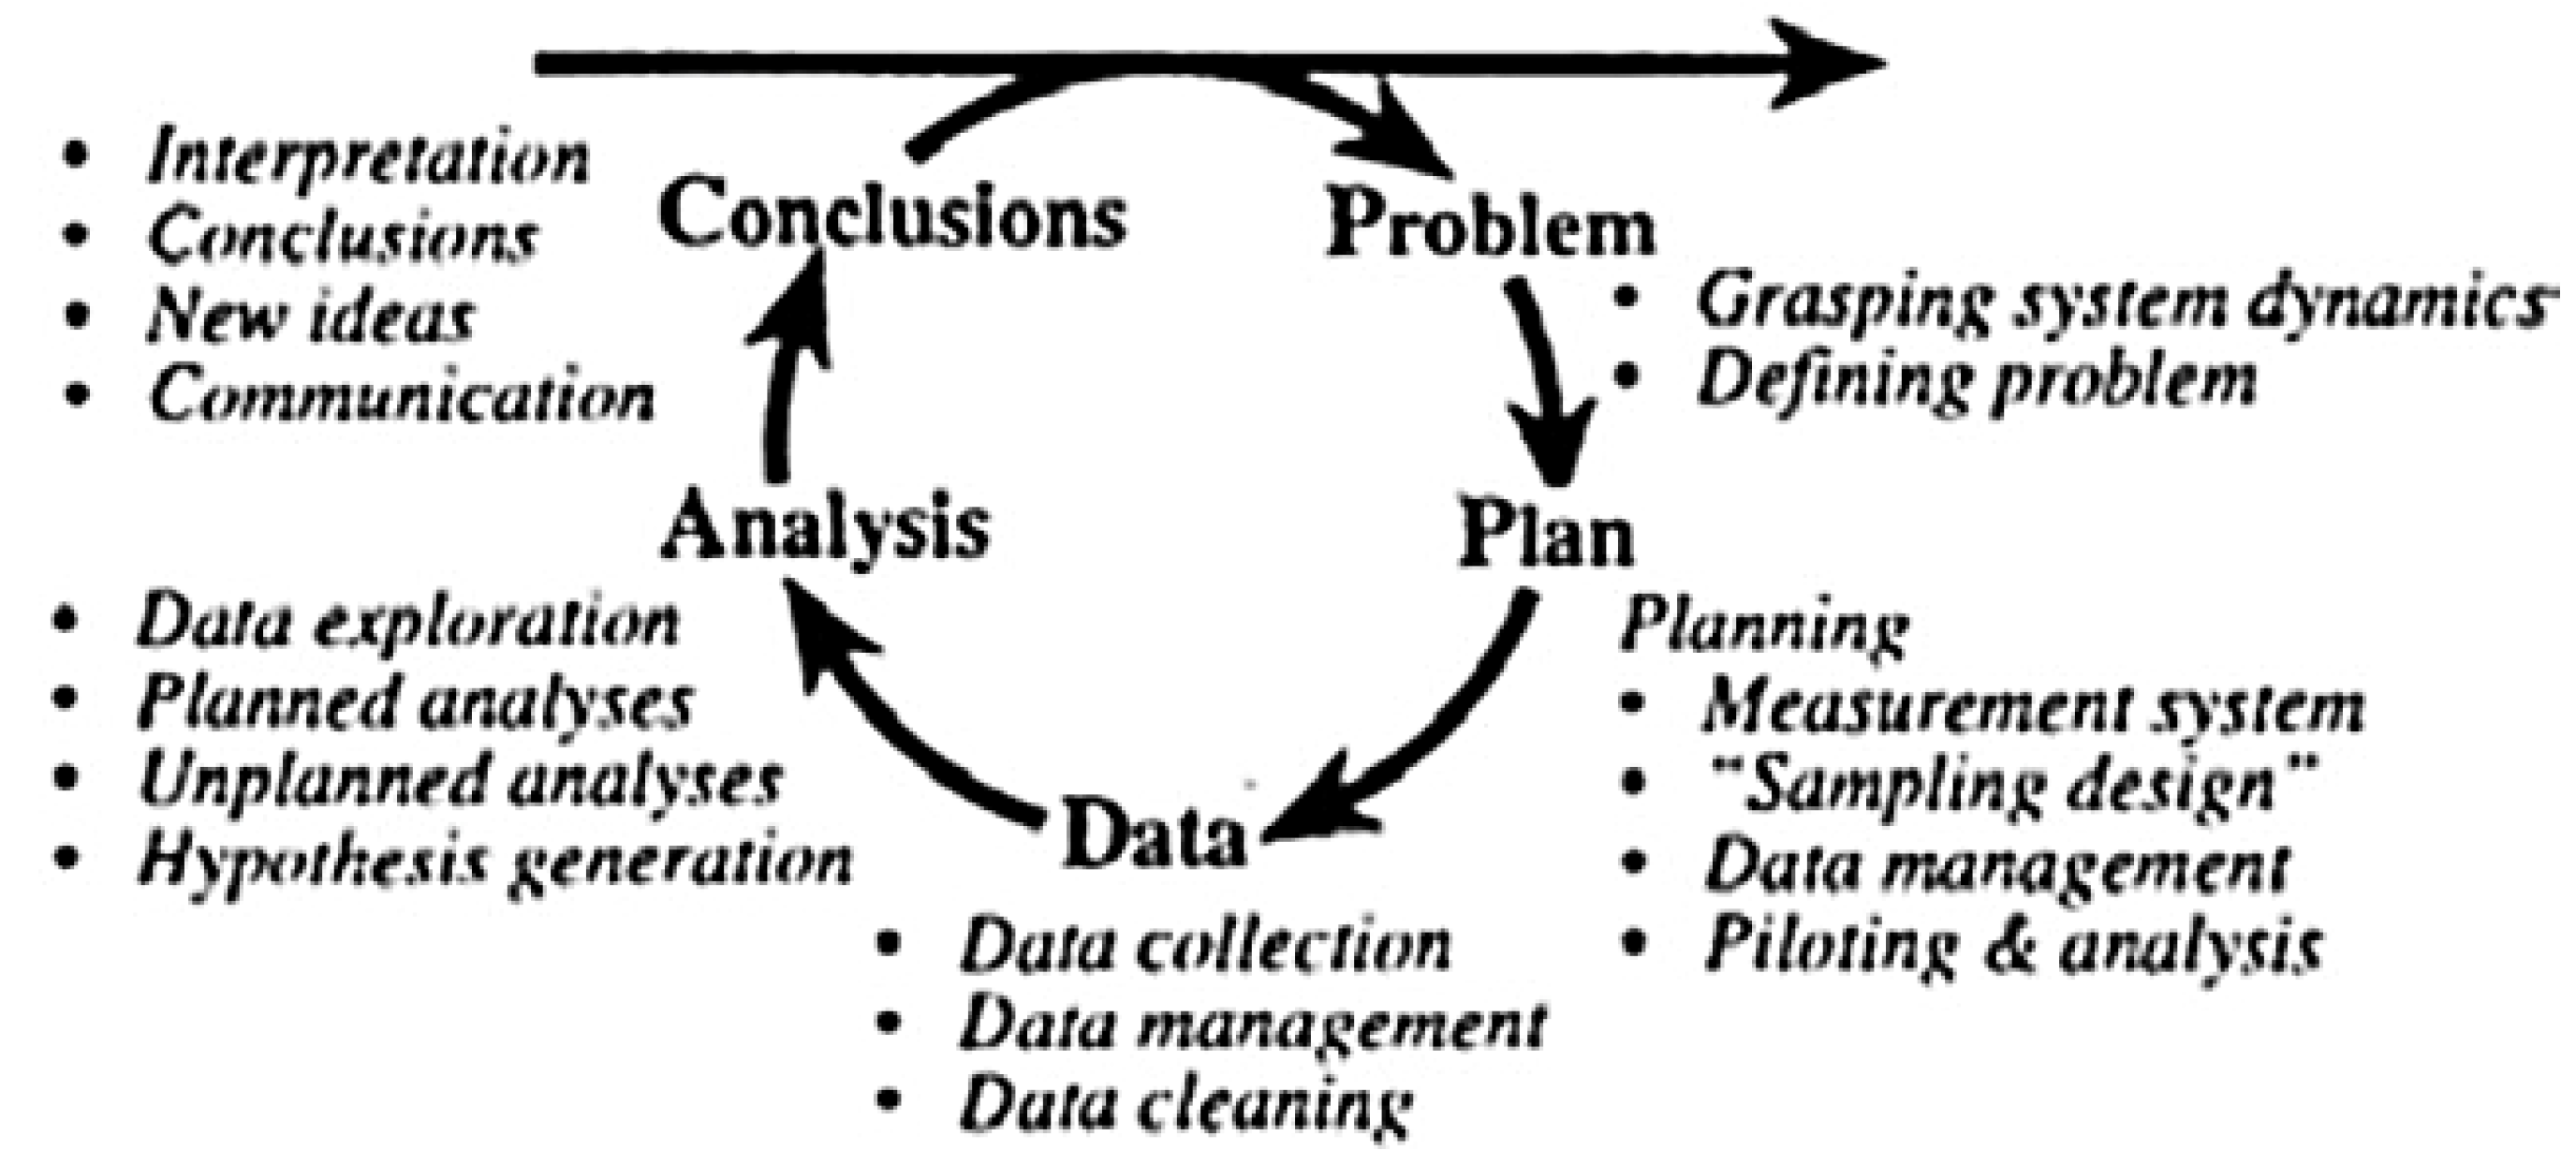
Figure 1. Investigative cycle [41] (p. 226).
Education 12 00665 g001
Figure 2. Construction of the investigative cycle.
Education 12 00665 g002
Figure 3. The work developed by group G2 and the respective correction made by the teacher.
Education 12 00665 g003
Figure 4. Organization of the data by group G1.
Education 12 00665 g004
Figure 5. Data analysis by groups G2 and G4.
Education 12 00665 g005
Figure 6. Poster showing the results of the research carried out by G1 with subject “Animals”.
Education 12 00665 g006
Figure 7. Presentation of the investigative activity to the whole class.
Education 12 00665 g007
Figure 8. Representation of the data on the dot plot in the pre-test by student A18 (Category: Elements of the fire station).
Education 12 00665 g008
Figure 9. Representation of data on the dot plot in the post-test by student A11 (Category: Elements of the fire station).
Education 12 00665 g009
Table 1. Distribution of students’ answers (%) in the questions related to question 1 (Appendix A).
Types of Answer% of Students
Pre-TestPost-Test
11.11.21.31.41.511.11.21.31.41.5
Correct1510030751059510010010010095
Incorrect85070257060500005
No answer00002035000000
Table 2. Distribution of students’ answers (%) in the questions related to question 2 (Appendix A).
Types of Answer% of Students
Pre-TestPost-Test
2.12.22.32.42.12.22.32.4
Correct8510100100100100100
Incorrect159085150000
No answer005850000
Publisher’s Note: MDPI stays neutral with regard to jurisdictional claims in published maps and institutional affiliations.