
Investigative Activities for Statistics Learning with 1st Grade Portuguese Students


Abstract
:1. Introduction
2. Investigative Activities in Learning Statistics
3. Method
3.1. Participants
3.2. Procedures
3.3. Method of Analysis
4. Results and Discussion
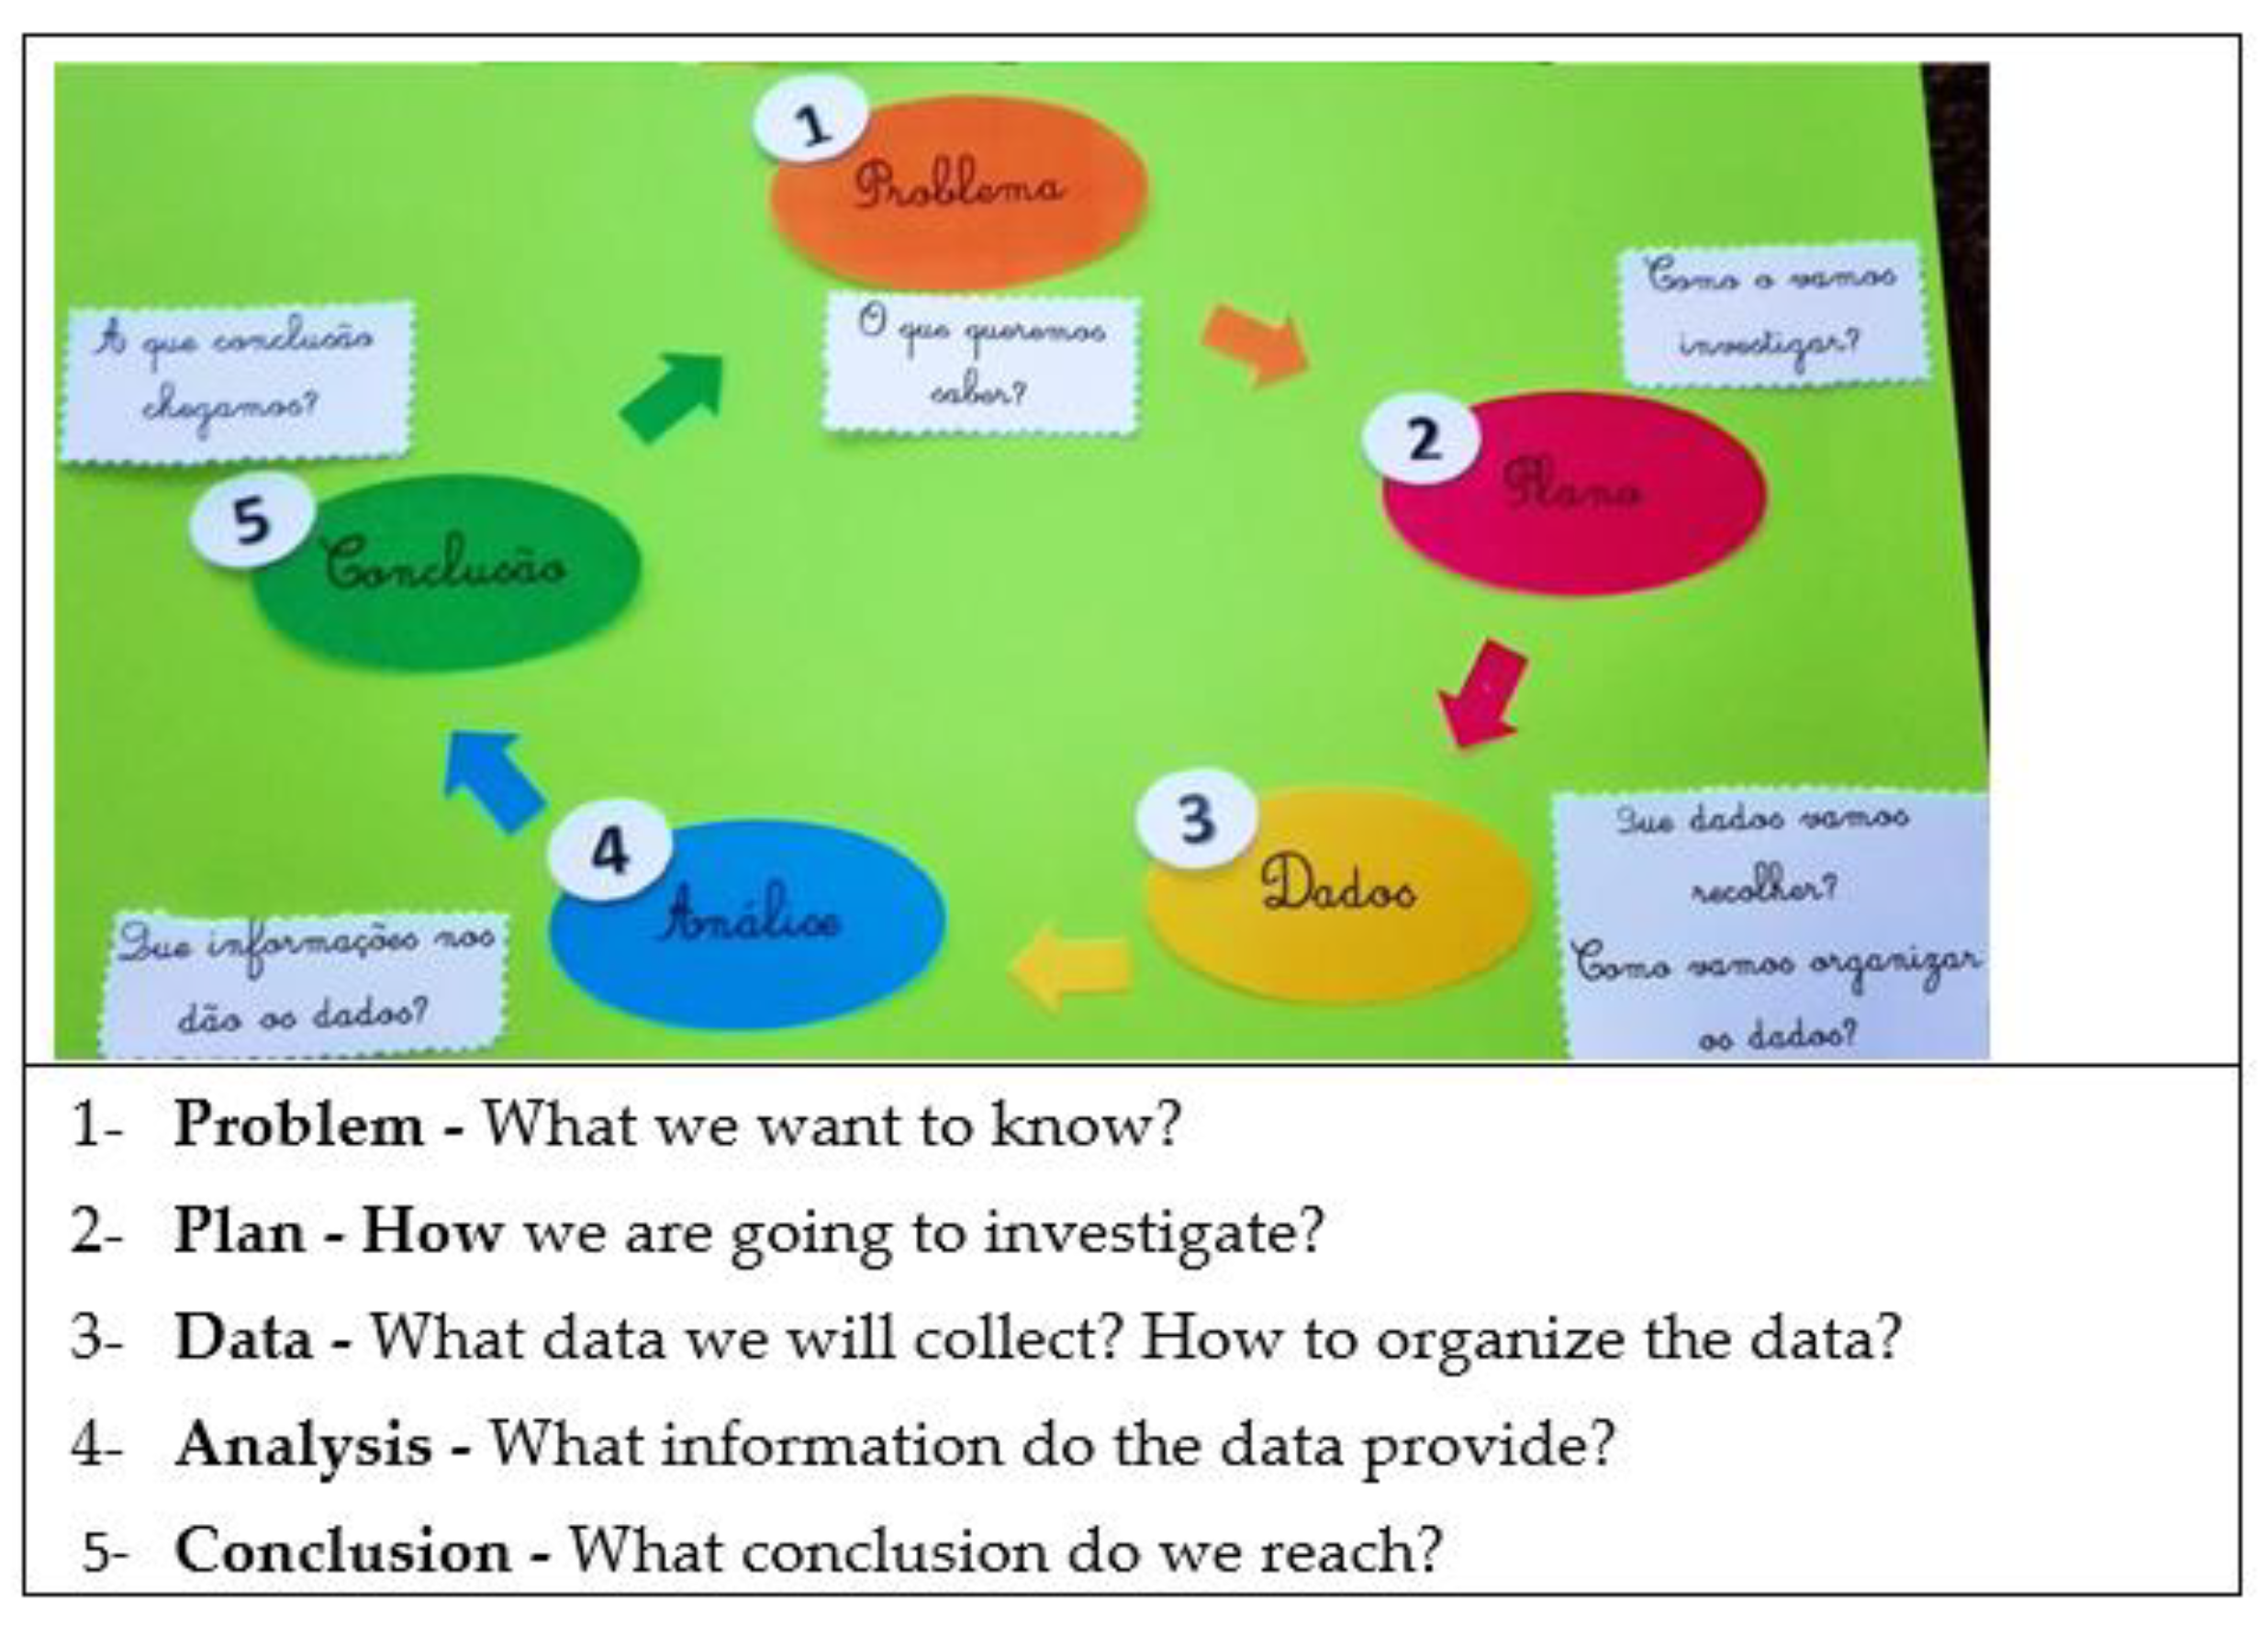
4.1. Execution of the Statistical Investigative Activity
4.1.1. Stage 1: Problem
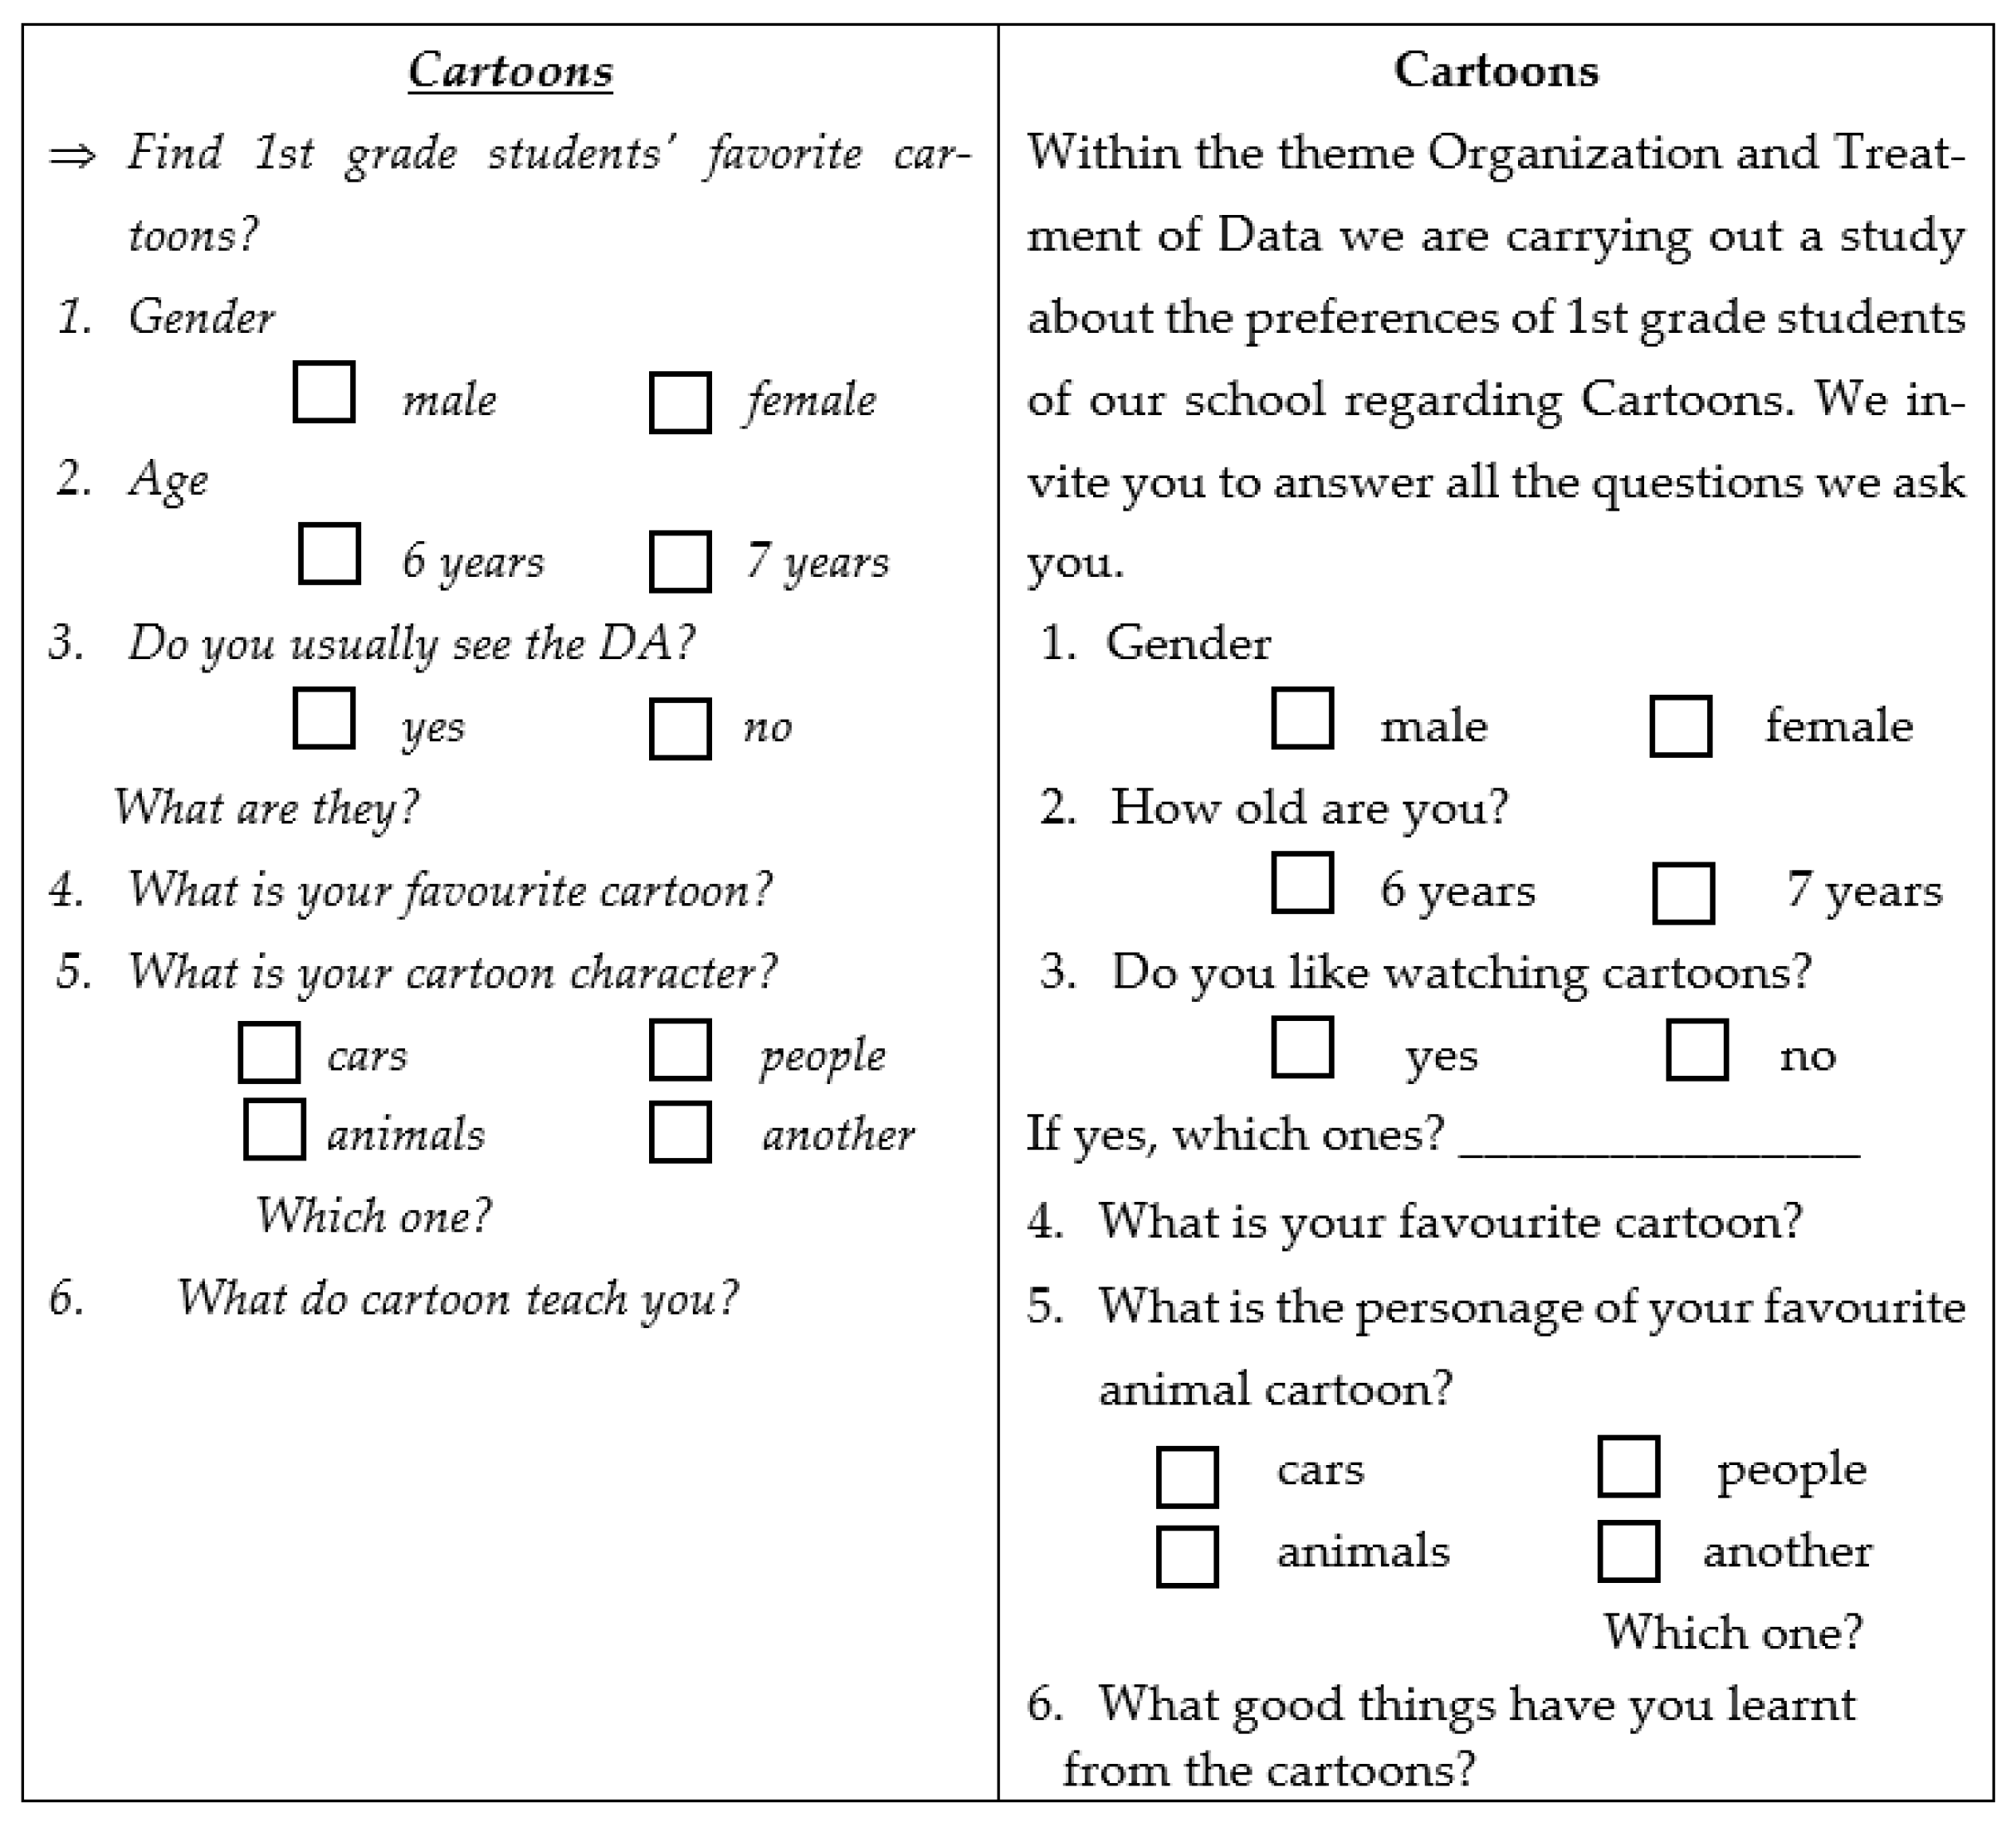
4.1.2. Stage 2: Plan
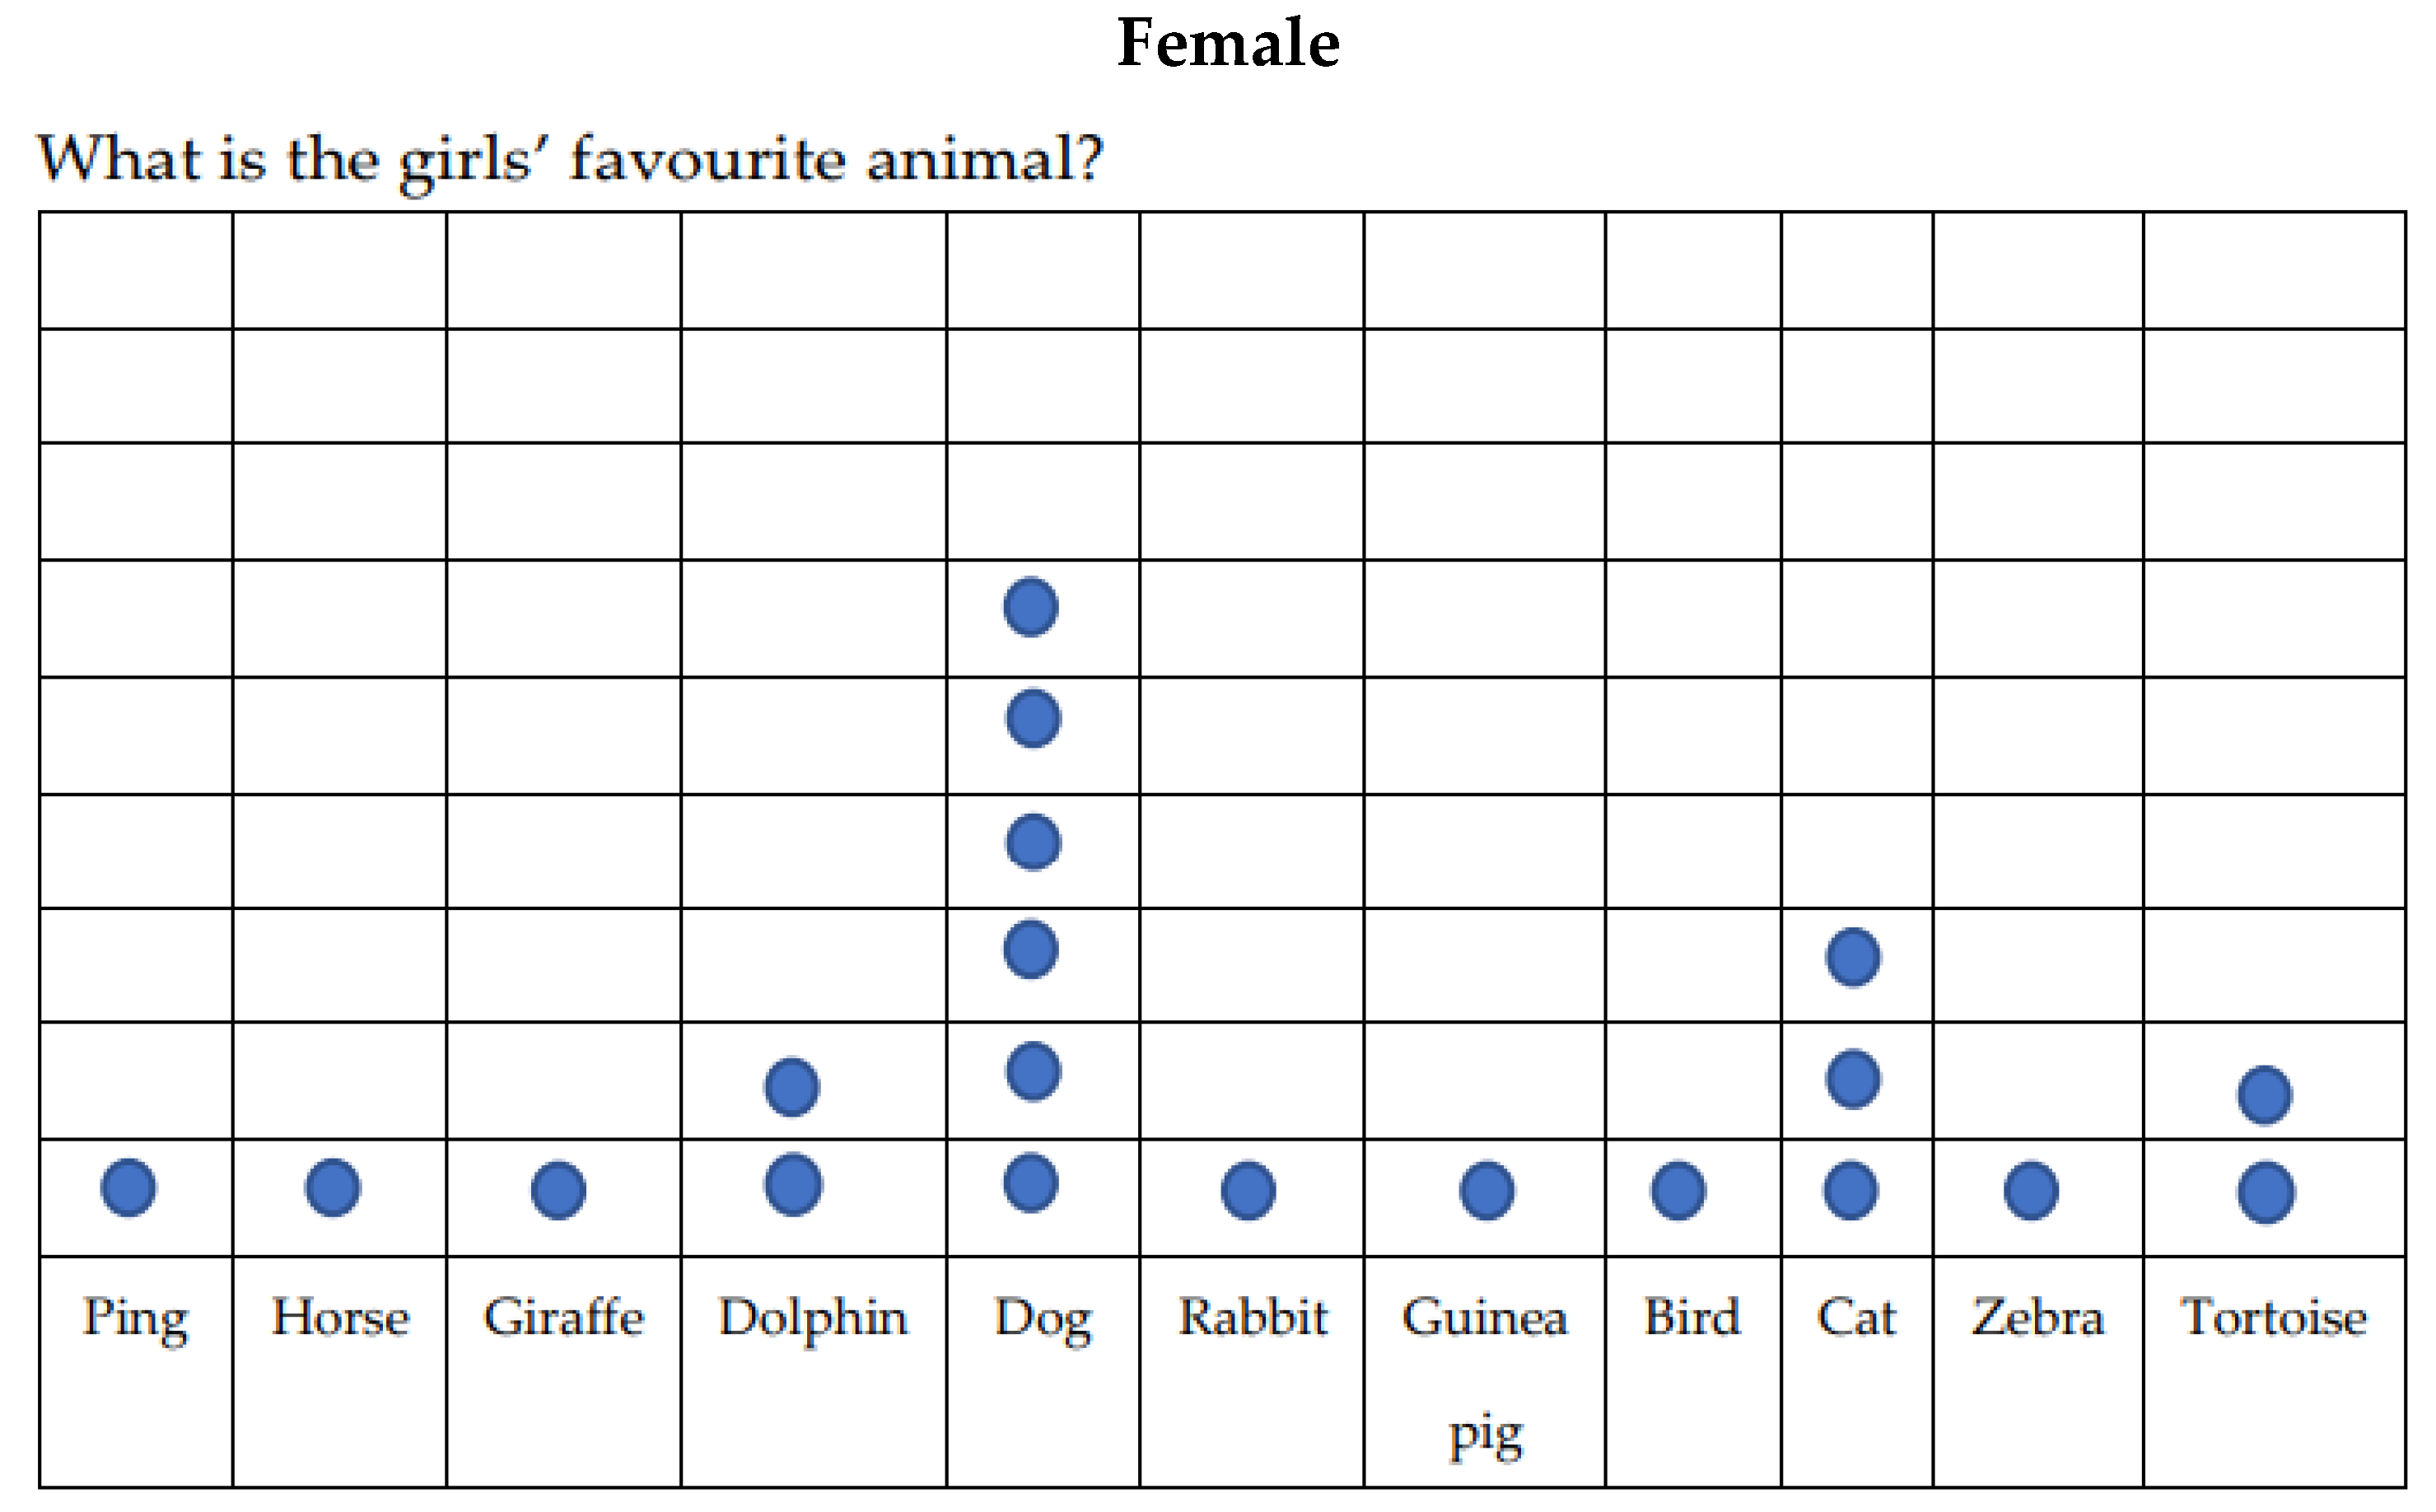
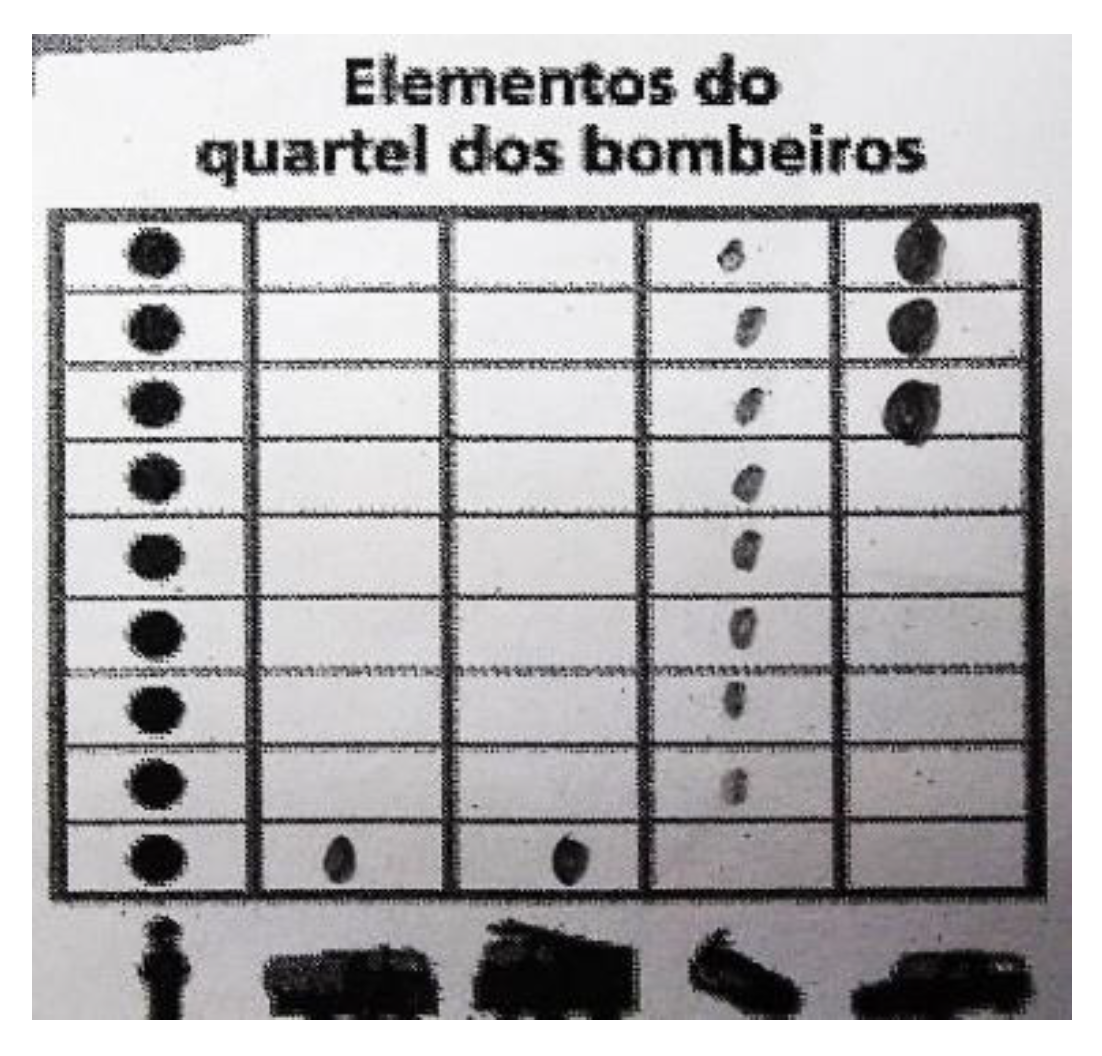
4.1.3. Stage 3: Collecting and Organizing Data
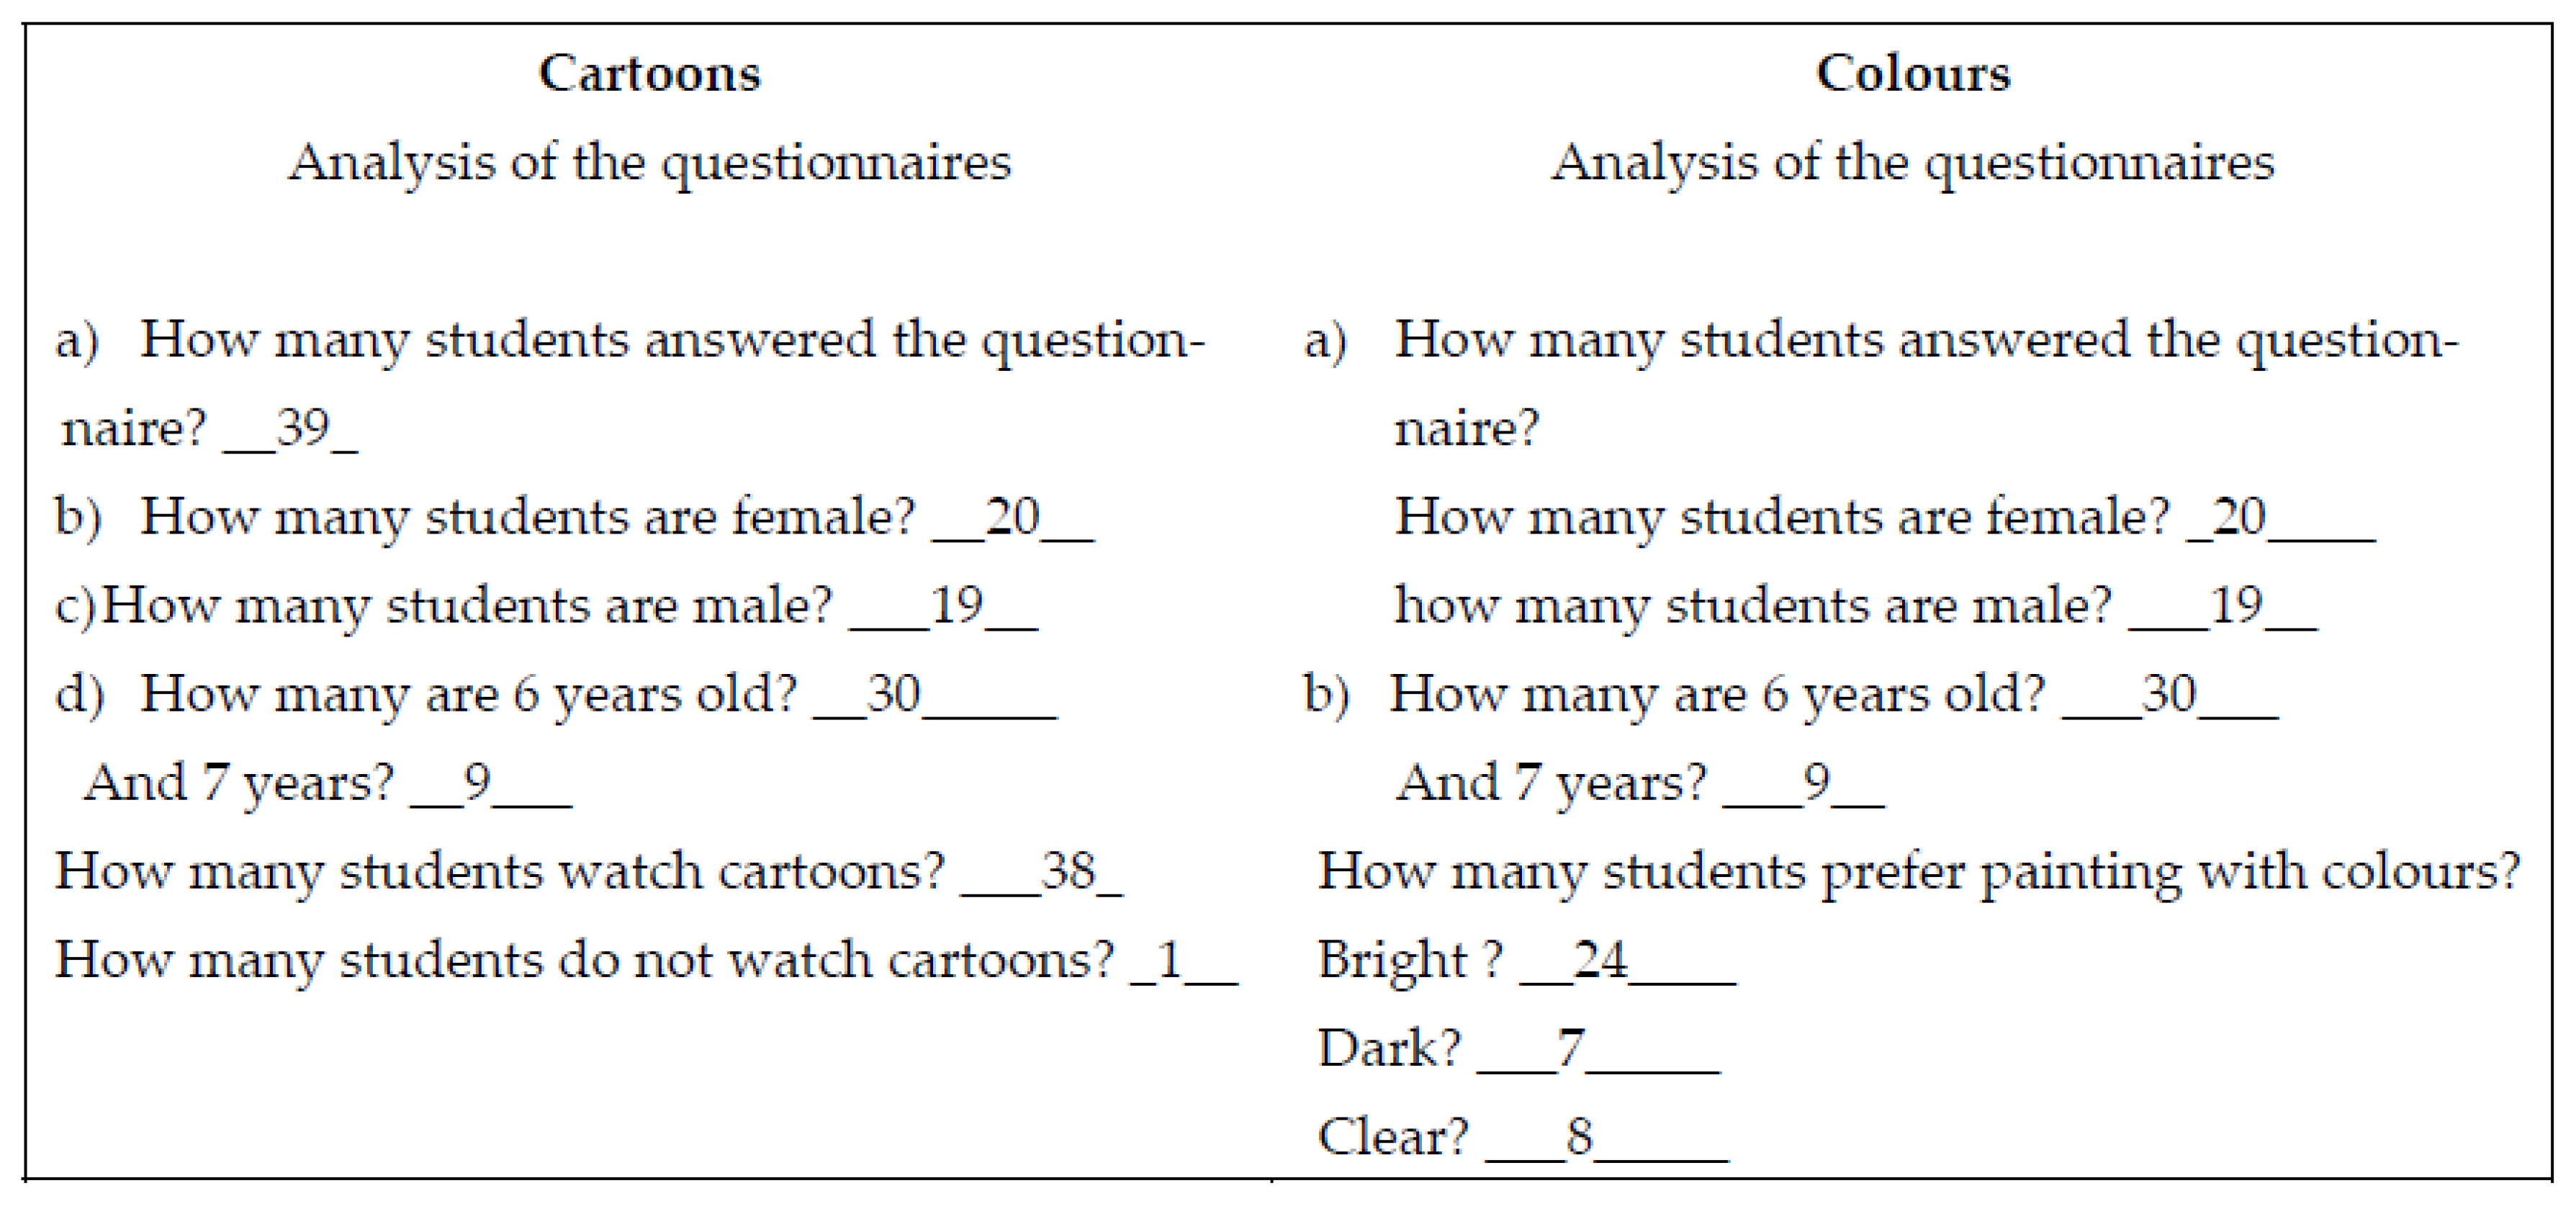
4.1.4. Stage 4: Data Analysis
4.1.5. Stage 5: Conclusion
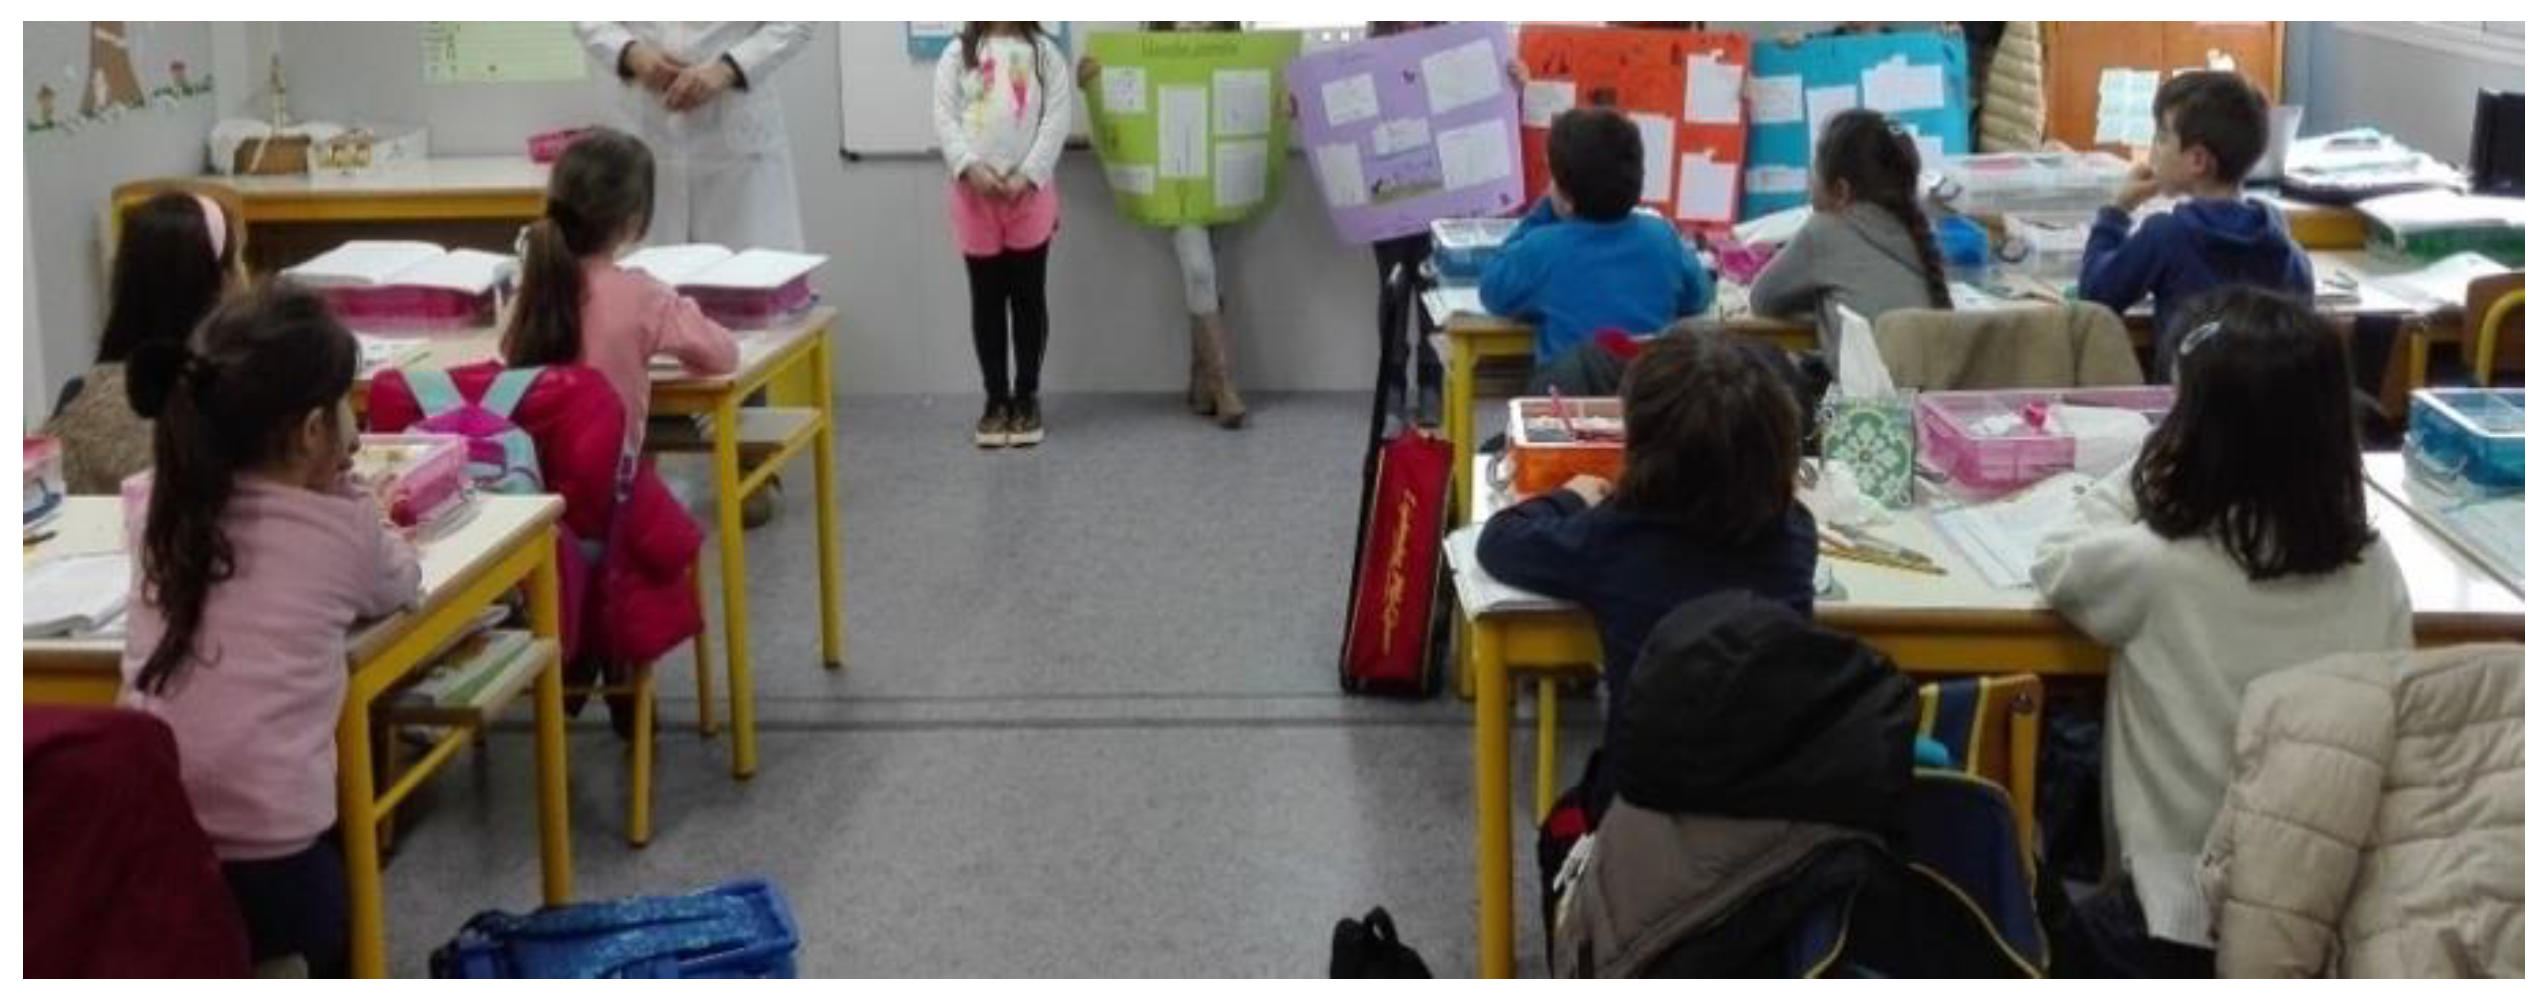
4.2. Presentation of the Investigative Activity
4.3. Evaluation of the Learning Experience
5. Conclusions
Author Contributions
Funding
Institutional Review Board Statement
Informed Consent Statement
Conflicts of Interest
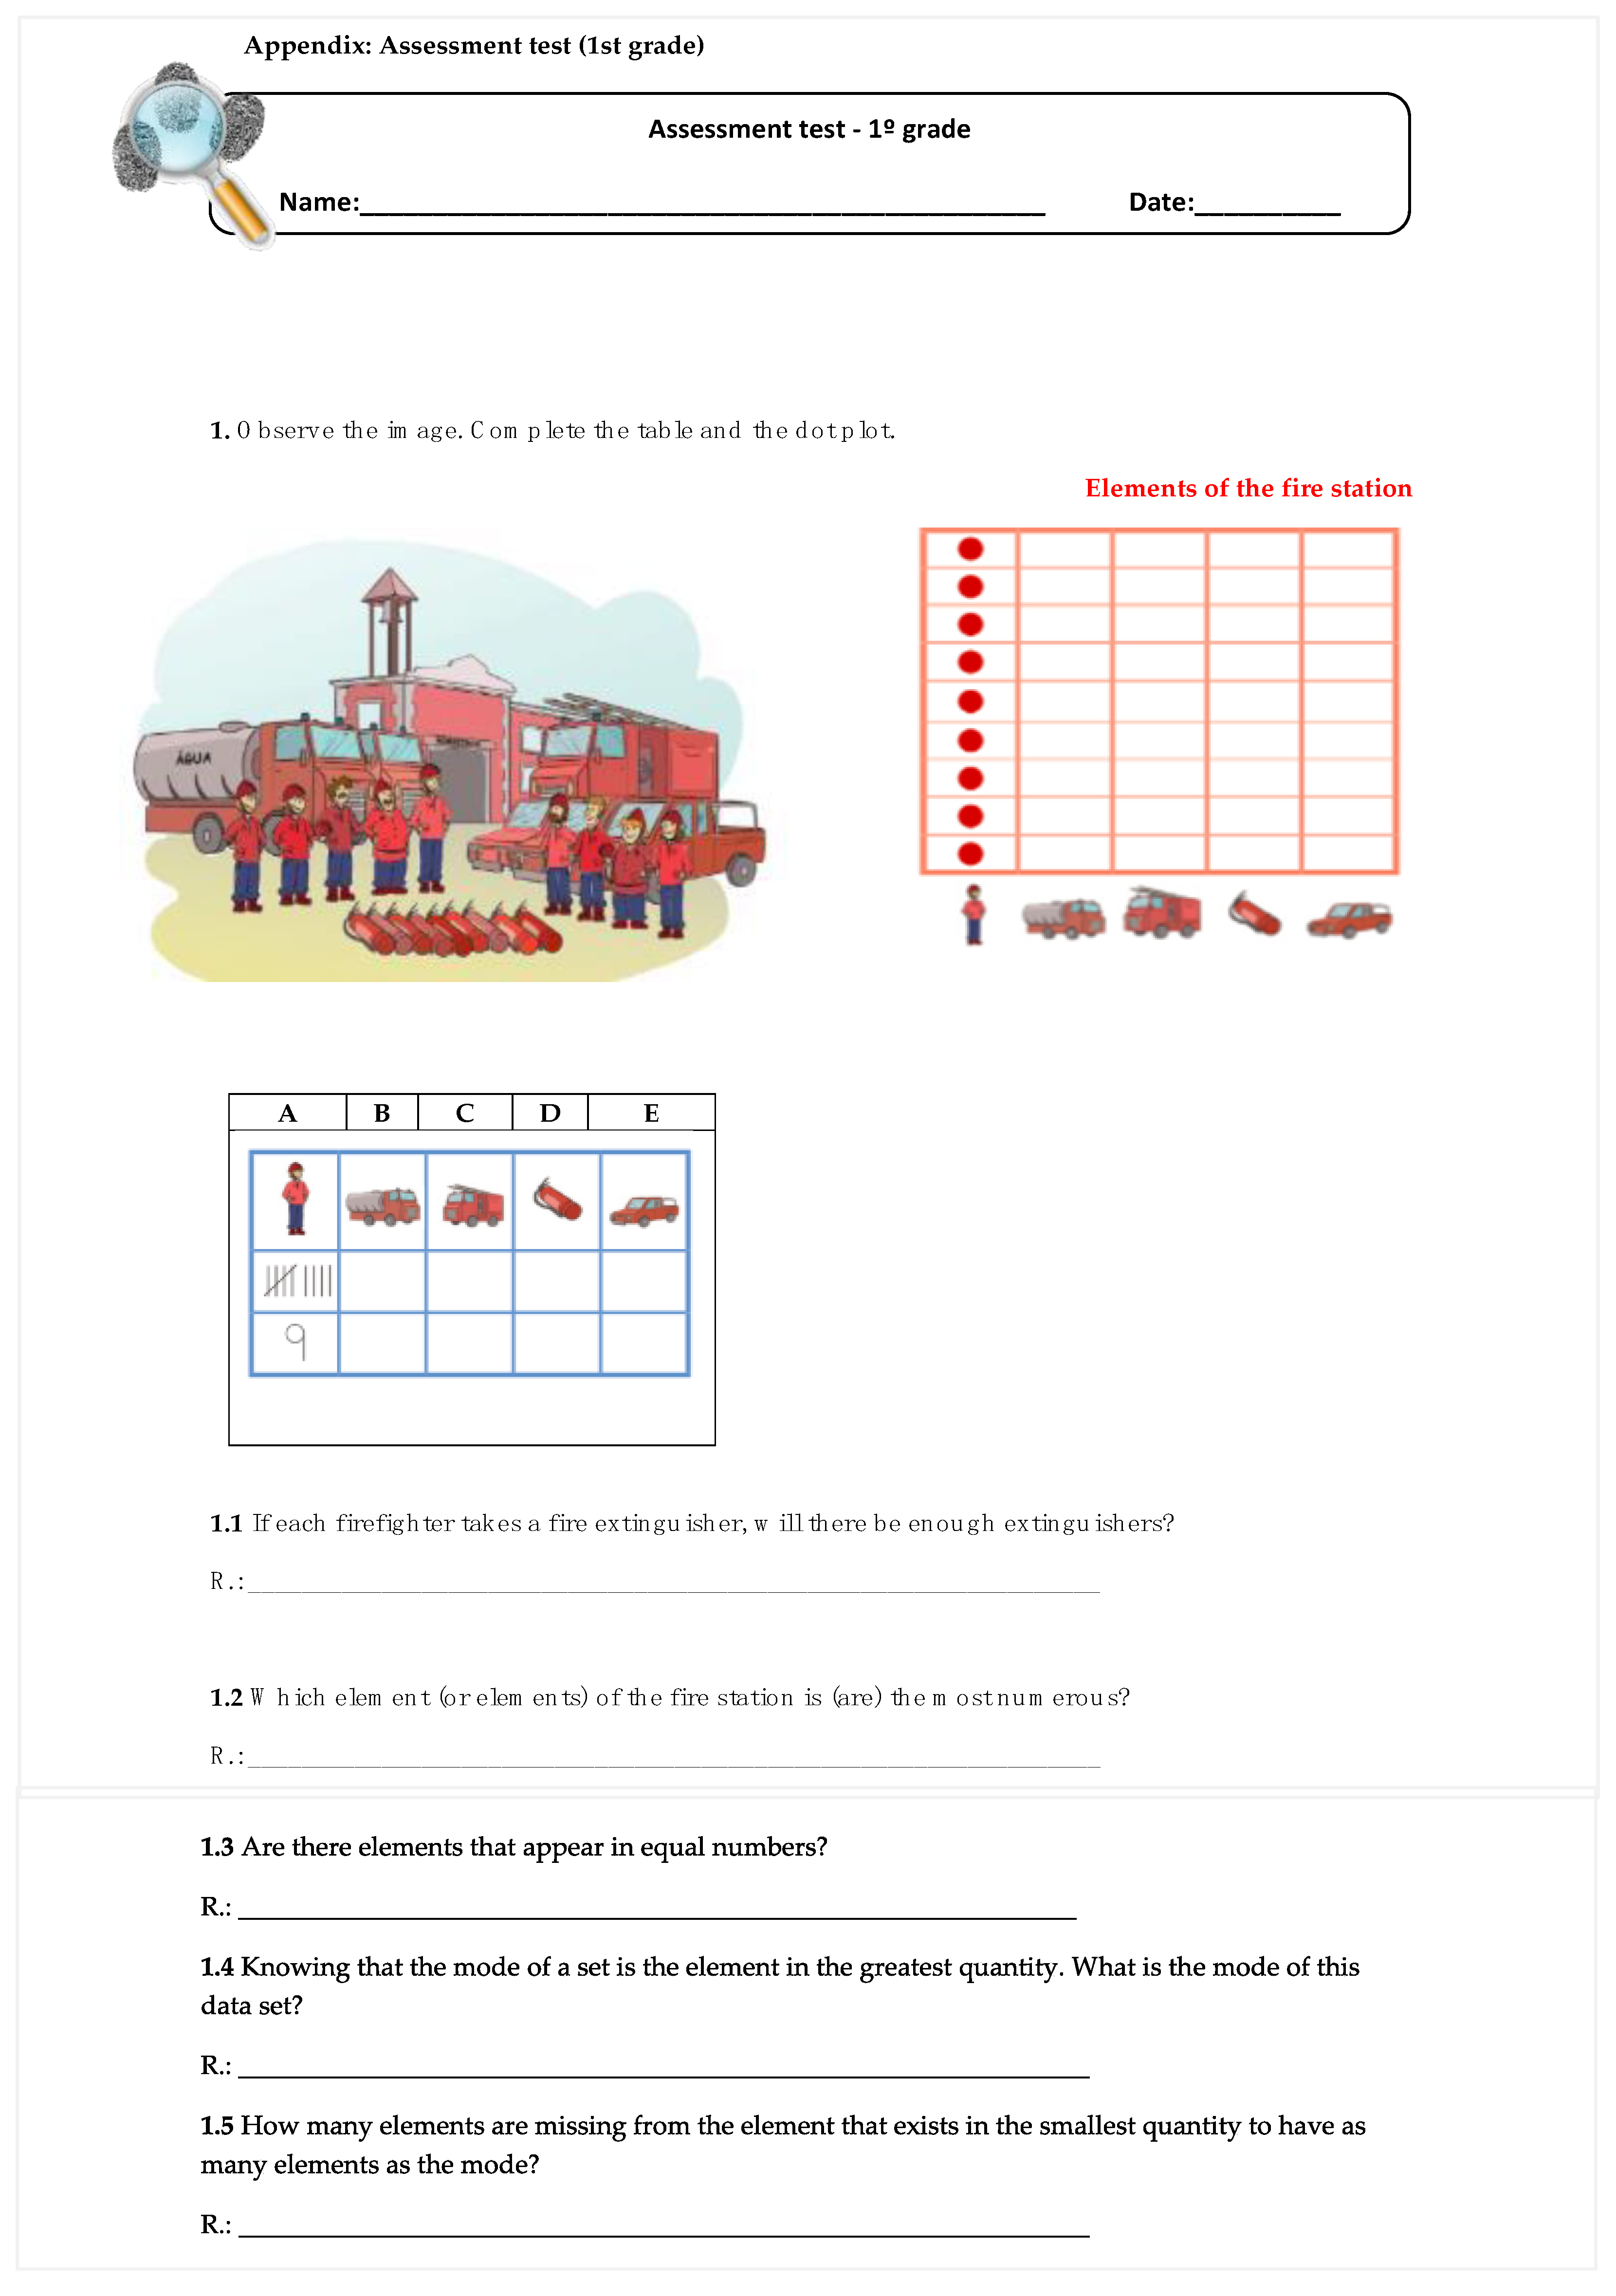
Appendix A
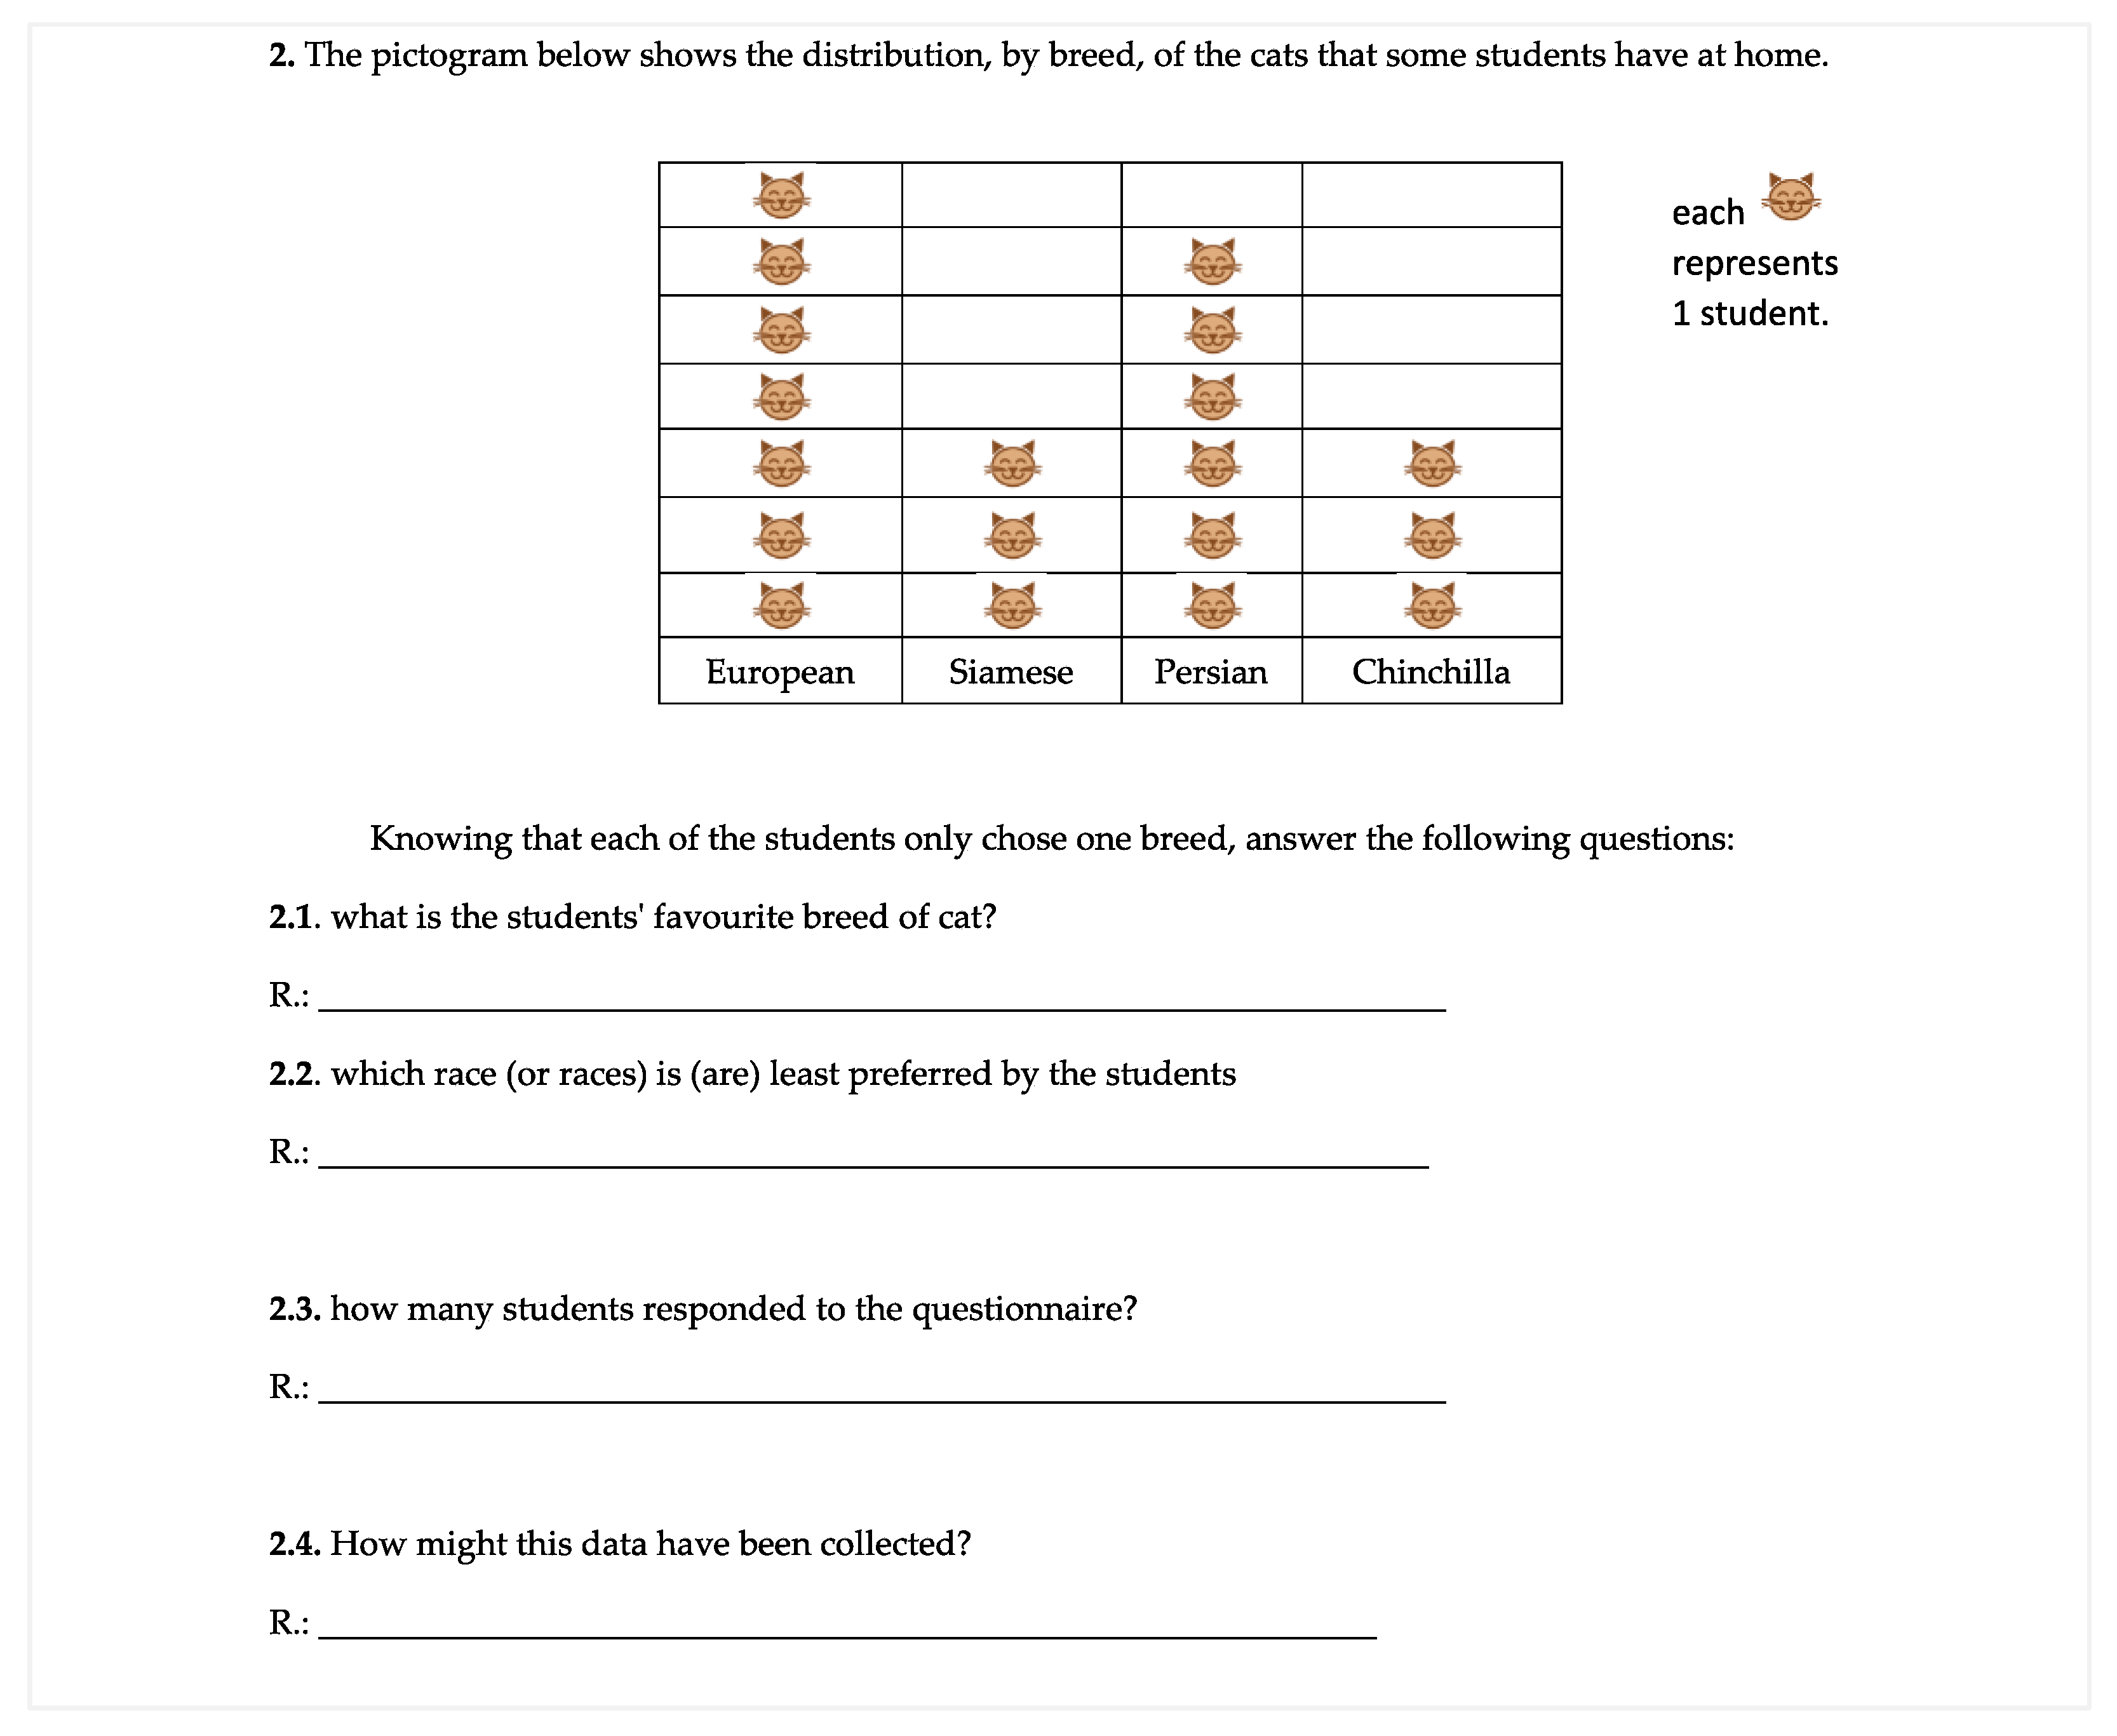
Appendix B
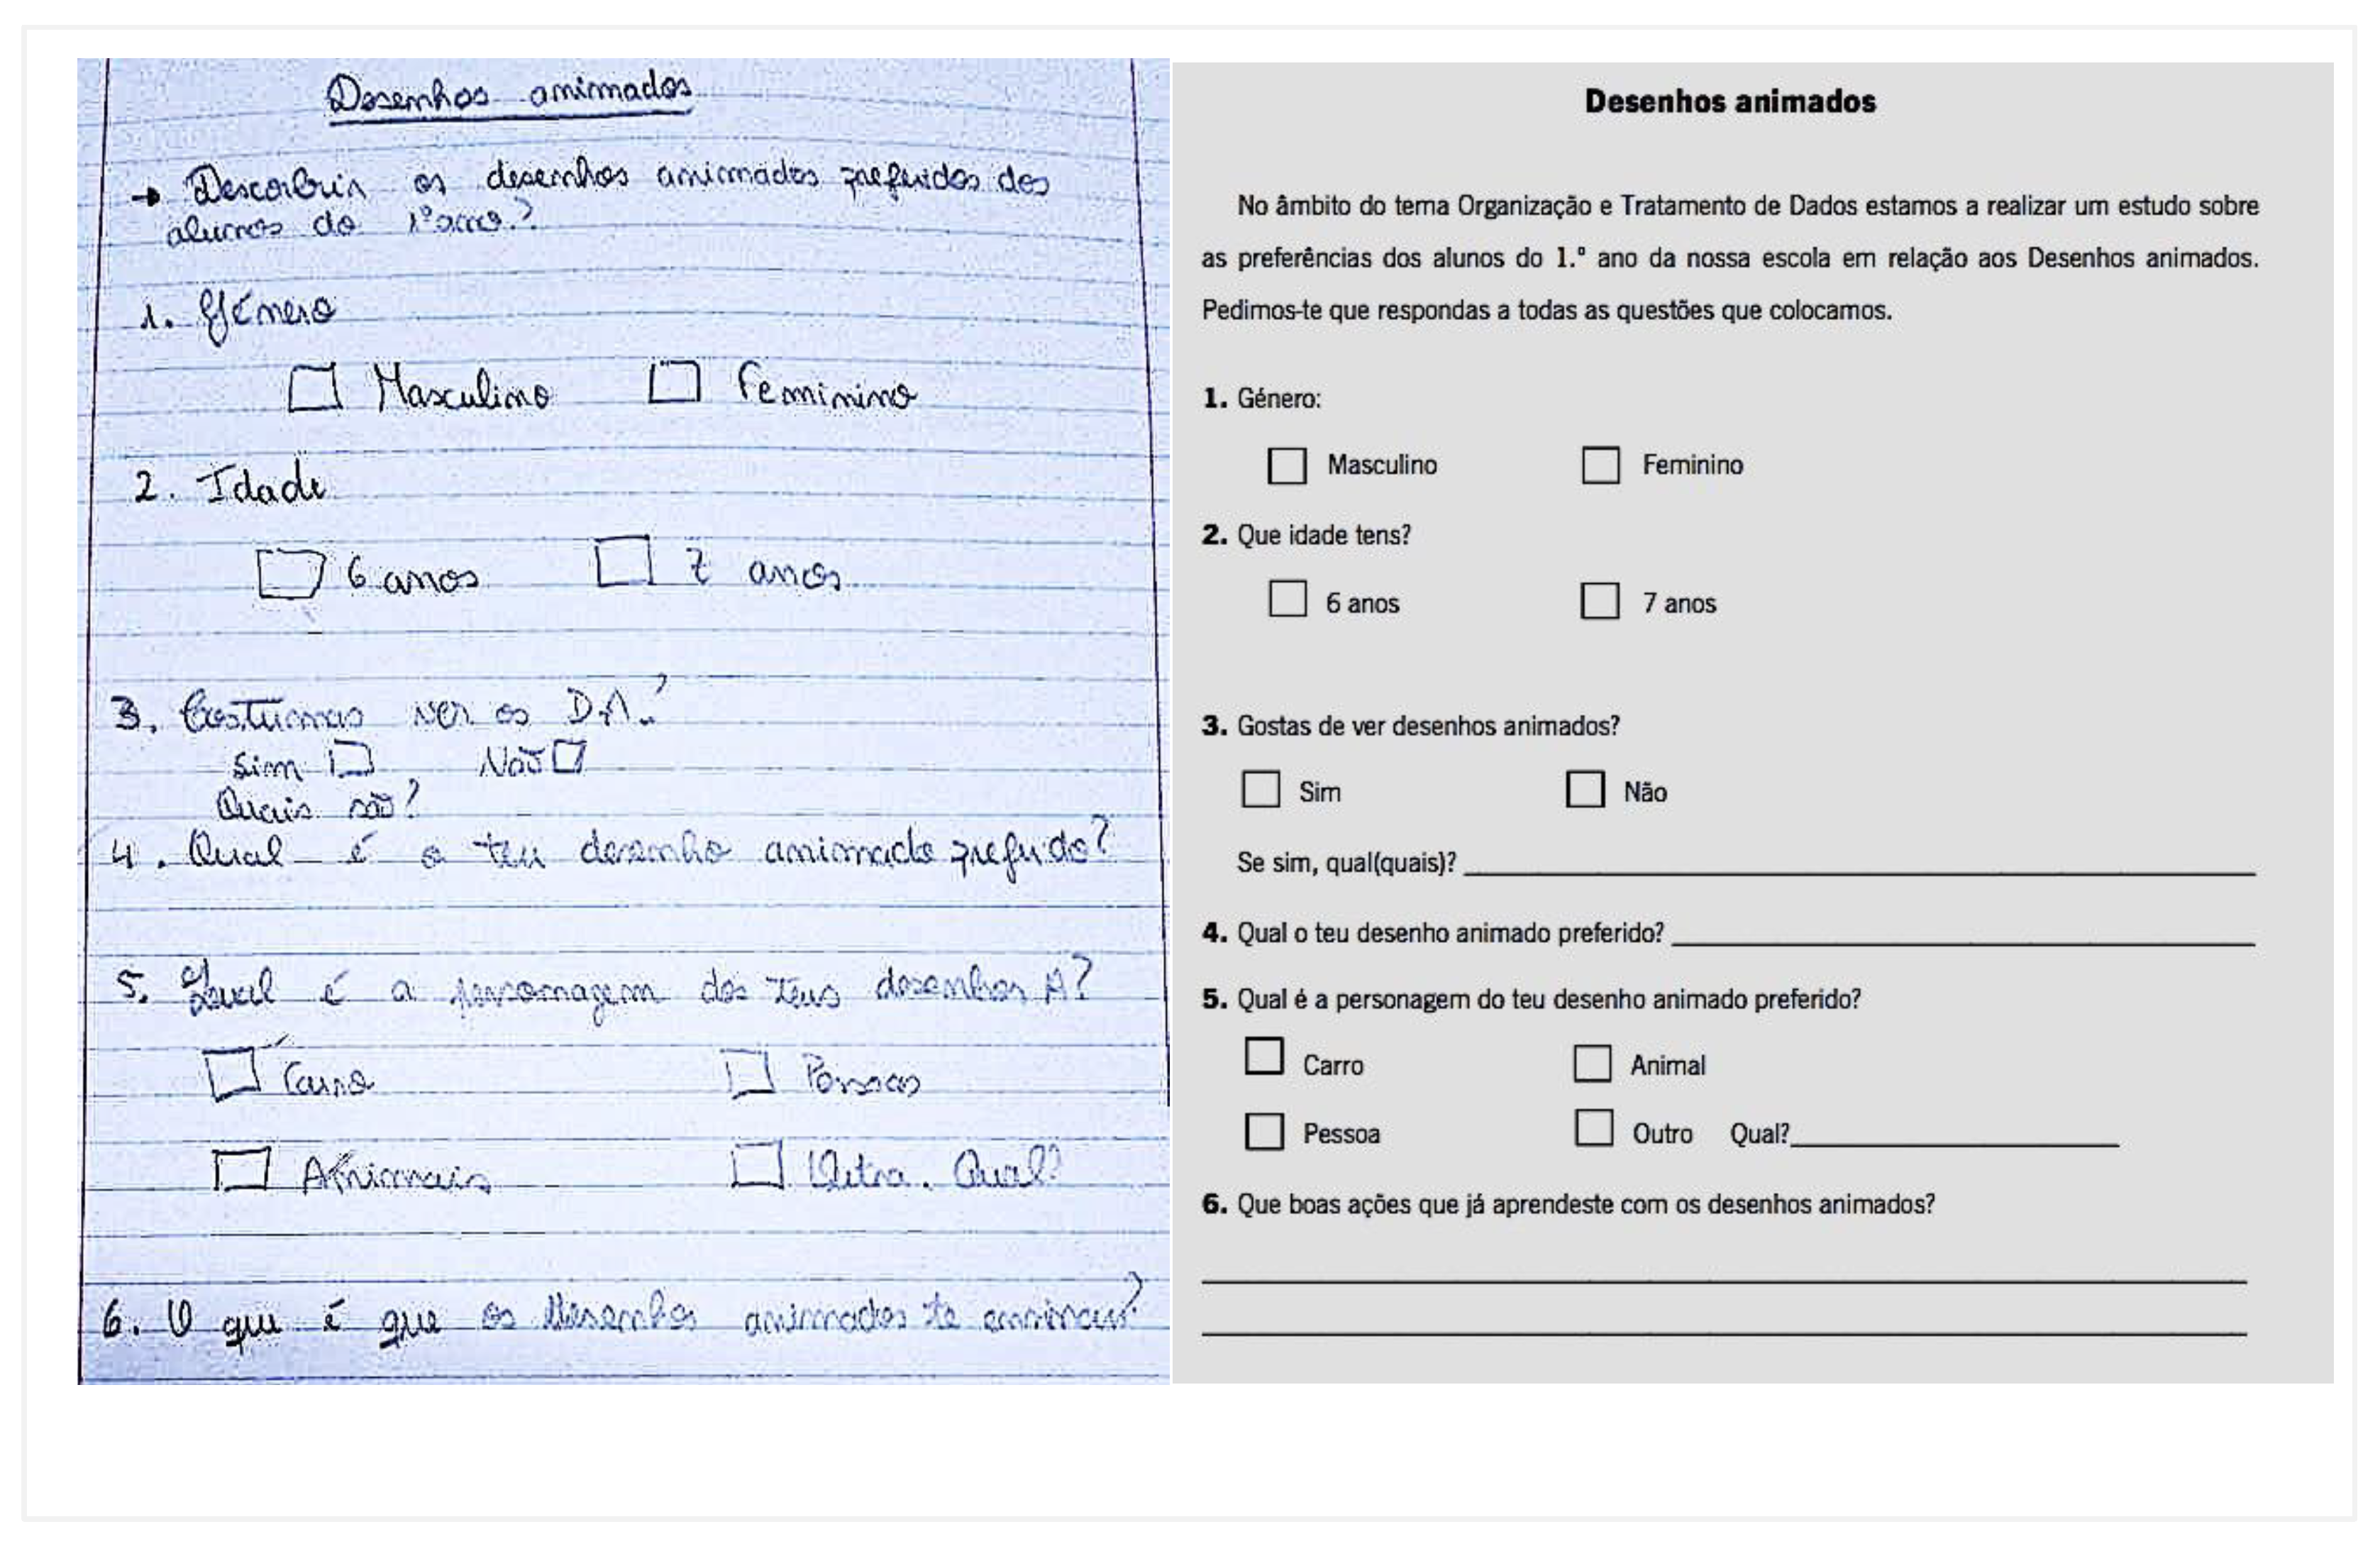
Appendix C

Appendix D

References
- Ministério da Educação e Ciência [MEC]. Aprendizagens Essenciais de Matemática para o Ensino Básico; Ministério de Educação e Ciência: Lisboa, Portugal, 2018. [Google Scholar]
- Abrantes, P.; Serrazina, L.; Oliveira, I. A Matemática na Educação Básica; Ministério da Educação, Direcção-Geral de Inovação e Desenvolvimento Curricular: Lisboa, Portugal, 1999; ISBN 9727421237. [Google Scholar]
- Batanero, C. Didáctica de la Estadística; Departamento de Didáctica de la Matemática, Universidad de Granada: Granada, Spain, 2001; ISBN 84-699-4295-6. [Google Scholar]
- Batanero, C.; Los Retos de la Cultura Estadística. Jornadas Interamericanas de Enseñanza de la Estadística. Buenos Aires: Conferência Inaugural. 2002. Available online: https://www.ugr.es/~batanero/pages/ARTICULOS/CULTURA.pdf (accessed on 10 July 2022).
- Ponte, J.P.; Noll, J. Building capacity in statistics teacher education. In The International Handbook of Research in Statistics Education; Springer International Handbooks of Education: Cham, Switzerland, 2017; pp. 433–455. ISBN 978-3-319-66193-3. [Google Scholar] [CrossRef]
- Martins, G.D.O.; Gomes, C.A.S.; Brocardo, J.; Pedroso, J.V.; Camilo, J.L.A.; Silva, L.M.U.; da Encarnacao, M.M.G.A.; Horta, M.J.d.V.C.; Calcada, M.T.C.S.; Nery, R.F.V.; et al. Perfil do Aluno à Saída da Escolaridade Obrigatória; Ministério de Educação e Ciência: Lisboa, Portugal, 2016; Available online: https://dge.mec.pt/sites/default/files/Curriculo/Projeto_Autonomia_e_Flexibilidade/perfil_dos_alunos.pdf (accessed on 5 July 2022).
- Ponte, J.P.; Serrazina, L. Didática da Matemática para o 1.º Ciclo do Ensino Básico; Universidade Aberta: Lisboa, Portugal, 2000. [Google Scholar]
- Ponte, J.P. Investigações Matemáticas e Investigações na Prática Profissional, 1st ed.; Editora Livraria da Física: Lisboa, Portugal, 2018; ISBN 9788578614881. [Google Scholar]
- Ponte, J.P. Gestão Curricular em Matemática; Associação dos Professores de Matemática: Lisboa, Portugal, 2005; pp. 11–34. ISBN 972-8768-16-8. [Google Scholar]
- Ponte, J.P.; Brocardo, J.; Oliveira, H. Investigações Matemáticas na Sala de Aula, 1st ed.; Autêntica: Belo Horizonte, Brasil, 2003. [Google Scholar]
- Santos, R.F.M. O Conhecimento de Estatística e da sua Didática de Futuros Professores. Ph.D. Thesis, Universidade de Lisboa, Lisboa, Portugal, 2015. [Google Scholar]
- Almeida, M.R. Imagens Sobre o Ensino e a Aprendizagem da Estatística; Instituto de Inovação Educacional: Lisboa, Portugal, 2002. [Google Scholar]
- Dias, E.; Viseu, F.; Cunha, M.C.; Martins, P.M. A natureza das tarefas e o envolvimento dos alunos nas atividades da aula de matemática. In Proceedings of the Atas do XII Congresso Internacional Galego-Português de Psicopedagogia, Braga, Portugal, 11–13 September 2013. [Google Scholar]
- Vara Pires, M. Investigações matemáticas: Aprender matemática com compreensão. Saber Educ. 2015, 20, 42–51. [Google Scholar] [CrossRef]
- MacGillivray, H.; Pereira-Mendoza, L. Teaching statistical thinking through investigative projects. In Teaching Statistics in School Mathematics—Challenges for Teaching and Teacher Education: A Joint ICMI/IASE Study: The 18th ICMI Study; Burrill, G., Reading, C., Batanero, C., Eds.; Springer: Berlin/Heidelberg, Germany, 2011; pp. 109–120. [Google Scholar]
- NCTM. Principles and Standards for School Mathematics; National Council of Teachers of Mathematics, Inc.: Reston, VA, USA, 2002; ISBN 0-87353-480-8. [Google Scholar]
- Gal, I. Understanding statistical literacy: About knowledge of contexts and models. In Proceedings of the Actas del Tercer Congreso Internacional Virtual de Educación Estadística (CIVEEST), Granada, Spain, 21–24 February 2019. [Google Scholar]
- Gould, R. Data literacy is statistical literacy. Stat. Educ. Res. J. 2017, 16, 22–25. [Google Scholar] [CrossRef]
- Fernandes, J.A.; Portela, J. Elementos de estatística descritiva—A folha de cálculo no estudo de estatística. In Elementos da Matemática para Professores do Ensino Básico; Palhares, P., Ed.; Lidel: Lisboa, Portugal, 2004; pp. 53–112. [Google Scholar]
- Sousa, O. Investigações estatísticas no 6.º ano. In Reflectir e Investigar Sobre a Prática Profissional; GTI, Ed.; Associação dos Professores de Matemática: Lisboa, Portugal, 2002; pp. 75–97. [Google Scholar]
- Martins, M.E.; Ponte, J.P. Organização e Tratamento de Dados; Ministério da Educação, Direcção-Geral de Inovação e Desenvolvimento Curricular: Lisboa, Portugal, 2010. [Google Scholar]
- Martins, M.E.G.; Loura, L.C.C.; Mendes, M.F. Análise de Dados: Texto de apoio Para Professores do 1.º ciclo; Ministério da Educação, Direcção-Geral de Inovação e Desenvolvimento Curricular: Lisboa, Portugal, 2007. [Google Scholar]
- Fernandes, J.A.; Carvalho, C.F.; Correia, P.F. Contributos para a Caracterização do Ensino da Estatística nas Escolas. Bolema 2011, 24, 585–606. Available online: https://www.periodicos.rc.biblioteca.unesp.br/index.php/bolema/article/view/5109 (accessed on 3 June 2022).
- Batanero, C.; Godino, J.D. Prespectivas de la esducación estadística como área de investigación. In Líneas de Investigacional en Didática de las Matemáticas; Luengo, R., Ed.; Universidad de Extremadura: Extremadura, Spain, 2005; pp. 203–226. [Google Scholar]
- Ponte, J.P.; Fonseca, H. Orientações curriculares para o ensino da estatística: Análise comparativa de três países. Quadrante 2001, 10, 93–115. [Google Scholar]
- Alsina, A.; Annexa, E. Estadistica en contexto: Desarrollando un enfoque escolar comun para promover la alfabetizacion. TANGRAM 2021, 4, 71–98. [Google Scholar] [CrossRef]
- Branco, J.A. Mudanças no Ensino da Estatística. Bol. Soc. Port. Estatística, 2006; 19–23. [Google Scholar]
- Batanero, C.; Godino, J.D.; Roa, R. Training teachers to teach probability. J. Stat. Educ. 2004, 12, 1–19. [Google Scholar] [CrossRef]
- Chick, H.L.; Pierce, R.U. Teaching Statistics at the primary school level: Beliefs, affordances, and pedagogical content knowledge. In Proceedings of the ICMI Study 18, Monterrey, Mexico, 30 June–4 July 2008. [Google Scholar]
- Gal, I. Adults’ statistical literacy: Meanings, components, responsabilities. Int. Stat. Rev. 2002, 70, 1–25. [Google Scholar] [CrossRef]
- Garfield, J.; Franklin, C. Assessment of learning, for learning, and as learning in Statistics Education. In Teaching Statistics in School Mathematics—Challenges for Teaching and Teacher Education: A Joint ICMI/IASE Study; Batanero, C., Burril, G., Reading, C., Eds.; Springer: Dordrecht, The Netherlands, 2011; pp. 133–145. [Google Scholar]
- Rumsey, D.J. Statistical Literacy as a Goal for Introductory Statistics Courses. J. Stat. Educ. 2002, 10, 1–12. [Google Scholar] [CrossRef]
- Curcio, F. Developing Graph Comprehension: Elementary and Middle School Activities; NCTM: Reston, VA, USA, 1994. [Google Scholar]
- Santos, L.; Brocardo, J.; Pires, M.; Rosendo, A.I. Investigações matemáticas na aprendizagem do 2.º ciclo do ensino básico ao ensino superior. In Actividades de Investigação na Aprendizagem da Matemática e na Formação de Professores; Ponte, J.P., Costa, C., Rosendo, A.I., Maia, E., Figueiredo, N., Dionísio, A.F., Eds.; Secção de Educação Matemática da Sociedade Portuguesa de Ciências da Educação: Lisboa, Portugal, 2002; pp. 83–106. [Google Scholar]
- Brocardo, J. As Investigações na Aula de Matemática: Um Projecto Curricular no 8.º ano. Ph.D. Thesis; Universidade de Lisboa: Lisboa, Portugal, 2001. [Google Scholar]
- Fertuzinhos, M.L.R. As Tarefas de Natureza Investigativa na Aprendizagem de Conteúdos do Tema Funções do 10.º ano; Master´s Thesis, Universidade do Minho: Braga, Portugal, 2014. [Google Scholar]
- Ernest, P. Investigações, resolução de problemas e pedagogia. In Investigar para Aprender Matemática: Textos Selecionados; Abrantes, P., Leal, L., Ponte, J.P., Eds.; APM: Lisboa, Portugal, 1996; pp. 25–47. [Google Scholar]
- Serrazina, L.; Vale, I.; Fonseca, H.; Pimentel, T. Investigações matemáticas e profissionais na formação de professores. In Actividades de Investigação na Aprendizagem da Matemática e na Formação de Professores; Ponte, J.P., Costa, C., Rosendo, A.I., Maia, E., Figueiredo, N., Dionísio, A.F., Eds.; Secção de Educação Matemática da Sociedade Portuguesa de Ciências da Educação: Lisboa, Portugal, 2002; pp. 41–58. [Google Scholar]
- Batanero, C.; Arteaga, P.; Gea, M.M. El Currículo de estadística: Reflexiones desde uma prespectiva internacional. UNO 2012, 59, 9–17. [Google Scholar]
- PfannKuch, M.; Horring, J. Developing statistical thinking in a secondary school: A collaborative curriculum development. In Curricular Development in Statistics Education International Associations for Statistical Educacion; Burril, G., Camden, M., Eds.; International Statistical Institute: Lund, Sweden, 2004; pp. 204–218. [Google Scholar]
- Wild, C.J.; Pfannkuch, M. Statistical thinking in empirical enquiry. Int. Stat. Rev. 1999, 67, 223–265. [Google Scholar] [CrossRef]
- Shaughnessy, J.M. Research on statistics learning and reasoning. In The Second Handbook of Research on Mathematics; Lester, F.K., Ed.; NCTM: Reston, VA, USA, 2007; pp. 957–1010. [Google Scholar]
- Burgess, T.A. Teacher Knowledge of and for Statistical Investigations. In Teaching Statistics in School Mathematics- Challenges for Teaching and Teacher Education: A Joint ICMI/IASE Study; Batanero, C., Burril, G., Reading, C., Eds.; Springer: Dordrecht, The Netherlands, 2011; pp. 259–270. [Google Scholar]
- Veia, L.; Brocardo, J.; Ponte, J.P. Uma tarefa de investigação em organização e tratamento de dados no 1. º ciclo: Realização da tarefa e reflexão da professora. In Proceedings of the Atas do XXV Seminário de Investigação em Educação Matemática, Braga, Portugal, 9–10 April 2014; Martinho, M.H., Ferreira, R.A., Boavida, A.M., Menezes, L., Eds.; 2014; pp. 229–242. [Google Scholar]
- McMillan, J.; Schumacher, S. Research in Education Evidence-Based Inquiry, 7th ed; Pearson Education Limited: London, UK, 2014. [Google Scholar]
- Cunha, C.; Galindro, P. O Cuquedo; Livros Horizonte: Lisboa, Portugal, 2011. [Google Scholar]
- Sfard, A. Thinking as Communicating: Human Development, the Growth of Discourses, and Mathematizing; Universtity Press: Cambridge, UK, 2008. [Google Scholar] [CrossRef]
- Vieira, I.S. Organização e Tratamento de Dados Estudo de Caso no 5.º ano de Escolaridade. Master’s Thesis, Instituto Politécnico de Leiria, Leiria, Portugal, 2012. [Google Scholar]
- Ponte, J.P. Investigations and explorations in the mathematics classroom. ZDM 2007, 39, 419–430. [Google Scholar] [CrossRef] [Green Version]
- Andrade, N.M.G. Aprendizagem da Estatística no 2.º ano de Escolaridade Através de Atividades Investigativas. Master’s Thesis, Universidade do Minho, Braga, Portugal, 2012. [Google Scholar]
- Fernandes, J.A.; Carvalho, C.F.; Ribeiro, S.A.L. Caracterização e implementação de tarefas de Estatística: Um exemplo no 7.º ano de escolaridade. Zetetiké 2007, 15, 27–61. [Google Scholar]
- Martins, C.; Pires, M.V.; Barros, P.M. Conhecimento estatístico: Um estudo com futuros professores. In Proceedings of the Actas do XIX Encontro de Investigação em Educação Matemática, Números e Estatística—Refletindo no Presente, Perspetivando o Futuro, Vila Real, Portugal, 6–9 July 2009; Secção de Educação Matemática da Sociedade Portuguesa de Ciências da Educação: Lisboa, Portugal, 2009; pp. 1–12. [Google Scholar]
- Carvalho, C. Interação Entre Pares: Contributos Para a Promoção do Desenvolvimento Lógico e do Desempenho Estatístico, no 7.º ano de Escolaridade. Ph.D. Thesis, Universidade de Lisboa, Lisboa, Portugal, 2001. [Google Scholar]
- Balachowski, M.M. Trends in the statistics classroom since NCTM standards. In Proceedings of the Fifth International Conference on Teaching of Statistics, Singapore, 21–26 June 1998; Volume 1, pp. 75–76. [Google Scholar]


| Types of Answer | % of Students | |||||||||||
|---|---|---|---|---|---|---|---|---|---|---|---|---|
| Pre-Test | Post-Test | |||||||||||
| 1 | 1.1 | 1.2 | 1.3 | 1.4 | 1.5 | 1 | 1.1 | 1.2 | 1.3 | 1.4 | 1.5 | |
| Correct | 15 | 100 | 30 | 75 | 10 | 5 | 95 | 100 | 100 | 100 | 100 | 95 |
| Incorrect | 85 | 0 | 70 | 25 | 70 | 60 | 5 | 0 | 0 | 0 | 0 | 5 |
| No answer | 0 | 0 | 0 | 0 | 20 | 35 | 0 | 0 | 0 | 0 | 0 | 0 |
| Types of Answer | % of Students | |||||||
|---|---|---|---|---|---|---|---|---|
| Pre-Test | Post-Test | |||||||
| 2.1 | 2.2 | 2.3 | 2.4 | 2.1 | 2.2 | 2.3 | 2.4 | |
| Correct | 85 | 10 | 10 | 0 | 100 | 100 | 100 | 100 |
| Incorrect | 15 | 90 | 85 | 15 | 0 | 0 | 0 | 0 |
| No answer | 0 | 0 | 5 | 85 | 0 | 0 | 0 | 0 |
Publisher’s Note: MDPI stays neutral with regard to jurisdictional claims in published maps and institutional affiliations. |
© 2022 by the authors. Licensee MDPI, Basel, Switzerland. This article is an open access article distributed under the terms and conditions of the Creative Commons Attribution (CC BY) license (https://creativecommons.org/licenses/by/4.0/).
Share and Cite
Silva, A.C.; Viseu, F.; Aires, A.P.; Neto, T.B. Investigative Activities for Statistics Learning with 1st Grade Portuguese Students. Educ. Sci. 2022, 12, 665. https://doi.org/10.3390/educsci12100665
Silva AC, Viseu F, Aires AP, Neto TB. Investigative Activities for Statistics Learning with 1st Grade Portuguese Students. Education Sciences. 2022; 12(10):665. https://doi.org/10.3390/educsci12100665
Chicago/Turabian StyleSilva, Ana Catarina, Floriano Viseu, Ana Paula Aires, and Teresa B. Neto. 2022. "Investigative Activities for Statistics Learning with 1st Grade Portuguese Students" Education Sciences 12, no. 10: 665. https://doi.org/10.3390/educsci12100665