1. Introduction
The most extended way to conduct classes in Engineering degrees is by following the lecturer’s method, where the teacher plays a central role in the class and the students remain as passive listeners. However, there are some discrepancies about whether this pedagogical approach is the best solution to ensure students improve their abilities in problem-solving and critical thinking. In addition, engineering teachers often face the problem of how to teach complex theoretical concepts to students who are mainly interested in solving practical problems. Previous researchers have demonstrated that a constructivist approach improves students’ learning when some actions in the class are proposed to connect previous existing experiences with newly acquired knowledge, fostering creative thinking. In this academic environment, teachers communicate in a non-centered position in the classroom, guiding students as they reach the information by themselves and develop new concepts independently [
1,
2].
The constructivist theory groups several branches of cognitive psychology. The learning process is achieved when (1) the student interacts with the object of understanding [
3], (2) it is an interaction with other students [
4], and (3) when the knowledge is significant in the learning process [
5].
The teacher, as the responsible agent for providing an effective learning environment, needs to not only identify the constructive learning process from a pedagogic point of view, but also to understand how learning development is achieved from a neuroscientific perspective. Different resources may be used during the class (sounds, images, etc.), and each of them is useful to stimulate different areas of the brain. It is well accepted in neuroscience that the brain has particular regions specialized in the processing of different sensory inputs and motor outputs, with specific areas implicated in the processing of sounds, self-posture and visual information, that is further segregated according to the nature of the stimulus (forms and faces, movements), but also in self-movement, speaking or writing. All this information converges in the hippocampus, a brain structure implicated in the formation of new memories; consequently, the more sensory and motor areas that send information to the hippocampus, the more efficient learning is [
6]. The hippocampus is also strongly connected with the amygdala and other emotion-related brain areas; thus, creating emotions in students facilitates learning achievement. Neuroscience research definitively has great potential to transform education and understanding its fundamental basics brings the ability to adapt teaching to specific subjects and students.
Considering, first, the above-cited neuroscience theories that explain that the hippocampus is more successfully stimulated when multiple sensorial insights such as the combination of voice (sound) and images (visual) are explored together, and that emotions are particularly relevant to produce new memories [
7]; second, the brain is able to process images that last for just 13 milliseconds and the eyes are able to register 36,000 visual messages per hour; and third, the so-called Z generation [
8,
9], composed of our current students, prefers visual processing information scheduled in short attention spans (snapchat stories, TikTok video, etc.), teachers could take advantage of the visual preference shown by students by combining the emotions produced when using stimulating methods with the activation of several sensory pathways, such as hearing and the different features of sight, to enhance constructive learning in class.
Mind mapping is revealed as a powerful technique to organize knowledge in a non-linear diagram, where ideas are displayed in a hierarchical structure using nodes and links. It is a tool that has been repeatedly demonstrated to have a positive impact not only in the learning process [
10,
11,
12,
13,
14], but also in developing transversal competences such as critical thinking, innovation, processing information, organization, and problem-solving. Mind maps may be designed using different colors, box sizes and shapes, and font types for different levels or branches, in a way that helps to physically represent and organize the mental sequence of concepts, thus helping the process of learning. Even though mind mapping has been demonstrated to be useful for students in some areas, an explanation of its effectiveness from a neuroscientific approach, and a demonstration of its success in the study of thermodynamics, where several concepts are difficult for students to understand, are lacking.
The main objective of the present study is to provide educators and researchers with an overview of the implementation of mind mapping in a flipping class, as an effective learning tool in the understanding of thermodynamics. This research explores the learning progress observed in Generation Z students that have used visual instruments in class, an approach that is supported from a neuroeducational point of view.
2. Literature Review
2.1. Constructivism Theory
Most extended teaching methodologies accepted at university are aligned with the Behaviorism theory in traditional teaching. Therefore, the student’s mind is considered, as John Locke claimed against Descartes and Leibnitz [
7], a ‘tabula rasa’, and learning progress is achieved through positive or negative reinforcement. Teaching is based on basic definitions and the explanation of concepts; in other words, learning is facilitated through assessments that allow practice and repetition. A clear response from the constructivist point of view is that students are not programmed like artificial machines or animals that only respond to external stimuli, but require, as rational organisms, an active role in order to learn. Therefore, the student cannot be considered a ‘tabula rasa’ because past experiences and environmental factors influence the learning process.
Constructivism explains learning as a process where a relationship between the new information and the pre-existing information in the student is connected [
15]. This constructivist learning methodology has its historical roots in genetic epistemology [
3] and some notions from cognitive psychology, social interactions [
4], significant learning [
16] and processing information theory [
17]. There is not just one constructivist theory of learning, but most constructivist theories agree with two central ideas: (1) learners are active in constructing their own knowledge; (2) social interactions are important in this process of knowledge construction [
18]. The student establishes the basis of the information, not pilling, but adding his own experience [
19,
20]. When the student identifies something new, the concept has to be linked with the existing ideas and experiences, maybe by modifying what is previously believed or even discarding the new information because it is revealed as irrelevant. In both cases, the student has an active role as creator of their own knowledge.
Therefore, when this teaching strategy is carried out in class, the teacher changes his role from an active to a passive position, acting as a facilitator. A key element in this methodology is the exploration of existing knowledge. The teacher must consider the knowledge levels of his students and then use this information to structure and reveal the new concepts using suitable materials and tasks, because prior knowledge influences new knowledge. Thus, the main objective of the teacher is to facilitate connections between new and existing knowledge, because each individual student has a different point of view on their existing knowledge and social values. The same concept may be interpreted in different ways by each student, as their subjective interpretations differ.
2.2. Neuroeducation
Because each student learns in a different way, depending on existing knowledge, social connections and other factors, as well as recent developments in non-invasive techniques to monitor brain function and associated processes during various activities, it is now possible to better understand the limits of plasticity in brain circuits and cognitive functions that are influenced by education.
There is also a practical reason to turn to neuroscience when seeking for answers to outstanding educational questions. The potential of neuroscience to serve as a platform for evidence-based education has developed a new multidiscipline called ‘neuroeducation’, where neuroscientists, psychologists, geneticists and educational researchers collaborate to match questions and answers about how the learning process could be enhanced [
21].
As stated above, the brain is organized in several different structures, such as the brainstem, the cerebellum, the diencephalon, and the most modern hemispheres [
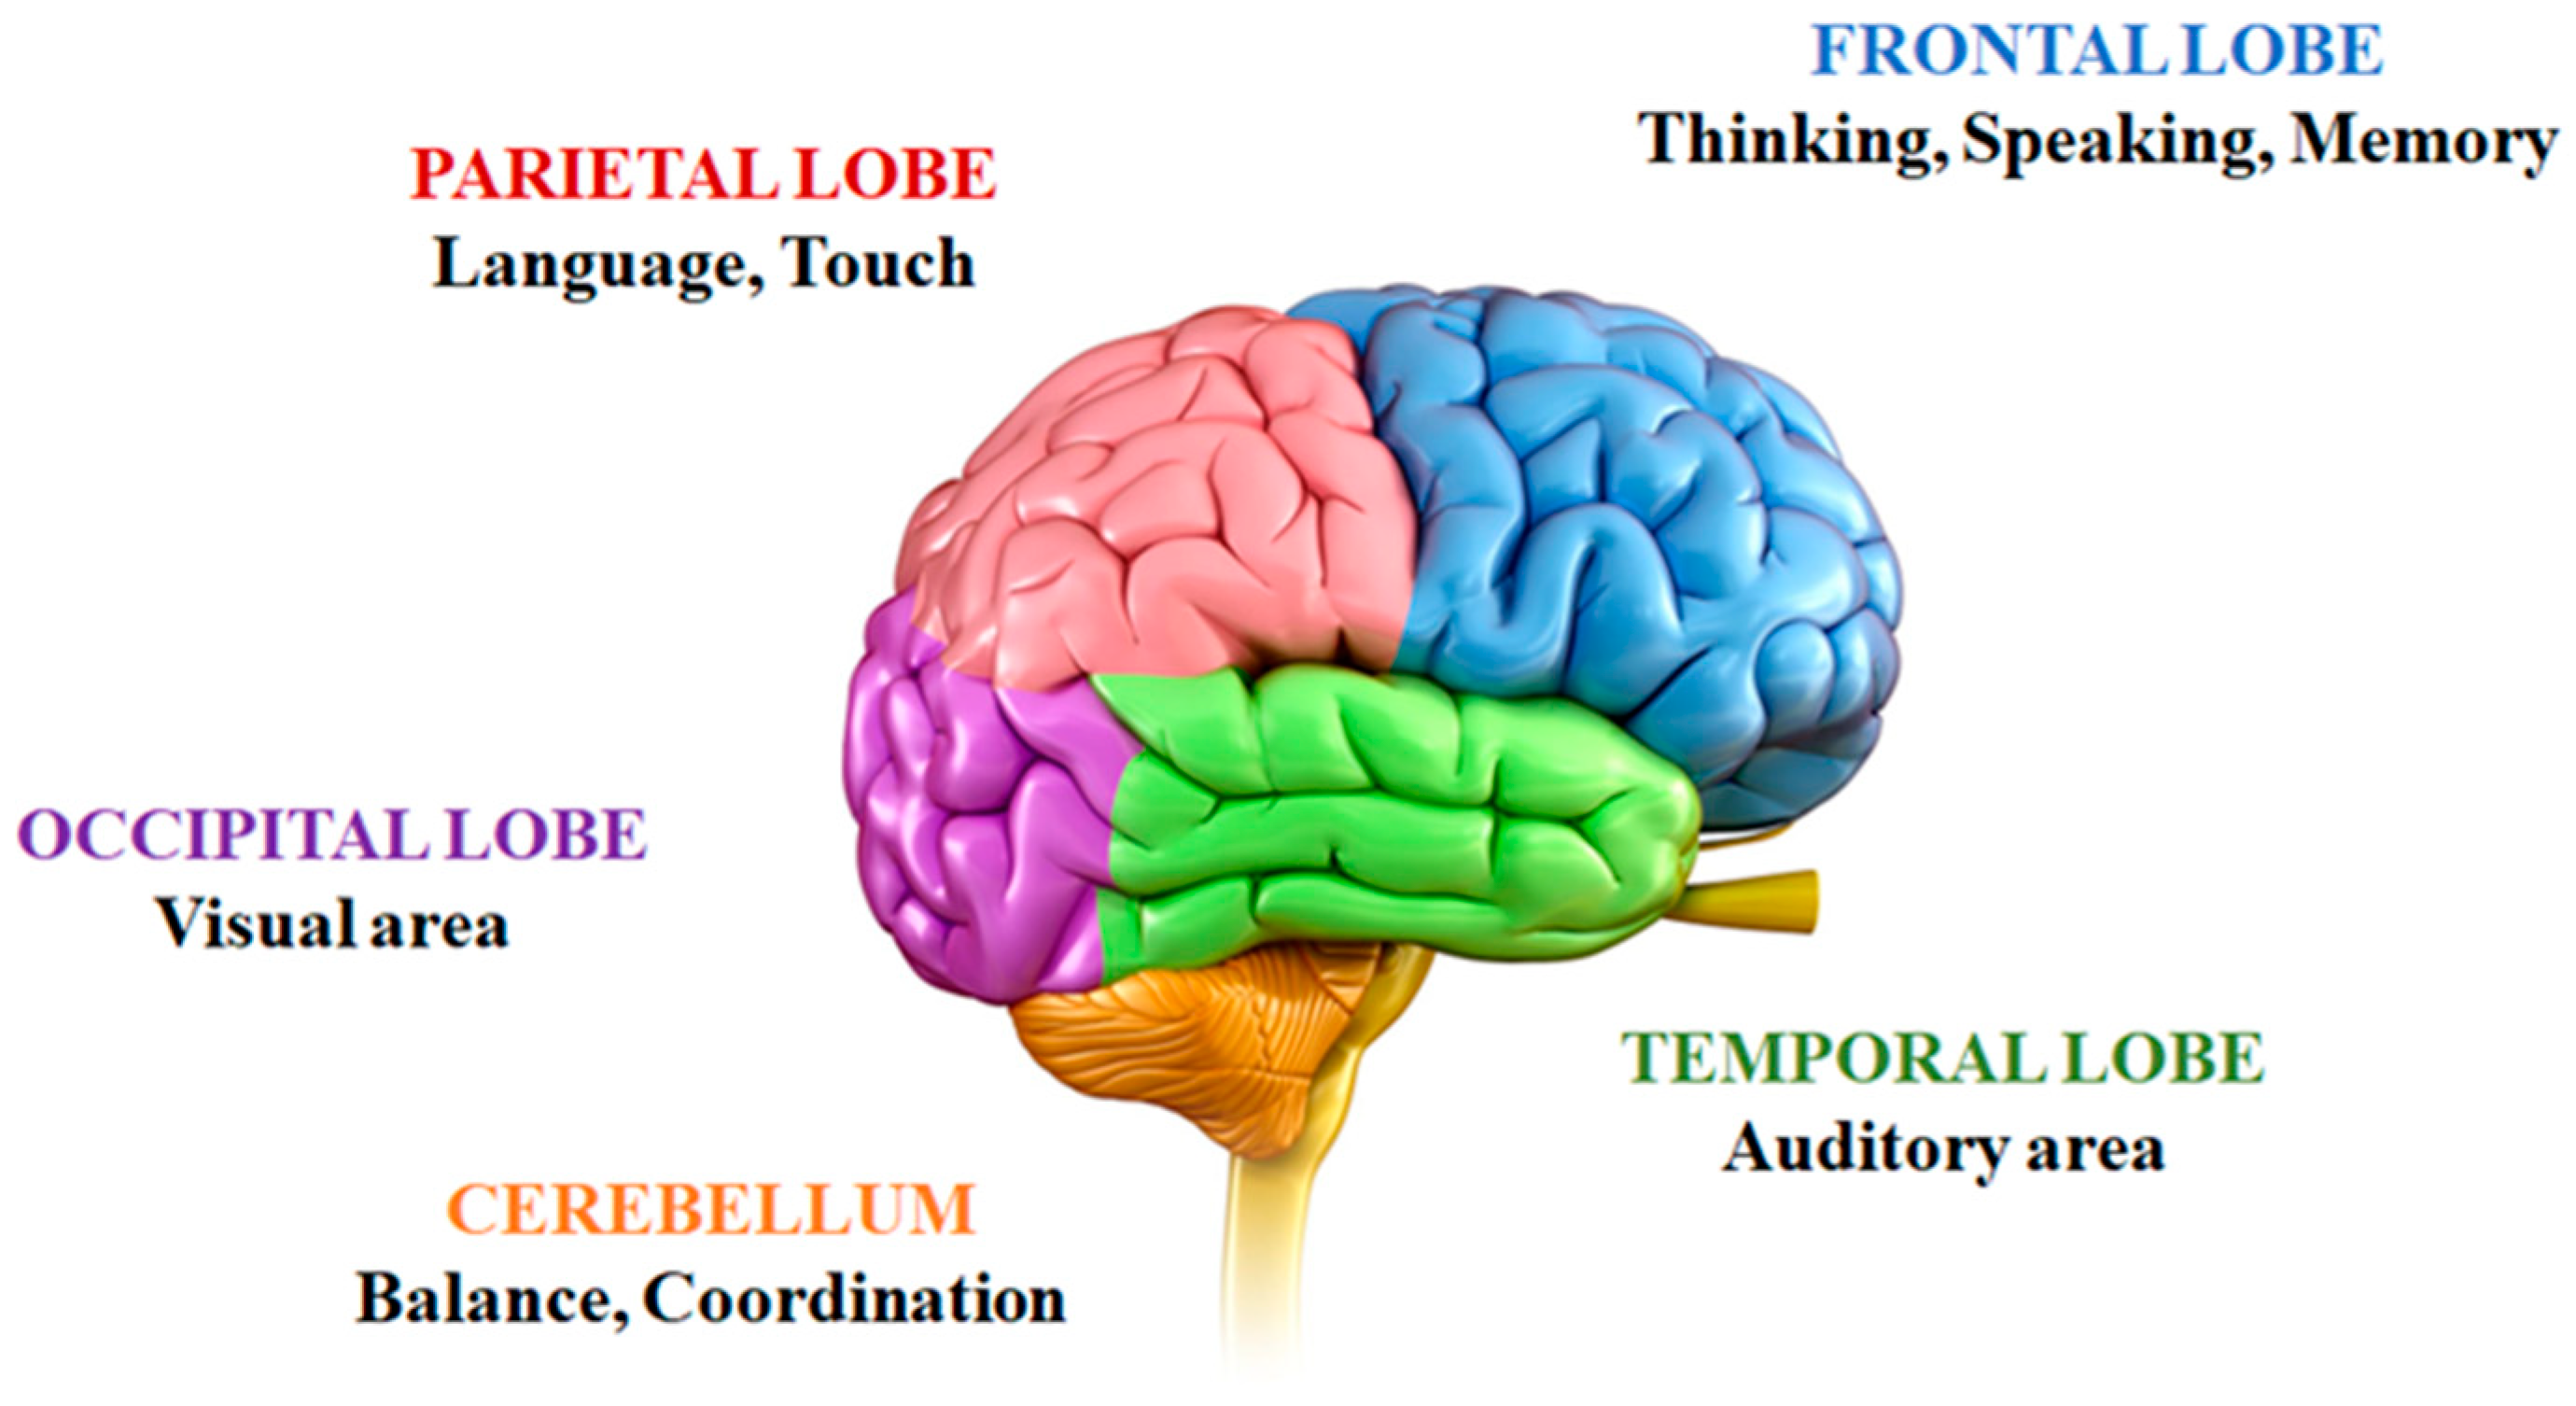
22]. Within the hemispheres, the cortex has areas specialized in single functions: hearing, touch, sight, smell, taste, decision making, organization and planification of movement, and higher cognitive functions (
Figure 1). Along with the hippocampus, the cortex is also involved in the formation and stabilization of short- and long-term memory [
23,
24]. Two main insights reinforce the idea that stimulation of the hippocampus improves the learning process. Traditionally, it was believed that a message was transmitted to students through the teacher’s voice, and then the sound signal would arrive at the hippocampus; however, neuroscientists have demonstrated that the more sensory inputs are stimulated during the process of learning, the more sensitive areas of the brain are active (sound, images, emotions, etc.), and thus the learning and memory processes become more efficient through the strengthening and weakening of neural connections [
25].
Another insight that plays an interesting role in the learning process is novelty: when new information is in contradiction with what was already stored in our memory, the new concept is permanently stored. Second, when the brain finds a match with something that is already stored, it tends to be quickly eliminated as a redundant concept. During the learning process of a new task, the more the student practices with it, the easier it will be for his brain to store this new knowledge for potential later recall. This process is called fluency. When the learning process is accomplished using different emotional resources and the student has to organize this information, for instance, by developing mind maps to visually connect the new concepts, his learning mechanism is engaged. This methodology represents a nonlinear style compared with traditional teaching methodologies; books are written linearly, our notes and summaries are most likely composed in a linear fashion, one word after the other. The traditional methodology seeks for the maintenance of a linear learning method, although the brain does not work this way, but in a series of links and connections [
27]. In contrast, mind maps have the powerful advantage of showing information in a nonlinear way, pointing out relationships between different concepts and highlighting with colors or shapes their relative importance. Neuroeducation complements the constructive aspect of learning well: the building up of ever more complex schemas through the gradual formation of overlapping partial representations of the world. It explains, from a neurophysiological perspective, the constructivist ideas that social context and pre-existing knowledge are fundamental pillars to build new knowledge through the creation of neural connections.
2.3. Mind Maps
Mind maps were developed by the English psychologist, mathematician, and brain researcher Tony Buzan in the late 1960s [
28] as a technique to facilitate information storage and organizing it according to some priorities, using keywords and key concepts. Mind maps are considered a visual tool which can provide preliminary information, thoughts, explanations, and cognitive and conceptual relations for students during the conceptual understanding processes. Another advantage is that mind maps facilitate the association between current and new information.
Mind maps and visual resources are well aligned with the constructivism theory: The composition and organization of prior knowledge are critically important for effective learning. Language and culture influence the human ability to understand, experience and communicate, and sometimes these elements represent a psychological barrier between students and teachers. However, this barrier might be minimized when alternative resources like images are used as a vehicle to transfer knowledge, and what is more important, when those images are self-assembled by students designing their own mind maps. Mind maps allow students to capture ideas and integrate them in a non-fixed or prescribed order, using multiple senses to organize the information according to their personal logical criteria. The concept of students creating their own mind maps aligns seamlessly with the principles of constructivist theories, wherein learners create knowledge and understanding by building upon what they already know; this approach grants them greater autonomy over their own learning process. There are previous research articles that analyze the impact of this methodology on different subjects [
23,
24,
27,
29].
As a consequence, mind maps also encourage creative problem-solving, as they hold information in a particular style that facilitates the easy remembering of information. Problem-solving and criticism are two of the most important capabilities demanded today by younger students for successful incorporation into the professional market.
Current students in universities represent the so-called ‘Generation Z’. It is well accepted that they are characterized by the demand for social interactions, more than other features. In this context, it is understood that students have to be active during the learning process: they have to participate in the class, providing their own insights, and comparing to their colleagues’ experiences. This scenario is not fully compatible with linear lecture sessions, and the students need to receive some resources to work with new concepts, fill the gaps in their knowledge, and connect with their pre-existing ideas. As part of their social interactions, images represent one of the most important elements in connecting with their equals. Neuroscience explains this behavior through the mirror neurons, a group of nerve cells that are active both when we execute an action and when we observe how another person performs the same action, allowing us not only to imitate behavior, but also to understand what is happening to the people around us. Mind maps are consistent with these requirements, as this methodology considers the main elements to be attractive for this new generation of students: visual resources, interactions, non-linear learning process, and the capability to adapt the new concepts to their individual pre-existing ideas. This environment allows reciprocal teaching, in line with Vygotsky’s constructivist theory, allowing the creation of a dialogue between students and the teacher in a two-way communication channel, encouraging students to go beyond answering questions and engage in discourse. Note again the consistency between the terms discussed: constructivism, neuroeducation, and mind maps.
Finally, mind maps have another identity that neuroscientists have explained to be positive to attract the attention of the students: emotion management. According to Poria [
28], emotion is intrinsic to human activities, but teaching is also considered an emotional practice, in which emotions play a vital role in efficient and cognitive learning processes. The brain needs to be emotionally excited to learn. Therefore, learning that is associated with emotions is more productive (
Figure 2); novelty, surprise, curiosity, and creativity have been found to feed emotions and facilitate a more enduring and higher-quality learning.
As a summary, some of the main advantages of using visual resources and allowing the students to organize themselves using mind Maps is that the brain is more able to learn if it is stimulated by as many senses as possible. That is to say, information is not only received through one sense, for example, sight or hearing as in traditional lectures, but through multiple senses, which are not often drawn on for effective teaching.
In this research study, we present class experiences using the combination of mind maps using the flipped class approach, in the context of thermodynamics subjects in second-year engineering undergraduate classes at the University of Seville (Spain). Typically, the concepts of this subject represent difficulties for the students to understand. Several topics like physics, chemistry, and mathematics are joined in the theory of this subject, and frequently the main output of thermodynamics is diluted in this abstract scenario. As a result, students find it hard to apply thermodynamic rules to more complex engineering problems. More specifically, a mind-mapping methodology was used to encourage creativity and problem-solving skills, while also being the best vehicle to share opinions during discussions.
3. Objectives and Methodology
The mind mapping explored in this study had several objectives. First, the main objective was to analyze whether the use of visual resources improves the understanding of thermodynamic concepts, and to correlate them among other engineering topics. A secondary objective was to enhance transversal competences of the students based on team working, public exposition, and critical thinking.
To achieve both objectives, the experiments designed involved 152 students. Thermodynamics was the subject selected to carry out this research case, and this subject is exposed in the second-year course of the Engineering Degree at the University of Seville (Spain). Thermodynamics represents a fundamental pillar of all engineering disciplines, but students often do not understand thermodynamic principles [
30], generating low expectations and frustration with this subject. Some efforts have been published to help students understand thermodynamic principles and teach them how to apply them to applied situations. Some examples can be found from Kelly [
31], who developed a virtual power plant website, and Cox [
32], who designed an interactive applet using engine cycles, as well as the interactive software developed by Junglas [
33].
Prior to this experience, teachers explained this subject using a traditional lecturing methodology: theoretical concepts are explained, mathematical demonstration is developed on the blackboard, and practical exercises are proposed and solved during the class using the blackboard. In all these activities, the teacher has an active role, meanwhile, students remain assuming a passive role. The main drawback of this methodology is the impossibility to monitor the learning progress of each student and to identify if any of them need extra explanations.
Students were split into two independent groups to evaluate the methodology: the first group followed the subject based on traditional lectures, meanwhile, the second group adopted the novel methodology: mind maps to improve sensorial insights in the brain. During the experiment, students attend some quantitative surveys defined on the basis of the thermodynamic concepts to evaluate the progress achieved, plus other qualitative questionnaires, which serve to evaluate the quality of the teaching model in class. According to Rowley [
34], the questionnaire should be designed to collect accurate and reliable information about the experiment. The following phases were followed to define the questionnaires:
Set up objectives:
To determine the pre-existing knowledge about thermodynamics.
To identify the learning progress about thermodynamics.
To analyze how students correlated thermodynamics with other engineering topics.
To figure out the preferred teaching methodology by students.
Planning and implementation of questionnaires, including a trial test to verify that the forms are free from errors and ambiguities.
Quality analysis of the questionnaire.
Reliability analysis of the questionnaire: internal consistency with Cronbach alpha over 0.85
To monitor learning performance, three questionnaires (
Table 1,
Table 2 and
Table 3) were handed to the students: one at the beginning, one during the activity, and one at the end. The purpose of these surveys was to evaluate pre-existing knowledge and the new concepts learnt during the experience. The first consisted of a set of general questions to identify their lack of knowledge; the aim of these questions is to motivate the students and to seek understanding of those missing concepts needed to solve the initial question of the subject. The other questionnaires addressed more specific concerns about concepts explained during the module.
At the end of the experience, the students completed another survey, consisting of 13 items, related to the quality of the pedagogical methodology (
Table 4). Each statement was rated on a five-point (1 to 5) Likert scale, with a high score of five indicating strongly agreeing with that statement. Before performing the analysis, the precision of the collected data, normality and outliers were normally distributed, and the skewness and kurtosis statistics showed values within the range of +/−2.
On the other hand, the pedagogical model implemented in the control group was based on traditional lectures where the active role is assumed only by the teacher. A low weight of emotions is observed in the students and there is no evidence of the learning progress achieved in the students during the session.
Data collected were also subjected to one factor analysis [
35] to determine the smaller set of variables to explore the underlying theoretical structure of the experiment, determining the potential relationship between variables. Internal consistency, which requires at least two items per domain, was assessed on a multi-item domain at baseline using Cronbach’s alpha. According to Cochran [
36], the selected sample size represents that the results can be extended to a population level of up to 700 students with a 95% standard deviation and a +/−3.5 degree of accuracy.
4. Results and Discussion
The starting point of this research was based on a constructive approach to the application of mind maps in the teaching of thermodynamics. The aim of this teaching research was not to replace lectures but to combine them with visual techniques that are better suited for Generation Z, in order to facilitate their comprehension and enhance transversal competences. During this experience, the pedagogical model implemented consisted of the following stages:
The session starts with one question related to the topic to be introduced and related to any recently published challenge (key point 1—emotion: curiosity). For example, students were asked: ‘If you have any amount of energy, which nature of energy would you prefer: heat or work? Why?’ Students wonder what they know and try to connect their knowledge with the new concept (key point 2—constructivism: Piaget, pre-existing knowledge). Open discussion arises to align ideas and proposed questions (key point 3—constructivism: Vygotski, social interactions), and during the debate, the teacher points out the main related topics (key point 4—constructivism: Norman, information is processed).
Secondly, the teacher analyzes principal ideas selected during the discussion and explains concepts.
Hereafter, students develop a mind map that selects principal and secondary concepts and shows how they are interconnected. To achieve this, each student selected different rules, such as colors, symbols, font size, etc.
Finally, some of the students presented their mind maps to the audience. This exercise improved the learning process because when the student explains his/her mind map, the ideas must be preorganized, which positively influences long-term memory. Moreover, from the audience’s point of view, it is easier to establish connections with the speaker when they share the same generation, wording and way of speaking. Therefore, in the end, the message is better received by the rest of the colleagues than when the teacher delivers the message.
Elaborating mind maps requires technique and time to achieve a good representation of the selected concepts (symbol selection, font size, colors, etc.). When the student is thinking about this selection, the concept is repeated internally many times. This repetition reinforces long-term memory, making this task beneficial from a learning-process perspective.
Figure 3 illustrates an example of the mind maps generated during a session.
According to Dhindsa [
10], the use of mind maps should help students ‘understand, better integrate scientific information into stable knowledge structures in memory’. One additional advantage of this exercise is the development of transversal competences, such as the following soft skills: clarity of expression, ability to argue, discuss different aspects of the problem in a group, planning strategies to tackle the objectives, organization, adaptability, etc. A second advantage is also observed during the team-working period: the teacher has closer contact with the students, allowing them to enquire about the student’s understanding of the concepts. This scenario provides a suitable framework to detect any lack of knowledge and work with alternative resources to reinforce learning. Finally, collaborative activity improves social interactions. Generation Z students need to feel as if they are a part of a group, and according to the neuroeducation trend, this emotional connection helps the learning process by ensuring knowledge acquisition and retention.
Figure 4 shows the results obtained from the questionnaires described in
Table 1 to
Table 3, comparing the groups of students. It is observed that pre-existing knowledge, measured through the answers collected in questionnaire described in
Table 1, is similar in both groups. Students using mind maps obtained better marks at the end of the experiment when filling in the questionnaire described in
Table 3. But, the most relevant result is observed when the intermediate survey, described in
Table 2, is compared between both groups of students because the control group has clearly lower qualifications. Results suggest that the use of visual resources developed by using mind maps may have contributed to a deeper and more continuous learning process, resulting in better performance in the intermediate survey. Meanwhile, the control group may have focused more on memorization and passing the exam, leading to lower scores in the intermediate survey (described in
Table 2).
It has been reported [
37,
38] that in terms of ensuring long-term memory, the best approach is to maintain a continuous level of progress on the learning curve.
Based on the results illustrated in
Figure 4, the following conclusions are deduced:
Content is achieved in the right context and the more aligned it is with the expectations of the students, the higher the learning performance. In this way, the starting question must elicit curiosity from the students.
The problem to be solved must be a challenge to ensure that students use the context exposed during the class but also soft skills (critical thinking, creativity, and analysis).
Students must assume an active role acting as real researchers trying to find the optimum solution to the challenge.
The learning progress was stronger in the group of students working with mind maps. Motivation, the desire to do things for their inherent joy and pleasure, is an essential element for learning at any level of education but is a priority at the university level. During engineering education, one often observes a gap between the application-orientated expectations of the student and the theory-focused content explained by the teacher, which finally is the main cause of demotivation in students. These results demonstrate that when sensorial insights explode during class, the student improves the learning performance.
Visual resources used to transfer new knowledge to students induce positive, neutral, or negative feelings, and those reactions stimulate different areas of the brain. The hippocampus is activated in response to images that create positive feelings (for example, mind maps), which improves memory processes and learning; on the other hand, when the student feels negative feelings because the visual message received does not rouse any curiosity (for example, the blackboard), the amygdala is activated, limiting the flow of neural connections to the frontal lobe. The amygdala works as a switch to send the information to different areas of the brain, and it is suppressed when the student is bored, stressed, or frustrated [
39].
Factor analysis is a method used to group a large number of variables into different categories or components. This method allowed us to categorize the questions in the questionnaire into different parameters, with the advantage of extracting a few factors from the large number of related variables to obtain a more manageable number. The statistical package included in the SPSS software (version 29) was used to carry out this analysis.
The Pearson correlation coefficient > 0.3 was achieved in the correlation matrix, which reveals the strength of the relationship between the elements. The value of the determinant is an important test for multicollinearity. The determinant score of the correlation matrix was 0.021 > 0.00001, so no multicollinearity was observed in the data set. Kaiser–Meyer–Olkin (KMO) statistics were equal to 0.764 > 0.6 which indicates that sampling was adequate, and factor analysis was appropriate for the data. A KMO value close to one indicates that the correlation is compact enough to generate reliable factors [
40].
Hereafter, factor analysis allows grouping of the initial items into four categories or dimensions, which showed the capability to have 66.09% of the total variance. Category 1 labelled “visual insight” considered four items (Item 1, Item 9, Item 10, and Item 13) that explains 22.14% of the variance; these items are related to the importance of using visual information to create links between pre-existing and new knowledge. Category 2, labelled ‘Motivation’, considered four items (Item 3, Item 4, Item 11, and Item 12) which covers 18.72% of the variance; these items are related to curiosity to learn new concepts. Category 3, labelled “Applicability”, included two items (Item 2, and Item 7), which explains 13.68% of the variance; these items are related to the interest in identifying the problem to be solved and how to apply the required theoretical concepts. Finally, Category 4, labelled ‘Critical thinking’, considered three items (Item 5, Item 6, and Item 8), which describe 11.55% of the variance; these items are related to the ability to argue your thoughts and to understand different points of view from your colleagues.
Figure 5 illustrates the model generated through the analysis described.
Once the factor analysis was completed, the internal consistency test (Cronbach’s Alpha) was calculated, obtaining a value of 0.84 which revealed good internal consistency. According to Shelby [
41], reliability coefficients between 0.6 and 0.85 are considered optimal.
The results of this experiment have confirmed a four-factor structure related to the mechanism of learning (visual insights are preferred over traditional lectures), the capability of creating curiosity, which boosts the motivation to learn, and finally technical competences (identification of the problem and applying theoretical concepts to find the proper solution) and social competences (communication and interaction with other students). Category 1 ‘Visual Insights’ is in line with the work reported by Gomes [
29]; unlike conventional linear information transfer mechanisms, mind maps allow students to organize the information intuitively according to the self-importance of the knowledge of each student (which is not necessarily universal) by grouping in proper categories, pointing out with symbols, colors or areas, etc. Category 2 ‘Motivation’, aligned with Baena-Extremera [
42], explains that the learning progress is facilitated when the student is motivated, as a consequence of the recompense mechanism enabled in brain areas: curiosity has two major impacts on the student: (1) it activates the reward circuit, which improves executive functions in the brain, more specifically the ventral tegmental area that activates dopaminergic neurons; (2) it deactivates the usual neuronal network, so attention to learn is enhanced. Category 3 ‘Applicability’ is in line with Ponsa [
43]; the ability to apply new knowledge to real engineering cases represents a way to enhance understanding of what is learnt in action. The purpose of knowledge is to aquire it, understand it, and then apply it. Clearly, Category 2 and Category 3 are also well correlated. Category 4 ‘Critical Thinking’ points out the high demand for transversal soft skills by society today, as mentioned by Caeiro-Rodriguez [
44]; The implementation of these teaching methodologies positively impacted students’ abilities of empathy, social interaction, independent and autonomous learning and openness to criticism. These soft skills will complement technical competencies, enabling individuals to become proficient problem solvers capable of working in multidisciplinary teams and adapting to new environments or technologies.
The concept of mind maps and working with visual resources offers students a new perspective to begin exploring a familiar area of knowledge. This makes it easier for students to create some hierarchical structures that limit their domain of knowledge to the first general concept. During the creation of mind maps, the students are also familiar with the key concepts. Then, the golden rule for properly connecting all these new key concepts is to link words that help to identify certain relationships between the concepts. A powerful advantage of this technique is that the student minimizes the work of memorizing equations. New capabilities that are not typically developed through traditional lectures were observed in the students. When students work in small groups and collaborate to understand the subject matter, positive cognitive and affective outcomes are achieved.
The quality questionnaire (described in
Table 4) results indicated that the majority of students were satisfied with this new teaching methodology and that the concepts were well understood by a significant portion of the student population. Additionally, the learning progress was better in the group using mind maps than in the control group following traditional lectures. The greatest challenge is to change the traditional teaching methodology at the University, and this approach may represent an improvement in teaching that could be applied transversally to multiple courses.


 ,
, 


