Abstract
Control–value theory (CVT) proposes that discrete emotions arise from combinations of control–value appraisals of learning activities and outcomes. Studies have supported this proposition using factor analytic and latent profile, analyses. Network analysis (NA), however, has not been widely used within the field of educational psychology or to investigate the propositions of CVT. In the present study we set out to examine how control–value appraisals related to three commonly experienced classroom emotions, enjoyment, boredom, and pride, using network analysis. In addition, we included positive and negative facets of value. The sample comprised 170 students (53.5% female) in their first year of secondary education who responded to survey items in a cross-sectional design. NA shows a two-dimensional graphical network of items (edges) and the relations between them (edges). In addition, statistical indices can be used to identify those nodes that show numerous or strong links to others or bridge clusters (communities) of nodes. The NA demonstrated that emotions and value (positive and negative) but not control cohered into distinct communities. Many, but not all, edges were in support of CVT; there were positive links between control/positive value and enjoyment and pride, and negative links for boredom, as well as negative links between negative value and enjoyment and pride, and positive links for boredom. Three control–value nodes were particularly influential: that lessons were important/valuable (positively) and that work required too much time (negatively). Interventions and classroom instructional strategies that build value/importance and reduce perceptions of time cost may be particularly effective in facilitating positive emotions and reducing negative emotions.
Keywords:
achievement emotions; control–value theory; network analysis; cost; enjoyment; boredom; pride 1. Introduction
Based on the control–value theory (CVT) of achievement emotions, [1] the present study investigates the relations between three achievement emotions in the classroom (enjoyment, boredom, and pride) and appraisals of control and value. The emotions experienced when learning are important outcomes in themselves. Educators, parents, and not least students themselves prefer experiencing positive rather than negative emotions when learning. However, there are also important motivational, regulative, and information processing effects of emotions that influence the quality of learning and achievement. For instance, emotions can determine the subsequent use of cognitive and metacognitive learning strategies [2] and performance in problem-solving tasks [3]. Moreover, positive emotions can broaden one’s thought–action repertoire, leading to the acquisition of lasting personal resources including resilience, knowledge, and social support networks [4]. Accordingly, it is of practical and substantive value to understand the networks of inter-relations between control–value appraisals and emotions.
Existing studies have shown how enjoyment, boredom, and pride, among other emotions, arise from combinations of control and value appraisals [5,6,7]. These, and other studies, have almost exclusively utilized factor-analytic or latent profile analyses to understand the inter-relations between control–value appraisals and emotions. Network analysis (NA) has not been widely used in the field of educational psychology, and only one study thus far has studied how control–value appraisals, along with other motivational constructs, are related to emotions [8]. In addition, few studies have examined negative facets of value, learning activities and outcomes that are undesirable (e.g., require a lot of effort). In the present study, we further understanding of control–value antecedents of three achievement emotions commonly experienced in the classroom through NA.
1.1. Control–Value Theory
Control–value theory is a theoretical framework that integrates antecedents of achievement emotions with the motivational, information processing, and self-regulative effects of those emotions [1,9,10]. Distal antecedents include the cultural, environmental, and social context of learning (e.g., school ethos and quality of instruction). Proximal antecedents are subjective appraisals of control and value over achievement-related activities and outcomes. The emotions elicited through distal and proximal antecedents are not mere endpoints in themselves but have critical functional importance for motivation, information processing, and self-regulation. Specifically, of the three emotions included in the present study, enjoyment reinforces task activity and pride task outcomes and would, therefore, sustain high-quality motivation. Boredom, on the other hand, can undermine motivation due to absence of incentives. Furthermore, enjoyment can help to keep cognitive resources focused on the task and promote self-regulation of learning. Boredom, in contrast, promotes teacher-regulation of learning. Consequently, enjoyment and pride can promote, whereas boredom can disrupt, learning and achievement.
1.2. Control and Value Appraisals
Of particular interest to the present study are the subjective control and value appraisals of achievement activities and outcomes. Control appraisals include action–control expectations and action–outcome expectations. Action–control expectation is the prospective belief that one can initiate and perform an action that is similar to self-efficacy: the belief that one can successfully perform a specific action or task [11]. Action–outcome expectation is the prospective belief that actions will result in the expected outcomes. Control can also include retrospective attributions of success and failure to ability, oneself, effort, and so on [12,13].
Value appraisals include judgements over the intrinsic or extrinsic qualities of an activity or outcome. An activity or outcome is extrinsically valued when it is judged to contribute to the attainment of a desired outcome or goal (e.g., attain a target grade). Activities/outcomes are intrinsically valued when they are neither linked to any external contingency nor contribute to a desired goal (e.g., an activity could stimulate curiosity or be perceived as interesting). Value appraisals can also be positive or negative. Activities/outcomes that are desirable to perform or attain (e.g., success) are positively valued. Outcomes that are preferable to avoid (e.g., failure) or activities that are undesirable to perform (e.g., taking up too much time, or at the expense of other preferred alternates) are negatively valued.
1.3. Achievement Emotions
Achievement emotions are those experienced in relation to activities or outcomes that are judged against standards of competence [14]. Many, but not all, of the emotions experienced in relation to teaching, learning, and testing are captured by the aforementioned definition as they involve competence judgements that can be made by students themselves or others (e.g., teachers or examiners). In classroom settings, however, students may also experience social, epistemic, and topic-related emotions. Notwithstanding a degree of overlap, these emotions can be differentiated from achievement emotions as they do not focus on standards of competence per se. Achievement emotions can also be differentiated from moods, which are typically less intense and specific, but longer lasting, than emotions [15,16].
Discrete achievement emotions can be classified according to their valence (pleasant vs. unpleasant), activation (activating vs. deactivating), and focus (activity vs. outcome) [1,17]. In the present study, we considered three achievement emotions, namely enjoyment, boredom, and pride, as they are three of the emotions most commonly experienced in classroom settings [18]. The choice of these three emotions was determined partly by substantive concerns: to include a mixture of positive and negative, activity and outcome, and activating and deactivating emotions. In addition, to limit participant burden on relatively young participants, it was necessary to limit the number of items [19], hence the decision to measure only three emotions (no others were measured). In the above arrangement, enjoyment would be classified as a pleasant, activating, activity-focused emotion. Boredom would be classified as an unpleasant, deactivating, activity-focused emotion, and pride considered as a pleasant, activating, prospective-outcome-focused emotion.
1.4. Control–Value Appraisals and Enjoyment, Boredom, and Pride
According to CVT, a student will enjoy a learning activity if it is judged to be intrinsically or extrinsically useful (i.e., high value) and they are capable of performing that activity (i.e., high control). When a learning outcome is intrinsically or extrinsically valued (i.e., high value) and the student believes success is within their reach (i.e., high control), pride will arise. Boredom will arise when a learning activity is perceived as meaningless (i.e., the absence of value), or when task demands are judged as being too easy or too hard to ever succeed (i.e., very high or low control).
Numerous studies have supported these fundamental propositions of CVT regarding enjoyment, boredom, and pride, arising from control–value appraisals, using variable-centered analyses based on cross-sectional or longitudinal/prospective designs in students of all ages and stages of schooling. Pekrun et al. [13] and Bieleke et al. [20], for instance, found that control and value appraisals were positively related to enjoyment and pride, and negatively related to boredom, in samples of university students. The same pattern of correlations was shown for students in secondary education [21]. In samples of primary/elementary school students, the expected pattern of relations was shown for enjoyment and boredom [22,23]. Pride has yet to be examined for students in primary/elementary education. Furthermore, Loderer et al. [24] confirmed positive relations between enjoyment and control (r = 0.50) and value (r = 0.56) in a meta-analysis of 149 studies.
Although fewer studies have investigated how control–value appraisals interact to elicit enjoyment and pride, these too have supported CVT. In a sample of secondary students, Bieg et al. [5] found higher value to amplify the positive relation between control and pride. In university students, Goetz et al. [25] and Shao et al. [7] reported higher value to amplify the positive relations between control and enjoyment/pride. Putwain et al. [6,26] found higher value to amplify the positive relations between control and enjoyment in primary school students. Although not implied by CVT, control × value interactions for boredom were shown by Bieg et al. [5], Shao et al. [7], and Putwain et al. [26] such that boredom was maintained at higher control when combined with lower value.
Person-centered analyses to examine how emotions and control–value antecedents combine in clusters or profiles have not been widely used. In a notable exception, Parker et al. [27] used latent profile analysis to identify three clusters of enjoyment and boredom with control–value appraisals. In keeping with CVT, one profile comprised high control–value appraisals with high enjoyment and low boredom; the second profile comprised low control–moderate value with moderate enjoyment and high boredom; the third profile comprised moderate control–very low value with very low enjoyment and very high boredom.
1.5. Network Analysis
Network analysis (NA) is another analytic approach that could be used to examine achievement emotions alongside control–value antecedents. NA is a relatively novel approach that has been used in the mental health/psychopathology [28] and personality psychology [29] literature, but has not been widely used in the field of educational psychology. Notable exceptions from the field of educational psychology, described below, include Putwain et al. [30] and Tamura et al. [8]. NA is a variable-centered analysis that can establish how groups of items (referred to as nodes in NA) cohere as distinct communities, establish the relations between nodes (edges in the parlance of NA; typically based on semi-partial correlations) and the organization of nodes (or communities of nodes) within the entire network (i.e., the items included within a particular analysis), and whether certain edges bridge communities of items (referred to as bridge nodes).
Analyses can be represented graphically and with numerical indices [31]. The graphical network is instructive in showing the two-dimensional positioning of nodes. Nodes closer to the center of the network are more central and those further from the center are more peripheral; nodes placed adjacently are more closely related that those further apart. Numerical indices are helpful in identifying nodes with multiple and/or strong, direct and indirect, edges to others or those that link communities [32]. NA shares some similarities with multidimensional scaling analysis, which can be used to present correlations between items or constructs in a two-dimensional space such that highly correlated items/constructs are positioned more closely. NA differs in considering not only the position of nodes, but how they are directly and indirectly related, and whether specific nodes bridge communities of nodes.
Putwain et al. [30] examined a network comprised of test anxiety, generalized anxiety, panic disorder, and school-related wellbeing in a sample of adolescents. Nodes for the aforementioned constructs cohered into distinct communities and within test anxiety into respective cognitive and affective–physiological sub-communities. A generalized anxiety node for worry bridged communities of test anxiety, panic disorder, and the remaining generalized anxiety disorder nodes. Two other generalized anxiety nodes (both related to worry that something bad will happen) exhibited multiple strong links throughout the network.
Tamura et al. [8] used NA to examine relations between eight discrete emotions and control–value antecedents (along with other motivational constructs) in an experience-sampling study of four post-graduate researchers. Data collection involved daily prompts for single or two-item measures over a twelve-month period. In the study, students were also asked about the physical and psychological costs of their days’ work. Costs are analogous to the negative facet of value (i.e., high psychological and physical costs are desirable to avoid). In the emergent network, boredom was closely positioned to physical and psychological costs, and pride and happiness were most closely related to extrinsic values (i.e., the approval of others, aligning with personal values, and work obligations).
NA can offer a study of emotions and antecedents complementary to that of factor analysis and latent profile analysis by viewing emotions, and their antecedents, as an interconnected dynamic network. Specifically, as we have briefly demonstrated from these two brief examples, it will be possible to establish if nodes for discrete emotions and control–value antecedents cohere into distinct communities, establish the organization of those communities in a two-dimensional network, see which nodes show stronger and more numerous links to others, and see if specific nodes are bridging communities.
1.6. Aim of the Present Study
In the present study, we sought to examine what we believe to be the first NA of three commonly experienced emotions, namely enjoyment, boredom, and pride, alongside control–value antecedents. In doing so, we included a measure of effort cost as an indicator of negative value, alongside a measure of combined intrinsic/extrinsic (positive) value. With some notable exceptions (e.g., Tamura et al. [8]), few studies have examined negative value as an antecedent of achievement emotions. Based on CVT, we offer the following hypotheses:
Hypothesis 1 (H1).
Nodes of enjoyment, boredom, and pride, and control, positive value, and negative value (cost) will cohere into distinct communities;
Hypothesis 2 (H2).
Control and (positive) value will show positive edges with enjoyment and pride; cost (negative value) will show negative edges with enjoyment and pride. Control and (positive) value will show negative edges with boredom; cost (negative value) will show positive edges with boredom;
Hypothesis 3 (H3).
The graphical network will show positive emotions (enjoyment and pride) and expectancy and value positioned contiguously.
We leave as an open research question which specific node(s) show(s) the strongest and most numerous edges, and which nodes are bridges.
2. Materials and Methods
2.1. Participants and Procedure
The participants comprised 170 Year 7 students (the first year of secondary education) with a mean age of 11.2 years (SD = 0.40) from a single English secondary school. Seventy-one participants identified as male and 91 as female; one indicated their gender as “other” and seven declined to answer. Sixty participants (35.3%) were eligible for free school meals (FSM), a proxy for a low-income household. The ethnic heritage of participants was largely white Caucasian (n = 157). There were small numbers of participants from Asian (n = 1), black (n = 2), other (n = 4), and mixed heritage backgrounds (n = 7). In English secondary schools for 2021–2022 (the school year that data were collected), 18.9% of students were eligible for FSM and 66.9% were from a white Caucasian background [33]. Accordingly, the present sample was more ethnically homogenous, and economically deprived, than was nationally typical.
The participating school was involved in an ongoing project to evaluate the effectiveness of a thematic curriculum used in Year 7 called “Our Place in the Universe” (or “Our Place” for short). The “Our Place” curriculum combined geography, history, English literature, and science together in a single lesson by linking the discrete subjects to the local social, historical, and geopolitical context. The project was approved by the institutional research ethics committee of the first author (20EDN016) and students were invited to participate in the present survey as part of the “Our Place” project. Written permission was provided by the head teacher of the participating school, parents provided opt-out consent, and individual students provided written consent at the point of data collection. Data collection was conducted in a single wave during one of the “Our Place” lessons by the regular teacher following a standardized script. Participants were provided with a URL that linked to an online survey platform that contained survey questions. If participants attempted to submit their survey with one or more missing answers, they were prompted to complete the missing question, hence there were no missing data. The survey took approximately ten minutes to complete.
2.2. Measures
Participants responded to all items on a 5-point scale of 1 = strongly disagree, 3 = neither, and 5 = strongly agree. All items were responded to in the context of “Our Place” lessons and work. All items are listed in Table S1.
Control–value appraisals were measured using the 10-item expectancy–value–cost scale [34] designed for use with students in early secondary education. Items were adapted to refer to “Our Place” and match the common parlance of English education (e.g., “class” changed to “lesson”). Control was measured using the three-item expectancy subscale (e.g., “I believe that I can be successful in the work we do about Our Place in the Universe”). Positive value was measured using the three-item subjective task value subscale (e.g., “I think the lessons about Our Place in the Universe are useful”). Negative value was measured using the four-item cost subscale (e.g., “The work we do in lessons about Our Place in the Universe requires too much time”). This scale exhibited construct validity, internal consistency, and gender and longitudinal invariance in a previous study [33]. The internal consistencies were largely good (see Table 1).

Table 1.
Descriptive data for study variables and items.
Achievement emotions were measured using the class-related enjoyment, boredom, and pride scales from the Achievement Emotions Questionnaire for Pre-Adolescents (AEQ-PA [21]). Each scale comprised 4 items each that were made specific to “Our Place”. Exemplar items include “I enjoy learning about Our Place in the Universe” (enjoyment), “I find learning about Our Place in the Universe boring” (boredom), and “I take pride in being able to keep up with the work in the lessons when we learn about Our Place in the Universe” (pride). AEQ-PA has shown factorial validity, internal consistency, and predictive validity in previous studies [35,36]. In the present study, internal consistency was good (see Table 1).
2.3. Analytic Procedure
The analyses proceeded in two stages. First, in order to allow for a more conventional variable-centered presentational of how constructs were related, and as a comparison with the subsequent NA, latent bivariate correlations were estimated using a set-exploratory structural equal model (set-ESEM) in Mplus v8.3 [37]. Set-ESEM was preferred to confirmatory factor analysis (CFA) due to the likelihood of low-level cross-loading between expectancy, value, and cost items on the one hand and achievement emotion items on the other. A regular CFA constrains factor loadings for items on non-target items to zero, which can result in lower than acceptable model fit and inflated factor correlations when low-level cross-loading to non-target factors is present in the data. ESEM combines the flexibility of exploratory factor analysis (i.e., items can cross-load to non-target factors) with the parsimony of CFA (i.e., a limited, well-defined, and theoretically derived number of factors) [38,39]. Set-ESEM allows one to group items together into blocks; items can cross-load to non-target factors within the same block but not to separate theoretically distinct factors in another block. In the present study, we set two blocks, one for expectancy, value, and cost items and the second for achievement emotion items. The fit of the set-ESEM was assessed using the root mean error of approximation (RMSEA), standardized root mean residual (SRMR), confirmatory fit index (CFI), and Tucker–Lewis index (TLI). In a simulation study, Hu and Bentler [40] suggested a good fitting model shows RMSEA values ≈ 0.06, SRMR values ≈ 0.08, and CFI and TLI values ≈ 0.95.
Second, the NA was performed using the “network tools” package version 1.5.0 in R v4.2.1 [41,42]. The graphical network was estimated using the Fruchterman–Reingold algorithm [43]. This is a Gaussian model based on semi-partial correlations between pairs of nodes. Such models can be problematic by presenting all edges between nodes and making it difficult to distinguish between those that are more or less meaningful. A solution is to apply the least absolute shrinkage and selection operator (LASSO) to the Gaussian model [44]. The LASSO regularizes semi-partial correlations such that small edges are shrunken to zero. Although the result is a sparser network that contains fewer edges, those that remain are authentic and more meaningful. In the graphical networks, positive edges are represented as green, and negative edges as red, lines connecting nodes. Stronger edges are thicker.
Using the extended Bayesian information criterion (EBIC), a hyperparameter was used to set the threshold for a network with a greater number of possibly spurious edges (γ ≈ 0) versus a network with fewer, but stronger and more meaningful edges (γ ≈ 0.5). We opted for γ = 0.5 in the present study to estimate a robust model and edge weights estimated using a non-parametric bootstrapping procedure with 1000 draws [45]. For comparative purposes, we present both the network based on the semi-partial correlations as well as the LASSO estimated network.
The number and strength of edges a particular node shows with others in the network are typically estimated through centrality indices (e.g., betweenness and closeness). These statistics are only appropriate when a network contains only edges in the same direction. When a network contains a mixture of positive and negative edges, as was the expected case with ours, commonly used centrality indices can provide inaccurate estimates [32]. Accordingly, we used indices that did account for combinations of positive and negative edges, namely one- and two-step expected influence (IE1 and EI2) values [32].
EI1 identifies highly influential nodes (i.e., those that share multiple strong edges with others in the network) and is the sum of the edges shared with others within the network. A positive EI1 value indicates that positives edges outweigh negatives and a negative EI1 value indicates that negative edges outweigh positives. EI2 values represent the indirect, or secondary, influence of a node through others in the network. Similarly, we used bridge indices that account for combinations of positive and negative edges, namely one- and two-step expected bridge influence values. Bridge EI1 values are the summed edges between a particular node with others within a different community. Bridges EI2 values represent the indirect influence of a specific node to nodes in different communities via other nodes.
3. Results
3.1. Descriptive Statistics and Latent Bivariate Correlations
Table 1 shows the descriptive statistics for items and scales for expectancy, (positive) value, cost (negative value), and enjoyment, pride, and boredom. Negatively skewed and leptokurtic distributions were exhibited by expectancy items, the subscale score, and one pride item (P4). Positively skewed distributions were exhibited by two cost items (C3 and C4) and two boredom items (B2 and B4). All other items and subscale scores exhibited skewness and kurtosis within ±1. Internal consistency estimates were good (McDonald’s ω ≥ 0.83) with the exception of cost (McDonald’s ω = 0.69).
A set-ESEM, with target rotation and maximum likelihood estimation with robust standard errors to account for the skewed distribution of some items, was used to generate latent bivariate correlations. This model exhibited a relatively good fit to the data, χ2(162) = 224.44, p < 0.001, RMSEA = 0.048, SRMR = 0.035, CFI = 0.963, TLI = 0.947; coefficients are reported in Table 2. Expectancy and (positive) value correlated positively with enjoyment and pride and negatively with boredom. Cost (negative value) correlated negatively with enjoyment and pride and positively with boredom.
Table 2.
Latent bivariate correlations between study variables.
3.2. Network Analysis
3.2.1. Gaussian Graphical Model
The network based on unregularized semi-partial correlations is shown in Panel A of Figure 1 and the LASSO estimated network based on regularized semi-partial correlations is shown in Panel B. In comparison to Panel A, Panel B, where small edges were shrunken to zero, contains fewer edges. The remaining edges are typically regarded as more meaningful, non-spurious edges. In dense networks, such as that shown in Panel B however, there is an increased likelihood of false positive edges [46].
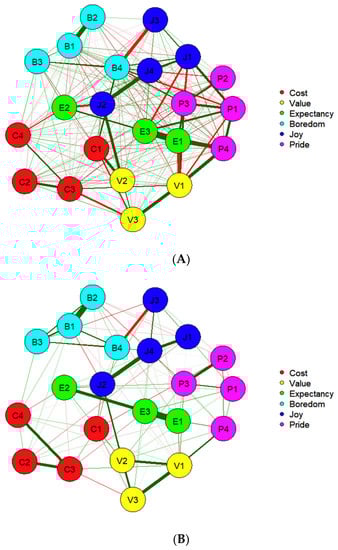
Figure 1.
Network based on unregularized (Panel A) and regularized (Panel B) semi-partial correlations. Note. Cost items C1 to C4, value items V1 to V3, expectancy items E1 to E3, enjoyment items J1 to J4, boredom items B1 to B4, and pride items P1 to P4. Positive edges are green and negative edges are red.
Given that EBIC selection has been shown to work well in retrieving network structures based on small sample sizes [47] and the application of a strong γ threshold when regularizing semi-partial correlations, false positive edges should be almost undetectable and should not impact the regular interpretation of the network. Only the smallest edges should be interpreted with caution, as they may not be well replicable.
Nonetheless, to provide a more conservative model, a thresholded EBICglasso [48] network was estimated (see Figure 2). Specifically, this imposed a thresholding rule by setting edge-weights that were not larger than the threshold to zero in both the returned final model as well the EBIC computation of all considered models. The thresholded graph is sparser. This does not imply that all deleted edges are necessarily false positives; numerous probably reflect true edges, but these are the ones that should be interpreted with caution.
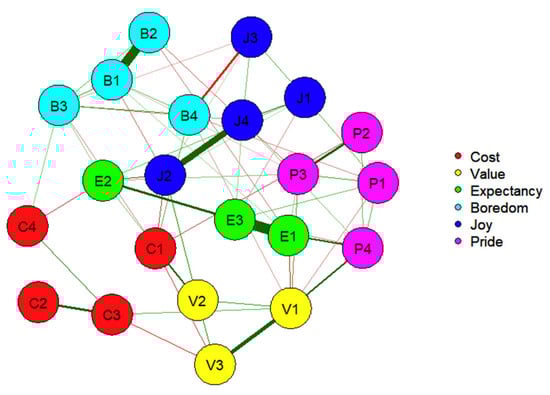
Figure 2.
Network based on thresholded EBICglasso semi-partial correlations. Note. Cost items C1 to C4, value items V1 to V3, expectancy items E1 to E3, enjoyment items J1 to J4, boredom items B1 to B4, and pride items P1 to P4. Positive edges are green and negative edges are red.
Regarding communities of control–value antecedents and achievement emotions, this network was composed with boredom, enjoyment, and pride nodes in the upper portion of the model (left to right) and cost and value items in the lower portion of the model (left to right). Expectancy items were sandwiched in between. Relatively coherent communities were found for pride, boredom, value, and cost. For enjoyment, three nodes (J1, J3, and J4: enjoyment and fun) were positioned adjacently and one node (J2: looking forward) slightly further away. J2, however, exhibited a strong positive edge to J4 to link with other enjoyment items. The organization of enjoyment was less coherent. Two nodes (E1 and E3: self-efficacy and confidence) were positioned closely and the third node (E2: success expectations) further away via a strong positive edge to E3.
3.2.2. Edges between Control–Value Antecedents and Achievement Emotions
Expectancy node E1 (self-efficacy) was positioned most closely to the pride nodes and exhibited positive edges with P3 (pride in learning) and P4 (motivated to continue learning). In addition, E1 exhibited a negative edge with boredom node B2 (boring topic matter) and an unexpected positive edge with B1 (boring lessons). Expectancy node E3 (confidence) was positioned equidistant to the pride and boredom nodes. E3 exhibited a negative edge with boredom node B4 (prefer to do something else) and, unexpectedly, a negative edge with enjoyment node J1 (enjoy lessons). Expectancy node E2 (success expectations) was located between enjoyment and boredom nodes and exhibited positive edges with J1 (enjoy lessons) and P3 (pride in learning). Unexpectedly, E2 exhibited a negative edge with J2 (look forward to lessons) and a positive edge with B3 (learning is boring).
Value node V1 (lessons are important) exhibited positive edges with P3 (pride about learning) and P4 (motivated to continue learning) and, unexpectedly, a negative edge with P1 (pride in keeping up with work). V2 (lessons are valuable) exhibited a positive edge to J2 (look forward to lessons). The positioning of value nodes at the bottom of the network and partly separated from emotion nodes (especially boredom) by expectancy and cost nodes implies the influence of value in the network is largely indirect.
Cost node C1 (work requires too much time) exhibited negative edges with P2 (proud of lessons contributions) and J2 (look forward to lessons) and a positive edge with B4 (prefer to do something else). In addition, C4 (have to give up too much) shared a positive edge with B3 (learning is boring). Unexpectedly, C1 (work requires too much time) shared a negative edge with B3 (learning is boring).
3.2.3. Expected Influence Statistics
EI1 and EI2 statistics are shown in Figure 3. V2 (lessons are valuable) demonstrated the strongest influence (i.e., number and strength of connections) throughout the network. Other nodes with a strong positive influence were E3 (confidence), J4 (learning is fun), P3 (proud of what I have learnt), and P4 (motivated to continue learning). The influence of V1 (lessons are important) was more strongly indirect (EI2 values > 1.5; EI1 values > 1). C1 (work requires too much time), J3 (enjoy learning), and B4 (prefer to do something else) were the nodes with the strongest negative influence. In addition, C2 (not enough time because of other activities) and B2 (boring topic) demonstrated an influence that was more strongly indirect (EI2 values > −1; EI1 values > −0.5).
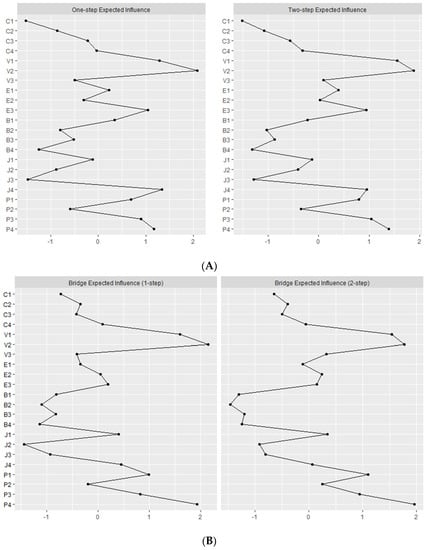
Figure 3.
One- and two-step expected influence statistics (Panel A) and bridge statistics (Panel B). Note. Cost items C1 to C4, value items V1 to V3, expectancy items E1 to E3, enjoyment items J1 to J4, boredom items B1 to B4, and pride items P1 to P4. Positive edges are green and negative edges are red.
3.2.4. Bridge Expected Influence Statistics
Bridge EI1 and EI2 statistics are also shown in Figure 3. The strongest positive bridge nodes were V1 (lessons are important), V2 (lessons are valuable), P1 (keeping up with work), P4 (motivated to continue learning), and to a lesser extent P3 (proud of learning). The strongest negative bridge nodes were J2 (look forward to lessons) and to a lesser extend J3 (enjoy learning) and all four boredom nodes (B1: lessons are boring, B2: topic is boring, B3: learning is boring, and B4: prefer to do something else). B1 and B3 had a greater indirect than direct influence. When considered alongside the visual network and EI1/EI2 indices, communities of value and pride appear to be bridged by V1 and P4. Similarly, J3 and B4 bridged communities of enjoyment and boredom, J2 and V2 bridged communities of enjoyment and value, and P3 and B2 bridged communities of pride and boredom.
4. Discussion
The aim of the present study was to examine relations between control–value antecedents and three achievement emotions, namely enjoyment, boredom, and pride. Using a traditional factor-analytic approach, control appraisals and (positive) value related positively with enjoyment and pride and negatively with boredom; cost (negative value) related negatively with enjoyment and pride and positively with boredom. Using a novel network analysis, coherent communities of nodes were found for enjoyment, boredom, pride, (positive) value, and cost (negative value), and less so for control nodes. Many, but not all, of the edges between control–value appraisals and achievement emotions were as expected, and mirrored those of the bivariate correlations. A value node exhibited the strongest positive, and a cost node the strongest negative, influence (i.e., number and strength of edges) in the network. In addition, specific nodes were identified that bridged communities of value and pride, value and enjoyment, enjoyment and boredom, and pride and boredom.
4.1. Organization of the Network
As expected, control–value appraisals were positioned in one part of the two-dimensional network towards the mid to lower portion of the graphical network and achievement emotions in the upper portion of the graphical network. Thus, control–value appraisals and achievement emotions form connected but distinct regions of the network in keeping with their differential foci. The architecture of the graphical network, therefore, supports a fundamental proposition of CVT that emotions and control–value appraisals represent separable, but related, constructs [1,9,10]. Control–value appraisals are considered within CVT to be proximal antecedents of emotions (albeit linked via reciprocal causation). Although our findings do not speak to control–value appraisals specifically as antecedents, they do show how appraisals and emotions grouped together as would be expected in CVT.
Furthermore, within the upper portion of the model, enjoyment, boredom, and pride formed distinct communities of nodes. These were positioned such that enjoyment nodes were central, with boredom nodes to the left and pride to the right. The adjacent position of enjoyment and pride nodes, with mainly positive edges, reflects their similarity, theorized in CVT, in activating positive emotions [1,14]. The adjacent position of enjoyment and boredom reflect their similarity, theorized in CVT, as activity-related achievement emotions [1,14]. The separated position of boredom and pride, and the mainly negative edges connecting them, reflects their difference, theorized in CVT, along dimensions of valence (boredom is negative and pride is positive) and activation (boredom is deactivating and pride is activating) [1,14]. The graphical network representation of enjoyment, boredom, and pride provides novel support for the classification of achievement emotions as proposed in CVT [1,9,10] and a complimentary approach to that of factor analysis [18,21].
Within the mid-lower portion of the graphical network, (positive) value and cost (negative value) were positioned as adjacent communities of nodes. This contiguous positioning represents their different facets, theorized in CVT, of value [10]. If cost (negative value) and (positive) value nodes were intermingled, this would indicate positive and negative facets of value being, to use an English idiom, two sides of the same coin, rather than distinct constructs.
Control nodes were positioned centrally in the network above the value and cost nodes and below the achievement emotions nodes. On one hand, expectancy exhibited no greater relevance to value than cost; on the other hand, expectancy did not cohere as a distinct community. Two items (E1: self-efficacy and E3: confidence) were positioned to the right, separating value and pride, and the third item (E2: success expectations) was positioned to the right, separating cost and boredom. The lack of a coherent control community may reflect different facets of control. Self-efficacy and confidence represent action–control beliefs, whereas expectations of success represent action–outcome expectations [49].
The position of node E2 (success expectations), closer to nodes for boredom, enjoyment, and cost, may imply a greater relevance of action–outcome beliefs to negative facets of value and boredom. The positionality of nodes E1 (self-efficacy) and E3 (confidence), surrounded by enjoyment, value, cost, and pride, may imply a greater relevance of action–control beliefs may imply a greater relevance to positive facets of value and pride. Action–control beliefs and action–outcome beliefs were of equal relevance to enjoyment. All things being equal, it might be expected for action–outcome expectations to show greater relevance for outcome-related emotions and for action–control-beliefs to show a greater relevance for achievement-related emotions. The graphical network, however, indicates the opposite. Empirical research into CVT has not, thus far, considered such propositions.
Tamura et al. [8] is the only study, thus far, to have included emotions and control–value appraisals in a network analysis. As with our study, boredom was located closer to cost (negative value) and pride and happiness to (positive) values. In summary, we have strong, but not unequivocal, support for Hypotheses 1 (H1) and 3 (H3).
4.2. Relations between Control–Value Appraisals and Achievement Emotions
CVT predicts that enjoyment is predicted by high control and (positive) value and low cost (negative value) [1,9,10]. In support of this proposition, we found positive edges between success expectations (E2) and enjoying lessons (E1) and between valuing lessons (V2) and looking forward to lessons (J2). These findings support existing studies that show, using correlation and regression analysis, that high control and (positive) value appraisals predict enjoyment [13,20]. In addition, work requiring too much time (C1) shared a negative edge with looking forward to lessons (J2). V2 and C1 were also two of the most influential nodes within the network. Tamura et al.’s NA found no edges between happiness (the closest emotion to that of enjoyment) and cost (negative value) and indirect edges with expectancy and (positive) cost via curiosity [8]. While the findings of the NA in the present study are more consistent with CVT, it should be noted that measures of achievement emotions and control–value antecedents align more closely with CVT and may, therefore, not be unexpected.
However, we also found some unexpected edges that run contrary to the expectations of CVT. Confidence (E3) shared a negative edge with enjoying lessons (J1) and success expectations (E2) shared a negative edge with looking forward to lessons (J2). These findings may, in part, reflect an element of statistical suppression arising from semi-partial correlations with many interrelated variables. In support of this interpretation, bivariate correlations between these unexpected edges were in the expected direction (see Table S1).
In CVT, boredom is predicted from low (positive value) value, high cost (negative value) and very low or high control [1,9,10]. As with enjoyment, some edges offered clear support for CVT. Negative edges were demonstrated between E1 (self-efficacy) and B2 (boring topic matter) and E3 (confidence) and B4 (prefer to do something else); positive edges were shared between C1 (work requires too much time) and B4 (prefer to do something else) and C4 (have to give up too much) and B3 (learning is boring). Existing studies have shown negative relations between control and boredom and between (positive) value and boredom [5,6]. In Tamura et al.’s NA, boredom demonstrated no edges with control–value appraisals [8]. The findings of the present study, therefore, are not only novel, but also offer stronger support for CVT.
However, there were also positive edges between E1 (self-efficacy) and B1 (boring lessons) and E2 (success expectations) and B3 (learning is boring). Although it is possible these edges are consistent with CVT (i.e., high control can be associated with boredom) it seems unlikely for the present data given the aforementioned negative edges shared between E1 and B2 and between E3 and B4. There was also a negative edge between C1 (work requires too much time) and B3 (learning is boring) that runs contrary to CVT. While it is possible that not all forms of cost are negative, this again seems unlikely for the present data given the positive edges shared between C1 and B4 and C4 and B3. It would seem likely that statistical suppression may be the culprit (see Table S1: bivariate correlations were as expected).
In CVT, pride is elicited from high appraisals of high control and (positive) value and low cost (negative value) [1,9,10]. In line with this prediction, positive edges were shown between E1 (self-efficacy), P3 (pride in learning), and P4 (motivation to continue learning), as well as E2 (success expectations) and P3 (pride in learning). Furthermore, positive edges were shared between V1 (lessons are important), P3 (pride about learning), and P4 (motivated to continue learning); a negative edge was shared between C1 (work requires too much time) and P2 (proud of lessons contributions). These links are consistent with studies showing positive relations between control and pride and (positive) value and pride [5,7]. Pride exhibited only an indirect link with (positive) value and expectancy and was unrelated to cost (negative value) in Tamura et al. [8]. As with enjoyment and boredom, the findings for pride offer stronger novel support for CVT.
There was just one unexpected edge for pride; V1 (lessons are important) shared a negative edge with P1 (pride in keeping up with work). Given the positive edges between V1, P3 and P4, the negative V1-P1 edge seems anomalous and again, a possible case of statistical suppression (Table S1 in the Supplementary Materials shows the bivariate V1-P1 correlations were positive, as expected). In summary, support for Hypothesis 2 was equivocal. Some edges were in line with CVT predictions and consistent with extant studies. Other edges were not, which we speculate are a feature of statistical suppression.
4.3. Limitations and Directions for Future Research
We have utilized, in the present study, a novel form of analysis to examine relations between achievement emotions and control–value appraisals that complements that of traditional factor-analytic and latent profile analyses. In addition, we included a negative facet of value (effort cost). Nonetheless, there are three limitations of the study to note. The first is the relatively narrow range of constructs that we included. Only three achievement emotions were included of a possible twelve [17], our combined value scale did not differentiate extrinsic and intrinsic forms of value and had just one type of negative value (effort cost), and our measure of control comprised two action–control items and one action–outcome expectancy. Of course, there are good reasons for wanting to keep participant burden low and minimize the number of items to be completed, especially in those that are younger [19]. Nonetheless, future studies may wish to consider more elaborate networks by considering a wider range of achievement emotions along with different facets of control and combinations of intrinsic/extrinsic and positive/negative values.
Second, as with any cross-sectional design, we cannot infer directionality from the present analyses. Edges in NA can be directional or non-directional and future studies may wish to use prospective or longitudinal studies to examine control–value appraisals as predictive antecedents of achievement emotions, specifically as hypothesized in CVT. Nonetheless, as a starting point for using NA with control–value appraisals and achievement emotions, we believe our study offers a useful starting point. We hope that other studies can use the present findings as a springboard for NA in more sophisticated designs.
Third, our interpretation of edges was hampered, to a degree, by what we have interpreted as statistical suppression. This may be inevitable if using multi-item measures of highly inter-related constructs resulting in dense networks. One option, therefore, might be to consider using single-item measures of constructs. Single-item measures are more common in experience-sampling methodologies designed for within-person analyses (such as Tamura et al. [8]) than in between-person forms of analysis. However, given that single-item measures do not necessarily have low reliability [50], this may be a practical alternative for the highly related networks of control–value appraisals and emotions.
4.4. Practical Implications of the Findings
Despite the potential difficulties arising from using multi-item measures in NA, one advantage is in identifying those items that are particularly influential within the network. Such items may be beneficial practically for intervention or informing classroom practice. Commonly suggested applications of CVT include interventions and instructional strategies designed to enhance positive emotion and reduce negative emotion through strengthening control and positive value appraisals [51,52]. In this respect, identifying influential nodes in an interconnected network of control–value appraisals and emotions could be assistive in suggesting foci for intervention or instructional strategy. In the present study, the most influential nodes for control–value appraisals were V1 (lessons are important), V2 (lessons are valuable), and C1 (work requires too much time). Enhancing the importance and positive value of learning while reducing perceptions of time/effort costs (which may go conjointly with enhancing value), would likely boost enjoyment and pride and reduce boredom. Strategies to strengthen control [53] and (positive) value [54] are relatively well established. There are fewer examples of cost reduction interventions [55].
5. Conclusions
Enjoyment, boredom, and pride nodes clustered together, as would be expected for indicators of discrete emotions. Nodes for positive and negative facets of value also clustered together, indicating their status as distinct but related aspects of value. Control nodes did not cluster together so coherently, possibly due to the mixture of action–control and action–outcome beliefs included in the expectancy subscale. Many edges to link control–value appraisals and achievement emotions were as expected and supported the propositions of CVT. Those that did not were likely cases of statistical suppression (when compared to bivariate correlations) and may reflect a drawback of using NA with densely interconnected nodes. Nonetheless, two (positive) value and one (cost) items were influential in the network and may provide useful foci for intervention and instructional design.
Supplementary Materials
The following supporting information can be downloaded at: https://www.mdpi.com/article/10.3390/educsci13030239/s1, Figure S1: Achievement Emotions and Control–Value Appraisal Items; Table S1: Bivariate Correlations Between Items for Achievement Emotions and Control–Value Appraisal Items.
Author Contributions
Conceptualization, D.W.P. and M.D.; methodology, D.W.P.; formal analysis, D.W.P. and M.D.; data curation, D.W.P.; writing—original draft preparation, D.W.P.; writing—review and editing, M.D.; project administration, D.W.P. All authors have read and agreed to the published version of the manuscript.
Funding
This research received no external funding.
Institutional Review Board Statement
The study was conducted in accordance with the Declaration of Helsinki, and approved by the Institutional Review Ethics Committee of Liverpool John Moores University (20EDN016 9 October 2020).
Informed Consent Statement
Informed consent was obtained from all participants involved in the study.
Data Availability Statement
The dataset on which these analyses were conducted can be accessed at: https://doi.org/10.17632/dkvr4jvdbb.1.
Conflicts of Interest
The authors declare no conflict of interest.
References
- Pekrun, R. Self-appraisals and emotions: A control-value approach. In Self—A Multidisciplinary Concept; Dicke, T., Guay, F., Marsh, H.W., Craven, R.G., McInerney, D.M., Eds.; Information Age Publishing: Charlotte, NC, USA, 2021. [Google Scholar]
- Ahmed, W.; van der Werf, G.; Kuyper, H.; Minnaert, A. Emotions, self-regulated learning, and achievement in mathematics: A growth curve analysis. J. Educ. Psychol. 2013, 105, 150–161. [Google Scholar] [CrossRef]
- Camacho-Morles, J.; Slemp, G.R.; Oades, L.G.; Morrish, L.; Scoular, C. The role of achievement emotions in the collaborative problem-solving performance of adolescents. Learn. Individ. Differ. 2019, 70, 169–181. [Google Scholar] [CrossRef]
- Fredrickson, B.L. Positive emotions broaden build. In Advances in Experimental Social Psychology; Devine, P., Plant, A., Eds.; Academic Press: Cambridge, MA, USA, 2013; Volume 47, pp. 1–53. [Google Scholar] [CrossRef]
- Bieg, M.; Goetz, T.; Hubbard, K. Can I master it and does it matter? An intraindividual analysis on control–value antecedents of trait and state academic emotions. Learn. Individ. Differ. 2013, 28, 102–108. [Google Scholar] [CrossRef]
- Putwain, D.W.; Schmitz, E.A.; Wood, P.; Pekrun, R. The role of achievement emotions in primary school mathematics: Control-value antecedents and achievement outcomes. Br. J. Educ. Psychol. 2021, 91, 347–367. [Google Scholar] [CrossRef]
- Shao, K.; Pekrun, R.; Marsh, H.W.; Loderer, K. Control-value appraisals, achievement emotions, and foreign language performance: A latent interaction analysis. Learn. Instr. 2020, 69, 101356. [Google Scholar] [CrossRef]
- Tamura, A.; Ishii, R.; Yagi, A.; Fukuzumi, N.; Hatano, A.; Sakaki, M.; Tanaka, A.; Murayama, K. Exploring the within-person contemporaneous network of motivational engagement. Learn. Instr. 2022, 81, 101649. [Google Scholar] [CrossRef]
- Pekrun, R. Achievement emotions. In Handbook of Competence and Motivation, 2nd ed.; Elliot, A., Dweck, C., Yeager, D., Eds.; Guilford Press: New York City, NY, USA, 2017; pp. 251–271. [Google Scholar]
- Pekrun, R. Control-value theory: A social-cognitive approach to achievement emotions. In Big Theories Revisited 2: A Volume of Research on Sociocultural Influences on Motivation and Learning; Liem, G.A.D., McInerney, D.M., Eds.; Information Age Publishing: Charlotte, NC, USA, 2018; pp. 162–190. [Google Scholar]
- Bandura, A. Self-Efficacy: The Exercise of Control; Freeman: Philadelphia, PA, USA, 1997. [Google Scholar]
- Graham, S.; Taylor, A.Z. An attributional approach to emotional life in the classroom. In International Handbook of Emotions in Education; Pekrun, R., Linnenbrink-Garcia, L., Eds.; Routledge: London, UK, 2014; pp. 96–119. [Google Scholar]
- Weiner, B. The legacy of an attribution approach to motivation and emotion: A no-crisis zone. Motiv. Sci. 2018, 4, 4–14. [Google Scholar] [CrossRef]
- Pekrun, R.; Perry, R.P. Control-value theory of achievement emotions. In International Handbook of Emotions in Education; Pekrun, R., Linnenbrink-Garcia, L., Eds.; Routledge: London, UK, 2014; pp. 120–141. [Google Scholar]
- Linnenbrink, E.A.; Pintrich, P.R. Achievement goal theory and affect: An asymmetrical bidirectional model. Educ. Psychol. 2002, 37, 69–78. [Google Scholar] [CrossRef]
- Linnenbrink, E.A. Emotion research in education: Theoretical and methodological perspectives on the integration of affect, motivation and cognition. Educ. Psychol. Rev. 2006, 18, 307–314. [Google Scholar] [CrossRef]
- Pekrun, R.; Marsh, H.W.; Elliot, A.J.; Stockinger, K.; Perry, R.P.; Vogl, E.; Goetz, T.; van Tilburg, W.A.P.; Lüdtke, O.; Vispoel, W.P. A three-dimensional taxonomy of achievement emotions. J. Personal. Soc. Psychol. 2023, 124, 145–178. [Google Scholar] [CrossRef]
- Pekrun, R.; Goetz, T.; Frenzel, A.C.; Barchfeld, P.; Perry, R.P. Measuring emotions in students’ learning and performance: The Achievement Emotions Questionnaire (AEQ). Contemp. Educ. Psychol. 2011, 36, 36–48. [Google Scholar] [CrossRef]
- Kosovich, J.J.; Hulleman, C.S.; Barron, K.E. Measuring motivation in educational settings: A Case for pragmatic measurement. In The Cambridge Handbook on Motivation and Learning; Renninger, K.A., Hidi, S.E., Eds.; Cambridge University Press: Cambridge, MA, USA, 2019; pp. 713–738. [Google Scholar]
- Bieleke, M.; Gogol, K.; Goetz, T.; Pekrun, R. The AEQ-S: A short version of the Achievement Emotions Questionnaire. Contemp. Educ. Psychol. 2021, 65, 101940. [Google Scholar] [CrossRef]
- Peixoto, F.; Mata, L.; Monteiro, V.; Sanches, C.; Pekrun, R. The Achievement Emotions Questionnaire: Validation for pre-adolescent students. Eur. J. Dev. Psychol. 2015, 12, 472–481. [Google Scholar] [CrossRef]
- Lichtenfeld, S.; Pekrun, R.; Stupnisky, R.H.; Reiss, K.; Murayama, K. Measuring students’ emotions in the early years: The achievement emotions questionnaire-elementary school (AEQ-ES). Learn. Individ. Differ. 2012, 22, 190–201. [Google Scholar] [CrossRef]
- Zaccoletti, S.; Altoé, G.; Mason, L. Enjoyment, anxiety and boredom, and their control-value antecedents as predictors of reading comprehension. Learn. Individ. Differ. 2020, 79, 101869. [Google Scholar] [CrossRef]
- Loderer, K.; Pekrun, R.; Lester, J. Beyond cold technology: A systematic review and meta-analysis on emotions in technology-based learning environments. Learn. Instr. 2020, 70, 101162. [Google Scholar] [CrossRef]
- Goetz, T.; Frenzel, A.C.; Stoeger, H.; Hall, N.C. Antecedents of everyday positive emotions: An experience sampling analysis. Motiv. Emot. 2010, 34, 49–62. [Google Scholar] [CrossRef]
- Putwain, D.W.; Pekrun, R.; Nicholson, L.J.; Symes, W.; Becker, S.; Marsh, H.W. Control-value appraisals, enjoyment, and boredom in mathematics: A latent interaction analysis. Am. Educ. Res. J. 2018, 55, 1339–1368. [Google Scholar] [CrossRef]
- Parker, P.C.; Perry, R.P.; Hamm Chipperfield, J.G.; Pekrun, R.; Dryden, R.P.; Daniels, L.M.; Tze, V.M.C. A motivation perspective on achievement appraisals, emotions, and performance in an online learning environment. Int. J. Educ. Res. 2021, 108, 101772. [Google Scholar] [CrossRef]
- Fried, E.I.; van Borkulo, C.D.; Cramer, A.O.J.; Boschloo, L.; Schoevers, R.A.; Borsboom, D. Mental disorders as networks of problems: A review of recent insights. Soc. Psychiatry Psychiatr. Epidemiol. 2017, 52, 1–10. [Google Scholar] [CrossRef]
- Heeren, A.; Bernstein, E.E.; McNally, R.J. Deconstructing trait anxiety: A network perspective. Anxiety Stress Coping 2018, 31, 262–276. [Google Scholar] [CrossRef] [PubMed]
- Putwain, D.W.; Stockinger, K.; von der Embse, N.P.; Suldo, S.M.; Daumiller, M. Test anxiety, anxiety disorders, and school-related wellbeing: Manifestations of the same or different Constructs? J. Sch. Psychol. 2021, 88, 47–67. [Google Scholar] [CrossRef] [PubMed]
- Epskamp, S.; Rhemtulla, M.T.; Borsboom, D. Generalized network psychometrics: Combining network and latent variable models. Psychometrika 2017, 82, 904–927. [Google Scholar] [CrossRef] [PubMed]
- Robinaugh, D.J.; Millner, A.J.; McNally, R.J. Identifying highly influential nodes in the complicated grief network. J. Abnorm. Psychol. 2016, 125, 747–757. [Google Scholar] [CrossRef] [PubMed]
- Department for Education. Schools, Pupils and Their Characteristics: Academic Year 2021/22; His Majesty’s’ Stationary Office: London, UK, 2022. [Google Scholar]
- Kosovich, J.J.; Hulleman, C.S.; Barron, K.E.; Getty, S. A practical measure of student motivation: Establishing validity evidence for the Expectancy-Value-Cost Scale in Middle School. J. Early Adolesc. 2015, 35, 709–816. [Google Scholar] [CrossRef]
- Forsblom, L.; Pekrun, R.; Loderer, K.; Peixoto, F. Cognitive appraisals, achievement emotions, and students’ math achievement: A longitudinal analysis. J. Educ. Psychol. 2022, 114, 346–367. [Google Scholar] [CrossRef]
- Peixoto, F.; Sanches, C.; Mata, L.; Monteiro, V. “How do you feel about math?”: Relationships between competence and value appraisals, achievement emotions and academic achievement. Eur. J. Psychol. Educ. 2017, 32, 385–405. [Google Scholar] [CrossRef]
- Muthén, L.K.; Muthén, B.O. Mplus User’s Guide, 8th ed.; Muthén & Muthén: Los Angeles, CA, USA, 2017. [Google Scholar]
- Marsh, H.W.; Morin, A.J.; Parker, P.D.; Kaur, G. Exploratory structural equation modeling: An integration of the best features of exploratory and confirmatory factor analysis. Annu. Rev. Clin. Psychol. 2014, 10, 85–110. [Google Scholar] [CrossRef]
- Morin, A.J.; Marsh, H.W.; Nagengast, B. Exploratory structural equation modelling. In Structural Equation Modeling: A Second Course, 2nd ed.; Hancock, G.R., Mueller, R.O., Eds.; Information Age Publishing, Inc.: Charlotte, NC, USA, 2013. [Google Scholar]
- Hu, L.; Bentler, P.M. Cutoff criteria for fit indexes in covariance structure analysis: Conventional criteria versus new alternatives. Struct. Equ. Model. A Multidiscip. J. 1999, 6, 1–55. [Google Scholar] [CrossRef]
- Jones, P.J. Networktools: Tools for Identifying Important Nodes in Networks. R Package Version 1.1.0. 2017. Available online: https://CRAN.R-project.org/package=networktools (accessed on 27 December 2022).
- Jones, P.J.; Mair, P.; McNally, R.J. Visualizing psychological networks: A tutorial in R. Front. Psychol. 2018, 9, 1742. [Google Scholar] [CrossRef]
- Fruchterman, T.M.; Reingold, E.M. Graph drawing by force-directed placement. Softw. Pract. Exp. 1991, 21, 1129–1164. [Google Scholar] [CrossRef]
- Friedman, J.; Hastie, T.; Tibshirani, R. Sparse inverse covariance estimation with the graphical lasso. Biostatistics 2008, 9, 432–441. [Google Scholar] [CrossRef] [PubMed]
- Epskamp, S.; Cramer, A.O.J.; Waldorp, L.J.; Schmittmann, V.D.; Borsboom, D. Qgraph: Network visualizations of relationships in psychometric data. J. Stat. Softw. 2012, 48, 1–18. [Google Scholar] [CrossRef]
- Williams, D.R.; Rast, P. Back to the basics: Rethinking partial correlation network methodology. Br. J. Math. Stat. Psychol. 2020, 73, 187–212. [Google Scholar] [CrossRef]
- Epskamp, S. Brief report on estimating regularized Gaussian networks from continuous and ordinal data. arXiv 2017, arXiv:1606.05771v2. [Google Scholar] [CrossRef]
- Janková, J.; van de Geer, S. Inference for high-dimensional graphical models. In Handbook of Graphical Models; Maathuis, M., Drton, M., Lauritzen, S., Wainwright, M., Eds.; CRC Press: Boca Raton, FL, USA, 2019; pp. 325–346. [Google Scholar]
- Skinner, E.A. A guide to constructs of control. J. Personal. Soc. Psychol. 1996, 71, 549–570. [Google Scholar] [CrossRef]
- Gogol, K.; Brunner, M.; Goetz, T.; Martin, R.; Ugen, S.; Keller, U.; Fischbach, A.; Preckel, F. My questionnaire is too long! Contemp. Educ. Psychol. 2014, 39, 188–205. [Google Scholar] [CrossRef]
- Boehme, K.L.; Goetz, T.; Preckel, F. Is it good to value math? Investigating mothers’ impact on their children’s test anxiety based on control-value theory. Contemp. Educ. Psychol. 2017, 51, 11–21. [Google Scholar] [CrossRef]
- Pekrun, R.; Goetz, T.; Daniels, L.M.; Stupnisky, R.H.; Perry, R.P. Boredom in achievement settings: Exploring control-value antecedents and performance outcomes of a neglected emotion. J. Educ. Psychol. 2010, 102, 531–549. [Google Scholar] [CrossRef]
- Hall, N.C.; Perry, R.P.; Goetz, T.; Ruthig, J.C.; Stupnisky, R.H.; Newall, N.E. Attributional retraining and elaborative learning: Improving academic development through writing-based interventions. Learn. Individ. Differ. 2007, 17, 280–290. [Google Scholar] [CrossRef]
- Hulleman, C.S.; Barron, K.E.; Kosovich, J.J.; Lazowski, R.A. Student Motivation: Current Theories, Constructs, and Interventions Within an Expectancy-Value Framework. In Psychosocial Skills and School Systems in the 21st Century. Theory, Research, and Practice; Lipnevich, A.A., Preckel, F., Roberts, R.D., Eds.; The Springer Series on Human Exceptionality; Springer: Berlin/Heidelberg, Germany, 2016; pp. 241–278. [Google Scholar]
- Rosenzweig, E.Q.; Wigfield, A.; Hulleman, C.S. More useful or not so bad? Examining the effects of utility value and cost reduction interventions in college physics. J. Educ. Psychol. 2020, 112, 166–182. [Google Scholar] [CrossRef]


Disclaimer/Publisher’s Note: The statements, opinions and data contained in all publications are solely those of the individual author(s) and contributor(s) and not of MDPI and/or the editor(s). MDPI and/or the editor(s) disclaim responsibility for any injury to people or property resulting from any ideas, methods, instructions or products referred to in the content. |
© 2023 by the authors. Licensee MDPI, Basel, Switzerland. This article is an open access article distributed under the terms and conditions of the Creative Commons Attribution (CC BY) license (https://creativecommons.org/licenses/by/4.0/).