Article

Learning Patterns in Influencing Attitudes of Religious Tolerance in Indonesian Universities

1
Faculty of Education and Teacher Training, Walisongo State Islamic University, Semarang 50185, Indonesia
2
Faculty of Social Sciences and Humanities, Universiti Teknologi Malaysia (UTM), Skudai 81310, Malaysia
*
Author to whom correspondence should be addressed.
Educ. Sci. 2023, 13(3), 285; https://doi.org/10.3390/educsci13030285
Submission received: 17 January 2023 / Revised: 11 February 2023 / Accepted: 17 February 2023 / Published: 7 March 2023
(This article belongs to the Section Higher Education)

Abstract

:
This study investigates the influence of learning patterns on religious tolerance. Variable learning patterns are divided into three aspects: (1) cognitive patterns, (2) socio-affective patterns, and (3) practical-empirical patterns. The variable of religious tolerance is divided into attitude-forming components, including: (1) knowledge of religious tolerance, (2) feeling of religious tolerance, and (3) actual act of religious tolerance. This research is a quantitative type using multiple linear regression analysis models. Data was collected through a survey of 320 research respondents and data analysis used descriptive statistical analysis and inferential statistical analysis. The analysis results with the simultaneous test (F-test) showed that the three learning patterns significantly influence religious tolerance, which can be seen from the p-Value (0.00) < alpha (0.05)); (F > F table)). The partial test results (t-test) show; First, the understanding of religious tolerance is dominantly influenced by cognitive learning patterns with a value (p-Value (0.00) <alpha (0.05)); (t(10.21) > t table (1.97)). Second, the feeling of religious tolerance is dominated by the influence of cognitive and socio-affective learning patterns with each having (p-Value (0.000) <alpha (0.05)); (t (9.50) > t table (1.97) and (p-Value (0.000) < alpha (0.05)); (t (3.65) > t table (1.97)). Third, cognitive, socio-affective, and practical-empirical learning styles had the same influence on tolerant behavior specifically (p-Value = 0.00 alpha = 0.05) (p-Value (0.00) < alpha (0.05)). These findings can be used as a basis for compiling educational regulations so that learning is carried out with strategies that support student learning patterns.

1. Introduction

Studies on learning patterns and religious tolerance have yet to be carried out in a positivistic research paradigm [1]. Attention is generally paid to learning material variables that contribute to an increase in tolerance [2] but not to the area of student learning strategies and patterns. The current study generally used reporting, evaluating, comparing, or reflecting approaches to tolerance education policies such as the Messer student exchange program [3] in Israel, Schweitzer’s [4] interfaith education course in Germany, Kafatos [5] theatre-based intervention in Greece, and RE Brockman’s [6] comparison in Texas and Québec public schools. One recurring discussion in the study of religious tolerance is focused on affirming centrality and developing Allport’s contact hypothesis by optimizing interfaith contact to minimize prejudice and strengthen tolerance. The research has yielded important insights for promoting religious tolerance education in countries with a Christian majority. However, contemporary educational research has not explicitly reported on learning pattern variables’ effect on attitudes toward religious tolerance in Muslim-majority societies. This analysis is important because learning patterns’ appropriateness contributes significantly to behavior decisions [7].
Contemporary research trends on religious tolerance have documented various case studies that point to specific educational programs [8]. The studies employed discourse analysis to benefit research and promote tolerance in religious education (RE) settings, specifically in alternative areas for conducting discursive exploration in developing tolerance education policies. Whereas in Southeast Asia, previous research has found empirical benefits through contemporary case studies of Indonesia, where religious conservatism and intolerance tend to experience an increase [9]. This article begins by briefly reviewing previous studies and highlighting the gaps that need more study on the influence of learning patterns in forming a tolerant attitude. Therefore, this article highlights the phenomenon and potential for intolerant actions in a pluralistic Indonesian context, followed by a theoretical study of the role of learning patterns in countering intolerance. Finally, a quantitative measurement was carried out to see the magnitude of the influence of learning patterns on students’ tolerant behavior.
Apart from the two studies above, the primary publication from the Indonesian context related to this article is the work of Marintan [10] on the effect of democratic parenting on tolerance. By accurately identifying that democratic parenting is not enough without theological transformation from exclusive to multiculturalist, Marintan proposed that democratic parenting must be built in tandem with Indonesian Islamic traditions closely linked to religious dogmas. He crystallized his theology into four core, ten implementation-level, and three level values. Such as the proposed concept of God’s mercy in Islam, which encourages humans to give attention to each other and spread love, even with different religious beliefs. Another concept used by Marintan is mutual respect between religious communities. It does not matter what religion you follow; people must respect one another. Vermunt, JD, and Donche [11] considered Marintan research as the first role in developing tolerance, multicultural education, and relevant to the Indonesian context.’ This article takes Marintan’s work further by analyzing of learning patterns as a discursive embodiment of the curriculum influence the behavior of religious tolerance.

2. Views of Different Religions on the Phenomenon of Intolerance in Indonesia

Indonesia is a multicultural country that has 1340 ethnic groups, 6 recognized religions, and 5 races, which sometimes provokes intolerance [12], evidenced by rampant acts of intolerance, especially after the fall of the New Order regime. Intolerance can be observed even more so in conflict-prone areas, along with opening channels of identity politics that carry the name of religion [13]. At least three sad incidents have been recorded due to society’s inability to promote tolerance for a diversity of identities. For example, the Islamic–Christian conflict in Ambon and Maluku, which caused the loss of hundreds of lives; the (Islamic–Christian) religious conflict in Poso, which resulted in the deaths of 577 residents, 384 injuries, and 7932 destroyed houses; and the Sampit–Madura conflict, which resulted in the killing of 315 residents [14]. Other acts of intolerance also occurred in conflict-prone areas, for example: the Cikeusik conflict in Banten and wars between villages and customary lands in Papua or West Nusa Tenggara. Trijono’s analysis states that this series of events started due to the incompatibility of implementing religious norms and cultural interests due to social change in a heterogeneous society [15]. Facing this phenomenon, tertiary institutions must provide a learning model of religious tolerance by using student learning patterns to achieve learning objectives. Figure 1 shows the Indonesian human genetic map.
Respect and tolerance for practitioners of other faiths are essential components of diversity in Islam. The Indonesian Ulema Council, initiated by Islamic figures, issued a fatwa on religious pluralism that supports tolerance in 2005.
“An understanding that teaches that all religions are the same and therefore the truth of each religion is relative. Therefore, every religious believer may not claim that only his/her religion is right while other religions are wrong. Pluralism also teaches that all religious adherents will enter and live side by side in heaven [16].”
Pluralism is viewed as part of Islam’s essential attitude, namely being open to dialogue and accepting differences fairly. People are expected to have an ethos of reading, nurturing, learning, and being smart through openness and a dialogical attitude [17]. Unfortunately, the community and religious leaders do not sufficiently understand this view. Some even think that pluralism is an attitude or idea that believes in the truth of all religions.
In the opinion of Indonesian Christians, John Hick [4] has shaped the understanding of religious tolerance in the preceding decades. Hick says religious tolerance is closely related to pluralism as a particular theory regarding the relationship between traditions and various claims. This term implies that the world’s major religions significantly shape multiple perceptions regarding religious tolerance [3]. In line with this, Indonesian Buddhists follow the example of the Buddha on religious tolerance. For example, King Asoka made a decree on a mountain rock, which read, “One should not honour only one’s religion and condemn the religions of others. However, one should honour others’ religions for this or that reason. So doing, one helps one’s religion to grow and renders service to the religions of others too” [3]. In acting otherwise, one digs the grave of one’s religion and harms other religions. Whoever honours his religion and condemns other religions does so indeed through devotion to his religion, thinking, “I will glorify my religion. However, on the contrary, in so doing, he injures his religion more gravely” [18].
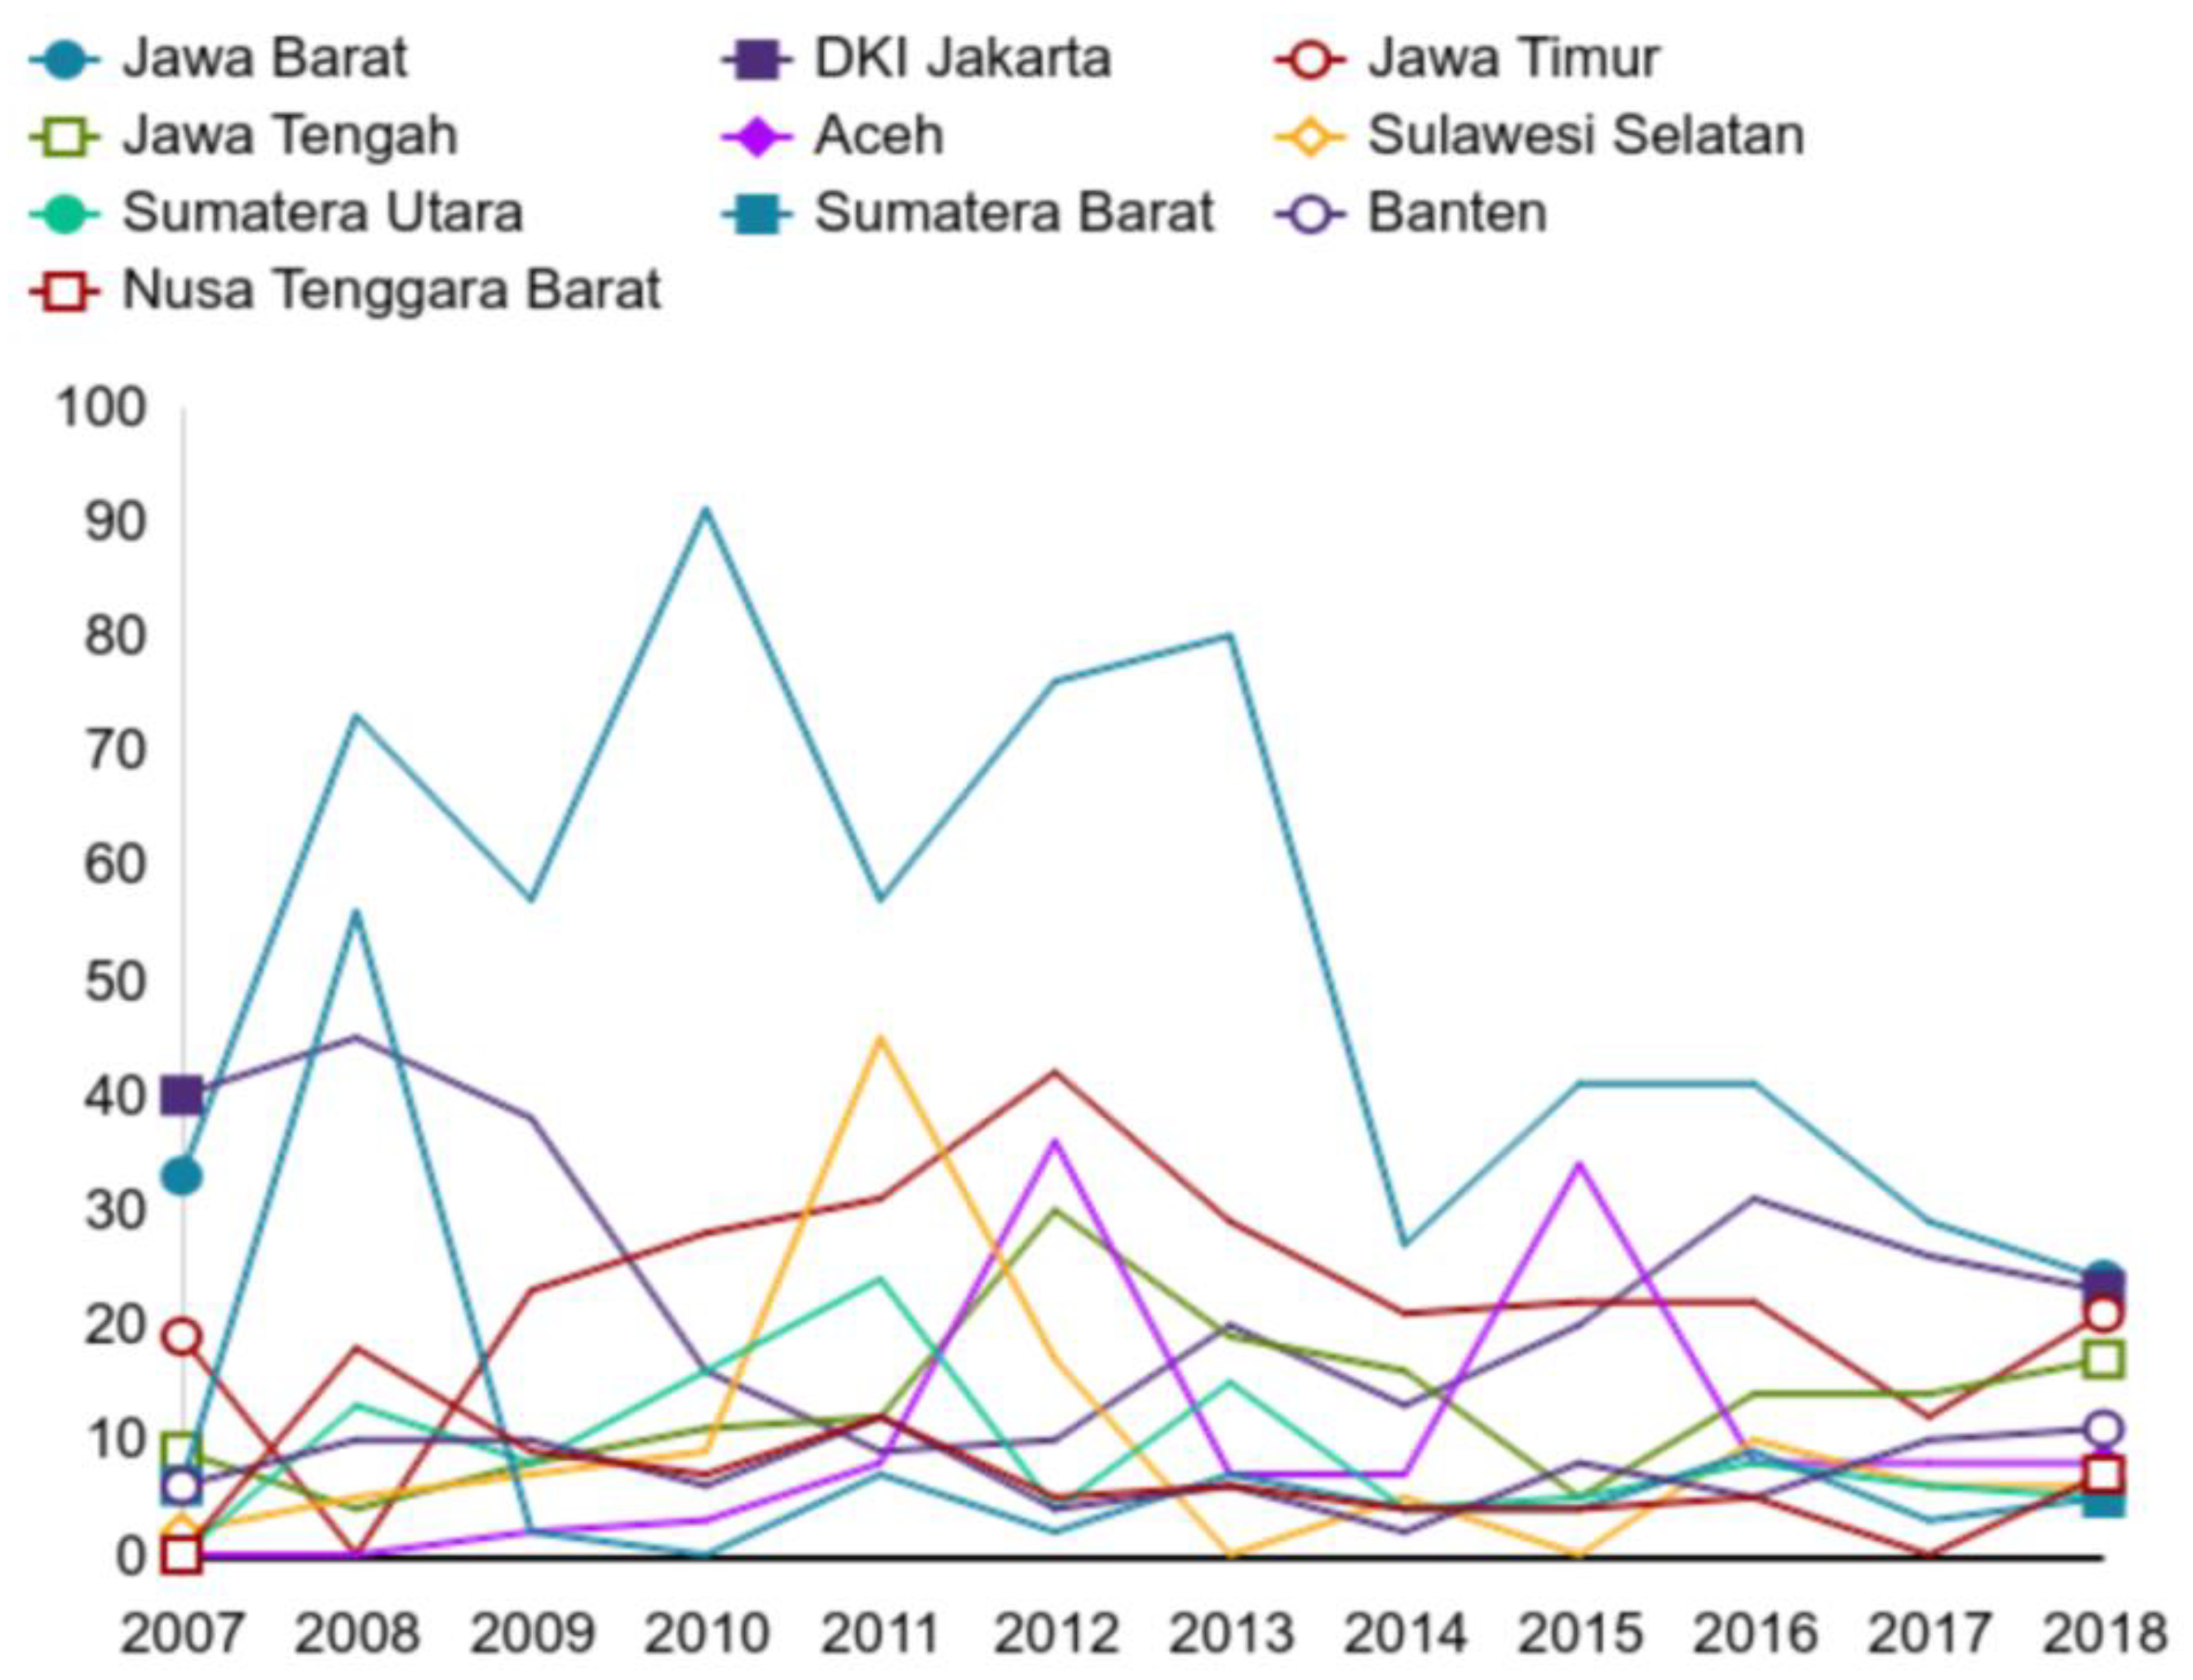
Meanwhile, the Setara Institute noted that from 2007 to 2018, there were 2400 violations of the Conditions of Freedom/Belief (KKB), with the most cases occurring in West Java, with most victims belonging to the Ahmadiyah congregation [19]. Figure 2 shows the level of religious tolerance in several provinces in Indonesia.
Contrary to the data above, recent developments on the issue of religious tolerance in Indonesia show a positive trend. The Vice President of Indonesia, for example, Ma’ruf Amin, said that Indonesia received good recognition from various nations because of its inter-religious harmony: “They see how we can build the nation’s integrity because there is an agreement with Pancasila. So, they are amazed” [20]. He said that sometimes Indonesia needs to be aware that it has become the spotlight for other countries regarding religious tolerance. Amin also shared his experience of being visited by a team of film producers from Italy who wanted to document inter-religious harmony in Indonesia, including in Borobudur Temple in Central Java, Mount Bromo in East Java, and the interior areas of Lebak, Banten [21]. This shows Indonesia’s acceptance in the eyes of the world as a tolerant society in the area of religion.

3. Theoretical Review

Within the theoretical framework of learning patterns, research has consistently identified three qualitative ways related to how students learn: learning directed (cognitive patterns), learning required (socio-affective patterns), and practical-empirical patterns [11,22]. In learning directed (cognitive patterns), students attempt to recall the learning material in order to attain a high exam score. They remember the material and study it sequentially and step-by-step, without considering the link between bigger pieces [23]. They adhere closely to the guidelines established by teachers, study materials, and other external actors. The purpose of their learning is to pass tests or assess their abilities. They consider learning as essentially the acquisition of information from other sources for one’s own use, imitating every material given by the lecturer in the same way. This pattern is determined by a stepwise procedure with the ILS scale (consisting of the ‘memorize and practice’ and ‘analyze’ subscales), external regulation, knowledge intake as a theory of learning, as well as directed certification and directed learning orientation [22].
Students who study with socio-affective patterns adopt a deep learning approach. Their understanding focuses on what they learn, arrange some facts from the separation of the view, and criticize the learning material he developed [24], and engage with what they are learning. They have a unique way of learning, do not want to be locked up in the material determined by the lecturer. Student perspectives uphold the construction of knowledge as personal responsibility [25]. Student encouragement is deeper about the topic of study that is processing on the ILS scale with the subscala connect and compose and the criticism process.
Finally, students who learn using practical-empirical patterns seek connections between knowledge gained in class and outside the classroom, such as what to learn, and consider the application of the method to study practice [26]. They are more interested in learning material that he thinks is useful for life today, knowledge that is not related to that they consider it not important [24]. Their tendency to the work side to have good performance and ability.
The learning pattern trend is based on a quantitative research view, meaning that latent factors can be distinguished based on factor analysis, which reflects coherent patterns and correlates between differentiating scales. The pattern of learning shown must be understood as a framework that is sometimes noticed or not noticed. Some people exhibit all of the characteristic learning patterns; others are more flexible and show characteristics of one, two, or even three patterns. This causes a combination of different learning patterns to occur in small groups in the class [11].
Figure 3 describes the model of learning patterns adopted by students. Cognitive strategies affect students’ conceptions and motivation in learning, play a role in processing learning materials. This orientation leads to learning outcomes that are influenced by various contextual and personal factors. Their understanding plays a role in providing capital for further learning. Even changing learning contexts can also change the patterns experienced before [11]. All lines between elements are drawn as links to emphasize the dynamics of the model. Individual characteristics regarding intelligence beliefs also influence the way students learn. Figure 3 Shows the types of learning patterns and influencing factors.
Not an unchangeable human characteristic, learning patterns are the result of the interaction between personal and contextual influences [12,13]. In previous research, the coordination of these concepts is commonly referred to as ‘learning patterns’. However, Even so, there is still an assumption that learning patterns are human nature that cannot be changed [11,27]. Because of this, research trends since 2004 no longer call it a ‘learning pattern’. Instead, researchers are better suited to understand the concept of learning patterns as dynamic terms that represent a whole set of student learning strategies, perspectives, and motives [28].
Multiple personal and contextual factors impact students’ learning patterns, according to previous studies. Some of the things that influence are age, subject matter knowledge, and educational history. Important contextual aspects that influence student learning include the instructional techniques used, the kind of evaluation, and opportunities for student collaboration [29]. The student’s learning process is also proven to be associated with student learning outcomes. For example, several studies have shown that student learning outcomes are often associated with meaningful learning patterns, for example student activities related to composing, critical engagement, and analytical procedures that may be experienced [30].
Hawk, TF and Shah, Clark, and Janine, revealed that learning patterns could influence students’ ability to accept diversity [31]. Learning patterns as a series of learning become sustainable habits that lead to behavioral tendencies [32]. However, unfortunately, learning patterns need to be remembered in the literature study of religious tolerance [3]. Contemporary discussion of tolerance has tended toward two less-related domains. First, existing studies only discuss the theoretical literature presented by Wegner [33] and Alam, Mansur [34]. Second, research on tolerance is associated with anti-radical character learning and its influence on understanding societal ideology [28].
Meanwhile, research in learning patterns tends to look at the effect of learning attitudes on the selection of learning media [35]. Alternatively, one could relate it to the learning patterns used by students. Compared to previous research, this research seems to be one step ahead. We tried to see the influence of cognitive, socio-affective, and practical empirical learning patterns on tolerant behavior in knowledge, affection, or actions [36]. This variable was chosen to measure the extent to which the success of Islamic learning can instill religious tolerance. Furthermore, this research is expected to identify what learning patterns can improve understanding, affection, and actions of religious tolerance as attitude variables (See Table 1) [13].
X and Y research variables are then broken down into sixty questions where X1 is a Cognitive pattern, X2 is a Socio-Affective pattern, and X3 is an empirical practice. Y1 is knowledge of religious tolerance, Y2 is a feeling of religious tolerance, and Y3 is an actual act of religious tolerance.
A simultaneous test is used to see the effect of independent variables on the dependent variable. The accompanying test hypothesis can be written as follows:
  • H 0 : β 1 = β 2 = = β k = 0 , meaning that the independent variable has no significant impact on the dependent variable,
  • H 1 : there is at least one β i 0 , i = 1 , 2 , , k .
Test Statistics:
The following are the test statistics used in the form of an ANOVA table (See Table 2).
Critical area:
Reject H 0 if F > F α ; k ; n k 1 , means that at least one independent variable has a significant effect on the dependent variable.
Partial Test Hypothesis:
  • H 0 : β i = 0 , independent variable has no significant effect on the dependent variable).
  • H 1 : β i 0 , i = 1 , 2 , , k (the independent variable has a considerable impact on the dependent variable).
Test Statistics:
t = β i var β ^ i , where, var β ^ i = d i a g X X 1 M S E
d i a g X T X 1 M S E = var β ^ 0 cov a r β ^ 1 β ^ 0 cov a r β ^ k β ^ 0 cov a r β ^ 0 β ^ 1 var β ^ 1 cov a r β ^ k β ^ 1 cov a r β ^ 0 β ^ k cov a r β ^ 1 β ^ k var β ^ k
Critical Areas: Reject H0 if,
t > t α / 2 ; ( n k )

4. Method

4.1. Research Design

This research is quantitative, using multiple linear regression analysis methods. The stages in multiple linear regression analysis are: (1) testing the relationship between variables using a matrix plot and product-moment Pearson correlation test, (2) testing multicollinearity to see the relationship between predictor variables, (3) testing residual assumptions (identical, independent, and normal distribution), and (4) estimating the parameters and the significance of the parameters. Before conducting multiple linear regression analysis tests, it is necessary to test their validity and reliability first, because the data used in the study uses a Likert scale. In short, the research stages used can be seen in the following flow chart. Look at Figure 4 and Figure 5 to understand the procedure of this research.

4.2. Participants

The population of this study was all third-year students in eight faculties at Walisongo State Islamic University, Semarang. This university is an educational institution with an Islamic curriculum. Therefore, the sample taken is representative of the entire population so that conclusions can be drawn that represent the character of all students [37]. The respondents of this study were 320 students from all majors at Walisongo State Islamic University. The research subjects were selected using proportional sampling, where the samples were taken proportionately [38].

4.3. Data Collection

This research used a survey as its method for collecting data. The technique is executed systematically. Students are given a series of questions that may be converted into numeric indicators of learning pattern variables and religious tolerance on a Likert scale. It comprisessixty questions intended to determine the learning patterns and tolerance attitudes of people or groups [39]. In more detail, the survey method was chosen to identify student learning patterns influencing understanding/knowledge, affection, and acts of religious tolerance.

4.4. Data Analysis

Data analysis in this study used descriptive statistical analysis and inferential statistical analysis. Descriptive statistical analysis was used to describe the collected data by identifying learning patterns and religious tolerance. Inferential statistical analysis was used to test the hypotheses. Testing the hypothesis in this study used multiple linear regression analysis with a level of (α) = 0.050 and processed with Minitab 16. the prerequisite tests before carrying out multiple linear regression analysis consisted of a normality test using Kolmogorov–Smirnov, an exact test using the Glejser, and an independent test using Durbin–Watson. The criterion for making a hypothesis decision was that H0 is rejected when the p-value < α (0.05). On the other hand, H0 was accepted when the p-Value > α (0.05) [39].

4.5. Validity and Reliability

Identification of learning patterns was conducted using the survey method with a Likert scale measurement. Instruments used to obtain data must be tested first. The instrument feasibility test was carried out in two stages: the validity test and the reliability test to determine the quality level of the test questions. Validity is an essential quality of any test and is defined as the accuracy and thoroughness of an instrument in carrying out its functions [37]. If the instrument is valid then this means that the instrument can be used to measure. The validity test tests whether the instrument is appropriate for identifying student learning patterns.
The validity test in this study used a simple Pearson product-moment correlation formula using Minitab 16 software. The significance level used in this study was 5%, with a 95% confidence level. The following are the validity test results for the variables X1, X2, X3, Y1, Y2, and Y3 (See Table 3).
The table above shows the significance value of the correlation in each statement on the variables cognitive (X1), socio-affective (X2), empirical practice (X3), moderate thoughts (Y1), moderate feelings (Y2), and behavior moderate (Y3) to the total value of the statement. From the 10 attributes of each of these variables it can be seen that all attributes have a p-value <alpha (0.05) so the decision is Reject H0, which means that all attribute items are valid.
The next step is to conduct a reliability test, in which this test is used to obtain reliable measurement results for several measurements on the same group of subjects and produces relatively similar results. The reliability test in this study used the Cronbach’s Alpha formula using Minitab 16 software. The following are the reliability test results for variables X1, X2, X3, Y1, Y2, Y3 (See Table 4).
The table above shows the Cronbach’s Alpha values for X1, X2, X3, Y1, Y2, Y3 respectively 0.764, 0.876, 0.880, 0.740, 0.879, 0.893 where this number is greater than equal to 0.700, so that a decision can be taken Rejecting H0. This means that the reliability measurement results for the variables X1, X2, X3, Y1, Y2, Y3 are relatively the same or the same

5. Results

5.1. Research Findings

This study aims to investigate the influence of learning patterns on the behavior of religious tolerance. Variable learning patterns are divided into three aspects: (1) Cognitive Patterns, (2) Socio-Affective Patterns, and (3) Practical-Empirical Patterns. While the variable of religious tolerance is divided into: (1) domains of knowledge of religious tolerance, (2) feelings of religious tolerance, and (3) actual acts of religious tolerance. This study uses multiple linear regression analysis methods. Before carrying out multiple linear regression analysis tests, it is necessary to conduct a descriptive analysis first to find out the general description of the data used in the study. The following is an overview of the gender of the respondents in this study. Figure 6 shows the gender of the respondents.
In the picture above, it can be seen that the majority of respondents are female (n = 320 respondents consisting of 240 female and 80 male respondents). The following is an overview of the Cumulative Grade Point Average (GPA) for Islamic courses and religious tolerance as a curriculum that aims explicitly to enable students to be intolerant. Figure 7 shows the value of Islamic courses and religious tolerance.
See Table 5 to understand the descriptive statistics on the GPA variable.
Based on the table above, it is known that the range of GPA scores for students taking Islamic courses and religious tolerance is 3.20 to 4.00, with an excellent GPA of 3.72. Based on the picture above, it can be seen that the majority (186 respondents) scored an A (Very Good) on the subject of Islam and religious tolerance, and 115 respondents scored a B+ (Good). In addition to the above, we compiled a list of respondents who have attended a non-formal religious education institution, which in Indonesian society is called a pesantren, with the following details. Figure 8 shows the bar chart of the history of non-formal religious education (pesantren) that the respondent has attended.
The picture above shows that 163 respondents have never attended non-formal religious education (category 1). Sixty-eight respondents attended Islamic boarding school education for fewer than three years (category 2), and eighty-nine respondents attended Islamic boarding school education for more than three years (category 3).
The next step is to look at the relationship between variables using a matrix plot. Figure 9 shows the matrix plot between variables.
The picture above, shows the relationship between the variables X1, X2, X3, and Y1 visually. Variables X1, X2, X3, and Y2 as well as X1, X2, X3, and Y3 show a linear line. The linear line can be seen as the green line moving from the bottom left to the top right. It indicates a positive correlation or can be said to have a directly proportional relationship. In addition to using the matrix plot, seeing the relationship between variables can also be done with the Pearson product-moment correlation test. The following is the result of the Pearson product-moment correlation test calculation (See Table 6).
Based on the table above, it can be seen that all p-values < alpha (0.050), so the decision that can be taken is to reject H0 because it has a p-value < alpha (0.050), which means that there is a relationship between the independent variables (X1, X2, X3) with the dependent variable (Y1, Y2, Y3). Furthermore, after the correlation test, it is also necessary to carry out a multicollinearity test to see if there is a relationship between the predictor variables. Multicollinearity can be seen from the VIF (Variance Inflation Factor) value. The following are the results of the multicollinearity test (See Table 7).
The table above shows that there is no multicollinearity. The score of each variable is less than 10.
After the multicollinearity test, the next stage can be tested with multiple linear regression analysis In the trial, several assumptions must be fulfilled, namely the assumption test of identical, independent, and average distribution residuals.

5.2. The Cognitive (X1), Socio-Affective (X2), and Empirical-Practice (X3) Variables Influence Learning Patterns on the Understanding of Religious Tolerance (Y1)

5.2.1. Identical Residual Assumption Test

Testing the assumption of identical residuals can be done by using the Gletjser test. For example, the following is the result of the analysis of the belief that the residuals are identical (See Table 8).
The table above shows the p-value (0.240) being more significant than the alpha (0.05). Therefore, a decision that fails to reject H0 can be taken. The residual data on cognitive learning patterns, socio-affective learning patterns, and empirical-practice learning patterns on students’ thoughts of religious tolerance are identical or homogeneous.

5.2.2. Independent Residual Assumption Test

Testing the assumption of independent residuals can be done with the Durbin–Watson test. The following are the results of the Durbin-Watson test (See Table 9).
The Durbin–Watson value is 1.808, between dU(1.790) and 4-dU (2.210) intervals. Therefore, the decision taken is to fail to reject H0. The residual data on cognitive learning patterns, socio-affective learning patterns, and empirical-practice learning patterns on students’ thoughts of religious tolerance has been independent.

5.2.3. Normal Distribution Residual Assumption Test

The normal distribution residual assumption test is used with the Kolmogorov–Smirnov method as shown in Figure 10.
Based on the picture above, it can be seen that visually the data is usually distributed because the red plots are located between the linear lines that are formed. This distribution can also be seen from the p-value, where the p-value (0.097) is more than alpha (0.05). This means that a decision can be taken, namely failing to reject H0. The conclusion is that the residual data on cognitive learning patterns, socio-affective learning patterns, and empirical-practice learning patterns on students’ thoughts of religious tolerance have been normally distributed. The residual assumption test has been carried out. The next step is to use a multiple linear regression analysis. The first step in this analysis is parameter estimation. The following is a multiple linear regression model obtained from the measure of the parameters of the dependent variable Y1 with X1, X2, and X3:
Y ^ 1 = 13.3 + 0.452 X 1 + 0.097 X 2 + 0.084 X 3
The meaning of the linear regression model equation above is that if the value of the cognitive learning pattern increases by one, then the thought score of religious tolerance will increase by 0.452, assuming the values of other variables are constant. Suppose the value of the socio-affective learning pattern rises by one. In that case, the score for thoughts of religious tolerance will increase by 0.097, assuming the values of other variables are constant. Finally, suppose the value of the empirical practice learning pattern rises by one. In that case, the thought score of religious tolerance will increase by 0.084, assuming the values of the other variables are constant.
The next stage is to conduct a simultaneous test. Simultaneous testing is used to test the effect of the independent variables on the dependent variable. The following are the results of the simultaneous test analysis (See Table 10).
Based on the table above, it can be seen that the p-value (0.000) <alpha (0.050) and the F (53.53) > Ftable (2.63). Therefore, it can be decided that reject H0. It means that there is at least one variable between cognitive learning patterns, socio-affective learning patterns, and empirical, practical learning patterns that significantly affect students’ thoughts of religious tolerance. After conducting a simultaneous test, the next step is to conduct a partial test. Partial testing is used to determine which variables significantly affect the variable of students’ religious tolerance thoughts. Following are the partial test results (See Table 11).
The table above shows that cognitive, socio-affective, and empirical, practical learning patterns significantly affect knowledge about religious tolerance. the p-value of all independent variables is less than alpha (0.05), and the calculated t-value of all independent variables has a higher number than the value of t table = 1.97 (t > t table). t the cognitive learning pattern variable has a more significant influence on students’ thoughts of religious tolerance than other independent variables. The goodness of the model (R-sq) obtained is 33.7%. That is, the model can explain the diversity of the data by 33.7%.In comparison, the remaining 66.3% is explained by other variables not included in the model.

5.3. The Effect of Cognitive (X1), Socio-Affective (X2), and Empirical Practice (X3) Learning Patterns on the Feeling of Religious Tolerance (Y2)

5.3.1. Identical Residual Assumption Test

Testing the assumption of identical residuals can be done using the Gletjser test. The following is the result of the analysis of the belief that the residuals are similar (See Table 12).
The table above shows the p-value (0.455) is more significant than the alpha (0.05). It can be taken a decision that failed to reject H0. The residual data on cognitive learning patterns, socio-affective learning patterns, and empirical, practical learning patterns on students’ affection for religious tolerance are identical or homogeneous.

5.3.2. Independent Residual Assumption Test

Testing the assumption of independent residuals can be done with the Durbin-Watson test. The following are the results of the Durbin-Watson test (See Table 13).
The Durbin Watson value is 1.871, which is between dU (1.790) and 4-dU (2.210) intervals. Therefore, the decision taken is to fail to reject H0. The residual data on cognitive learning patterns, socio-affective learning patterns, and empirical, practical learning patterns on students’ affection for religious tolerance is independent.

5.3.3. Normal Distribution Residual Assumption Test

The assumption test of normal distribution residuals is used with the Kolmogorov-Smirnov method as shown in Figure 11.
Based on the picture above, it can be seen that visually the data is usually distributed because the red plots are located between the linear lines that are formed. It can also be seen from the p-value, where the p-value (> 0.150) is more significant than the alpha (0.05). Therefore, a decision can be taken, namely failing to reject H0, so the conclusion is that the residual data on cognitive learning patterns, socio-affective learning patterns, and empirical practice learning patterns on students’ affection of religious tolerance have been normally distributed.
Next are the multiple linear regression analysis tests. The first step in this analysis is parameter estimation. The following is a multiple linear regression model obtained from the assessment of the parameters of the dependent variable Y2 With X1, X2, and X3
Y ^ 2 = 13.1 + 0.422 X 1 + 0.153 X 2 + 0.085 X 3
The meaning of the linear regression model equation above is that if the value of the cognitive learning pattern increases by one, the score for the affection of religious tolerance will increase by 0.422, assuming the values of other variables are constant. Suppose the value of the socio-affective learning pattern rises by one. In that case, the score for religious tolerance will increase by 0.153, assuming the values of other variables are constant. Finally, suppose the value of empirical practice learning patterns increases by one. In that case, the number of affections of religious tolerance will increase by 0.085, assuming the value of other variables is constant. The next stage is to conduct a simultaneous test. Simultaneous testing is used to test the effect of the independent variables on the dependent variable. The following are the results of the simultaneous test analysis (See Table 14).
Based on the table above, it can be seen that the p-value (0.000) < alpha (0.050) or lesser than the alpha value, and the F (50.20) > F-table (2.63). Therefore, it can be decided that H0 is rejected. At least one variable between cognitive learning patterns, socio-affective learning patterns, and empirical, practical learning patterns significantly affects students’ affection for religious tolerance. After conducting a simultaneous test, the next step is to conduct a partial test. Partial testing is used to determine which variables significantly affect the variable of students’ religious tolerance thoughts. Following are the partial test results (See Table 15).
The table above shows that the variables of cognitive learning patterns, socio-affective learning patterns, and empirical, practical learning patterns significantly affect students’ affection for religious tolerance. the p-value of all independent variables less than alpha (0.05), and the calculated t of all independent variables has a higher number than the value of t table = 1.97 (t > t table). It can also be seen that the variables of cognitive learning patterns and socio-affective learning patterns have a more significant influence on students’ affection for religious tolerance than other independent variables.
The goodness of the model (R-sq) obtained is 32.3%. That is, the model can explain the diversity of the data by 32.3%. In comparison, the remaining 67.7% is explained by other variables not included in the model.

5.4. The Influence of Cognitive (X1), Socio-Affective (X2), and Empirical Practice (X3) Learning Patterns on the Behavior of Religious Tolerance (Y3)

5.4.1. Identical Residual Assumption Test

The assumption Test of identical residuals can be done using the Gletjser test. The following is the result of the analysis of the assumption that the residuals are similar (See Table 16).
The table above shows that the p-value (0.326) is more significant than the alpha (0.05). Therefore, it can be taken a decision that failed to reject H0. This means that the residual data on cognitive learning patterns, socio-affective learning patterns, and empirical, practical learning patterns on students’ religious tolerance behavior are identical.

5.4.2. Independent Residual Assumption Test

Testing the assumption of independent residuals can be done with the Durbin-Watson test. The following are the results of the Durbin-Watson test (See Table 17).
The table above shows that the Durbin Watson value is 1.801 between the dU (1.790) and 4-dU (2.210) intervals,. Therefore, the decision taken is to fail to reject H0 whichmeans that the residual data on cognitive learning patterns, socio-affective learning patterns, and empirical, practical learning patterns on students’ religious tolerance behavior are independent.

5.4.3. Normal Distribution Residual Assumption Test

Testing the assumption of normal distribution residuals using the Kolmogorov–Smirnov method as shown in Figure 12.
Based on the figure above, it can be seen that visually the data is normally distributed because the red plots are located between the formed linear lines. Moreover, as seen from the results of testing, the assumption of normal distribution using the Kolmogorov–Smirnov test obtains, since the p-value (> 0.150) is greater than the alpha (0.05), which means that a decision is failing to reject H0. The conclusion is that the residual data on cognitive learning patterns, socio-affective learning patterns, and empirical-practical learning patterns on students’ religious tolerance behavior have been normally distributed.
Next are the multiple linear regression analysis tests. The first step in this analysis is parameter estimation. The multiple linear regression model was obtained by estimating the parameters of the dependent variable Y3 with X1, X2, and X3:
Y ^ 3 = 15.8 + 0.277 X 1 + 0.155 X 2 + 0.166 X 3
The meaning of the linear regression model equation above is that if the value of the cognitive learning pattern increases by one, the religious tolerance behavior score will increase by 0.277, assuming the values of other variables are constant. Next, suppose the value of the socio-affective learning pattern rises by one. In that case, the behavior score for religious tolerance will increase by 0.155, assuming the values of other variables are constant. Finally, suppose the value of the empirical-practice learning pattern rises by one. In that case, the religious tolerance behavior score will increase by 0.166, assuming the values of other variables are constant. The next stage is to conduct a simultaneous test. Simultaneous testing is used to test the effect of the independent variables on the dependent variable. The following are the results of the simultaneous test analysis (See Table 18).
Based on the table above, it can be seen that the p-value (0.000) < alpha (0.050) and the F (35.65) > F-table (2.63). Therefore, it can be decided to reject H0. The table shows that at least one variable between cognitive learning patterns, socio-affective learning patterns, and empirical-practical learning patterns significantly affects students’ religious tolerance behavior.
After conducting a simultaneous test, the next step is to conduct a partial test. Partial testing is used to determine which variables significantly affect the variable of students’ religious tolerance thoughts. The following are the partial test results (See Table 19).
The table above shows that cognitive learning patterns, socio-affective learning patterns, and empirical-practical learning patterns significantly affect students’ religious tolerance. The evidence shows that the p-value of all independent variables is less than alpha (0.05), and the calculated t-value of all independent variables has a higher number than the value of t table = 1.97 (t > t table). It can also be seen that the variables of cognitive learning patterns, socio-affective learning patterns, and empirical-practical learning patterns have an equally significant influence. The goodness-of-fit of the model (R-sq) obtained is 25.3%. That is, the model can explain the diversity of the data by 25.3%. The remaining 74.7% is explained by other variables not included in the model.

6. Discussion

The analysis results of the simultaneous test (F-test) show that the three learning patterns significantly influence religious tolerance. The data can be seen from the p-value (0.00) < alpha (0.05 and F > F-table). This study shows that: First, the level of student knowledge about religious tolerance is dominantly influenced by cognitive learning patterns with values (p-Value (0.00) < alpha (0.05)) and t values (10.21) > t table (1.97). The socio-affective score is (p-Value (0.021) < alpha (0.05)) and t value (2.32) > t table (1.97). In contrast, practical-empirical learning patterns show the most minor influence with a value (p-Value (0.045) < alpha (0.05)) and t (2.01) > t-table (1.97). Second, awareness of affection of religious tolerance is more dominantly influenced by cognitive and socio-affective learning patterns. The respective values are (p-Value (0.00) < alpha (0.05)); (t (9.50) > t table (1.97)); and (p-Value (0.00) < alpha (0.05)); (t (3.65) > t table (1.97)). Of course, this figure is better than the empirical-practical learning pattern, which only has a p-Value of 0.043 (p-Value (0.43) < alpha (0.05)); (t (2.03) > t table (1.97)). Third, towards tolerant actions, cognitive, socio-affective, practical-empirical learning patterns have the same effect, namely (p-Value (0.00) < alpha (0.05)).
The research findings indicate that three trends link cognitive learning and socio-affective patterns with religious tolerance. First, the cognitive learning pattern influences students’ understanding of religious tolerance, with a p-Value reaching 0.00, followed by a socio-affective pattern with a p-Value of 0.021. In contrast, practical-empirical learning patterns show the most minor effect, with a p-Value reaching 0.045.
These results are in line with the literature study by Saputri et al., which stated that cognitive learning patterns encourage students to improve their thinking skills [23]. The patterns drive the brain-based abilities needed to perform any task, from the simple to the most complex [40]. Furthermore, research conducted by Kusumaningtias (2013) would support the results of this study. He explained that someone with a cognitive learning strategy that is too dominant sometimes overrides practice and feeling; he only stops acting on the thinking side but does not carry out or feel what he is thinking [41].
In the second result, this study shows that all X variables fully influence affection of tolerance. The magnitude of the influence of the cognitive learning and socio-empirical learning patterns has a p-Value of 0.00. In other words, these two understanding patterns contribute to determining students’ affection for tolerance. Of course, this figure is better than the empirical-practical learning pattern, which only has a p-Value of 0.043 in its effect on forming affection of tolerance. So, the meaning of this data shows that cognitive learning and socio-empirical learning patterns greatly influence affection of tolerance. However, practical-empirical learning patterns also have an influence, although it is small.
Of course, this second set of data is in line with the expression of Waters [42], which states that thoughts and social conditions influence affection. Cognitive learning patterns emphasize the ability to remember and think logically [43] and understand causal concepts rationally and systematically [44]. Meanwhile, socio-affective learning patterns tend to emphasize emotions, such as appreciation, values, affection, enthusiasm, interests, and attitudes toward things [45]. The correlation between the two is at the level of feeling, where the feeling is a form of order traveling from the mind’s work [46] so that the balance between cognitive and socio-affective learning patterns becomes a unique combination to create affection of tolerance.
Somewhat differently, the results of this second study contradict the conclusions of Timothy Plex’s research, which state that a person’s affection is a form of spontaneous action without thinking. Also, contrary to what Suzi Jagger explained, the socio-affective treatment is a subjective treatment that overrides thinking [47]. This research confirms that cognitive learning patterns that prioritize reason and socio-affective ones that emphasize affection have the same significant influence in shaping students’ affection of tolerance. This finding certainly supports Fadli and Ulil’s research, in line with the research described in the previous paragraph, that affection for tolerance is also influenced by a person’s knowledge of the phenomenon of religious tolerance [48].
In the third trend, this study shows that tolerant behavior is significantly influenced by all learning patterns studied in the research. Cognitive learning patterns have a p-Value of 0.00, and socio-affective and practical-empirical learning patterns have a p-Value of 0.00. These data indicate that in this research, cognitive learning patterns, socio-affective learning patterns, and empirical-practical learning patterns have the same influence in encouraging students to display tolerant actions. This may be in line with Jensen’s research, which states that attitude is a conclusion from behavior [49]; in other words, a person’s behavior is a form of embodiment of what he thinks and feels.
However, the data from the third research are at odds with the study mentioned by Utami, which explains that action is only based on habits or traditions that already exist in the surrounding environment, not thoughts [50]. Alternatively, Widiyati’s analysis explains that actual action is determined by the emotional state of the perpetrator [51]. Of course, this is nothing new because both of these studies received criticism from Mutiar et al., who explained that actions are carried out based on the actor’s specific goals. He strives to achieve his goals himself. In other words, value rationality has a role in determining personal action choices.
Overall, the data from this study indicate that the cognitive learning pattern has a more significant influence on the formation of tolerant thinking, besides being influenced by the other two learning patterns, even though in a small percentage. Whereas in the realm of affection, research shows that cognitive and socio-affective learning patterns have an equally dominant influence compared to empirical-practical learning patterns. Meanwhile, in the realm of tolerant behavior, this study shows that cognitive, socio-affective, and practical-empirical learning patterns have the same influence in shaping students’ tolerant attitudes.

7. Conclusions

This study explains that learning patterns can affect student behavior regarding religious tolerance. The results of the research showed that cognitivemodels of learning are more dominant in influencing students’ understanding of religious tolerance. Meanwhile, the feeling of being able to be tolerant is more dominantly influenced by socio-empirical learning patterns. However, practical-empirical learning patterns also have an influence, although it is small. In the third trend, this study shows that religious tolerance is significantly influenced by all learning pattern variables, including cognitive, socio-affective, and practical-empirical. Finally, lecturers carry out learning strategies that support the implementation of practical-empirical learning patterns.

Author Contributions

Conceptualization, M.J., N. and S.H.; methodology, M.J., N. and S.H.; software, N. and S.H.; validation, M.J. and Z.H.; formal analysis, M.J.; investigation, M.J. and N.; resources, S.H. and Z.H.; data curation, M.J.; writing—original draft preparation, M.J., N. and S.H. writing—review and editing, Z.H.; visualization, M.J.; supervision, and S.H. and Z.H.; project administration, S.H.; funding acquisition, M.J., N. and S.H. All authors have read and agreed to the published version of the manuscript.

Funding

This research was funded by Walisongo State Islamic University Semarang, Indonesia, grant 564/Un.08/L.1/TA.00.01/05/2022.

Institutional Review Board Statement

Ethical review and consent were waived for this study because the fact that all participants in this study have completed ethical approval for grants from Walisongo State Islamic University Semarang.

Informed Consent Statement

Informed consent was obtained from all subjects involved in the study.

Data Availability Statement

Data collected in this study can be shared upon request from one of the researchers.

Conflicts of Interest

The authors declare no conflict of interest.

References

  1. Dinsmore, D. Toward a dynamic, multidimensional research framework for strategic processing. Educ. Psychol. Rev. 2017, 29, 235–268. [Google Scholar] [CrossRef]
  2. Nasikhin, N.; Ghofur, A.; Rokhmadi, R.; Albab, U. Islamic Educational Thought: Zakiyah Darajat’s Perspective. AAU 2022, 8, 95–107. [Google Scholar] [CrossRef]
  3. Murphy, D.D. Teaching that Transforms: Worship as the Heart of Christian Education; Wipf and Stock Publishers: Columbus, OH, USA, 2007. [Google Scholar]
  4. Hick, J.H. Problems of Religious Pluralism; Springer: Berlin/Heidelberg, Germany, 1985. [Google Scholar]
  5. Kafatos, A.G.; Vlachonikolis, I.G.; Codrington, C.A. Nutrition during pregnancy: The effects of an educational intervention program in Greece. Am. J. Clin. Nutr. 1989, 50, 970–979. [Google Scholar] [CrossRef] [PubMed]
  6. Clarke, J. The Epistemological Relationship between Culture and Embodiment: Ethics and Christian Religious Education in a Plural World; Claremont School of Theology: Claremont, CA, USA, 1997. [Google Scholar]
  7. Feldman-Maggor, Y.; Blonder, R.; Tuvi-Arad, I. Let them choose: Optional assignments and online learning patterns as predictors of success in online general chemistry courses. Internet High. Educ. 2022, 55, 100867. [Google Scholar] [CrossRef]
  8. Dowd, R.A. Religious diversity and religious tolerance: Lessons from Nigeria. J. Conflict. Resolut. 2016, 60, 617–644. [Google Scholar] [CrossRef]
  9. Nasikhin, N.; Raaharjo, R. Moderasi Beragama Nahdlatul Ulama Dan Muhammadiyah Dalam Konsep Islam Nusantara Dan Islam Berkemajuan. Islam. Rev. J. Ris. Dan Kaji. Keislam. 2022, 11, 19–34. [Google Scholar] [CrossRef]
  10. Marintan, D.; Priyanti, N.Y. Pengaruh Pola Asuh Demokratis terhadap Keterampilan Sikap Toleransi Anak Usia 5-6 Tahun di TK. J. Obs. J. Pendidik. Anak Usia Dini 2012, 6, 5331–5341. [Google Scholar] [CrossRef]
  11. Vermunt, J.D.; Donche, V. A Learning Patterns Perspective on Student Learning in Higher Education: State of the Art and Moving Forward. Educ. Psychol. Rev. 2017, 29, 269–299. [Google Scholar] [CrossRef] [Green Version]
  12. Venkatesan, T.; Levinthal, D.J.; Tarbell, S.E. Guidelines on management of cyclic vomiting syndrome in adults by the American Neurogastroenterology and Motility Society and the Cyclic Vomiting Syndrome Association. Neurogastroenterol Motil. 2019, 31 (Suppl. S2), e13604. [Google Scholar] [CrossRef] [Green Version]
  13. Nasikhin, N.; Shodiq, S. Different Perspective Of Religious Education In Islamic Theology Ans West Theology. J. Al-Fatih 2021, 4, 328–342. [Google Scholar]
  14. Utaminingsih, S.; Utomo, S.; Zamroni, E. Strengthening of Indonesian Islamic Character Though Islamic Education Management Based of Soft Skills. Addin 2017, 11, 215–242. [Google Scholar] [CrossRef] [Green Version]
  15. Welianto, A. Daftar Suku Bangsa di Indonesia. Available online: https://www.kompas.com/skola/read/2020/01/04/210000869/daftar-suku-bangsa-di-indonesia?page=all (accessed on 16 January 2023).
  16. Saefudin, A.; Rohman, F.; Karwadi, K.; Nasikhin, N. Active Non-Violence Education in Rural Culture: Religious Moderation Practices in Plajan Pakis Aji Jepara. JPI 2022, 33, 287–308. [Google Scholar] [CrossRef]
  17. Stanton, G.N.; Stroumsa, G.A.; Stroumsa, G.G. Tolerance and Intolerance in Early Judaism and Christianity; Cambridge University Press: Cambridge, UK, 1998. [Google Scholar]
  18. Kuswanjono, A. Pluralisme Pancasila. J. Filsafat 2006, 16, 77–93. [Google Scholar]
  19. Rudenko, S.; Tedjakusuma, A.P. Wonderful Indonesia country marketing campaign-how visible Indonesia as a tourism destination for Europeans. In Proceedings of the 15th International Symposium on Management (INSYMA 2018); Atlantis Press: Amsterdam, The Neatherlands, 2018. [Google Scholar]
  20. Lonka, K.; Olkinuora, E.; Makinen, J. Aspects and prospects of measuring studying and learning in higher education. Educ. Psychol. Rev. 2004, 16, 301–331. [Google Scholar] [CrossRef]
  21. Setara Institut, Memahami Situasi Intoleransi, Jakarta. Available online: https://setara-institute.org/memahami-situasi-intoleransi/ (accessed on 16 January 2023).
  22. Saputri, W. Keterampilan Metakognitif Mahasiswa Calon Guru dan Hubungannya dengan Pola Pembelajaran Dosen. Didakt. Biol. J. Penelit. Pendidik. Biol. 2017, 1, 113–121. [Google Scholar]
  23. Nasikhin, N.; Shodiq, S.; Albab, U.; Al-Ami, B.; Ismutik, I. Tantangan Pendidikan Agama Islam di Era Posh Truth. Al Manam J. Pendidik. Dan Studi Keislam. 2022, 25–36. [Google Scholar]
  24. Karina, A.G.A. An analysis of socio-affective strategies used by students in speaking skill: A case study at Muhammadiyah University of Makassar. J. Penelit. Keagam. 2021, 18. [Google Scholar]
  25. Ural, A. Ortaokul matematik öğretmenlerinin bilgi iletişim teknolojisi ve praktic empirik beceri kullanımlarının incelenmesi. Turk. J. Comput. Math. Educ. 2015, 6, 93–116. [Google Scholar]
  26. Coffield, F.; Moseley, D.; Hall, E.; Ecclestone, K.; Coffield, F.; Moseley, D.; Ecclestone, K. Learning styles and pedagogy in post-16 learning: A systematic and critical review. Think Evid. 2004, 53, 144–172. [Google Scholar]
  27. Vermunt, J.D.; Vermetten, Y.J. Patterns in student learning: Relationships between learning strategies, conceptions of learning, and learning orientations. Edu. Psy. Rev. 2004, 16, 359–384. [Google Scholar] [CrossRef]
  28. Liao, X.; Luo, H.; Xiao, Y.; Ma, L.; Li, J.; Zhu, M. Learning Patterns in STEAM Education: A Comparison of Three Learner Profiles. Educ. Sci. 2022, 12, 614. [Google Scholar] [CrossRef]
  29. Delis, D.C.; Massman, P.J.; Butters, N.; Salmon, D.P.; Cermak, L.S.; Kramer, J.H. Profiles of demented and amnesic patients on the California Verbal Learning Test: Implications for the assessment of memory disorders. Psychol. Assess. A J. Consult. Clin. Psychol. 1991, 3, 19. [Google Scholar] [CrossRef]
  30. Hawk, T.F.; Shah, A.J. Using learning style instruments to enhance student learning. Decis. Sci. J. Innov. Educ. 2007, 5, 1–17. [Google Scholar] [CrossRef]
  31. Jones, G.R.; George, J. Comtemporary Management; McGraw-Hill Irwin: New York, NY, USA, 2009. [Google Scholar]
  32. Wegner, E. Poor people’s beliefs and the dynamics of clientelism. J. Theor. Politics 2021, 33, 300–332. [Google Scholar]
  33. Alam, M. Studi Implementasi Pendidikan Islam Moderat Dalam Mencegah Ancaman Radikalisme Di Kota Sungai Penuh Jambi. J. Islam. 2017, 17, 17–40. [Google Scholar] [CrossRef]
  34. Koesel, K.J.; Bunce, V.J. Diffusion-proofing: Russian and Chinese Responses to Waves of Popular Mobilizations against Authoritarian Rulers. Perspect. Politics 2013, 11, 753–768. [Google Scholar] [CrossRef]
  35. Tempe, P. Learning Spaces for the 21st Century: A Review of the Literature; Higher Education Academy: York, UK, 2007. [Google Scholar]
  36. Delice, A. The Sampling Issues in Quantitative Research. Educ. Sci. Theory Pract. 2010, 10, 2001–2018. [Google Scholar]
  37. Bloomfield, J.; Murray, J.F. Quantitative research design. J. Australas. Rehabil. Nurses Assoc. 2019, 22, 27–30. [Google Scholar] [CrossRef]
  38. Budiyono, H. Penelitian kuantitatif proses pembelajaran menulis: Pengumpulan dan analisis datanya. Pena 2015, 3. [Google Scholar]
  39. Széll, K.; Károlyi, B.; Fehérvári, A. Learning Patterns at the Time of COVID-19-Induced School Closures. Soc. Sci. 2022, 11, 392. [Google Scholar] [CrossRef]
  40. Wicaksono, A.G.C. Hubungan keterampilan metakognitif dan berpikir kritis terhadap hasil belajar kognitif siswa SMA pada pembelajaran Biologi dengan strategi reciprocal teaching. J. Pendidik. Sains 2014, 2, 85–92. [Google Scholar]
  41. Waters, E.A. Feeling good, feeling bad, and feeling at-risk: A review of incidental affect’s influence on likelihood estimates of health hazards and life events. J. Risk Res. 2008, 11, 569–595. [Google Scholar] [CrossRef]
  42. Fealy, G. The politics of religious intolerance in Indonesia: Mainstream-ism trumps extremism? In Religion, Law and Intolerance in Indonesia; Routledge: London, UK, 2016; pp. 115–131. [Google Scholar]
  43. Ilya, I. Studi Analisis Fatwa MUI Nomor 56 Tahun 2016 Tentang Hukum Menggunakan Atribut Keagamaan Non-Muslim Ditinjau Dari Prinsip Toleransi di Indonesia. Undergraduate Thesis, Universitas Islam Negeri Maulana Malik Ibrahim, Kota Malang, Indonesia, 2017. [Google Scholar]
  44. Clark, J. The Conditions of Islamist Moderation: Unpacking Cross-ideological Cooperation in Jordan. Int. J. Middle East Stud. 2006, 38, 539–560. [Google Scholar] [CrossRef]
  45. Hasani, I.; Ikhsan, Y.; Supriyanto, I.I. Melawan Intoleransi Di Tahun Politik Kondisi Kebebasan Beragama/Berkeyakinan Di Indonesia. J. Kemasyarakatan 2018, 10, 239–260. [Google Scholar]
  46. Demiralp, S. The Rise of Islamist Entrepreneurs and the Decline of Islamic Radicalism in Turkey. Comp. Politics 2009, 41, 315–336. [Google Scholar] [CrossRef]
  47. Fadli, U. Perkembaangan Toleransi Beragama di Era New Normal. Menyemai Damai Dengan Toleransi, Beragama. J. Pendidik. Islam 2021, 2, 235. [Google Scholar]
  48. Jensen, B.B.; Schnack, K. The action competence approach in environmental education. Environ. Educ. Res. 1997, 3, 163–178. [Google Scholar] [CrossRef]
  49. Hobert, S. Individualized learning patterns require individualized conversations–data-driven insights from the field on how chatbots instruct students in solving exercises. In Revised Selected Papers, Proceedings of the Chatbot Research and Design: 5th International Workshop, Conversations 2021, Virtual Event, 23–24 November 2021; Springer International Publishing: Cham, Switzerland, 2022. [Google Scholar]
  50. Widiyanti, W.; Wadiyo, W.; Sunarto, S. Madihin Ar Rumi: Kreativitas Musik dan Tindakan Sosial Dalam Penyajiannya. Catharsis 2016, 5, 107–113. [Google Scholar]
  51. Hamzah, A. Metode Penelitian & Pengembangan (Research & Development) uji Produk Kuantitatif dan Kualitatif Proses dan Hasil Dilengkapi Contoh Proposal Pengembangan Desain uji Kualitatif dan Kuantitatif. CV Literasi Nusantara Abadi. 2021. Available online: https://penerbitlitnus.co.id/product/metode-penelitian-pengembangan-research-development-uji-produk-kuantitatif-dan-kualitatif-proses-dan-hasil-dr-amir-hamzah-m-a/ (accessed on 2 September 2022).
Figure 1. Indonesian Human Genetic Mapping [15].
Education 13 00285 g001
Figure 2. The level of religious intolerance seen in various provinces [20].
Education 13 00285 g002
Figure 3. Elements of learning patterns adopted and influential factors.
Education 13 00285 g003
Figure 4. Research Procedures at stage 1.
Education 13 00285 g004
Figure 5. Further procedures in stage 1.
Education 13 00285 g005
Figure 6. Bar chart of respondents’ genders.
Education 13 00285 g006
Figure 7. Bar chart of Islamic course values and religious tolerance.
Education 13 00285 g007
Figure 8. Bar chart of the history of non-formal religious education (Pesantren).
Education 13 00285 g008
Figure 9. Matrix plot between variables.
Education 13 00285 g009
Figure 10. Normal distribution residual assumption test.
Education 13 00285 g010
Figure 11. Normal distribution residual assumption test.
Education 13 00285 g011
Figure 12. Normal distribution residual assumption test.
Education 13 00285 g012
Table 1. Research variables.
Variable NameSub VariableInformationData Scale
Religious tolerant (Y)Knowledge of religious tolerance (Y1)1: Totally AgreeLikert
Feeling of religious tolerance (Y2)2: Agree
Actual act of religious tolerance (Y3)3: Disagree
4: Strongly Disagree
Learning patterns (X)Cognitive (X1)1: Totally AgreeLikert
Socio-Affective (X2)2: Agree
Practical-Empirical (X3)3: Disagree
4: Strongly Disagree
Table 2. Simultaneous test ANOVA.
Source of VariationFree DegreesSum of SquaresMean of SquaresF
RegressionK S S R = b X y n y ¯ M S R = S S R k M S R M S E
Error (Remaining)nk − 1 S S E = y y b X y M S R = S S E n k 1
Totaln − 1 S S T = y y
Table 3. Validity instrument.
Statementp-Values
(X1)
p-Values
(X2)
p-Values
(X3)
p-Values
(Y1)
p-Values
(Y2)
p-Values
(Y3)
10.0000.0000.0000.0000.0000.000
20.0000.0000.0000.0000.0000.000
30.0000.0000.0000.0000.0000.000
40.0000.0000.0000.0000.0000.000
50.0000.0000.0000.0000.0000.000
60.0000.0000.0000.0000.0000.000
70.0000.0000.0000.0000.0000.000
80.0000.0000.0000.0000.0000.000
90.0000.0000.0000.0000.0000.000
100.0000.0000.0000.0160.0000.000
Table 4. Reliability Test X1, X2, X3, Y1, Y2, Y3.
Variable Cronbach’s AlphaVariable Cronbach’s Alpha
X1 0.764Y10.740
X2 0.876Y20.879
X3 0.880Y30.893
Table 5. Descriptive statistics for the GPA variable.
VariablesMeanMinimumMaximum
GPA3.723.204.00
Table 6. Pearson product moment correlation test.
VariableX1X2X3
p-Values
Y10.0000.0430.000
Y20.0000.0020.000
Y3 0.0000.0010.000
Table 7. Multicollinearity test.
VariableVIF
X11.227
X21.001
X31.228
Table 8. Identical residual assumption test.
Source of VarianceDFSSMsFp-Values
Regression12.9942.9941.380.240
Residual318687.9292.163
Total319690.923
Table 9. Independent residual assumption test.
Durbin WatsondLdU4-dL4-dU
1.8081.2101.7902.7902.210
Table 10. Simultaneous test (ANOVA).
Source of VarianceDFSSMsFp-Values
Regression31044.06348.0253.530.000
Residual Errors3162054.546.50
Total3193098.60
Table 11. Partial test (t-test).
VariableQp-ValuesDecision
X110.210.000Reject H0
X22.320.021Reject H0
X32.010.045Reject H0
Table 12. Identical residual assumption test.
Sumber VarianceDFSSMSFp-Value
Regresi11.3311.3310.560.455
Residual318755.0372.374
Total319756.368
Table 13. Assumption test of independent residuals.
Durbin WatsondLDu4-dL4-du
1.8711.2101.7902.7902.210
Table 14. Simultaneous test (ANOVA).
Source of VarianceDFSSMsFp-Values
Regression3986.27328.7650.200.000
Residual Errors3162069.406.55
Total3193055.67
Table 15. Partial test (t-test).
VariableTp-ValuesDecision
X19.500.000Reject H0
X23.650.000Reject H0
X32.030.043Reject H0
Table 16. Identical residual assumption test.
Source of VarianceDFSSMsFp-Values
Regression12.2832.2830.970.326
Residual318750.7002.361
Total319752.984
Table 17. Assumption test of independent residual.
Durbin WatsondLdU4-dL4-dU
1.8011.2101.7902.7902.210
Table 18. Simultaneous test (ANOVA).
Source of VarianceDFSSMsFp-Values
Regression3706.85235.6235.650.000
Residual Errors3162088.706.61
Total3192795.55
Table 19. Partial test (t-test).
VariableQp-ValuesDecision
X16.210.000Reject H0
X23.680.000Reject H0
X33.940.000Reject H0
Disclaimer/Publisher’s Note: The statements, opinions and data contained in all publications are solely those of the individual author(s) and contributor(s) and not of MDPI and/or the editor(s). MDPI and/or the editor(s) disclaim responsibility for any injury to people or property resulting from any ideas, methods, instructions or products referred to in the content.

