Article

Analysis of Archetypes to Determine Time Use and Workload Profiles of Spanish University Professors

1
Departament d’Educació i Didàctiques Específiques, Universitat Jaume I, 12071 Castelló de la Plana, Spain
2
Departament Matemàtiques-IF, Universitat Jaume I, 12071 Castelló de la Plana, Spain
3
Departament Matemàtiques-INIT, Universitat Jaume I, 12071 Castelló de la Plana, Spain
*
Author to whom correspondence should be addressed.
Educ. Sci. 2023, 13(3), 295; https://doi.org/10.3390/educsci13030295
Submission received: 16 December 2022 / Revised: 8 March 2023 / Accepted: 9 March 2023 / Published: 11 March 2023
(This article belongs to the Section Higher Education)

Abstract

:
Allocation of time use is important to develop appropriate policies, especially in terms of gender equality. Individual well-being depends on many factors, including how time is spent. Therefore, knowing and analysing the time use and workload of academic staff is relevant for academic policy making. We analyse the responses of 703 Spanish academic staff regarding different activities of paid work and household work (unpaid). We use an innovative machine learning technique in this field, archetype analysis, which we introduce step by step while exploring our data. We identify five profiles, and we examine gender inequalities. The findings indicate that there is a higher prevalence of women in the profiles with a greater workload in household activities and teaching-related activities, but the prevalence is the same in the profile with a greater workload in research activities.

1. Introduction

Time-use data are a key element for developing adequate regulations in all fields. Time-use data expose differences in how women and men spend their time, mostly as a result of gender roles [1]. Universities are not immune to gender norms, which also affect academic staff [2]. Previous works reveal gender differences in academia according to the distribution of time spent on different tasks [3]. In the case of Spain, a recent paper by Cabero and Epifanio [4] lays bare the gender gap in tasks related to both quality teaching and housework, as other papers point out [5,6]. This difference in time use also influences how long it takes to be promoted within the university. It is therefore crucial, both for social and academic equity, that university equality policies take these differences into account and implement policies to eradicate gender inequalities. This work is relevant to highlight these inequalities in order to recognise and tackle them.
As regards the methodologies used to analyse time-use data, they range from the simplest ones, such as descriptive techniques, to multivariate analysis techniques, which are not so common in this field, such as principal component analysis (PCA) [7] and cluster analysis (CLA) [4,7]. Those tools return exploratory analyses that provide a better understanding of the dataset. Their objective is to discover what data can reveal beyond the formal modelling or hypothesis-testing task.
Here, we propose to use a new exploratory statistical learning technique called archetype analysis (AA) [8], which is halfway between PCA and CLA. AA is more flexible than CLA and allows us to explain the data better; at the same time, however, its results are easily interpretable, even for non-experts, unlike those of PCA. Although there are previous works about time-use data among academic staff [3,4,9], none of them consider AA. Therefore, as a novelty, this is the first time that AA is applied to time-use data. As AA is an exploratory technique, this study is strictly exploratory and descriptive. No inferential statistics for testing a hypothesis are considered.
The contributions of this work are twofold. On the one hand, we introduce the AA technique for time-use data, step by step. In this way, we also introduce the use of AA as a useful tool in the field of education. Although it has been used elsewhere [10,11,12,13,14,15,16,17], unlike previous works, we adopt a pedagogical approach here, explaining the technique to facilitate the more widespread use of AA in the educational community. On the other hand, we apply AA for time-use data in the academic context. The advantages of using AA rather than other techniques are that we obtain archetypal profiles, “pure academic models”, and we can represent the academic staff as mixtures of those prototypes. The archetypal profiles are in the periphery of the data, unlike centroids or average groups. The fact that archetypes are extreme profiles is more useful in decision making [18] than considering averages, since we obtain contrastive classes. In order to make decisions, opposite or dualism allows us to understand the dataset better [19,20]. This is why AA has been used in management for many years [21,22], and it is also helpful for drawing up university policy programmes.
There is a gender pay gap in Spanish academic staff [23]. Gender inequalities are present in academia, as proven by numerous works [24,25,26,27]. Here, we explore the different archetypal profiles in Spanish academia, and the analysis is broken down by gender to discover hidden patterns. The most similar previous work is that of Cabero and Epifanio [4], since we use the same data, although univariate descriptive analysis and CLA are used in Cabero and Epifanio’s work [4] rather than AA.
In Cabero and Epifanio’s work [4], it was shown that the number of hours worked by academic staff is significantly higher than the legally stipulated hours (37.5 h) and there was also a difference according to gender and professional category. Women worked more hours per week than men on average (50.8 h compared to 47.3 h for full-time academic staff). The staff categories with the highest mean workload correspond to full-time temporary positions, but also to the highest category (professor). In this last case, the mean workload of female professors (55 h) was 7 h per week higher than that of male professors (48 h).
With AA, we obtain a richer description of the data than in Cabero and Epifanio’s work [4]. On the one hand, AA is a multivariate technique, meaning that we can handle relationships between variables, as opposed to univariate descriptive analysis. On the other hand, unlike AA, in Cabero and Epifanio’s work [4], CLA provides hard assignments of the academic staff to different groups defined by centroids. Hard assignment means that academic staff belong to a single group, but nothing is said about how strong this assignment is. However, assignments are soft in AA; therefore, we can characterise the structure of time-use data more deeply and extensively: the groups are defined by archetypes and academics can be expressed as belonging to one group or to a mixture of groups, which provides finer details. Note also the difference between groups characterised by centroids in CLA or archetypes in AA, which favours better decision making, as explained above.
In summary, this work has two main objectives: (1) to provide a step-by-step guide for using AA; and (2) to apply AA for the analysis of time-use data for the first time to show how Spanish academic staff spend their time, which is very useful for devising appropriate gender equality policies in universities.

2. Materials and Methods

2.1. Sample and Instruments

We have used the data that can be accessed in Cabero and Epifanio’s work [4]. The questionnaire used was created with Google Forms and is available at https://forms.gle/XCFHZqzYao19KdPz5 (accessed on 8 March 2023).
This questionnaire is divided into two sections; the first contains questions of a more personal nature, such as professional category, branch of knowledge, gender, age and number of children. The second section contains fourteen numbered questions in which the participating teaching staff specify the hours they spend per week on different tasks, such as face-to-face classes, answering queries, preparing teaching activities, correcting work, tutoring students, university management, research, transfer, caring for people, leisure and personal entertainment and household chores, in addition to the number of credits they have assigned, the credits of teaching reduction and the average number of hours they sleep on working days. Since the weekly timetable can vary greatly depending on the semester and even the week, the questionnaire specifies that participants should refer to work in a standard week; however, we are aware that these raw measures cannot capture all qualitative aspects of academic work, though the results of the analysis may help to clarify some doubts.
This questionnaire was answered by 703 people from 10 Spanish universities. Moreover, the percentage distribution of these people among the different categories of university teaching staff is very similar to the overall distribution of Spanish university teaching staff, except that in the case of part-time teaching staff, the percentage in the sample is lower than the percentage in the overall population. The percentage distribution in the sample according to branches of knowledge is also similar to the percentage distribution in the overall population, although the percentage in the sample is lower than in the overall population for health sciences, which is precisely where most part-time teaching staff are concentrated.
Each of the 703 participants is assigned a vector based on the answers to the questionnaire x i = ( x i 1 , x i 2 , x i 3 , x i 4 ) , i = 1 , 2 , , 703 , where x i 1 denotes the number of hours per week that the i-th person spends on tasks related to university teaching, x i 2 denotes the number of hours per week that the i-th person spends on research and transfer, x i 3 denotes the number of hours per week that the i-th person spends on management and x i 4 denotes the number of hours per week that the i-th person spends on caring for people and household chores.

2.2. Statistical Technique: Archetype Analysis

We ask ourselves whether we can obtain a number p of profiles of people, represented by vectors z j = ( z j 1 , z j 2 , z j 3 , z j 4 ) , j = 1 ,   2 , ,   p ,  so that the 703 participating individuals can be obtained as a ‘mixture’ of these p profiles of individuals, which we will call archetypes. The mathematical approach to answering this question is based on minimising a sum of distances in the space; that is, the archetypes z j  must minimise the expression:
i = 1 703 d i s t 2 ( x i   ,   j = 1 p α i j z j )             o n     α i j 0         a n d     j = 1 p α i j = 1 .
z j = i = 1 703 β i j   x i             o n     β i j   0           a n d           j = 1 703 β i j = 1 .
The experienced reader will have noticed that the number of archetypes p to be considered is fundamental; in fact, if p = 703 the solution to the problem posed is trivial, since the sum is minimised (in fact, it gives zero) when the archetypes are z j = x j and α i i = 1, α i j = 0 if i j . This leads us to comment on some interesting geometrical deductions [4]. Although our data x i  are in R 4 , the deductions will be explained for the case of the R 2 plane, where they are easier to visualise. Given a set of points in the plane, its convex envelope is defined as the convex polygon of minimum area covering all points (i.e., all points are inside the polygon). The archetypes are always inside the convex envelope of the set of points. Moreover, if the polygon defining the convex envelope has q vertices, and we are looking for a number of archetypes p = q, then the archetypes are precisely the vertices of the convex envelope. In Figure 1, we see what happens as the number of archetypes approaches the number of vertices of the convex envelope. In Figure 1a, we have a dataset in the plane and its convex envelope. In Figure 1b, we have the data, together with p = 3 archetypes and the polygon they define. In Figure 1c, we have the data and p = 5 archetypes. In Figure 1d, we have the data and p = 10 archetypes, which coincide with the vertices of the convex envelope.
If the data are points in space, this consideration is generalised, but polygons are replaced with polyhedra. In the case of higher dimensions, as in our case, it is also generalised, but it is difficult, if not impossible, to visualise. We recommend, for example, the work of the Swiss geometrician Ludwig Schläfli (1814–1895), which presents a series of regular polyhedra in dimension four.
Therefore, a distinctive property of archetype analysis is that archetypes correspond best to extreme points with respect to the dataset x i . In fact, it is shown, using simple geometric tools, that archetypes belong to the boundary of the convex envelope of the dataset.
Again, the experienced reader will have thought that, if we obtain the vertices of the convex envelope from the data, we already have not only the maximum number of archetypes but the archetypes themselves. This is true; however, obtaining the vertices is usually a difficult task. Moreover, the number of vertices may be too high, and we are statistically interested in summarising the data. Therefore, we will consider another way to analyse the “ideal” number of archetypes p to consider, and then obtain the value of the archetypes. The ideal situation is to consider few archetypes, but in such a way that the convex envelope of the archetypes and the convex envelope of the vertices are not very different (see Figure 1). However, this is equivalent to the minimum value of Equation (1) (RSS(p)), which does not vary much from a certain value of p.
In Figure 2, the minimum value (RSS(p)) of Equation (1) is plotted as a function of the number of archetypes p considered. It can be seen that, for our 703 standardised data, at the value p = 5, we have what is called an elbow, and from the number of archetypes p = 5, the value of RSS(p) remains ‘stable’; therefore, we select p = 5 as the ideal number of archetypes.
Once we have the p = 5 archetypes, all the data can be expressed approximately as:
x i j = 1 5 a i j   z j   ,         0 a i j 1 ,                 j = 1 5 a i j = 1 ,           i = 1 , ,   703 ,                       j = 1 , , 5 .
That is, each datum x i , which in our case represents one of the 703 people participating in the survey, is expressed as a mixture of the p archetypes. Moreover, as the values of a i j are between 0 and 1, it is easy to explain the weight of each archetype in percentages. In Figure 3, we have two datasets that are represented by the same four archetypes. In Figure 3a, all archetypes have a significant weight in the sum, i.e., the coefficients a i j have a similar value for the points in the central cloud. In Figure 3b, each datum is practically explained by one archetype, i.e., one value of  a i j  is close to 1 and the rest are close to zero.

3. Results and Discussion

In this section, the results of AA are analysed. We will consider the archetypal academic staff and their analysis by gender to observe if there is a gender gap for the different blocks (teaching, research, management and care). Table 1 shows the values obtained for the five archetypes z j   ,   j = 1 ,   2 ,   3 ,   4 ,   5 .
Linking the archetypes, which have extreme values as seen before, to the teaching staff, we find that archetype z1 generally devotes few hours to the activities mentioned in the questionnaire. Archetype z2 devotes many hours per week to management tasks. Archetype z3 spends many hours caring for people and the home. Archetype z4 spends many hours on research and transfer. Finally, archetype z5 devotes many hours to university teaching.
When it comes to analysing the data on the basis of the five archetypes, we will carry so out in two different ways. The first consists of dividing the 703 data into five groups and assigning each datum to the archetype group it most resembles; that is, each datum xi is assigned to the archetype group z j for which the value of the coefficient a i j in Equation (2) is largest. This way of clustering the data is similar to that used in other clustering methods [4]. Table 2 shows the number of participating teachers belonging to each of the five groups.
With this way of grouping the teaching staff, we find that approximately half belong to the group defined by the archetype that spends few hours on the different activities in the questionnaire. It should be noted that 89 of the 123 people who took part in the survey and form part of the group of part-time lecturers belong to this group, which is consistent with the fact that these people devote time to their main job outside the university. It is also logical that group G2 (high management), defined by the archetype that devotes the most hours to university management, is the least numerous.
If we construct a table similar to Table 2, but distinguishing between men and women, we obtain the results shown in Table 3. From Table 3, we can conclude that the percentages of women belonging to group G3 (high domestic) (defined by the archetype that spends many hours caring for people) and the percentage of women belonging to group G5 (high teaching) (defined by the archetype that spends many hours teaching) are higher than the respective percentages for men. On the other hand, the percentage of men in group G1 (minimal effort) is higher than that of women.
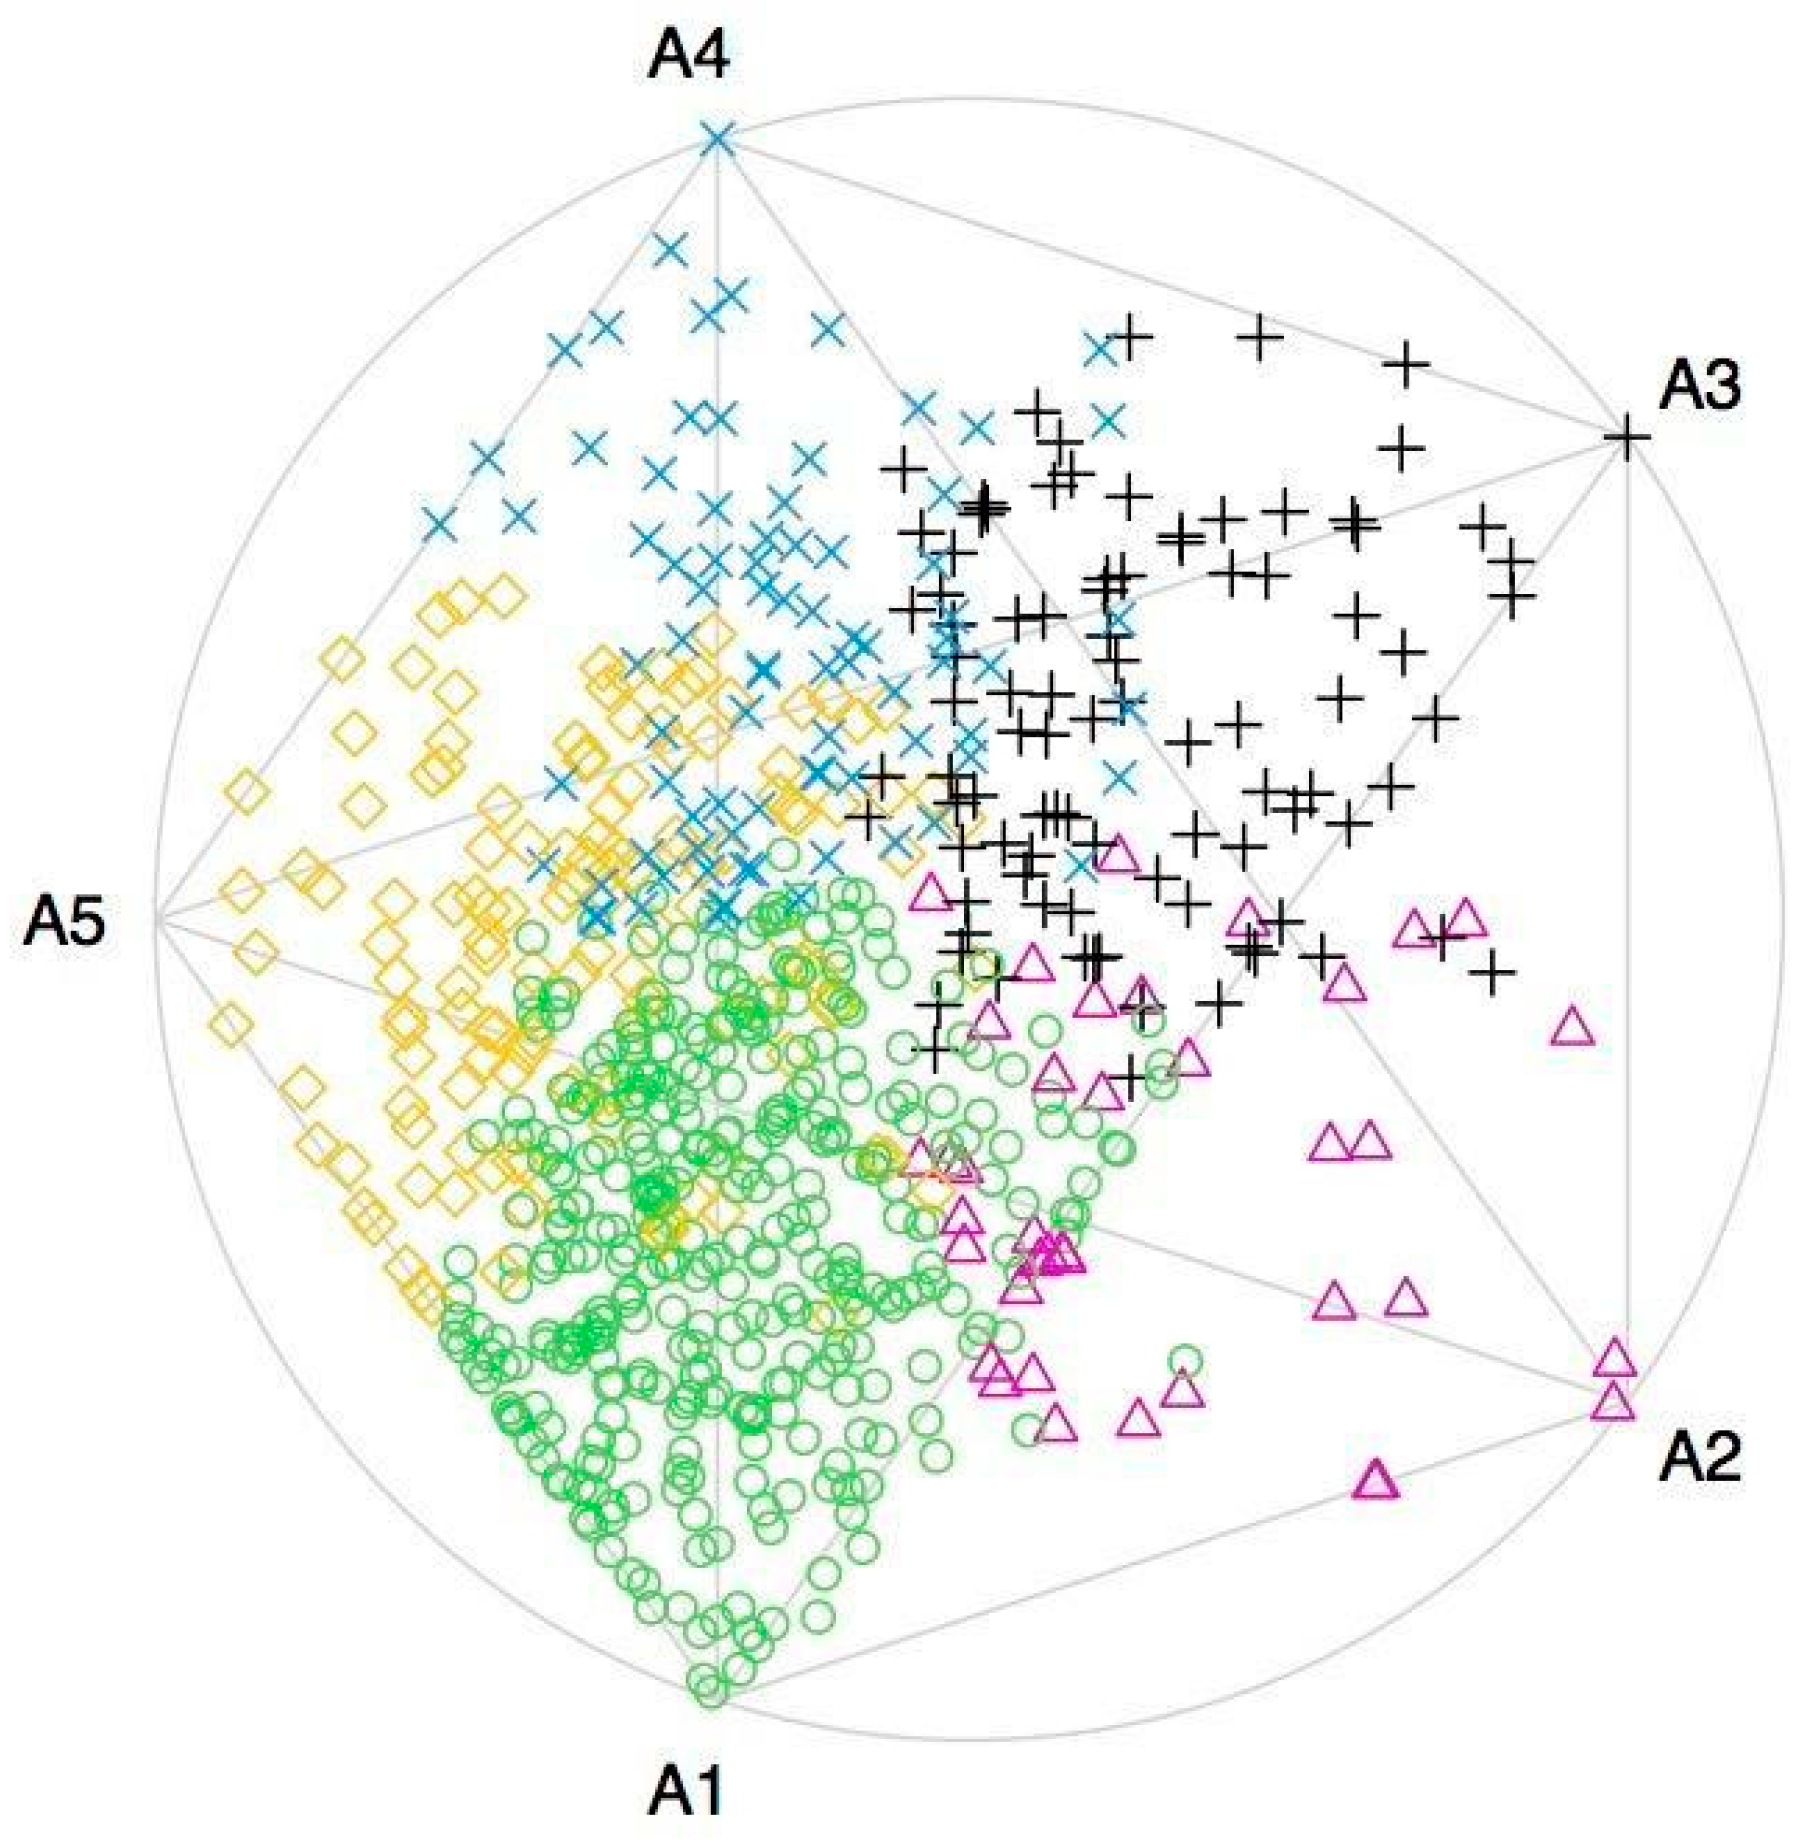
This way of assigning each datum x i  to the archetype group, for which the value of the coefficient a i j is largest, does not distinguish between very different situations as depicted in Figure 3. Since our data are in R 4 , to obtain an idea of each coefficient’s weight in the representation, we will conduct an indicative geometric visualisation based on two orthogonal projections. First, we project the data onto the convex envelope formed by the archetypes; then, we project the new points onto a plane [28]. Obviously, the result of the projection depends on the plane; thus, the visualisation is only indicative. Figure 4 shows the result of this projection; the colour (and shape) of the points relates the projected points to the group to which the original data belong. A j   points are the projections of the archetypes z j   .
From Figure 4, we can conclude that there are many data that can be practically explained by the value of one of the archetypes; however, there are also others which seem to be explained as a combination of several archetypes. Therefore, we propose a second way of analysing the data in terms of archetypes, which is as follows. Any datum x i of the 703 that has a coefficient a i j > 0.5 , i.e., is expressed mostly (more than 50%) by archetype z j , is assigned to archetype group z j . If the sum of two coefficients a i j is greater than 0.5 and none of them separately, we create a new group that will be the mixture of the two corresponding archetypes and so forth until we have each datum in one of the generated groups.
In Table 4, we have the number of groups that have been generated and the number of participating teachers belonging to each of the groups. Only three participants belong to a group defined with three archetypes, and this group does not appear in the table.
As can be seen in Table 4, 350 out of the 703 people (50%) are expressed as a single archetype, 350 as a mixture of two archetypes, and only 3 are a mixture of three archetypes. The most numerous group with a mixture of two archetypes is G1-5 (minimal effort-high teaching), a mixture of archetypes z1, which spends few hours on the activities mentioned in the questionnaire, and z5, which spends many hours on university teaching.
From Table 5, where we distinguish the results between men and women, we draw the same conclusions that we discussed as a consequence of Table 3. In addition, for the groups defined by two archetypes, the number of women belonging to group G1-4 (minimal effort–high research) (defined by the archetype that spends few hours on the activities in the questionnaire and the archetype that spends many hours on research and transfer) is lower than that of men, while in groups G1-3 (minimal effort–high domestic) (defined by the archetype that spends few hours per week on the activities in the questionnaire and the archetype that spends many hours per week on caring for people and the home) and G3-5 (high domestic and teaching) (defined by the archetype that spends many hours per week on caring for people and the home and the archetype that spends many hours per week on university teaching) the opposite is true.
Obviously, more detailed information could be provided by considering, for example, results according to different categories of teaching staff or different branches of knowledge; however, we leave it to each university to analyse and expand the information as they consider appropriate and to start a political debate on whether to maintain the groups of teaching staff that appear in the analysis presented or to take measures to redress the balance in each group.

4. Conclusions

The main tasks carried out by academic staff include teaching, research and transfer, and management. In addition to these tasks that are carried out to a large extent at the university, we must add the task of caring for people (children and dependent elderly people) and the home.
When making political decisions that, for instance, favour equality between men and women or distinguish between teachers with an exclusively teaching profile and teachers with a double teaching and research profile, it is very important to know the number of hours devoted to each of the five tasks mentioned above, as well as having an explanation of this distribution of hours through the application of an appropriate statistical model.
In this study, 703 university professors have answered a questionnaire, from which a vector with four entries has been associated with each professor. Each entry shows the number of hours per week that each teacher spends on each of the four activities. With these 703 vectors, we apply the statistical technique of archetype analysis, and the first result we obtain is that the ideal number of archetypes for analysing the information is p = 5.
These five archetypes are extreme vectors that belong to the frontier of the convex hull of the 703 vectors. Firstly, we have used these five archetypes for clustering the 703 vectors, assigning each vector to the group defined by the closest archetype. The most outstanding conclusions of this grouping are that the largest group is defined by teachers who spend little time on the four tasks (this is explained by the fact that a high percentage of teachers work part-time and have another job outside the university) and the least numerous group is defined by devoting more hours to university management. However, when we differentiate between men and women in the grouping, the most interesting finding is that the percentage of women belonging to the group defined by the archetype that devotes many hours to caring for people and the percentage of women belonging to the group defined by the archetype that devotes many hours to teaching are higher than the respective percentages of men.
Secondly, because AA allows academic staff to be represented as mixtures of these five prototypes, we analyse mixtures of groups and conclude that 350 out of the 703 people (50%) are expressed as a single archetype, 350 as a mixture of two archetypes, and only 3 as a mixture of three archetypes. The main conclusions in this case are that the most numerous group with a mixture of two archetypes is the group that devotes few hours to the activities mentioned in the questionnaire and many hours to university teaching (Group G1-5 (minimal effort–high teaching)). If we distinguish between men and women, we can highlight as conclusions that for the groups defined by two archetypes, the number of women belonging to the group defined by the archetype that spends few hours on the activities in the questionnaire and the archetype that spends many hours on research and transfer (Group G1-4 (minimal effort–high research)) is lower than that of men, while in the group defined by the archetype that spends few hours a week on the activities in the questionnaire and the archetype that spends many hours a week caring for people and the home (Group G1-3 (minimal effort–high domestic)) and in the group defined by the archetype that spends many hours a week caring for people and the home and the archetype that spends many hours a week on university teaching (Group G3-5 (high domestic and teaching)), the number of women is higher than that of men.
In view of the conclusions of this work, Spanish university policies should favour the hiring of full-time teaching staff and fight against the current gender gap.
As regards the gender gap, some specific measures that could be implemented in Spain are suggested by the Royal Spanish Mathematical Society’s Women’s Commission [29]. However, they are not specific to Spain; for example, gender neutral policies should not be used since not only do they not reduce the gender gap, but they actually increase it [30]. Meritocracy should be revised [31], and promotion criteria should include teaching performance [32]. In fact, a high research production can affect teaching quality [33]. A monographic study about gender equality in higher education and research institutions can be found in the work of Lopez, Silvestre and García [34], which presents many possible initiatives that can be carried out to reduce the gender gap, ranging from the analysis of university rankings [35] to implementing appropriate equality plans with gender-sensitive indicators [36]. Nevertheless, another line of action to change visions is to incorporate gender perspective into teaching in all disciplines, including STEM [37], despite the resistance that can be found [38], even in the use of inclusive language [39].
Finally, the authorities should also pay attention to the high number of hours spent working by many individuals, especially in G5 (high teaching), the majority of whom are women (much more than the 37.5 weekly hours stipulated in Spanish law). Those individuals could be accelerated researchers, which implies psychosocial risks [40]. Coneso and González [40] propose a change to the model of work organisation considering an ‘ethics of care’ feminist approach.

Author Contributions

Conceptualization, I.E.; methodology, I.C., I.E. and X.G.-A.; software, I.C. and I.E.; validation, I.C., I.E. and X.G.-A.; formal analysis, I.C., I.E. and X.G.-A.; investigation, I.C. and I.E.; resources, I.C. and I.E.; data curation, I.C.; writing—original draft preparation, I.E. and X.G.-A.; writing—review and editing, I.C., I.E. and X.G.-A.; visualization, I.E. and X.G.-A.; supervision, I.E.; project administration, I.E.; funding acquisition, I.E. All authors have read and agreed to the published version of the manuscript.

Funding

This research was partially supported by the Spanish Ministry of Science and Innovation (PID2020-118763GA-I00 and PID2020-115930GA-I00), Generalitat Valenciana CIGE/2021/019 and UJI-B2020-22 and UJI-A2022-11 from Universitat Jaume I, Spain.

Institutional Review Board Statement

Not applicable.

Informed Consent Statement

Not applicable.

Data Availability Statement

Data are available from [4].

Conflicts of Interest

The authors declare no conflict of interest. The funders had no role in the design of the study; in the collection, analyses, or interpretation of data; in the writing of the manuscript; or in the decision to publish the results.

References

  1. Rubiano-Matulevich, E.; Viollaz, M. Gender Differences in Time Use: Allocating Time between the Market and the Household; Policy Research Working Paper; No. 8981; World Bank: Washington, DC, USA, 2019; Available online: https://openknowledge.worldbank.org/handle/10986/32274 (accessed on 8 March 2023).
  2. Misra, J.; Lundquist, J.H.; Holmes, E.; Agiomavritis, S. The ivory ceiling of service work. Academe 2011, 97, 22–26. [Google Scholar]
  3. O’Meara, K.; Kuvaeva, A.; Nyunt, G.; Waugaman, C.; Jackson, R. Asked More Often: Gender Differences in Faculty Workload in Research Universities and the Work Interactions That Shape Them. Am. Educ. Res. J. 2017, 54, 1154–1186. [Google Scholar] [CrossRef]
  4. Cabero, I.; Epifanio, I. A Data Science Analysis of Academic Staff Workload Profiles in Spanish Universities: Gender Gap Laid Bare. Educ. Sci. 2021, 11, 317. [Google Scholar] [CrossRef]
  5. Schiebinger, L.; Gilmartin, S.K. Housework is an academic issue. Academe 2010, 96, 39–44. [Google Scholar]
  6. Smidt, T.B.; Pétursdóttir, G.M.; Einarsdóttir, Þ. How do you take time? Work–life balance policies versus neoliberal, social and cultural incentive mechanisms in Icelandic higher education. Eur. Educ. Res. J. 2017, 16, 123–140. [Google Scholar] [CrossRef]
  7. Altuzarra Artola, A.; Gálvez Gálvez, C.; González Flores, A.M. Diferencias de género en la distribución del tiempo de trabajo en las regiones españolas. Rev. Int. Sociol. 2018, 76, e105. [Google Scholar] [CrossRef]
  8. Cutler, A.; Breiman, L. Archetypal Analysis. Technometrics 1994, 36, 338–347. [Google Scholar] [CrossRef]
  9. Allen, H.L. Faculty Workload and Productivity: Gender Comparisons. In The NEA 1998 Almanac of Higher Education; National Education Assn: Washington, DC, USA, 1998; pp. 29–44. [Google Scholar]
  10. Wohlrabe, K.; Gralka, S. Using archetypoid analysis to classify institutions and faculties of economics. Scientometrics 2020, 123, 159–179. [Google Scholar] [CrossRef] [Green Version]
  11. Kazanidis, I.; Theodosiou, T.; Petasakis, I.; Valsamidis, S. Online courses assessment through measuring and archetyping of usage data. Interact. Learn. Environ. 2016, 24, 472–486. [Google Scholar] [CrossRef]
  12. Theodosiou, T.; Kazanidis, I.; Valsamidis, S.; Kontogiannis, S. Courseware usage archetyping. In Proceedings of the 17th Panhellenic Conference on Informatics, Thessaloniki, Greece, 19–21 September 2013; pp. 243–249. [Google Scholar]
  13. Cabero, I.; Epifanio, I. Finding archetypal patterns for binary questionnaires. SORT 2020, 44, 39–66. [Google Scholar]
  14. Fernández, D.; Epifanio, I.; McMillan, L.F. Archetypal analysis for ordinal data. Inf. Sci. 2021, 579, 281–292. [Google Scholar] [CrossRef]
  15. Cabero, I.; Castelló, A.; Ortega, B. Búsqueda de arquetipos en la relación didáctica del razonamiento proporcional con otros contenidos matemáticos. In Entornos Virtuales para la Educación en Tiempos de Pandemia: Perspectivas Metodológicas; Dykinson: Madrid, Spain, 2021; pp. 397–416. [Google Scholar]
  16. Epifanio, I. Cargas de trabajo no presencial ECTS arquetípicas del estudiantado: ¿cómo se reparten el trabajo semanalmente. In En Actas del Congreso Virtual: Avances en Tecnologías, Innovación y Desafíos de la Educación Superior ATIDES 2016; Jaume I Universitat: Castelló de la Plana, Spain, 2016; pp. 367–376. [Google Scholar]
  17. Epifanio, I. Análisis de arquetipos de las respuestas del estudiantado a las encuestas docentes. In En Actas del Congreso Virtual: Avances en Tecnologías, Innovación y Desafíos de la Educación Superior ATIDES 2018; Jaume I Universitat: Castelló de la Plana, Spain, 2018; pp. 139–149. [Google Scholar]
  18. Cadwell, J. Archetypal Analysis. R-Bloggers. 2012. Available online: https://www.r-bloggers.com/2012/07/archetypal-analysis/ (accessed on 16 January 2023).
  19. Davis, T.; Love, B.C. Memory for category information is idealized through contrast with competing options. Psychol. Sci. 2010, 21, 234–242. [Google Scholar] [CrossRef] [Green Version]
  20. Thurau, C.; Kersting, K.; Wahabzada, M.; Bauckhage, C. Descriptive matrix factorization for sustainability adopting the principle of opposites. Data Min. Knowl. Discov. 2012, 24, 325–354. [Google Scholar] [CrossRef]
  21. Li, S.; Wang, P.Z.; Louviere, J.J.; Carson, R. Archetypal analysis: A new way to segment markets based on extreme individuals. In Proceedings of the Australian and New Zealand Marketing Academy Conference, ANZMAC, Adelaide, Australia, 1–3 December 2003. [Google Scholar]
  22. Porzio, G.C.; Ragozini, G.; Vistocco, D. On the use of archetypes as benchmarks. Appl. Stoch. Model. Bus. Ind. 2008, 24, 419–437. [Google Scholar] [CrossRef]
  23. Jabbaz, M.; Samper-Gras, T.; Díaz, C. La brecha salarial de género en las instituciones científicas. Estudio de caso. Convergencia 2019, 26, 1–27. [Google Scholar] [CrossRef]
  24. Hanasono, L.K.; Broido, E.M.; Yacobucci, M.M.; Root, K.V.; Peña, S.; O’Neil, D.A. Secret service: Revealing gender biases in the visibility and value of faculty service. J. Divers. High. Educ. 2019, 12, 85. [Google Scholar] [CrossRef] [Green Version]
  25. Heijstra, T.M.; Steinthorsdóttir, F.S.; Einarsdóttir, T. Academic career making and the double-edged role of academic housework. Gend. Educ. 2017, 29, 764–780. [Google Scholar] [CrossRef]
  26. Heijstra, T.M.; Einarsdóttir, Þ.; Pétursdóttir, G.M.; Steinþórsdóttir, F.S. Testing the concept of academic housework in a European setting: Part of academic career-making or gendered barrier to the top? Eur. Educ. Res. J. 2017, 16, 200–214. [Google Scholar] [CrossRef]
  27. Bird, S.R. Unsettling universities’ incongruous, gendered bureaucratic structures: A case-study approach. Gender Work Organ. 2011, 18, 202–230. [Google Scholar] [CrossRef]
  28. Seth, S.; Eugster, M.J.A. Probabilistic archetypal analysis. Mach. Learn. 2016, 102, 85–113. [Google Scholar] [CrossRef] [Green Version]
  29. Comisión de Mujeres y Matemáticas de la Real Sociedad Matemática Española. Stop Discriminación. 2020. Available online: https://mym.rsme.es/images/docs/mym/stop.pdf (accessed on 16 January 2023).
  30. Antecol, H.; Bedard, K.; Stearns, J. Equal but inequitable: Who benefits from gender-neutral tenure clock stopping policies? Am. Econ. Rev. 2018, 108, 2420–2441. [Google Scholar] [CrossRef] [Green Version]
  31. Criado Perez, C. Invisible Women: Data Bias in a World Designed for Men; Abrams: London, UK, 2019. [Google Scholar]
  32. Gibney, E. Teaching load could put female scientists at career disadvantage. Nature 2017, 10. [Google Scholar] [CrossRef]
  33. García-Gallego, A.; Georgantzís, N.; Martín-Montaner, J.; Pérez-Amaral, T. (How) Do research and administrative duties affect university professors’ teaching? Appl. Econ. 2015, 47, 4868–4883. [Google Scholar] [CrossRef] [Green Version]
  34. López Belloso, M.; Silvestre Cabrera, M.; García Muñoz, I. Igualdad de Género en instituciones de educación superior e investigación. Investig. Fem. 2021, 12, 263–270. [Google Scholar] [CrossRef]
  35. Reverter-Bañon, S. La igualdad de género en la universidad. Capitalismo académico y rankings globales. Investig. Fem. 2021, 12, 271–281. [Google Scholar] [CrossRef]
  36. Sánchez Nimo, S.M. La evaluación de los planes de igualdad en la Universidad de las Illes Balears: Una propuesta para la inclusión de un sistema de indicadores sensibles al género. Investig. Fem. 2021, 12, 439–448. [Google Scholar] [CrossRef]
  37. Calvo-Iglesias, E.; Epifanio, I.; Estradé, S.; Mas de les Valls, E. Gender Perspective in STEM Disciplines in Spain Universities. In Women in STEM in Higher Education; Springer: Singapore, 2022. [Google Scholar] [CrossRef]
  38. Mas de les Valls, E.; Peña, M.; Olmedo-Torre, N.; Lusa, A. Learnings from gender in teaching courses: Main needs and resistances. In Proceedings of the ICERI2022 Proceedings, 15th Annual International Conference of Education, Research and Innovation, IATED, Seville, Spain, 7–9 November 2022; pp. 4595–4601. [Google Scholar] [CrossRef]
  39. García-Holgado, A.; González-González, C.S.; García-Peñalvo, F.J. Introduction of the gender perspective in the university teaching: A study about inclusive language in Spanish. In Proceedings of the 2021 IEEE Global Engineering Education Conference (EDUCON), Vienna, Austria, 21–23 April 2021; pp. 1669–1673. [Google Scholar] [CrossRef]
  40. Conesa Carpintero, E.; González Ramos, A.M. Accelerated researchers: Psychosocial risks in gendered institutions in academia. Front. Psychol. 2018, 9, 1077. [Google Scholar] [CrossRef] [PubMed]
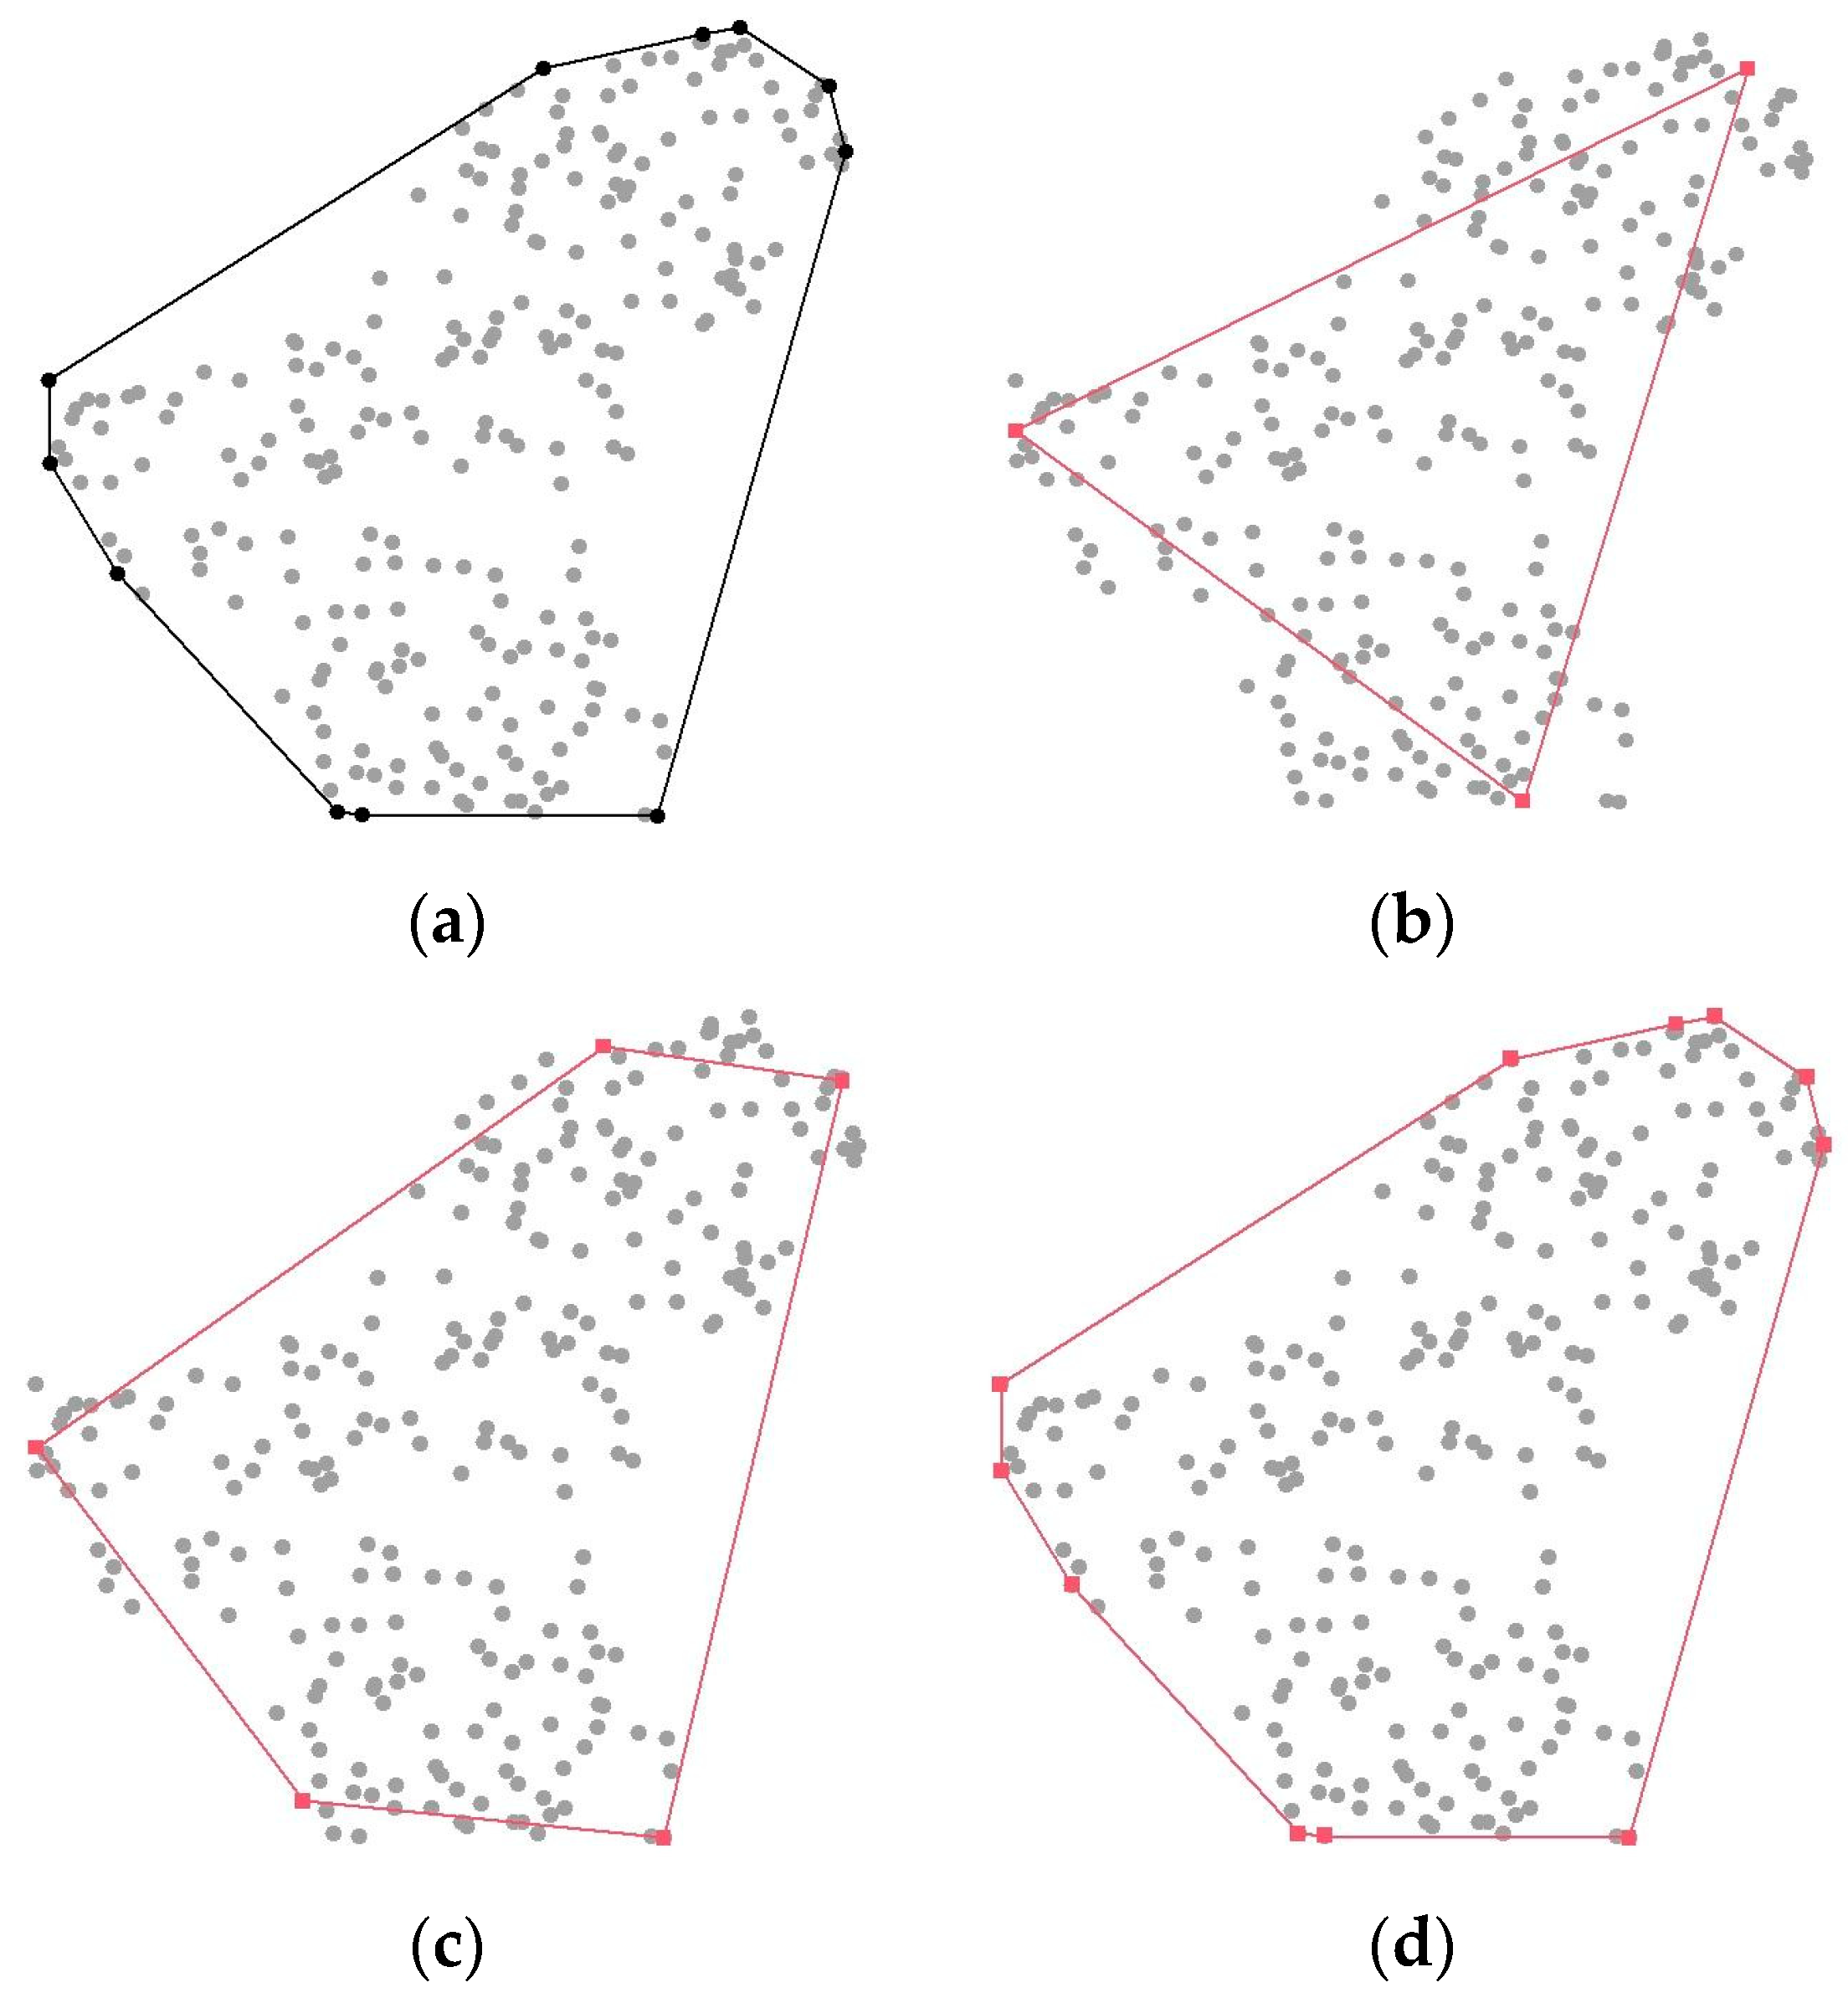
Figure 1. Evolution of the situation of archetypes according to p.
Education 13 00295 g001
Figure 2. Screeplot of the number of archetypes versus RSS(p).
Education 13 00295 g002
Figure 3. Datasets with the same archetypes but different weights. Archetypes are represented with red squares. Data are represented with (red and grey) squares.
Education 13 00295 g003
Figure 4. Orthogonal projection of the data on a plane (simplexplot function of the R software).
Education 13 00295 g004
Table 1. Number of hours per week devoted by each archetype to the different activities.
z j 1 = Teaching Hours z j 2 = Research Hours z j 3 = Management Hours z j 4 = Home and Personal Care Hours
z 1 12.26002.57
z 2 14.6114.6340.0214.86
z 3 14.984.11099.03
z 4 12.4359.650.45.69
z 5 70.9411.254.1221.86
Table 2. Groups according to the most similar archetype.
Group G1 (Minimal Effort) (Archetype 1)Group G2 (High Management) (Archetype 2)Group G3 (High Domestic) (Archetype 3)Group G4 (High Research) (Archetype 4)Group G5 (High Teaching) (Archetype 5)
353 (50%)39 (6%)93 (13%)85 (12%)133 (19%)
Table 3. Groups according to archetype distinguishing between men and women.
Group G1 (Minimal Effort)
(Archetype 1)
Group G2 (High Management)
(Archetype 2)
Group G3 (High Domestic)
(Archetype 3)
Group G4 (High Research)
(Archetype 4)
Group G5 (High Teaching)
(Archetype 5)
Men (347)208 (60%)15 (4%)36 (10%)41 (12%)47 (14%)
Women (356)145 (41%)24 (7%)57 (16%)44 (12%)86 (24%)
Table 4. More detailed groups according to archetype distinguishing between men and women.
Group G1 (Minimal Effort)
(Archetype 1)
Group G2 (High Management)
(Archetype 2)
Group G3 (High Domestic)
(Archetype 3)
Group G4 (High Research)
(Archetype 4)
Group G5 (High Teaching)
(Archetype 5)
197 (28%)9 (1%)38 (5%)37 (5%)69 (10%)
Group G1-2 (minimal effort-high management)
(archetypes 1-2)
Group G1-3 (minimal effort-high domestic)
(archetypes 1-3)
Group G1-4 (minimal effort-high research)
(archetypes 1-4)
Group G1-5 (minimal effort-high teaching)
(archetypes 1-5)
Group G2-3 (high management and domestic)
(archetypes 2-3)
25 (4%)33 (5%)73 (10%)99 (14%)15 (2%)
Group G2-4 (high management and research)
(archetypes 2-4)
Group G2-5 (high management and teaching)
(archetypes 25)
Group G3-4 (high domestic and research)
(archetypes 3-4)
Group G3-5 (high domestic and teaching)
(archetypes 3-5)
Group G4-5 (high research and teaching)
(archetypes 4-5)
4 (1%)11 (2%)27 (4%)30 (4%)33 (5%)
Table 5. Groups defined by one and two archetypes distinguishing between men and women.
Group G1 (Minimal Effort)Group G2 (High Management)Group G3 (High Domestic)Group G4 (High Research)Group G5 (High Teaching)
Men123691922
Women743291847
Group G1-2 (minimal effort–high management)Group G1-3 (minimal effort–high domestic)Group G1-4 (minimal effort–high research)Group G1-5 (minimal effort–high teaching)Group G2-3 (high management and domestic)
Men121242506
Women132131499
Group G2-4 (high management and research)Group G2-5 (high management and teaching)Group G3-4 (high domestic and research)Group G3-5 (high domestic and teaching)Group G4-5 (high research and teaching)
Men25141014
Women26132019
Disclaimer/Publisher’s Note: The statements, opinions and data contained in all publications are solely those of the individual author(s) and contributor(s) and not of MDPI and/or the editor(s). MDPI and/or the editor(s) disclaim responsibility for any injury to people or property resulting from any ideas, methods, instructions or products referred to in the content.