Abstract
This study’s primary purpose was to determine a method of quantitating the impact of physiological responses to stress on testing performance. We developed the stress performance evaluation (SPE) to calculate the overall stress levels that occur during testing by using the correct answers divided by the percent change in heart rate per day. Here, we first measured whether the SPE equation could predict testing environment and parameters in children with a learning disability (LD). The participants were seventh-grade students, with testing consisting of 100 basic math calculation questions in sixty seconds. Quantitative data was also collected through questionnaires, heart rates, and math fluency probes. The test performance was measured in small and large classroom settings and with paper and pencil (P&P) and online computer tests. Based on our SPE measurements, all LD students performed best in small-group computer testing for correctness and percent change in heart rate, which meant better overall performance. The use of SPE has promise for future testing parameters. The SPE evaluation method might be significant for determining the best testing situation for children with a disability and quantitatively measuring stress responses in advanced students, adults, and other testing scenarios.
1. Introduction
Testing scenarios are not mainstream in the area of special education, especially in the setting of children with learning disabilities (LD) and test anxiety. There are limited studies that have evaluated the effects of test anxiety on students with LD. One study by Lufi, Okasha, and Cohen revealed that test anxiety affects people in every aspect of their lives, especially since men and women of all ages have to be evaluated, assessed, and graded with regard to their abilities, achievements, or interests [1]. Their study concluded that test anxiety causes students with an LD to perform lower academically and have a higher level of psychopathology. Students with LD have more difficulties in test-taking situations than students who do not have LD [2]. Students with LD have symptoms of test anxiety, such as stress, nervousness, frustration, and helplessness that are equated with poor performance. Heiman and Precel concluded that college students with LD have lower grades, lower test scores, and a lower perception of their academic abilities [2]. Consequently, there appears to be a physiological component to testing situations that may impact all students, and this may be especially prevalent in children with LD.
Numerous stressors can lead to test anxiety, and these can affect how a student receives, stores, and understands information [3]. Hence, a mental “block” occurs during testing situations, and students are not able to do well on the test. Stress causes a physiological response in the body that affects the hypothalamic–pituitary–adrenal (HPA) axis [4], which may start in the brain but leads to overall body physiological responses ranging from rapid heart rate to long-term weight gain and diabetes [4,5,6]. There are factors that contribute to the cognitive ability of individuals, which include methods of information delivery, prior knowledge, the emotional state of mind (psychological), glycemic state (physiological), and the accuracy with which the information is retained [5,6,7]. Test anxiety may be an issue in poor test performance, and it is known to be an issue among students in grades four through twelve [6,8]. Approximately one-third of all students have test anxiety, regardless of their ability level [6,9]. A student’s emotional state is crucial when recalling information, which might affect the human brain and the physiological stressors that may hinder an individual’s cognitive abilities, leading to test anxiety [6,10]. It is essential to include those with neurodiversity backgrounds when considering testing constructs [11].
Here, we examined whether stress during testing situations impacted the students’ learning ability in three different testing scenarios. We set out to comprehensively map the heart rate responses to testing in children with LD. We found that test anxiety in children with LD decreased and math performance increased when they took an examination in a small group setting using a digital testing platform on a computer and that this was directly related to stress responses in the student. We have developed a new method of analyzing physiological responses, which we termed “stress-performance evaluation” (SPE). It takes into consideration the heart rate and physiological responses as well as the performance on the examination. Taken together, our findings indicate that the SPE could be an essential measure to evaluate testing parameters for kids and that these measures are especially sensitive to students with LD.
2. Materials and Methods
2.1. Materials
There were three primary materials that were used during the intervention phase.
- (1)
- Students took their timed basic math facts test on a computer or an iPad using ThatQuiz.org (https://www.thatquiz.org/tq/loginhelp.html?v=gq) accessed on 15 May 2023.
- (2)
- Math fluency skills that documented the number they got correct per minute using paper P&P. The math fluency test included basic mathematical problems using addition, subtraction, multiplication, and division.
- (3)
- Willful Fitness Tracker IP68 with Heart Rate Monitor wristbands were worn before and during testing. All baseline and intervention conditions were documented on a line chart.
2.2. Participants
The study design included three participants who (a) were between the ages of 12 and 14 years old; (b) received special education services in a mainstream math classroom; and (c) identified as having a learning disability in math reasoning or calculations. One student did not completely finish the study and therefore was removed from the calculations. Gender and age were not included in the demographic information. The study was intended to be completed at a private middle school in Northern Ohio with a population of 400 students in grades K–8 and 24 teachers. Four students were identified in a seventh-grade general education math classroom with 17 students. There were two male and two female students in seventh grade with LD.
2.3. Setting
The classroom structure is a typical rectangular shape and has individual student desks facing the whiteboard with a round table in the back corner, along with cabinets and a sink (prior to the school closings in March 2020 due to the COVID-19 shutdown). The mathematics class lasts 40 min. The students sit at individual desks facing the whiteboard. The teacher’s desk is on the far-left side, and a rectangular table is in the back of the classroom that is used for small group instruction. The class had 40 min of math in a computer setting once per week. During this time, they can practice lessons or do practice quizzes or tests over the previous lessons. The Star Math Test was given on a quarterly basis to check for individual progress in math achievement. The Star Math Assessment is a computer-based mathematics evaluation that can help provide teachers with information on student mathematics levels and strands that can help drive instruction and intervention strategies. The students were also given one-minute basic mathematics skills tests covering addition, subtraction, multiplication, and division on a daily basis using P&P. Due to the COVID-19 outbreak that closed schools in March 2020, the baseline and treatment phases of the study were completed via Zoom meeting in a small group. Zoom video chat is a cloud-based video communication service where video and audio are shared. It allows students to chat, share their screens, and do other online collaborations with others [12].
2.4. Experimental Design
A changing condition design was used to investigate the overall impact of improving math fluency test scores and reducing anxiety when taking tests and quizzes on the computer or iPad using criterion-based measures and in a small group setting. A changing condition design method was used to research the effects of two or more treatments on the behavior of each student [13]. The treatments that were used included math facts and heart rate. Although the changing condition design is similar to the alternating treatments design, the treatments in this design are introduced consecutively [13]. This kind of treatment is good to use when a researcher is trying to determine the most effective treatment to use for each individual student. With the design, we incorporated an ABCD layout. “A” is the baseline, followed by “B” being treatment 1, “C” being treatment 2, and “D” being treatment 3, measuring the most influential design of B or C. To check which intervention was the strongest, we implemented “D” for retesting the strongest treatment phase.
Stress performance evaluation (SPE) equation:
[%test questions correct (number of test questions correct out of hundred)]/[%change in heart rate (heart rate at baseline)/(heart rate after testing) × 100)]
2.5. Baseline Condition
During baseline, the subjects were in a Zoom classroom with their typical peers, completing a paper and pencil (P&P) math fluency test (due to COVID-19 restrictions). There were a total of 17 students in the classroom for large group analysis. After a minimum of six observations and when stability was present, the intervention was introduced to subjects 1, 2, and 3. Then, intervention one was introduced in a small group setting using Zoom. Regarding stability being present, the six observations had to show consistent blood pressure and scores in the large group setting using P&P. The three subjects were in a small group setting using a paper and pencil (P&P) test for math fluency. This intervention continued for eleven data points, and stability was present. After eleven consecutive data points, intervention two was introduced to subjects 1, 2, and 3. The subjects took a computer-based math fluency test called “That Quiz” program. This intervention was continued for ten data points, and stability was present. All subjects then went back to the treatment that was the strongest between the small group P&P math fluency test and the “That Quiz” program. The following data were collected during the baseline: (a) the Westside Anxiety Measure Scale questionnaire from the students and parents was evaluated; (b) the students were given the Woodcock–Johnson IV Test of Achievement (WJ IV ACH) pretest for mathematics calculation skills and other mathematics subtests; (c) the students then had their heart rate measured as a baseline of their average heart rate and pulse; and (d) pre- and post-Behavior Assessment System for Children (BASC-2) questionnaires. BASC-2 is a questionnaire that is filled out by teachers and parents to check if there are any behavioral or emotional statuses [14].
2.6. Dependent Measures
The dependent variables for this study included (a) math fluency scores by percentages from baseline to treatment; (b) heart rate as an indicator of stress; (c) pre and post-assessment with the Westside Anxiety Measure Scale; (d) Woodcock–Johnson Test IV of Achievement (WJ IV ACH) pre and post-test for mathematics calculation and fluency skills; (e) increase in math fluency using the “That Quiz” online program from pre to post one-minute assessment for basic addition, subtraction, multiplication, and division; and (f) pre and post BASC-2 questionnaires.
2.7. Interobserver Reliability Agreement
Interobserver Reliability (IOA) data were taken to ensure the reliability of the measurements of the dependent variables. IOA was taken for a minimum of one-third of the sessions [15] and across the different phases of the study. The data were collected by two observers. The two observers then compared the number of matching data to unmatched data and found the percentage of interval measurement. According to Gast (2010), this is found by taking the number of intervals for which the observers had matching data, dividing it by the total interval, and then multiplying by 100. The minimum acceptable IOA is 80%. The IOA did not fall below the recommended level, and there was no need for the observers to be retrained.
2.8. Treatment Fidelity
Treatment fidelity was measured by an independent observer using a checklist to verify that each step of the independent variable was completed in the same manner for each participant. Ayers and Gast [16] recommended that data be collected from a minimum of 20% of the observation sessions. Therefore, treatment fidelity was obtained at least once per week for each student throughout the intervention condition. A point-by-point reliability test was used to check reliability by dividing the total number of agreements by the total number of agreements and disagreements and then multiplying by 100 [15].
2.9. Independent Variable
The primary independent variable was for students with LD taking a math fluency test in a small group setting using Zoom. Each student took a math fluency test using P&P and then also took math fluency tests on the That Quiz program in a small group setting in the Zoom program using a computer or iPad. For both variables, they had one minute to complete as many basic mathematical calculations, including addition, subtraction, multiplication, and division facts, as they could.
2.10. Social Validity
A social validity questionnaire was given to the subjects and the subjects’ parents to determine the levels of test anxiety, whether they liked the intervention, and whether they felt the course of action was helpful once completed. A Likert scale of 1 to 5 was used to measure the social validity pre- and post-intervention, with one being not at all or never true and five being extremely or always true. Some of these questions include: (1) I find math to be difficult for me; (2) when I take a math quiz or test, it makes me feel anxious; (3) during important math exams, I think that I am doing awful or that I may fail; (4) daily math fluency would help me improve math calculations; and (5) being in a small group setting for a quiz or test will help eliminate my test anxiety.
2.11. Statistical Analysis
The SPE was evaluated for large group, small group P&P, and small group computer and the data was analyzed with Prism 9 (GraphPad Software, San Diego, CA) for graphical and statistical analysis. The data were measured via Student’s t-test or ANOVA. For the ANOVA, a one-way ANOVA with a post hoc test was used to compare mean values between multiple groups, and to identify interactions was followed by the Bonferroni post hoc analysis. Statistical data with a p < 0.05 was considered statistically significant.
3. Results
The focus of the study was to determine whether large or small group (pencil and paper or computer) settings are interventions that help students with LD reduce stress and test anxiety and improve math test and quiz scores. The study used a changing condition design to determine the best intervention that reduces test anxiety and improves math quizzes and test scores. The test contained 100 math questions that could be answered in 60 s. This testing parameter is considered impossible to answer all questions, but it provides a reasonable quantification of how each student responds to testing stress. The overall concept is that more correct answers in 60 s would be a better performance. The testing data consisted of the number of questions that a student answered correctly or incorrectly, and correctness was measured by test percentages. The study was completed remotely using Zoom video chat (to accommodate COVID-19 social distancing requirements), and Willful Fitness Tracker IP68 with Heart Rate Monitor wristbands were provided to quantify the heart rate responses before (baseline) and after testing.
The second part of this study quantified the stress response of each student with a learning disability. This was done using the Willful Fitness Tracker IP68 heart rate monitor. The participants wore the monitor during the study and were asked to report their heart rates before the one-minute test started for a baseline and also after the test. According to the American Heart Association, an average resting heart rate is 60 beats per minute. If a person is distressed, their heart rate increases above the normal average. When stressed, people may experience a racing heart, palpitations, pounding, or fluttering. Here, we used the heart rate as a measure of stress response.
Figure 1A shows Subject 1’s heart rate during the four testing parameters. All subjects started with the baseline, and the first parameter was in a large group setting with their typical peers doing mathematical calculations using P&P (Figure 1A(i)). During this phase, which was six consecutive days, heart rates were measured before and after the test to see if there were significant changes in the physiological response during this setting. Subject 1’s heart rate before (around 62 beats/min) and after (69 beats/min) testing. The results showed no significantly different changes, with a p = 0.2036 and an R2 = 0.1562. In the second phase, each subject went into a small group setting and used P&P. Figure 1A(ii)—collectively measured heart rate and mathematical performance measures for 12 consecutive days. During this phase, Subject 1 was in a small group setting with P&P. Their heart rate showed 52.5 beats/min, and after testing, it rose to 55 beats/min. The results showed that there were significant differences, with a p-value = 0.0010, and an R2 = 0.3958. In Figure 1A(iii), the heart rate of Subject 1 in the third parameter was quantitated in a small group setting using a computer. In this intervention phase, ten data points were collected, and the average before-testing heart rate was measured at 53.6 beats/min; after the test, the heart rate increased to a heart rate of 57.3 beats/min. The results show that there were statistically significant changes with a p-value from before to after with p < 0.001 (R2 = 0.8058). To ensure the accuracy of the parameters and which intervention was the strongest, the strongest intervention was retested. Figure 1A(iv) shows that the strongest intervention was using a computer in a small group setting. This phase consisted of six consecutive data points with an average baseline of 54 beats/min and a medium heart rate of 57.3 beats/min after testing. Like parameter 3, the retesting validated the findings that there were significant changes for Subject 1 with p = 0.0005 (R2 = 0.7143).
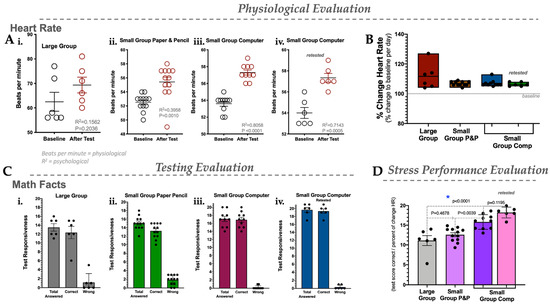
Figure 1.
Physiological, testing, and stress performance evaluation in Subject 1. (A) Heart rate in settings: large group (i), small group using paper and pencil (ii), small group using a computer (iii), and retesting of the small group using a computer (iv). (B) Percent change in heart rate for large group, small group P&P, small group using a computer, and retesting of the small group using a computer. (C) Testing evaluation for total answered, correctly answered, and answered incorrectly (wrong) in the large group setting (i), small group P&P (ii), small group using a computer (iii), and retesting of the small group using a computer (iv). (D) Stress performance evaluation (SPE) for large group, small group P&P, and small group computer. N = 6–10; statistics were measured via Student’s t-test or ANOVA, and *, p < 0.05 was considered statistically significant.
Figure 1B shows the percent change in the heart rate for Subject 1 during each phase. For Subject 1, the medium percent change in heart rate for the large group was 111.67%, the heart rate in the small group P&P was increased by 97.91%, the heart rate in the small group computer was raised by 107%, and the retested heart rate of the small group computer was elevated by 106.3%. Figure 1B shows the overall heart rate responses of Subject 1 during large group, small group P&P, and small group computer scenarios.
Figure 1C shows Subject 1’s testing evaluation in the large group setting using P&P, a small group setting using P&P, a small group using a computer, and retesting the strongest intervention, which was the small group setting using a computer. The bar graph includes the total number of questions answered, the number they got correct, and the number they got wrong. All participants were given 100 math questions with mixed operations (+, −, X, and /) to answer in one minute. For Subject 1, when in a large group setting using P&P, the average number of questions answered was 13.5 and the average correct answer was 12.3. In a small group setting using P&P, the average number of math questions answered was 15, the average correct was 14, and the average wrong was 2. In the small group setting and using a computer, Subject 1 finished, on average, 17 math questions and got an average of 16 correct math problems. In the third phase of the intervention, the strongest intervention was revisited (small group and use of a computer), and Subject 1 increased their total answers with a medium score of 19. Subject 1 also increased the correct answers to a medium score of 19. Then, they decreased their wrong answers to a medium score of 1.
Figure 1D shows the overall stress performance evaluation (SPE) for Subject 1. This is a unique way of looking at the overall physiological and testing evaluations by taking the test score correctly and dividing it by the percent change in each subject’s heart rate. The bar graph includes each phase of the study: large group P&P, small group P&P, and small group computer test. Subject 1 shows the p-value as insignificant from the large group P&P setting to the small group P&P setting, p = 0.4678. Subject 1 going from a small group to P&P to a small group computer setting was significant, with a p-value of 0.039. From the large group P&P to the small group computer, there is a significance of p < 0.0001. SPE showed that Subject 1 performed better in a small group setting and using a computer. Overall, Subject 1 performed better in a small group and using a computer. The SPE is very helpful in reducing test anxiety and improving testing performance.
Figure 2A shows Subject 2’s heart rate during the four testing parameters. All subjects started with the baseline, and the first parameter was in a large group setting with their typical peers doing mathematical calculations using P&P (Figure 2A(i)). During this phase, which was six consecutive days, heart rates were measured before and after the test to see if there were significant changes in the physiological response during this setting. Figure 2A(i) shows Subject 2 heart rates during baseline in a large group setting P&P, their p-value was 0.2387, and their R2 value was 0.1070. The medium heart rate before being around 59 and after being around 71 beats per minute. Figure 2A(ii) shows Subject 2’s before medium beats (around 61 beats per minute) and after (70 beats per minute). The p-value was significant at 0.0037, and the R2 value was 0.3506. Figure 2A(iii) shows subject 2 in intervention phase 2 using a computer in a small group setting. Before the test, the heart rate had an average baseline of around 65.3, and after the test, it had a medium of 57.4. The p-value from before to after was significant, with p = 0.0005 and R2 = 0.5029. Figure 2A(iv) shows the strongest intervention being retested: small group and use of a computer, with an average baseline of around 71.3, and after the test, the medium was 56.8. The p-value was significant (p = 0.0006), and the R2 was 0.7064.
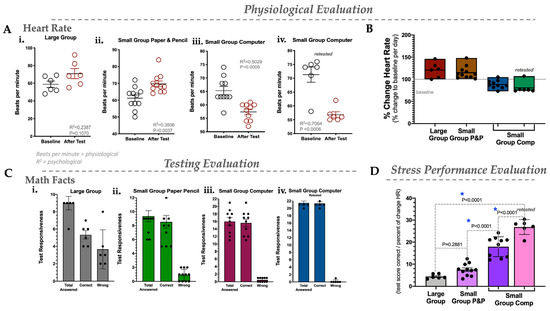
Figure 2.
Physiological, testing, and stress performance evaluation in Subject 2. (A) Heart rate in settings: large group (i), small group using paper and pencil (ii), small group using a computer (iii), and retesting of the small group using a computer (iv). (B) Percent change in heart rate for large group, small group P&P, small group using a computer, and retesting of the small group using a computer. (C) Testing evaluation for total answered, correctly answered, and answered incorrectly (wrong) in the large group setting (i), small group P&P (ii), small group using a computer (iii), and retesting of the small group using a computer (iv). (D) Stress performance evaluation (SPE) for large group, small group P&P, and small group computer. N = 6–10; statistics were measured via Student’s t-test or ANOVA, *, p < 0.05.
Figure 2B shows the percent change for Subject 2 from large group P&P, small group P&P, and small group computer settings. The percent change was calculated by taking the baseline before testing the heart rate, dividing it by the heart rate after testing, and multiplying the result by 100. The medium percent change in the large group was 120.8%; the medium in the small group P&P setting was 115%; and the medium in the small group computer setting was 88.4%. The medium in the small group using a computer retest was 80.67%.
Figure 2C shows Subject 2’s testing evaluations in the large group setting using P&P, small group setting using P&P, and small group setting using a computer. It includes the total number of math questions answered, the number they got correct, and the number they got wrong. The data show that in a large group setting and using P&P (Figure 2C(i)), the subject had an average score of 9 questions, a medium score of 5 correctly answered, and an average of 3.7 questions wrong. In a small group setting using P&P (Figure 2C(ii)), Subject 2, the medium completed math questions was 9.4, the medium correct was 8.5, and the average wrong was 1. In Figure 2C(iii), in a small group setting and using a computer, the median score of answered math questions was 16, and the average right was 15.6. In Figure 2C(iv), the strongest intervention was retested (small group and using a computer), Subject 2 increased their total answered math problems to a medium score of 21.5, increased the correct answers to a medium score of 21.3, and then decreased their wrong answers to a medium score of 0.17.
Figure 2D shows SPE for Subject 2. The bar graph includes each phase of the study: large group P&P, small group P&P, and small group computer test. In Figure 2D, Subject 2’s SPE shows that they are insignificant from large group P&P to small group P&P with a p-value of 0.2881. It does show a significant p-value going from P&P to a small group computer with p < 0.0001. Subject 2 shows a significant difference in p-value going from large group P&P to small group computer (p < 0.0001). Overall, SPE shows that Subject 2 performs significantly better in a small group setting and using a computer.
Figure 3A shows Subject 3’s heart rate during the four testing parameters. All subjects started with the baseline, and the first parameter was in a large group setting with their typical peers doing mathematical calculations using P&P (Figure 3A(i)). During this phase, which was six consecutive days, heart rates were measured before and after the test to see if there were significant changes in the physiological response during this setting. Figure 3A(i) shows Subject 3’s heart rates during baseline in a large group setting using P&P. Their p-value was 0.1105, and their R2 value was 0.11984. The medium heart rate before is around 60, and after, it is around 68 beats per minute. Figure 3A(ii) shows subject 3 before medium beats (around 65 beats per minute) and after (75 beats per minute). The p-value was 0.1527, and the R2 value was 0.09949. Figure 3A(iii) shows Subject 3 in intervention phase 2 using a computer in a small group setting. Before the test, the heart rate had an average baseline of around 58.2, and after the test, the median was 69. The p-value from before to after was significant (p = 0.004 and R2 = 0.5085). Figure 3A(iv) shows Subject 3 (retested) in intervention phase 3 in a small group setting using a computer with the test heart rate at an average of 62.8 beats per minute at baseline and a medium of 74.3 beats per minute after the test. The p-value from the pre- to post-test was significant (p = 0.0006 and R2 = 0.7073).
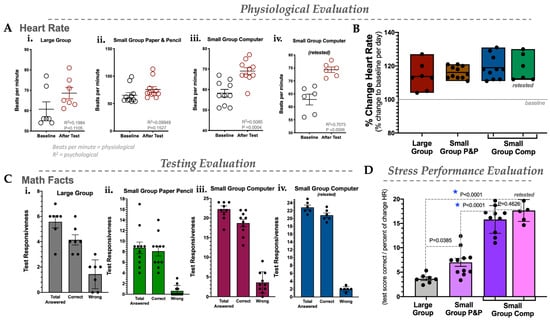
Figure 3.
Physiological, testing, and stress performance evaluation in Subject 3. (A) Heart rate in settings: large group (i), small group using paper and pencil (ii), small group using a computer (iii), and retesting of the small group using a computer (iv). (B) Percent change in heart rate for large group, small group P&P, small group using a computer, and retesting of the small group using a computer. (C) Testing evaluation for total answered, correctly answered, and answered incorrectly (wrong) in the large group setting (i), small group P&P (ii), small group using a computer (iii), and retesting of the small group using a computer (iv). (D) Stress performance evaluation (SPE) for large group, small group P&P, and small group computer. N = 6–10; statistics were measured via Student’s t-test or ANOVA, *, p < 0.05 was considered statistically significant.
Figure 3B shows the percent change for Subject 3 from large group P&P, small group P&P, and small group computer settings. The medium percent change in the large group was 113%; the medium in the small group P&P was 116.18%; the medium in the small group computer was 119%; and the medium in the small group using a computer that was retested was 119%.
Figure 3C(i) shows Subject 3’s testing evaluations in the large group setting using P&P, small group setting using P&P, and small group setting using a computer. It includes the total number of questions answered, the number they got correct, and the number they got wrong. The data for the large group setting using P&P shows that the student had an average score of 5.5 for problems they answered and approximately an average of 4.8 correctly answered. Figure 3C(ii) shows Subject 3 in a small group setting P&P. The average score answered was 9.6, and the average score correctly answered was 8.6. Figure 3C(iii) shows Subject 3 in a small group setting using a computer. The average answer was 22.5, and the average correct answer was 19.5. Subject 3 increased their total answers from an average score of 5.5 at baseline to an average score of 22.5. Subject 3 also increased the correct answers from a baseline of 4.8 to an average score of 19.5. Although Subject 3 answered more questions, their average score for wrong answers increased to an average score of 5. Figure 3C(iv) shows that subject 3, when retested in a small group setting and using a computer, answered an average of 19.12 problems, got an average of 20.83 correct, and an average of 2 wrong. Subject 3 shows the strongest intervention was the small group and computer use.
Figure 3D shows Subject 3 SPE going from a large group P&P, a small group P&P, and then to a small group computer setting. When Subject 3 went from large group P&P to small group P&P, there was a significant difference with a p = 0.0385. Subject 3 from small group P&P to small group computer shows a significance of p < 0.0001. Then Subject 3 from large group P&P to small group computer shows a significant p < 0.0001. Overall, SPE showed that Subject 3 performs better in a small group setting and using a computer.
4. Discussion
While we continue to grow and develop testing parameters for children with learning disabilities, recent findings show that anxiety and stress are big players in their poor performances and should also be considered. Here, we developed a new model that can measure test stress in children and compare it to correctness and responsiveness as an SPE. This is the first time these parameters and calculations have been used to assess child responsiveness and testing. These allow for physiological parameters to also be considered, as each testing scenario may be different per child, and our results here indicate that this may be true. While they do have differences overall, they also agree that a small-group computer-based learning strategy is the most favorable for a child with LD.
This study’s primary purpose was to determine how students with learning disabilities in mathematics react in different testing environments. Quantitative data was collected through questionnaires, heart rates, and math fluency probes. These data were used to test the hypothesis that children with LD in a large group setting compared to a small group setting may perform worse on standardized testing due to physiological stress responses and anxiety. The small group can be further improved by sectioning in P&P or computer-based testing, and the latter showed the most significant results in this study. We further analyzed the SPE, which looks at test correctness compared to the change in heart rates per day. These outcomes show that computer-based testing is the most favorable outcome for children with LD. They indicate that these testing parameters should be used more for these disabilities. However, our study was conducted with a small group, and more work is needed to reach these conclusions. Below, the findings and reasons that might support computer-based testing and how they may be more beneficial in school systems are discussed.
The examination parameter consisted of 100 questions over 60 s (one minute), and it would be considered impossible to answer all in the given time. The examination parameter lets us know how each student responded to stress, with some answering more correct questions in better settings where they may feel more comfortable. The overall concept is that more correct answers in 60 s would result in better performance and a less stressful scenario. The data were compared using a plethora of scatter plots, figures, and tables for each subject from baseline in a large group setting P&P, small group P&P, and small group computer testing. The overall data shows the most improvement and significant differences among all participants when they go from a large group P&P to a small group computer test. Therefore, the hypothesis was shown here to be possibly accurate, as Subjects 1, 2, and 3 benefited from taking tests in a small group setting using a computer. The reasons that the students performed better may be due to pre-programmed responses (psychological, hence conditioning) or physiological responses. However, all performed better in one environment, and it seemed to be related to their stress responses, as shown in their SPE.
The SPE is a unique measure that can help educators and others find the best intervention to quantify stressful scenarios better. The equation for SPE considers the total number of test questions that the subject correctly answered divided by the percent change in their heart rate for that day (see Methods in Section 2). This equation can be used for other parameters, such as adults, college level or higher, work settings, or younger children, such as preschool.
5. Conclusions
There has been much concern about how to get students to perform well on tests and how the environment affects children, especially those with LD. A major goal of Ohio is for students to pass the Ohio Assessment, but not much has been concluded about the best strategies. As researchers, this brings tears of frustration to the students and the teachers themselves. Finding interventions that can help eliminate test anxiety and increase performance can relieve the pressure the state tests put on the children, ultimately stressing them further. This study provides evidence that stress and test anxiety are related to overall performance, which is reflected in heart rate responses in testing scenarios. The SPE may be a useful tool for children with LD. It will, however, be more difficult to use in large groups, but for a focused group of children with disabilities, it might be useful. The best testing environment appeared to be a small group setting with a computer. The overall SPE for all subjects showed that the subjects’ performance was positive in a large group P&P setting compared to a small group setting using a computer. Overall, teachers, intervention specialists, and administrators must prepare each student the best they can for each situation they may encounter in middle school. The participants in this study were middle schoolers, and future research is needed to further subdivide the effects of test anxiety by race, gender, age, and learning ability. This study may help promote educational change and improve students’ testing performance by increasing test anxiety awareness.
Limitations: This study was conducted with a small sample size of students in middle school and on the topic of mathematics, mostly because of the focused approach to special education. Future studies are needed to determine whether larger sample sizes or adult learners also benefit from SPE. Future work could also delve into different areas, such as the work environment, and determine if this setting also benefits from SPE.
Author Contributions
J.A.H. conceived the project and designed the experiments; J.A.H. heart rates and quantified test scores, created the graphs, analyzed and interpreted the data, performed the correlation analysis, generated the figures, and wrote the manuscript; J.A.H. and B.H.J. reviewed and revised the final manuscript. All authors edited and approved the final version of the manuscript. All authors have read and agreed to the published version of the manuscript.
Funding
This research received no external funding.
Institutional Review Board Statement
The study was conducted in accordance with the Declaration of Helsinki and approved by the Institutional Review Board (or Ethics Committee) of the University of Toledo (protocol 300512-UT and approval 23 April 2020).
Informed Consent Statement
Informed consent was obtained from all subjects involved in the study.
Data Availability Statement
The data presented in this study are available on request from the corresponding author.
Acknowledgments
The authors are thankful and grateful to Edward Cancio, who served as a Ph.D. mentor for J.A.H.
Conflicts of Interest
The authors declare no conflict of interest.
References
- Lufi, D.; Okasha, S.; Cohen, A. Test Anxiety and Its Effect on the Personality of Students with Learning Disabilities. Learn. Disabil. Q 2004, 27, 176. [Google Scholar] [CrossRef]
- Heiman, T.; Precel, K. Students with learning disabilities in higher education: Academic strategies profile. J. Learn. Disabil. 2003, 36, 248–258. [Google Scholar] [CrossRef] [PubMed]
- Sherin, J.E.; Nemeroff, C.B. Post-traumatic stress disorder: The neurobiological impact of psychological trauma. Dialogues Clin. Neurosci. 2011, 13, 263–278. [Google Scholar] [CrossRef] [PubMed]
- John, K.; Marino, J.S.; Sanchez, E.R.; Hinds, T.D., Jr. The glucocorticoid receptor: Cause of or cure for obesity? Am. J. Physiol. Endocrinol. Metab. 2016, 310, E249–E257. [Google Scholar] [CrossRef] [PubMed]
- McEwen, B.S.; Sapolsky, R.M. Stress and Cognition Function. Neurobiology 1995, 5, 205–216. [Google Scholar]
- Hinds, J.A.; Sanchez, E.R. The Role of the Hypothalamus–Pituitary–Adrenal (HPA) Axis in Test-Induced Anxiety: Assessments, Physiological Responses, and Molecular Details. Stresses 2022, 2, 146–155. [Google Scholar] [CrossRef]
- Sawka-Miller, K.D. Test Anxiety. In Encyclopedia of Child Behavior and Development; Goldstein, S., Naglieri, J.A., Eds.; Springer US: Boston, MA, USA, 2011; pp. 1478–1479. [Google Scholar] [CrossRef]
- Whitaker Sena, J.D.; Lowe, P.A.; Lee, S.W. Significant Predictors of Test Anxiety Among Students with and without Learning Disabilities. J. Learn. Disabil. 2007, 40, 360–376. [Google Scholar] [CrossRef] [PubMed]
- Methia, R.A. Help Your Child Overcome Test Anxiety and Achieve Higher Test Scores; Virtual bookworm: College Station, TX, USA, 2004. [Google Scholar]
- Atasheneh, N.; Izadi, A. The Role of Teachers in Reducing/Increasing Listening Comprehension Test Anxiety: A Case of Iranian EFL Learners. Engl. Lang. Teach. 2012. v5 n3 p178-187 Mar 2012. [Google Scholar] [CrossRef]
- Zumbo, B.D.; Maddox, B.; Care, N.M. Process and product in computer-based assessments: Clearing the ground for a holistic validity framework. Eur. J. Psychol. Assess. 2023. [Google Scholar] [CrossRef]
- Inc, Z. Security guide. Zoom Video Communications Inc. Retrieved Oct. 2016, 9, 2020. [Google Scholar]
- Alberto, P.; Troutman, A.C. Applied Behavior Analysis for Teachers; Pearson: Boston, MA, USA, 2013. [Google Scholar]
- Reynolds, C.R.; Kamphaus, R.W. Behavior Assessment for Children: Third edition. (BASC-3). [Assessment Instrument]; Pearson: Bloomington, MN, USA, 2004. [Google Scholar]
- Gast, D.L. Single Subject Research Methodology in Behavioral Sciences; Routledge: New York, NY, USA, 2009. [Google Scholar]
- Ayers, K.G.; Gast, D.L. Dependent Measures and Measurement Procedures. In Single Subject Research Methodology in Behavioral Sciences; Routledge: New York, NY, USA, 2009; pp. 129–165. [Google Scholar]


Disclaimer/Publisher’s Note: The statements, opinions and data contained in all publications are solely those of the individual author(s) and contributor(s) and not of MDPI and/or the editor(s). MDPI and/or the editor(s) disclaim responsibility for any injury to people or property resulting from any ideas, methods, instructions or products referred to in the content. |
© 2023 by the authors. Licensee MDPI, Basel, Switzerland. This article is an open access article distributed under the terms and conditions of the Creative Commons Attribution (CC BY) license (https://creativecommons.org/licenses/by/4.0/).