Article

Teachers’ Evaluation of the Usability of a Self-Assessment Tool for Mobile Learning Integration in the Classroom

by
Judith Balanyà Rebollo
* and
Janaina Minelli De Oliveira
Department of Pedagogy, Rovira i Virgili University, 43002 Tarragona, Spain
*
Author to whom correspondence should be addressed.
Educ. Sci. 2024, 14(1), 1; https://doi.org/10.3390/educsci14010001
Submission received: 14 September 2023 / Revised: 1 December 2023 / Accepted: 14 December 2023 / Published: 19 December 2023

Abstract

:
This article explores teachers’ perceptions of a self-assessment tool designed to guide the integration of mobile devices into teaching and learning processes. Using the Educational Design Research (EDR) methodology with a quantitative analysis approach, the study sampled 228 teachers across 60 educational institutions at varying levels of education. Participants used the self-assessment tool to gauge their own competencies and identify areas for improvement. They then completed the “System Usability Scale” (SUS) questionnaire, a reliable metric with a 0.96 reliability score commonly used for evaluating educational tools. The results indicate moderate to high acceptance of the self-assessment tool, with an average SUS score of 70.65. The study also reports a Net Promoter Score (NPS) of 22.4, with approximately 43% of teachers as promoters of the tool. Interestingly, usability scores displayed variability among teachers in the early stages of primary education (6–8 years), ranging from 47.50 to 77.50. However, scores improved in more advanced stages, showing an increase of over 40%. The findings suggest that the tool is generally effective and useful for teachers, providing valuable insights for its wider application.

1. Introduction

In an increasingly interconnected and technology-dependent world, where a large proportion of the population has mobile devices that they use for their daily lives, education faces the challenge of adapting to new teaching modalities that incorporate digital tools. The Education 2030 Framework, Sustainable Development Goal 4, and the 2017 Qingdao Declaration emphasise the importance of Information and Communication Technologies (ICT) in education. Mobile technology, in particular, offers opportunities to improve educational processes, enabling more interactive, personalised, and accessible learning. The adoption of digital technologies in education does not solely represent the digital transformation; it entails a significant shift in both mentality and pedagogical practices. The strategic role of digital technologies, specifically mobile devices, is an element that is discussed in most of the reports of major international organisations such as UNESCO [1,2], which consider: (1) promoting equal access to technology; (2) developing inclusive policies and strategies; (3) training teachers in the use of mobile technologies; (4) promoting the pedagogical use of mobiles; (5) guaranteeing security and privacy; and (6) promoting collaboration and the exchange of best practices.
This task involves addressing key issues such as equity in access to technology [3,4], teaching training in the pedagogical use of devices [5,6,7], and protecting the privacy and security of students [8,9]. These aspects are essential to ensuring that technology integration into education is sustainable, scalable, and ethically responsible [10,11].
Integration of mobile devices in education has been a growing trend in recent years [12,13,14], but many teachers still face challenges in trying to effectively incorporate these digital technologies into their teaching practices [15,16]. Despite technological advances and the availability of a wide range of educational applications, the adoption of mobile devices in the classroom remains a complex issue involving multiple factors, such as teacher preparation [17,18], technological infrastructure, and educational policies [19,20,21,22].
To address these challenges and facilitate more effective integration, a self-assessment tool has been developed to help teachers design, implement, and evaluate the use of mobile devices in the classroom [23]. This tool seeks not only to improve efficiency in teaching with mobile devices through reflection and analysis but also to enrich the learning experience of students with meaningful and integrating activities of digital technologies through pedagogical strategies [23,24].
Therefore, the aim of this article is to examine the perception of teachers about the usability of this self-assessment tool and to answer the research question: how do teachers perceive the usefulness of the self-evaluation tool in the context of mobile learning? To this end, some 228 teachers completed the evaluation questionnaire to evaluate their experience with the tool. By better understanding teachers’ perceptions of the usability of this tool, areas for future improvements and adjustments can be identified, thus contributing to the body of knowledge in the field of mobile learning but also providing a comprehensive evaluation to enable future improvements to the tool. This comprehensive evaluation is crucial, as usability is a determining factor in the adoption and impact of any educational technology. Understanding how teachers perceive efficiency in performing tasks, effectiveness in results, and their overall satisfaction with the tool enables it not only to be adopted but also to have a significant impact on learning and teaching performance.

2. Evaluating and Ensuring Usability in Educational Technology

Usability is a key factor for the success of any educational technology, including teacher self-assessment tools [25,26,27]. The ease of use and effectiveness of a self-assessment tool can influence its adoption and its impact on teachers’ learning and performance. It is therefore important to evaluate the usability of these tools to ensure their success. According to [27], usability can be measured by three key aspects: efficiency, effectiveness, and satisfaction. Efficiency refers to the speed with which a user can perform specific tasks with a tool. Effectiveness refers to the accuracy and quality of the results obtained with a tool, and satisfaction refers to the user’s perception of the tool and its ability to meet their needs [27,28,29].
To evaluate the usability of a teacher self-assessment tool, different methods can be used, such as surveys, interviews, and direct observation [30,31]. Furthermore, usability can also be assessed by applying usability standards such as ISO 9241 and the usability assessment methodology [26]. These standards and methodologies provide a framework for evaluating the usability of a tool and comparing it with other similar tools.
Some of the main actions to incorporate usability tests into the development of educational tools are:
  • Involving users: involve users, such as students and educators, in the design and testing process to ensure that the tool meets their needs and is easy to use [26,27].
  • Set goals: defining clear goals and targets for the tool and ensuring that they align with learning goals and curriculum [30,31].
  • Test early and often: test the tool early and frequently to identify usability problems and make improvements throughout the development process [26,27,28,29,30].
  • Use standardized measurements: use standardized measures, such as the System Usability Scale (SUS), to evaluate the usability of the tool and compare it with other tools [26,32].
  • Consider accessibility: ensure that the tool is accessible to all students, including those with disabilities or those without access to technology [27,30,31].
  • Iterate and refine (EDR phases): continuously iterate and refine the tool based on user reviews and test results [27,28,29].
  • Provide training and support: provide training and support to educators and students to ensure that they can use the tool effectively [29].
  • Consider the context: consider where the tool will be used, such as the learning environment and available technology, and design the tool accordingly [30,31].
In general, incorporating usability evidence into the development of educational tools involves involving teachers, setting goals, using standardized measures, considering accessibility, iterating and refining (EDR phases), providing training and support, and considering context [33,34]. By following these practical actions, researchers or teachers can ensure that the educational tool is effective, efficient, and easy to use, leading to improved student learning outcomes.
The proposed System Usability Scale (SUS) is a widely used tool for evaluating the usability of educational tools. It consists of a 10-item questionnaire that measures the perceived usability of a system or tool on a scale of 0 to 100. SUS is a reliable and valid measure of usability that has been used in a variety of educational settings [27]. For example, in a study by [35], SUS was used to evaluate the perceived usability of the learning management system during the COVID-19 pandemic, integrating the scale with other models to identify areas for improvement. Similarly, [36] used the SUS to evaluate the user experience on a digital learning platform called Pijar Mahir, providing valuable data on the platform’s effectiveness in terms of design and functionality. These studies demonstrate how SUS can be a valuable tool not only for evaluating usability but also for guiding the process of developing and continuously improving educational tools [34,36].
The application of the System Usability Scale (SUS) in the educational field highlights the importance of user-centered research into educational tools in real-world learning contexts [37,38]. In addition, it also has direct implications for the quality and effectiveness of the evaluated tool, as it guides the design and implementation of technological solutions that really solve the needs of teachers and students.

3. Mobile Learning: Learning and Methodology

Mobile learning (m-learning) is a teaching and learning methodology that uses mobile devices with wireless connectivity, allowing students to access information and learn anytime and anywhere [39,40,41]. Using mobile devices in education offers several advantages, including convenience, flexibility, participation, interactivity, and ease of use, making it more attractive to students [42]. However, there are also some challenges and limitations to the use of mobile devices in education, such as barriers to technology acceptance and problems related to student participation.
Several studies have been conducted to explore the effectiveness of using mobile learning techniques to improve learning outcomes in higher education [43]. Studies have shown that mobile learning can be an effective way to improve students’ skills such as positive thinking, collaboration, and communication. Mobile learning can also provide new learning environments and improve the quality of teaching and learning [44]. Despite the benefits of mobile learning, there are still challenges to be addressed for successful implementation, such as technology adoption, transition to new technologies, and problems related to student participation [42]. Educators and students must select the right technology according to the lesson taught [43,45].
Mobile learning has become even more important during the COVID-19 pandemic, as many educational institutions have closed to reduce the spread of the virus. Mobile learning has been used as a remote learning strategy to maintain student-centered learning [34]. Mobile learning has the potential to improve teaching and learning outcomes in education. However, there are challenges that must be addressed for successful implementation. Educators and students must select the right technology according to the lesson taught. Mobile learning has become even more important during the COVID-19 pandemic, as it has been used as a remote learning strategy to keep learning centered on the student as it provides the opportunity to learn anytime and anywhere. The use of mobile devices in education has become increasingly common, but there are both advantages and disadvantages to this digital technology [39,40,41,42,46,47].
Advantages:
  • Flexibility: mobile learning allows students to learn at their own pace and according to their own schedule, which can be useful for students who need more time or who have other commitments outside of school.
  • Accessibility: with mobile learning, students can access educational materials from anywhere, which can be useful for students who live in remote areas or who have limited access to traditional educational resources.
  • Motivation: mobile devices can be used to create interactive and attractive learning experiences, which can help keep students interested and motivated.
  • Meaningful learning: mobile devices can be used to provide authentic, contextualized learning experiences, which can help students apply what they have learned in real-world contexts.
Challenges:
  • Technical problems: mobile devices can be prone to technical problems, such as connectivity problems or software failures, which can interrupt the learning process.
  • Distraction: mobile devices can be a source of distraction for students, especially if not used properly.
  • Cognitive load: mobile learning can be cognitively demanding if students are required to perform multiple tasks or switch between different applications or activities.
  • Teacher confidence: teachers may lack confidence in their ability to use mobile devices effectively in the classroom, which may limit the potential benefits of this technology.
In short, mobile learning represents and offers a methodology that leverages digital technologies in various formats to facilitate access and participation in the learning process. Through flexibility, accessibility, and authentic learning opportunities, m-learning can be a valuable methodology. However, as with any emerging technology, it comes with its own set of challenges and limitations that need to be carefully considered and addressed.

4. Self-Evaluation Tool for Design Activities with Mobile Devices

The self-assessment tool for teachers provided direct information on their perceptions and experiences, making it a valuable tool for educational research. Self-evaluation tools can help teachers assess their own effectiveness and identify areas for improvement [47]. This can lead to more effective and efficient teaching practices [48,49,50,51].
The self-evaluation tool was composed of seven elements grouped into a community taxonomy that seeks to answer what pedagogical factors should be considered for the design, implementation, and evaluation of activities with mobile devices. This seven-element self-evaluation tool was articulated through 67 items that sought to facilitate the evaluation and improve teaching practice in terms of mobile learning, offering personalised feedback according to the score obtained in the tool so that teachers could know their level as regards the design of activities using mobile devices and the key aspects to improve [38,39,40,41,42,43,44,45,46,47,48,49,50,51,52].
The following are the details of these seven elements of the self-assessment tool:
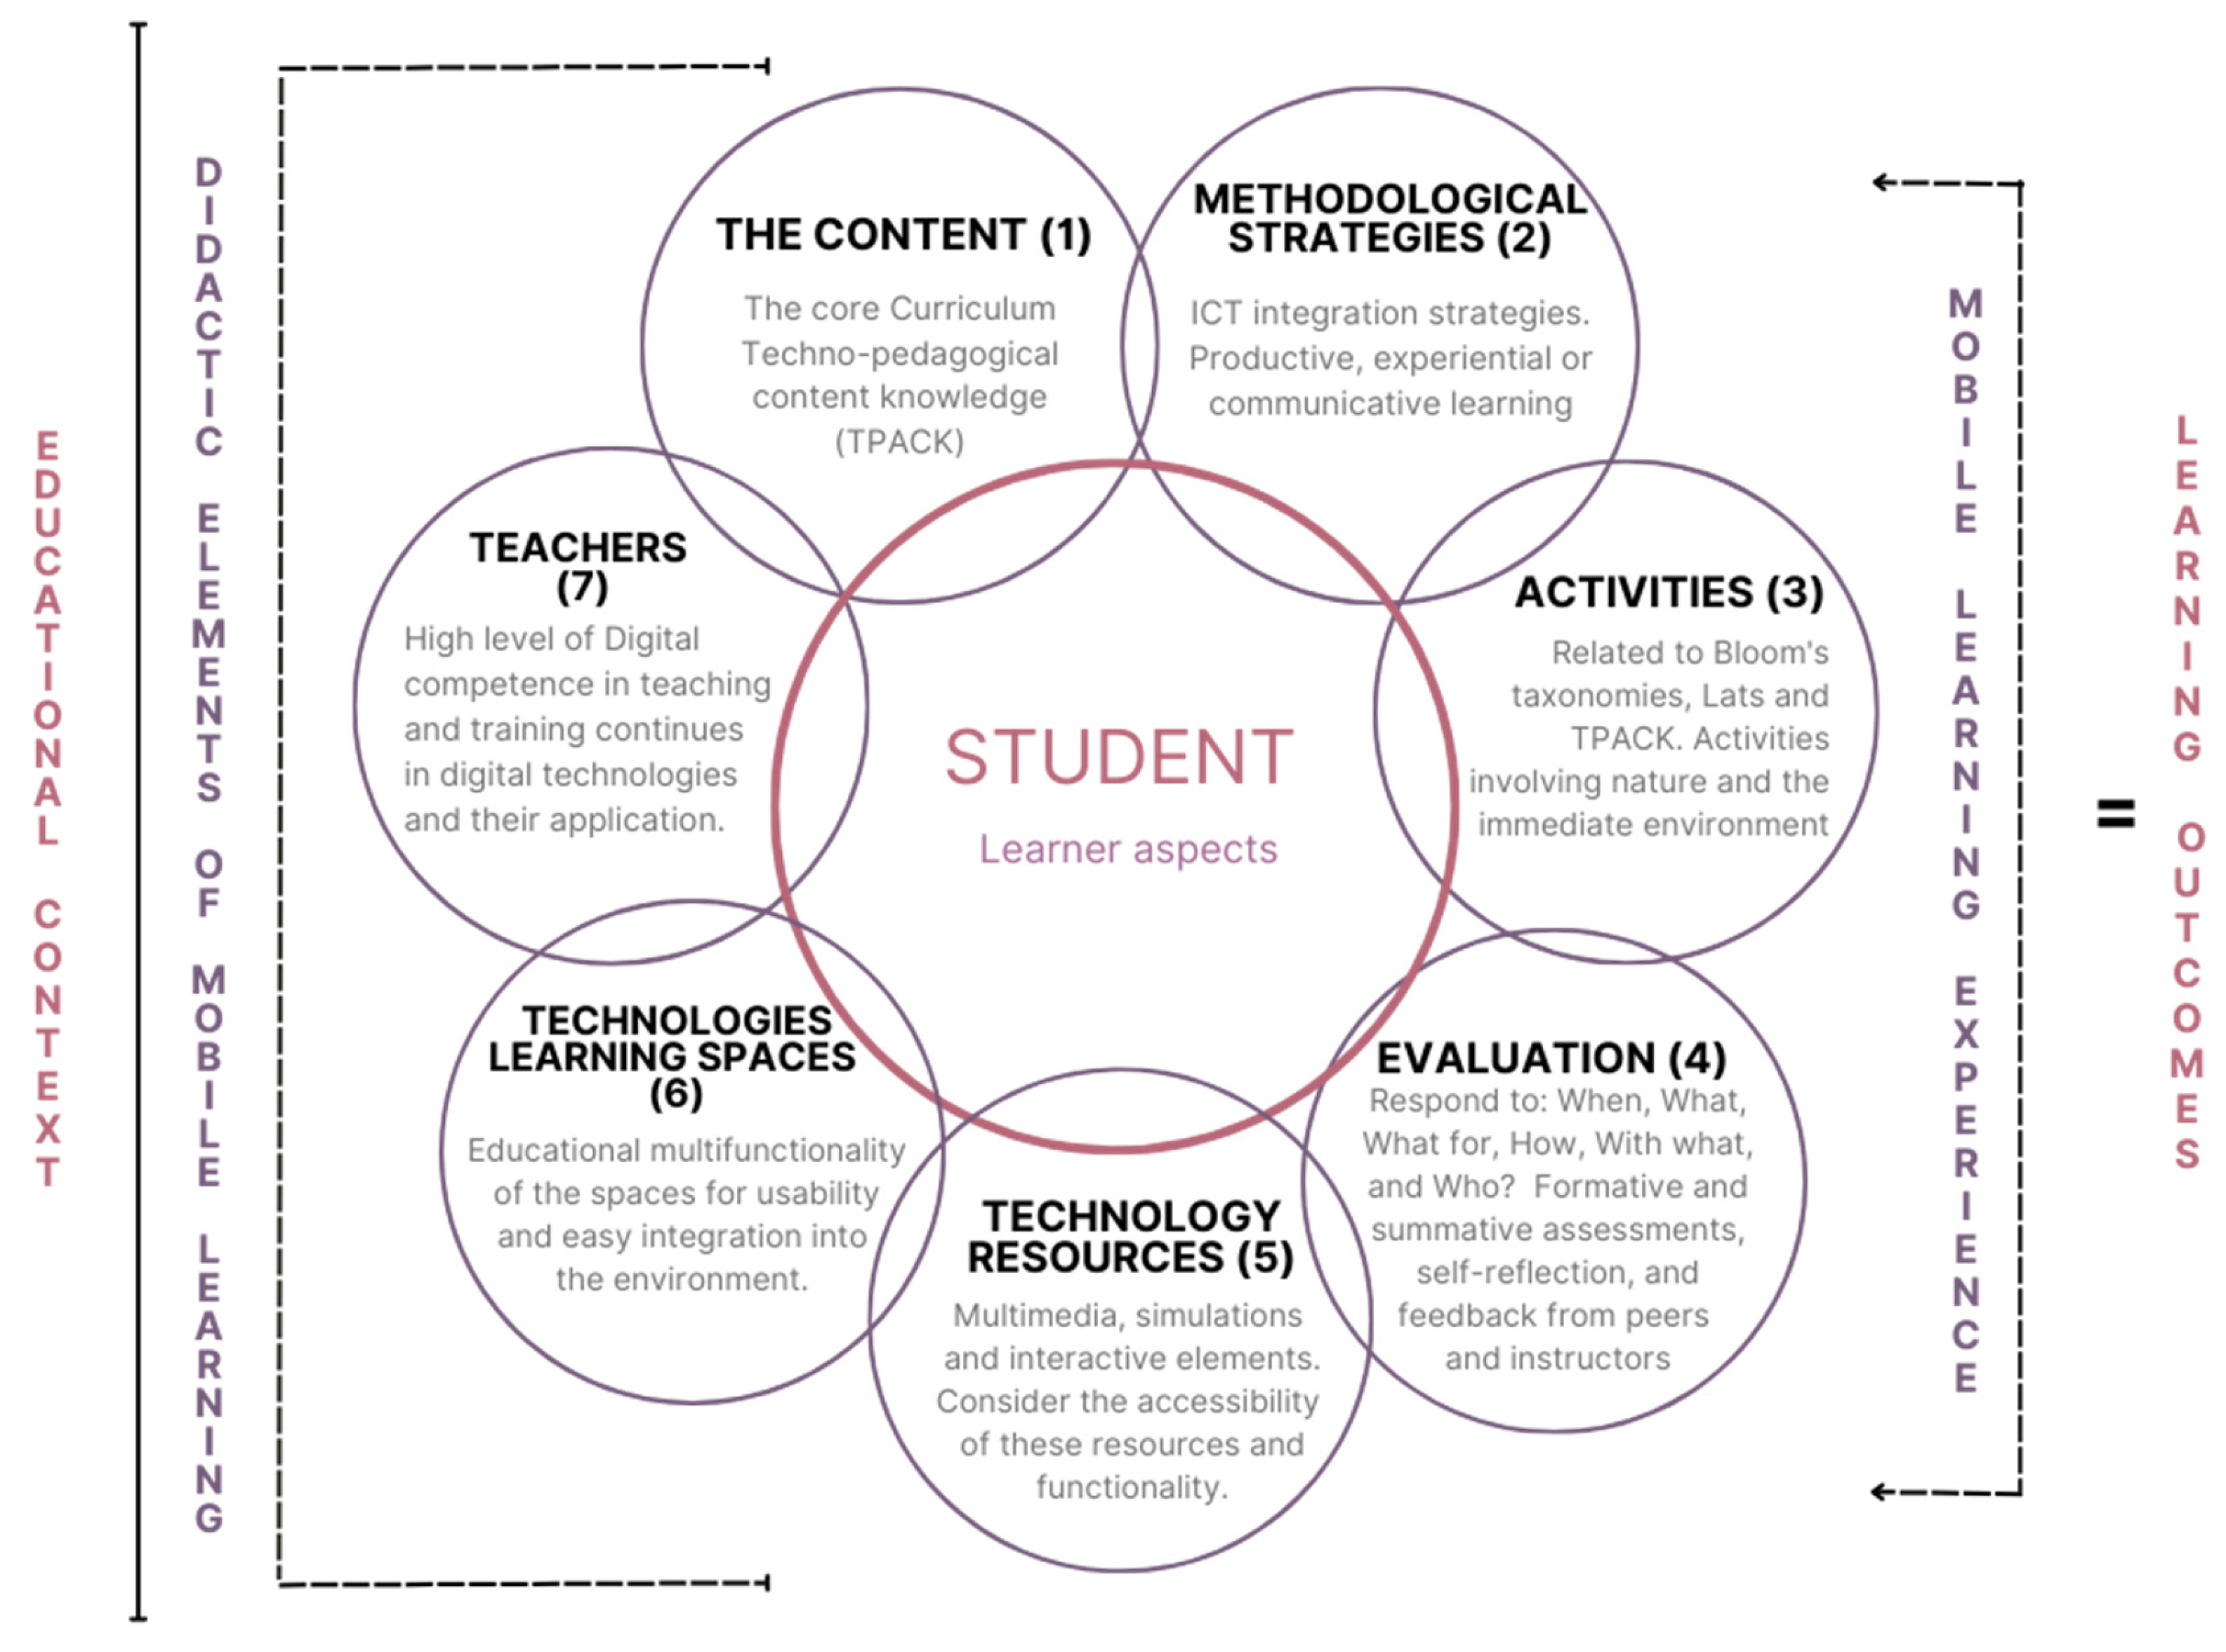
  • The content: Refers to what students will learn and how the teacher can transform the content into techno-pedagogical knowledge. Related questions include knowledge of the educational framework, availability of educational resources of scientific value, and mastery of the content by the teacher.
  • Methodological strategies: Focuses on strategies that promote meaningful learning and the incorporation of mobile devices. This includes the selection of strategies that encourage the acquisition and production of knowledge with mobile devices and the proposal of productive and experiential activities.
  • Activities: Deals with the selection and design of appropriate activities to work with the content in a meaningful way. This includes consideration of realistic applicability, rationality in the type of activities, student diversity, and design based on taxonomies of cognitive, procedural, and attitude domains.
  • Evaluation: Reviews the type of evaluation that respects the student’s learning process based on the use of mobile devices. This includes questions such as when, what, why, how, with what, and who to evaluate, and evaluation of both the creation process and the final product.
  • Mobile resources: Focuses on the selection of optimal technology and resources for pedagogical usability. This includes consideration of technological functionality, motivation, and accessibility.
  • Technological learning spaces: Refers to the characteristics of spaces that enhance learning with mobile devices. This includes the analysis, design, and preparation of the spaces, the organizational function of the technological space, and the proposal of activities that can be carried out in different places.
  • The teacher: Focuses on the teacher’s level of digital competence and the role he or she must play to enhance learning with mobile devices.
Figure 1 below shows the community taxonomy and the relationship between these seven elements, considering that the student is always at the center of any educational proposal. Taking all of these into account will ensure that your mobile learning activities are more effective and meaningful.

5. Methodology

This study is part of Educational Design Research (EDR), an educational adaptation of the well-known Design-Based Research (DBR) methodology with a quantitative analysis approach. The EDR [39] methodology is based on the same fundamental principles as the DBR methodology: iterative design, collaboration with experts, and empirical data analysis [53,54]. Iterative design involves prototyping and testing in repeated cycles to gradually improve the proposed solution. Collaboration with experts, including teachers, is necessary to ensure the validity and relevance of the solution. Empirical data analysis is used to evaluate the effectiveness of the solution and provide feedback for continuous improvement. In Figure 2 below, you can see the stages that have been applied following the methodological model for the research. For this article, the data from Iteration 3 of Phase 2, “Pedagogical Usability”, from the “Usability Questionnaire SUS” are treated and analysed as phase closure.
This investigation consists of several phases and iterations (Figure 2): Phase 1: Using the literature review and systematic review (relevance criteria) of key elements of pedagogical interventions based on the use of mobile devices, find the educational problem that needs to be solved. A preliminary design (self-assessment questionnaire) was also carried out that included the specification of learning objectives and the selection of pedagogical elements that support teaching and learning on mobile devices. Phase 2: In Iteration 1, teachers and experts validated the prototype self-assessment questionnaire (consistency criteria). The respondent’s self-assessment tool dealt with the 7 key elements (shown in Figure 1): (1) content, (2) methodological strategies, (3) activities, (4) evaluation, (5) technological resources, (6) technological learning spaces, and (7) teachers. In the second iteration, the validation suggestions were used to improve the formative self-evaluation tool for teachers who will design, implement, and evaluate activities with mobile devices. Teachers in this iteration, after completing the self-assessment, received a score based on their knowledge of how mobile devices can help them plan, conduct, and evaluate teaching and learning processes, as well as feedback based on their scores. This feedback, tailored to their score and level, provided them with specific educational resources to improve their pedagogical skills: (a) Beginner = 0 < 20% “Level 1”, (b) Average = 20 < 40% “Level 2”, (c) Advanced = 40 < 70% “Level 3”, and (d) Expert = 70 < 100% “Level 4”. In the last iteration, Iteration 3, the present phase in which the results are presented, teachers evaluated the usability of the self-assessment tool through the “System Usability Scale” (SUS) questionnaire (el criterio de usabilidad). The data from this last iteration are therefore presented as the conclusion of Phase 2 of the investigation.

5.1. Participants

The study participants are teachers who participated in the pedagogical innovation project called “Pla Mòbils.edu” (Edu/1464/2019, 27 May), promoted by the Education Department of the Government of Catalonia (Spain). The group was composed of 60 educational institutions, among them 327 teachers from Catalonia in different educational stages. Out of these, 228 teachers voluntarily continued in Iteration 3 of Phase 2 of the research, distributed across different educational stages as shown in Figure 3.
The sample of teachers participating in the research encompasses various educational stages and a wide range of ages. The distribution of teachers by educational stage reveals a predisposition to participation in the use of mobile devices in compulsory secondary education, primary education opportunities, challenges in early childhood education, and a diversity of perspectives that can enrich the implementation and impact of research. The stage with the highest representation is compulsory secondary education (12–16 years), with 162 participants, whose ages range from 25 to 60, and the highest attendance at the age of 43. Following it are the Lower Cycle of Childhood Education (3-6 years old) with 2 participants, the Middle Cycle of Primary Education (6–12 years old) with 21 participants, the Primary Cycle (6–12 years old) with 6 participants, and, finally, the Higher Cycle of Primary Education (6–12 years old) with 37 participants. The age distribution of the 228 teachers who participated in this phase of the study and their percentages, spread from 26 to 58 years of age, are shown in Figure 4 below.
The participating sample in the research is a diverse and representative group of teachers from a wide range of ages. A significant concentration of participants in the age range of 36 to 43 years is highlighted, representing 70.20% and 87.70%, respectively, suggesting an active and relevant involvement of teachers in the middle stage of their careers. Furthermore, other ages were observed with rates of 35.10% or 52.60%, reflecting a more equitable distribution in the age groups from 28 to 58.

5.2. Instruments and Process of Collecting the Information

The process of implementing and collecting the data for the evaluation of the pedagogical usability of the self-evaluation tool entailed that previously (condition without equanimity), the teachers of the project “pla Mòbils.edu” would perform the self-evaluation questionnaire (Cronbach’s alpha = 1.0046) on their self-knowledge about the use of mobile devices in the classroom to be able to access this other tool of validation of usability. These questionnaires were designed and programmed with a series of restrictions that gave access to teachers according to their interactions in the virtual classroom “Moodle” of the Department of Education of the Government of Catalonia (Spain) to ensure the iterative phases of research, security, and data management. The design of the process can be seen in Scheme 1 below.
The questionnaire consists of two blocks: the first block is a set of 8 items (see below Table 1 that refer to the usability of educational content evaluated through the Likert scale [53], and the second block refers to the validation of the perception of usability from 10 items extracted from the System Usability Scale (SUS) positive version, with a reliability of 0.96 [55], which are also evaluated with a Likert five-point scale, ranging between 1 and 5. None of the questions express positive attitudes, while couples are negative.
In addition, the presented items (SUS) were based on the definition of usability shown in ISO 9441-11 [54], defined as the degree to which a product can be used by specific users to achieve a specific goal with effectiveness, efficiency, and satisfaction in a specific context of use. Therefore, the SUS scale has two functions: the first is to obtain a measurement of the perception of the usability of a system, and the second is that it does not require much time for its implementation [54]. Thus, this instrument provides an assessment of the perception of the usability of a system in a short time. The authors [55] pointed out that the positive version of the SUS can be used with confidence since, on the positive scale, the user is less likely to make errors when answering and facilitates encoding, but most importantly, the scores of the negative version are similar to the norms of the original version.
For the generation of each of the 10 statements, the SUS program was used, which incorporated the keyword “self-evaluation tool” and is generated automatically to preserve style and validity. The following are the items generated for the second block that were evaluated by the teachers:
  • I think I would use this self-assessment tool frequently.
  • I find this self-assessment tool unnecessarily complex.
  • I think the self-assessment tool was easy to use.
  • I think I would need the help of a person with technical knowledge to use this self-assessment tool.
  • The functions of this self-evaluation tool are well integrated.
  • I think the self-evaluation tool is very inconsistent.
  • I imagine that most people would learn to use this self-assessment tool very quickly.
  • I find the self-assessment tool very difficult to use.
  • It gives me confidence when I use this self-assessment tool.
  • I needed to learn a lot before I could use this self-assessment tool.

6. Results

In this section, the results of the usability assessment of the self-assessment tool are shown from two different angles: first, the results from Block 1, which look at how well the content can be used in a classroom setting, and second, the results from Block 2, which use the System Usability Scale (SUS) to look at how well the tool’s functions work together. These two dimensions provide a holistic view of the strengths and areas for improvement in the experience of teachers using the self-assessment tool.

6.1. Block 1: Usability of the Pedagogic Content

As shown in Table 1, the facility rates range from 75.25% to 81.69%, indicating that, in general, teachers find the self-assessment tool easy to use. For example, item 8, “I think it would be beneficial to have the self-assessment tool so that I can use it whenever necessary”, has an ease rate of 81.69%, which shows that most teachers consider the tool to be accessible and easy to use. The self-assessment tool may have been perceived by teachers as a useful tool for evaluating their own knowledge and skills in the use of mobile devices in education. By having access to the self-assessment tool at any time, teachers could use it to identify their strengths and weaknesses and ultimately improve their teaching practice. It may also have been seen as a way of accessing additional learning resources, as teachers may have discovered new ways of teaching and learning on mobile devices from the specific feedback received, which may have generated greater curiosity and a desire to learn more about the subject.
Furthermore, discrimination rates range from 40.54% to 62.36%, suggesting that some items have a greater capacity to discriminate between teachers who use the tool more effectively and those who use it less effectively. For example, item 5, “I think using the self-evaluation tool has helped me improve my activities with mobile devices”, shows a discrimination rate of 62.36%, indicating that this item is effective in differentiating teachers who have experienced significant improvements in their mobile activities from those who have not. In addition, discriminatory efficiency rates are between 45.85% and 76.39%, implying that some items are more efficient in identifying teachers who obtain better results with the tool. For example, item 6, “The feedback provided by the self-assessment tool has helped me detect training needs”, has a discriminatory efficiency of 76.39%, which means that this item is especially effective in identifying teachers who have used feedback to improve their professional development.
In general, teachers perceive the tool as useful and facilitate their activities with mobile devices, and most report that it has contributed to their professional development. However, there is some variability in responses, suggesting that some aspects of the tool could be improved to optimize its usefulness and effectiveness for different teachers. For example, items 3 and 6 have relatively high standard deviations, indicating that there are more diverse opinions on these claims, suggesting that these items could be revised to clarify their wording or to make them more specific for more consistent answers. It should be noted that item 3, “As a teacher registered in the project “Pla Mòbils.edu” I have increased the number of activities that I propose in the classroom with mobile devices”, received a more diverse response compared to the other elements, as 19.06% of teachers showed a certain level of variability in their responses. What it suggests is that some teachers may not have experienced a significant increase in the integration of mobile devices into their classroom activities, and one possible reason is that they may feel insecure or not fully familiar with using mobile devices in the classroom. In addition, it may reflect the availability of mobile devices in their work environment or that they do not have access to the technology necessary to design and carry out activities with mobile devices.
Figure 5 shows the distribution of the teachers’ responses to the 8 items on a 5-point Likert scale, where 1 represents a “Strongly disagree” response and 5 represents “Totally in agreement”.
Most of the teachers agreed or were totally in agreement with the items evaluated. In particular, items 1 and 2, which relate to the description and representation of the characteristics in the self-assessment tool, respectively, received high positive ratings (around 80% of responses were “in agreement” or “totally in agreement”).
Item 3, referring to the increase in the proposed activities in the classroom with mobile devices, received a more diverse response, with a considerable proportion of neutral replies (26.32%) and replies of “totally in agreement” (24.56%) and “disagree” (8.77%). Items 4, 5, and 6 refer to the usefulness of the self-assessment tool for improving educational activities with mobile devices. The results indicate that the self-assessment tool is useful for improving the quality of mobile activities, with responses ranging from 73.68% to 59.65% in the “in agreement” or “totally in agreement” category.
Finally, item 7 on the convenience of having the self-assessment tool available at any time: the results show that the majority of teachers agree or strongly agree that it would be beneficial to have access to the self-assessment tool at any time (85.96% in the “in agreement” or “totally in agreement” category).

6.2. Block 2: System Usability Scale (SUS)

In this block, the results obtained from the application of the System Usability Scale (SUS) test in Block 2 of the questionnaire consisting of 10 items are presented and analysed. The data collected through this test provide essential information about the perception of teachers regarding the usability of the self-assessment tool, allowing them to identify patterns, trends, and areas for improvement. For the measurement of SUS scores, the scores of individual items are first normalized to be converted to a range from 0 to 4, then each teacher is added to the standard scores for the impartial items (1, 3, 5, 7, and 9), and the normalized scores from the peer items are subtracted. (2, 4, 6, 8, and 10). Then this sum is multiplied by 2.5 to obtain the individual SUS score of the user. Finally, the total scores of the group are averaged with the individual scores to calculate a group median score. This score, expressed on a scale of 0 to 100, represents the perceived usability of the tool by teachers but also allows us to quantify and rate user perception of usability through adjectives, acceptability scores, and school scales, as shown in Figure 6 below.
When comparing these different metrics with the average score on the SUS scale (Figure 6), it is crucial to know that they all seek to evaluate similar aspects of the user experience in terms of usability and satisfaction. However, each metric brings a unique nuance. For example, if the average SUS score is high, it suggests good usability. In addition, “excellent” ratings and acceptability scores strengthen the perception of high utility among teachers. This convergence of metrics provides a more comprehensive and holistic view of the teacher’s experience.
The following are presented in Figure 7 of the results: a quantitative score and scale of the SUS test through the Pareto chart that highlights the hierarchy of the score categories in terms of their frequency of occurrence, along with the cumulative line of percentage of the total representing the distribution of the scores.
The data indicate that, in general, the score is good, as the categories “Excellent” and “Good” with 84.62% and 75.90%, are the ones with the highest scores compared to the others. The overall median score is 70.65, setting a generally reasonable usability framework, although with discernible areas for improvement. This could reflect the variety of teachers’ experiences, from those who faced initial challenges but adapted to those who found the tool easy to use from the outset. For example, Figure 7 shows a discernible evolution from an unfavorable usability perception to an “Excellent” level of approval when crossing the different categories: “Horrible” (47.14%) is perceived as a deeply unsatisfactory experience, while “Poor” (58.875%) shows early improvements but with notable challenges. The rating “OK” (67.5%) shows acceptable interaction, “Good” (75.9%) denotes comfort with enhanced areas, and “Excellent” (84.62%) illustrates an exceptional experience.
After arranging the general data of the SUS usability test of the tool by percentages and adjective categories, it is interesting to analyse the specific scores of each item to obtain more information and thus understand what has been the perception of the teachers and propose improvements in concrete actions (see Table 2).
The analysis of the results of the items (Table 2) presents the scores and averages of the SUS questionnaire questions using a Likert scale of 5 points, divided into positive (+) and negative (−) questions. Low scores (1 and 2) are found in items 2, 4, 6, 8, and 10. These items are mainly related to the complexity and difficulty of the tool’s use. On the other hand, high scores (4 and 5) are observed in items 1, 3, 5, 7, and 9, which deal with frequent use, ease of use, function integration, confidence, and speed of learning.
When comparing the positive and negative question averages, it is observed that the positive questions have higher averages (Median Positive: 3.76 vs. Median Negative: 2.11). Averages of positive questions indicate that teachers generally agree with positive statements about the self-assessment tool. Items with the highest averages are item 1 (3.70 M) on “usage frequency”, item 3 (3.11 M) on “user friendliness”, and item 5 (3.04 M) on “function integration”. In other words, these data suggest that teachers perceive that the tool is easy to use, that its functions are well integrated, and that the various functions of the tool are well embedded and work together effectively.
As for the scores of the negative items, although they may not be as predominant as the positive ones, their importance should not be underestimated, as they can highlight critical aspects that require attention and improvement. First, item 10 (2.24 M) on “pre-learning” to master the tool. Item 2 follows, with a median of 2.22, on “the complexity of the tool”, and finally, item 4 (2.11 M) reflects a concern about “technical difficulty”. While elements related to perceived complexity and the need for pre-learning need to be addressed to improve the user experience, positive attributes, such as ease of use and confidence generated, can be exploited to enhance their usefulness and transfer to future educational contexts. Nevertheless, the generally favorable aspects of the tool outweigh possible concerns.
The results of the descriptive statistics showed that the Male group had lower values for the dependent variable SUS Final Score (Mdn = 72.5) than the Female group (Mdn = 75). A Mann–Whitney U test was conducted to compare scores between Male and Female. For the given data, a Mann–Whitney U test showed that the difference between Male and Female with respect to the dependent variable SUS Final Score was statistically significant, U = 4742.5, n1 = 83, n2 = 145 p = 0.008. In addition, a point-biserial correlation was run to determine the relationship between SUS Final Score and Gender. There was a positive correlation between SUS Final Score and Gender, which was statistically significant (rpb = 0.15, n = 228, p = 0.023).
The average scores in each adjective category of the SUS questionnaire results for each educational stage are presented below in Figure 8. In the early stages, such as the Primary Cycle of Primary Education (6–8 years), there is a variability in scores, ranging from 47.50 (M) to 77.50 (M). These figures reflect a more heterogeneous usability experience, where some users find the most challenging tool. In contrast, the intermediate stages, such as the Middle Cycle of Primary Education (8–10 years), show a more stable trend, and as we move towards more advanced educational stages such as the Higher Cycle of Primary Education (10–12 years) and Compulsory Secondary Education (12–16 years), there is a gradual improvement (more than 40%) in scores.
The variability of scores in the early stages, for example, in the Primary Cycle of Primary Education, shows a minimum score of 47.50 of the median, indicating a negative usage experience. On the other hand, other teachers at the same stage gave a slightly more favorable score of 52.50 of the median, demonstrating a contrasting perception. This variability could be attributed to differences in teachers’ prior exposure to mobile technology and digitisation in the classroom. Teachers with a higher background in this field may be influenced towards a more optimistic appreciation of usability, while those with less familiarity may find themselves more cautious in evaluating the usefulness of the tool.
Table 3 shows the results of a one-way ANOVA, which is used to compare the means of educational stages to see if there is a statistically significant difference between them.
It is called ‘one-way’ because it analyses the effect of a single independent variable (factor), in this case, Educational Stage, on a dependent variable, in this case, SUS Final Score. The variable SUS Final Score F = 3.65, p-value of 0.007 is smaller than the common significance level of 0.05. This indicates that there is a statistically significant difference between the different groups.
Figure 9 details the SUS results in relation to the age of the teachers involved in the study and how a significant dispersion in SUS scores can be observed across the different teachers’ ages. A Kruskal–Wallis test showed that there was a significant difference between the categories of the independent variable Age with respect to the dependent variable SUS Final Score, p ≤ 0.001. The Kruskal–Wallis test showed that there was a significant difference. A Dunn–Bonferroni test was used to compare the groups in pairs to find out which was significantly different. The Dunn–Bonferroni test revealed that the pairwise group comparisons of 35–47, 34–47, 50–42, 39–47, 42–47, and 47–41 have an adjusted p-value less than 0.05 and thus, based on the available data, it can be assumed that these groups were significantly different in pairs.
This suggests that the usability of the self-assessment tool for mobile device implementation in the classroom is not perceived homogeneously across different age groups.
The youngest teachers, in the age range of 25 to 33, have relatively high scores in the SUS, with a median score of 75.83. This suggests a positive appreciation of the usability of the tool among this younger cohort. On the other hand, 34-year-old teachers show the lowest score of 53.33, along with teachers 42 with a score of 57.5 (M). As age increases, scores tend to gradually recover, with a boost in scores for 47-year-old teachers with a median of 80. It is noteworthy to note that there are two age groups with the highest scores: young people between 25 and 33 years old and adults who are or are approaching the final stage of their professional career, from 47 to 60 years old. These have a more positive perception of the usability of the tool compared to the age range of 34 to 42 years. These results suggest the great importance of considering generational diversity when designing digital tools that will be used autonomously.
On the other hand, for evaluating the usability of the self-assessment tool for mobile device implementation in education, the Net Promoter Score (NPS) [43] was calculated as a complementary test to the SUS Usability System. The implementation of the NPS (Figure 10) in conjunction with the SUS sought to obtain a more comprehensive view of the usability of teachers and their intention to recommend the use of the self-assessment tool. The NPS is calculated by subtracting the percentage of detractors from the percentage of promoters. The result can be a positive, negative, or neutral number. A positive NPS suggests a greater propensity for recommendation and, thus, a base of satisfied teachers.
The NPS score is 22.4, which suggests that there is a good score of teachers who are “promoters” representing 42.98% of the total sample. They may be willing to recommend the use of the self-assessment tool to other teachers, although the data also show that there are detractors. The presence of “detractors” (20.6% of the sample) indicates that there are areas of improvement that could be addressed to further increase the satisfaction and usability of the questionnaire. It should also be borne in mind that 36.4% are “passive” teachers, suggesting that a significant segment of respondents have neutral perceptions towards the self-assessment tool. Although they do not express extreme enthusiasm or major concern, there is room for improvement, increasing their likelihood of becoming promoters.

7. Discussion

With the aim of analysing the perception of teachers as to the usability of the self-assessment tool for the design, implementation, and evaluation of mobile device activities in education, the results obtained in connection with this goal allow a deeper understanding of how teachers perceive the tool’s usability in two key dimensions. It is also crucial to emphasize that the less positive results should not be interpreted in isolation but in conjunction with the positive results and with the aim of providing a balanced approach to continuous improvement. The combination of the positive aspects and areas of improvement identified in this analysis will contribute to a stronger and more effective self-assessment tool that can meet the diverse needs of teachers and promote the successful integration of mobile devices into the educational environment. In this context, the findings from the analysis of Blocks 1 and 2 are presented, providing the strengths and areas of improvement identified through the application of the System Usability Scale (SUS).
In relation to Block 1 data, as reflected in Table 1, a number of significant results were found in relation to teachers’ perceptions of:
  • Description and appropriateness of the self-assessment tool: Items 1 and 2 show high acceptance of the description and suitability of the self-assessment tool, with ease rates of 81.02% and 80.34%, respectively. This suggests that teachers find the tool understandable and suitable for their purposes.
  • Increased use of mobile devices: Item 3 reflects that 75.25% of teachers have increased the number of mobile activities in the classroom. The standard deviation of 19.06% indicates variability in responses, which could reflect differences in technology adoption among teachers due to a complex combination of social, technological, political, and pedagogical factors. For example, implementation and support strategies should be developed that are sensitive to contextual and personal differences, ensuring effective integration of technology in various educational environments through the flexibility of the tool to be used, taking this variability into account.
  • Reflection and improvement in education: Items 4 and 5 highlight how the self-assessment tool has encouraged reflection on educational topics (78.31%) and helped improve mobile activities (76.61%). The discriminatory efficiency of these items (64.90% and 76.39%) suggests that teachers using the self-assessment tool tend to be more aware of effective pedagogical practices and are more inclined to adapt and improve their teaching methods.
  • Feedback and training needs: Items 6 and 7 show that the feedback provided has been useful in identifying training needs (78.31%) and providing necessary training resources (80.00%). This underlines the importance of the personalized feedback provided in the tool for teachers, as they have had the option to improve in the weaker areas identified.
  • Perception of the tool’s continuous utility: Item 8, with an easy-to-use rate of 81.69%, indicates a strong belief in the continuous usefulness of the self-assessment tool. This suggests a positive perception of its long-term value in teaching practice. This is positive because the purpose of the tool is that it can be used when the teacher needs it, either to get started in the design of activities with mobile devices or to improve and review their proposals.
  • In general, it is important to note that the use of mobile devices in education for teaching is still relatively new and may require a learning curve for some teachers [56]. Effective deployment of mobile devices in the classroom requires a clear understanding of how technology can enhance the learning experience [57] and a capacity to design and carry out effective activities that make use of digital technologies [58].
In relation to the results of Block 2, as reflected in Table 2 on the SUS test and its analysis of the item scores, various actions are proposed to consider and develop:
  • Addressing generational and experience diversity: research revealed significant variability in usability scores according to teachers’ ages and educational stages. Younger and more experienced teachers showed a more positive perception of the tool’s usability compared to the age range of 34 to 42. In addition, the early stages of education showed a more heterogeneous usability experience. This variability could be attributed to differences in teachers’ prior exposure to mobile technology and digitization in the classroom. It is therefore crucial to consider these differences in the design and implementation of the tool, offering guidance and support tailored to the needs and experiences of different age groups and educational stages.
  • Enhance items with positive scores: The study results highlighted several positive attributes of the tool, such as ease of use, trust generated, and function integration. These positive aspects not only reflect the effectiveness of the tool but can also be used to enhance its usefulness. For example, ease of use, reflected in item 3, “I think the self-assessment tool was easy to use”, with a median of 3.11, could be promoted as a key feature in the promotion and adoption of the tool among teachers [50,51]. Furthermore, the confidence generated by the tool could be used to encourage greater experimentation and creativity in the application of mobile technologies in the classroom.
  • Develop strategies to turn “passive” teachers into “promoters”. The Net Promoter Score (NPS) revealed that 36.4% of teachers were “passive”, suggesting neutral perceptions towards the self-assessment tool. Although these teachers expressed no major concerns, their neutrality indicates room for improvement. Developing strategies for this group could include identifying their specific needs and concerns, offering personalized training and support, and highlighting the benefits and successes of the tool in similar contexts. The conversion of these “passive” teachers into “promoters” could have a significant impact on the adoption and success of the tool in a broader educational context.
  • Promoting training and technical support: Some items on the SUS scale highlighted the perception of complexity and the need for technical assistance in the use of the tool. These findings underline the importance of providing continuous training and support to teachers. Training could include practical workshops, online tutorials, and self-directed learning resources. Technical support could be offered through the same project, “Pla Mòbils.Edu” through training and follow-up mentors. The combination of training and technical support could not only address concerns related to perceived complexity but would also enhance the confidence and competence of teachers in the use of the tool.
  • In addition, the integration of mobile devices into education is a complex and dynamic process that requires a deep understanding of how technology, content, and pedagogy interact. As reflected in the usability of the evaluated self-assessment tool, the teacher requires continuous training and support in the integration of mobile devices, aligning the technology with educational and curricular objectives [59,60]. Furthermore, the diversity in the perception and adoption of the self-assessment tool, especially in terms of age and experience, reflects a complexity in integrating technology into education as it can be influenced by factors such as confidence in technology, attitude towards innovation, prior exposure to technology, and a need for differentiated training and support to meet the needs and expectations of different groups of teachers.
  • Finally, the validity of the proposed self-evaluation tool in research in terms of usability has been positively demonstrated through the SUS test and can be used in the classroom as a valuable strategy to enhance the integration of mobile devices in education, offering teachers an effective guide and support on their way to teaching enriched with digital technologies [61,62].

Author Contributions

Conceptualization, J.B.R. and J.M.D.O.; Methodology, J.B.R.; Validation, J.M.D.O.; Formal analysis, J.B.R.; Writing—original draft, J.B.R. and J.M.D.O.; Writing—review & editing, J.B.R. and J.M.D.O.; Supervision, J.M.D.O.; Project administration, J.B.R. All authors have read and agreed to the published version of the manuscript.

Funding

This research received no external funding.

Institutional Review Board Statement

For this study, the collection and processing of data in this research has been carried out taking into account the current regulations on personal data protection. The 2020 ‘Basic guide for researchers on personal data protection’ provided by the Office of Coordination and Advice on Security and Data Protection of the Rovira i Virgili University (URV) has been followed. This guide provides guidance and guidelines to ensure compliance with Regulation (EU) 2016/679 of the European Parliament and of the Council of 27 April 2016 and the Organic Law 3/2018 of 5 December on the protection of personal data and guarantee of digital rights.

Informed Consent Statement

For the processing of the personal data, the study participants were required to provide their informed consent for the processing of their personal data. Written informed consent has been obtained from the participants to publish this paper.

Data Availability Statement

Data are contained within the article.

Conflicts of Interest

The authors declare no conflict of interest.

References

  1. UNESCO. Desglosar el Objetivo de Desarrollo Sostenible 4: Educación 2030. 2017. Available online: https://unesdoc.unesco.org/ark:/48223/pf0000246300_spa (accessed on 17 April 2023).
  2. UNESCO. Género, Medios & TIC: Nuevos Enfoques de Investigación, Educación & Capacitación; French, L., Vega Montiel, A., Padovani, C., Eds.; UNESCO: Paris, France, 2021; Available online: https://unesdoc.unesco.org/ark:/48223/pf0000375656 (accessed on 22 February 2023).
  3. McGarr, O.; Johnston, K. Exploring the Evolution of Educational Technology Policy in Ireland: From Catching-Up to Pedagogical Maturity. Educ. Policy 2019, 35, 089590481984359. [Google Scholar] [CrossRef]
  4. Guillén-Gámez, F.D.; Mayorga-Fernández, M.J. Prediction of Factors That Affect the Knowledge and Use Higher Education Professors from Spain Make of ICT Resources to Teach, Evaluate and Research: A Study with Research Methods in Educational Technology. Educ. Sci. 2020, 10, 276. [Google Scholar] [CrossRef]
  5. Forkosh-Baruch, A.; Phillips, M.; Smits, A. Reconsidering teachers’ pedagogical reasoning and decision making for technology integration as an agenda for policy, practice and research. Educ. Technol. Res. Dev. 2021, 69, 2209–2224. [Google Scholar] [CrossRef]
  6. Martínez-Pérez, S.; Cabero-Almenara, J.; Barroso-Osuna, J.; Palacios-Rodríguez, A. T-MOOC for Initial Teacher Training in Digital Competences: Technology and Educational Innovation. Front. Educ. 2022, 7, 846998. [Google Scholar] [CrossRef]
  7. Rikala, J. Designing a Mobile Learning Framework for a Formal Educational Context. Ph.D Thesis, University of Jyväskylä, Jyväskylä, Finland, 2015. Available online: https://bit.ly/3IBzSW2 (accessed on 8 October 2019).
  8. Sun, J.C. Gaps, guesswork, and ghosts lurking in technology integration: Laws and policies applicable to student privacy. Br. J. Educ. Technol. 2023, 54, 1604–1618. [Google Scholar] [CrossRef]
  9. Tirado-Morueta, R.; García-Ruíz, R.; Hernando-Gómez, Á.; Contreras-Pulido, P.; Aguaded-Gómez, J.I. The role of teacher support in the acquisition of digital skills associated with technology-based learning activities: The moderation of the educational level. Res. Pract. Technol. Enhanc. Learn. 2023, 18, 010. [Google Scholar] [CrossRef]
  10. Mountford-Zimdars, A.; Moore, J.; Shiner, R. Enhancing Widening Participation Evaluation through the development of a selfassessment tool for practitioners: Learning from the Standards of Evaluation Practice (Phase 2) project 2017–2019. Widening Particip. Lifelong Learn. 2020, 22, 44–66. [Google Scholar] [CrossRef]
  11. Baena-Morales, S.; Martinez-Roig, R.; Hernádez-Amorós, M.J. Sustainability and Educational Technology—A Description of the Teaching Self-Concept. Sustainability 2020, 12, 10309. [Google Scholar] [CrossRef]
  12. Achahod, S. Towards reflection and action on the development of a hybrid learning model to promote the adoption of mobile devices in schools. In Proceedings of the 11th International Conference on Education and New Learning Technologies 2019, Palma, Spain, 1–3 July 2019; pp. 8274–8279. [Google Scholar] [CrossRef]
  13. Dorouka, P.; Papadakis, S.; Kalogiannakis, M. Tablets and apps for promoting robotics, mathematics, STEM education and literacy in early childhood education. Int. J. Mob. Learn. Organ. 2020, 14, 255. [Google Scholar] [CrossRef]
  14. Haga, S. Integrating Mobile-Assisted Language Learning: Teacher Beliefs in Japanese EFL Higher Education. In Proceedings of the 2nd International Conference on New Approaches in Education, Icnaeducation, Oxford, UK, 27–29 March 2020; Available online: https://www.doi.org/10.33422/2nd.icnaeducation.2020.03.147 (accessed on 15 November 2022).
  15. Siani, A. BYOD strategies in higher education: Current knowledge, students’ perspectives, and challenges. New Dir. Teach. Phys. Sci. 2017, 12. [Google Scholar] [CrossRef]
  16. Taharim, N.F.; Lokman, A.M.; Hanesh, A.; Aziz, A.A. Feasibility study on the readiness, suitability, and acceptance of M-Learning AR in learning History. Nucleation Atmos. Aerosols. 2016, 1705, 020009. [Google Scholar] [CrossRef]
  17. Carrera, X.; Coiduras, J.; Lazaro, J.L.; Pérez, F. La competencia digital docente: Definición y formación del profesorado. In ¿Cómo Abordar la Educación Del Futuro? Conceptualización, Desarrollo y Evaluación Desde la Competencia Digital Docente; Gisbert, M., Esteve, V., Lázaro, J.L., Eds.; Ediciones Octaedro: Las Gabias, Spain, 2019; pp. 59–78. [Google Scholar]
  18. Castañeda, L.; Esteve-Mon, F.M.; Adell, J.; Prestridge, S. International insights about a holistic model of teaching competence for a digital era: The digital teacher framework reviewed. Eur. J. Teach. Educ. 2021, 45, 493–512. [Google Scholar] [CrossRef]
  19. Wang, Y.; Hu, W. Analysis about serious game innovation on mobile devices. In Proceedings of the IEEE/ACIS 16th International Conference on Computer and Information Science (ICIS), Wuhan, China, 24–26 May 2017; pp. 627–630. [Google Scholar] [CrossRef]
  20. Pribeanu, C.; Gorghiu, G.; Lamanauskas, V.; Slekiene, V. Use of mobile technology in the teaching/learning process—Opportunities and barriers. In ELearning and Software for Education; ELSE: Bucharest, Romania, 2021; Volume 1, pp. 376–383. [Google Scholar] [CrossRef]
  21. Gao, Y. A Survey Study on the Application of Modern Educational Technology in English Major College Teaching in the Age of 5G Communication. Theory Pract. Lang. Stud. 2021, 11, 202. [Google Scholar] [CrossRef]
  22. Tengku Sharif, T.I.S.; Mohamad Noor, M.Y.; Omar, S.R.; Seong, T.K. Humanising mobile online esl blended learning model. J. Nusant. Stud. 2022, 7, 473–494. [Google Scholar] [CrossRef]
  23. Balanyà Rebollo, J.; De Oliveira, J.M. Los elementos didácticos del aprendizaje móvil: Condiciones en que el uso de la tecnología puede apoyar los procesos de enseñanza y aprendizaje. Edutec. Rev. Electrón. Tecnol. Educ. 2022, 80. [Google Scholar] [CrossRef]
  24. Hall, R.; Atkins, L.; Fraser, J. Defining a self-evaluation digital literacy framework for secondary educators: The DigiLit Leicester project. Res. Learn. Technol. 2014, 22, 21440. [Google Scholar] [CrossRef]
  25. Liang, B.; Gregory, M.A.; Li, S. Latency Analysis for Mobile Cellular Network uRLLC Services. J. Telecommun. Digit. Econ. 2022, 10, 39–57. [Google Scholar] [CrossRef]
  26. Salloum, R.G.; Theis, R.P.; Pbert, L.; Gurka, M.J.; Porter, M.; Lee, D.; Shenkman, E.A.; Thompson, L.A. Stakeholder Engagement in Developing an Electronic Clinical Support Tool for Tobacco Prevention in Adolescent Primary Care. Children 2018, 5, 170. [Google Scholar] [CrossRef]
  27. Van Nuland, S.E.; Eagleson, R.; Rogers, K.A. Educational software usability: Artifact or Design? Anat. Sci. Educ. 2016, 10, 190–199. [Google Scholar] [CrossRef]
  28. Nielsen, J.; Levy, J. Measuring usability—Preference vs. performance. Commun. ACM 1994, 37, 66–75. [Google Scholar] [CrossRef]
  29. Choo, S.; Kim, J.Y.; Jung, S.Y.; Kim, S.; Kim, J.E.; Han, J.S.; Kim, S.; Kim, J.H.; Kim, J.; Kim, Y.; et al. Development of a Weight Loss Mobile App Linked With an Accelerometer for Use in the Clinic: Usability, Acceptability, and Early Testing of its Impact on the Patient-Doctor Relationship. JMIR MHealth UHealth 2016, 4, e24. [Google Scholar] [CrossRef] [PubMed]
  30. Dekhane, S.; Tsoi, M.Y.; Johnson, C. Mobile Application Development by Students to Support Student Learning. In Mobile and Blended Learning Innovations for Improved Learning Outcomes; IGI Global: Hershey, PA, USA, 2020. [Google Scholar] [CrossRef]
  31. Manohar, P.; Acharya, S.; Wu, P.Y.; Ansari, A.; Schilling, W. Case Study Based Educational Tools for Teaching Software V&V Course at Undergraduate Level. American Society for Engineering Education. In Proceedings of the 122nd ASEE Anual Conference & Exposition, Seattle, WA, USA, 14–17 June 2015. [Google Scholar]
  32. Zhao, M.; Larson, J.; Jordan, M. Design and Development: NSF Engineering Research Centers Unite: Developing and Testing a Suite of Instruments to Enhance Overall Education Program Evaluation. In Proceedings of the ASSE Annual Conference, Virtual, 19–26 July 2021; American Society for Engineering Education: Washington, DC, USA, 2021. [Google Scholar]
  33. Plomp, T.; Nieveen, N. An Introduction to Educational Design Research SLO • Netherlands institute for curriculum development. In Proceedings of the seminar conducted at the East China Normal University, Shanghai, China, 23–26 November 2007. [Google Scholar]
  34. Lehtonen, D. Constructing a design framework and design methodology from educational design research on real-world educational technology development. EDeR Educ. Des. Res. 2021, 5, 38. [Google Scholar] [CrossRef]
  35. Chuenyindee, T.; Montenegro, L.D.; Ong, A.K.S.; Prasetyo, Y.T.; Nadlifatin, R.; Ayuwati, I.D.; Sittiwatethanasiri, T.; Robas, K.P.E. The perceived usability of the learning management system during the COVID-19 pandemic: Integrating system usability scale, technology acceptance model, and task-technology fit. Work 2022, 73, 1–18. [Google Scholar] [CrossRef] [PubMed]
  36. Emil, R.; Kaburuan, J.L. Evaluation of User Experience on Digital Learning Platform Website Using System Usability Scale. Turk. J. Comput. Math. Educ. (TURCOMAT) 2021, 12, 1595–1606. [Google Scholar] [CrossRef]
  37. Santágueda Villanueva, M.; LLopis Nebot, M.Á.; Esteve Mon, F.M. A mobile application for working on university service learning: Usability, adequacy and perceptions of usefulness. Edutec. Rev. Electrón. Tecnol. Educ. 2021, 78, 22–37. [Google Scholar] [CrossRef]
  38. Sari, R.P.; Henim, S.R. The application of system usability scale method to measure the usability of electronic learning system (e-learning) of politeknik caltex riau. ILKOM J. Ilm. 2021, 13, 266–271. [Google Scholar] [CrossRef]
  39. Criollo-C, S.; Lujan-Mora, S.; Jaramillo-Alcazar, A. Advantages and Disadvantages of M-Learning in Current Education. In Proceedings of the 2018 IEEE World Engineering Education Conference (EDUNINE), Buenos Aires, Argentina, 11–14 March 2018. [Google Scholar] [CrossRef]
  40. Palalas, A.; Wark, N. A Framework for Enhancing Mobile Learner-Determined Language Learning in Authentic Situational Contexts. Int. J. Comput.-Assist. Lang. Learn. Teach. 2020, 10, 83–97. [Google Scholar] [CrossRef]
  41. Lai, C. Trends of mobile learning: A review of the top 100 highly cited papers. Br. J. Educ. Technol. 2019, 51, 721–742. [Google Scholar] [CrossRef]
  42. El-Sofany, H.F.; El-Haggar, N. The Effectiveness of Using Mobile Learning Techniques to Improve Learning Outcomes in Higher Education. Int. J. Interact. Mob. Technol. (IJIM) 2020, 14, 4. [Google Scholar] [CrossRef]
  43. Naciri, A.; Baba, M.A.; Achbani, A.; Kharbach, A. Mobile Learning in Higher Education: Unavoidable Alternative during COVID-19. Aquademia 2020, 4, ep20016. [Google Scholar] [CrossRef]
  44. Kiat, L.B.; Ali, M.B.; Abd Halim, N.D.; Ibrahim, H.B. Augmented Reality, Virtual Learning Environment and Mobile Learning in education: A comparison. In Proceedings of the 2016 IEEE Conference on E-Learning, E-Management and E-Services (IC3e), Langkawi, Malaysia, 10–12 October 2016. [Google Scholar] [CrossRef]
  45. Diacopoulos, M.M.; Crompton, H. A systematic review of mobile learning in social studies. Comput. Educ. 2020, 154, 103911. [Google Scholar] [CrossRef]
  46. Moya, S.; Camacho, M. Developing a Framework for Mobile Learning Adoption and Sustainable Development. Technol. Knowl. Learn. 2021, 28, 727–744. [Google Scholar] [CrossRef]
  47. Lotero-Echeverri, G. Capacidades de los docentes para la incorporación de estrategias m-learning en sus procesos de enseñanza y aprendizaje. Estudio de un caso colombiano. Saber Cienc. Lib. 2021, 16, 220–232. [Google Scholar] [CrossRef]
  48. Ehrlinger, J.; Johnson, K.; Banner, M.; Dunning, D.; Kruger, J. Why the unskilled are unaware: Further explorations of (absent) self-insight among the incompetent. Organ. Behav. Hum. Decis. Process. 2008, 105, 98–121. [Google Scholar] [CrossRef] [PubMed]
  49. Karaman, P. The Impact of Self-assessment on Academic Performance: A Meta-analysis Study. Int. J. Res. Educ. Sci. 2021, 7, 1151–1166. [Google Scholar] [CrossRef]
  50. Sailer, M.; Stadler, M.; Schultz-Pernice, F.; Schöffmann, C.; Paniotova, V.; Husagic, L.; Fischer, F. Technology-related teaching skills and attitudes: Validation of a scenario-based self-assessment instrument for teachers. Comput. Hum. Behav. 2021, 115, 106625. [Google Scholar] [CrossRef]
  51. Balanyà Rebollo, J.; Minelli De Oliveira, J. The crux of mobile learning: Key aspects in teaching with mobile devices. International Conferences Mobile Learning. In Proceedings of the International Association for Development of the Information Society (IADIS), Virtual, 3–5 March 2021. [Google Scholar]
  52. Lehrmann, A.L.; Skovbjerg, H.M.; Arnfred, S.J. Design-based research as a research methodology in teacher and social education—A scoping review. EDeR Educ. Des. Res. 2022, 6, 54. [Google Scholar] [CrossRef]
  53. Fabila Echauri, A.M.; Minami, H.; Izquierdo Sandoval, M.J. La Escala de Likert en la evaluación docente: Acercamiento a sus características y principios metodológicos. Perspect. Docentes 2012, 50, 31–40. [Google Scholar]
  54. Brooke, J. SUS: A retrospective. JUX J. User Exp. 2013, 8, 29–40. [Google Scholar]
  55. Lewis, J.R. Usability: Lessons Learned… and Yet to Be Learned. Int. J. Hum.-Comput. Interact. 2014, 30, 663–684. [Google Scholar] [CrossRef]
  56. Keiningham, T.L.; Cooil, B.; Andreassen, T.W.; Aksoy, L. A Longitudinal Examination of Net Promoter and Firm Revenue Growth. J. Mark. 2007, 71, 39–51. [Google Scholar] [CrossRef]
  57. Riaza, B.; Rodríguez, A. Students’ Perception of the Integration of Mobile Devices as Learning Tools in Pre-Primary and Primary Teacher Training Degrees. In Mobile Devices in Education: Breakthroughs in Research and Practice; Information Resources Management Association; IGI Global: Hershey, PA, USA, 2020; pp. 374–391. [Google Scholar] [CrossRef]
  58. Marques, M.M.; Pombo, L. The Impact of Teacher Training Using Mobile Augmented Reality Games on Their Professional Development. Educ. Sci. 2021, 11, 404. [Google Scholar] [CrossRef]
  59. Nikolopoulou, K. Mobile devices in early childhood education: Teachers’ views on benefits and barriers. Educ. Inf. Technol. 2021, 26, 3279–3292. [Google Scholar] [CrossRef]
  60. Henriksen, D.; Mishra, P.; Creely, E.; Henderson, M. The Role of Creative Risk Taking and Productive Failure in Education and Technology Futures. TechTrends 2021, 65, 602–605. [Google Scholar] [CrossRef]
  61. Estrada, B.; Zapata, C. Definición de un meta-modelo para el diseño de aplicaciones de software educativo basado en usabilidad y conocimiento pedagógico. Inf. Tecnol. 2022, 33, 35–48. [Google Scholar] [CrossRef]
  62. Clark, R.C.; Mayer, R.E.; Thalheimer, W. E-learning and the science of instruction: Proven guidelines for consumers and designers of multimedia learning. Perform. Improv. 2003, 42, 41–43. [Google Scholar] [CrossRef]
Figure 1. Didactic elements of mobile learning.
Education 14 00001 g001
Figure 2. Phases and general process of the research based on Educational Design Research (EDR).
Education 14 00001 g002
Figure 3. Participants by educational stages.
Education 14 00001 g003
Figure 4. Teachers’ age distribution.
Education 14 00001 g004
Scheme 1. Summary of the instrument implementation process.
Education 14 00001 sch001
Figure 5. Scores of the items in Block 1 on a 5-point Likert scale.
Education 14 00001 g005
Figure 6. A comparison of the adjective ratings, acceptability scores, and school grading scales in relation to the average SUS score.
Education 14 00001 g006
Figure 7. Evaluation of the usability of a self-assessment tool for mobile device integration in the classroom.
Education 14 00001 g007
Figure 8. Comparison of SUS usability in educational stages.
Education 14 00001 g008
Figure 9. Comparison of SUS usability in relation of teacher’s age.
Education 14 00001 g009
Figure 10. Results of Net Promoter Score.
Education 14 00001 g010
Table 1. Usability of the pedagogic content: Block 1.
Items Block 1.Analysis of the Questionnaire Structure
Facility IndexStandard DeviationDiscrimination IndexDiscrimination Efficiency
1.- I consider that the characteristics presented in the self-assessment tool are sufficiently descriptive. 81.02% 15.50% 47.97% 56.53%
2.- I think the list of characteristics of each element of the
self-assessment checklist is adequate.
80.34% 12.59% 40.54% 53.00%
3.- As a teacher registered in the “Pla Mòbils.edu” I have increased the number of activities that I propose in the classroom with mobile devices. 75.25% 19.06% 43.49% 45.85%
4.- Utilizing the self-assessment tool has encouraged me to examine educational issues that I had not previously considered when designing mobile activities. 78.31% 12.48% 55.64% 64.90%
5.- I consider that using the self-assessment tool has helped me to improve my mobile activities. 76.61% 10.60% 62.36% 76.39%
6.- The feedback provided by the self-assessment tool has helped me to identify training needs. 78.31% 14.99% 59.98% 66.31%
7.- I believe that the feedback from the self-assessment questionnaire has provided me with the necessary training resources to improve my level in the use of mobile devices in education. 80.00% 14.38% 54.82% 60.44%
8.- I think it would be beneficial to have the self-assessment tool so that I can utilise it whenever necessary. 81.69% 14.04% 48.42% 53.60%
Table 2. SUS test item scores: Block 2.
Items Block 2 SUS Results 5-Point Likert Scale Item ScoresTotal Items (M)
1 2 3 4 5
1. (+) I think I would use this self-assessment tool frequently. 3.68 3.70 3.71 3.71 3.71 3.70
2. (−) I consider this self-assessment tool to be unnecessarily complex.2.21 2.22 2.22 2.21 2.24 2.22
3. (+) I think the self-assessment tool was easy to use.3.85 -3.89 3.89 3.91 3.11
4. (−) I think I would need help from a person with technical knowledge to use this self-assessment tool.2.10 2.11 2.12 2.10 2.11 2.11
5. (+) The functionality of this self-assessment tool is highly integrated.-3.79 3.78 3.81 3.80 3.04
6. (−) I think the self-assessment tool is very inconsistent.2 2 2.01 2 -1.60
7. (+) I imagine that most people would learn to use this self-assessment tool very quickly. -3.67 3.70 3.70 3.76 2.97
8. (−) I consider this self-assessment tool very difficult to use.1.96 1.96 1.98 1.97 -1.57
9. (+) It gives me confidence when I use this self-assessment tool.0 3.73 3.72 3.72 3.75 2.98
10. (−) I needed to learn many things before I was able to use this self-assessment tool. 2.22 2.22 2.23 2.24 2.29 2.24
Table 3. ANOVA results of educational stages by SUS scores.
Sum of SquaresdfMean SquaresFp
Educational Stage1340.554335.143.650.007
Residual20,470.2822391.79
Total21,810.83227
Disclaimer/Publisher’s Note: The statements, opinions and data contained in all publications are solely those of the individual author(s) and contributor(s) and not of MDPI and/or the editor(s). MDPI and/or the editor(s) disclaim responsibility for any injury to people or property resulting from any ideas, methods, instructions or products referred to in the content.

