Article

Attitudes towards Research Methods in Education: Development of the ATRMQ Scale

by
Antonio Matas-Terrón
,
Lourdes Aranda
,
Pablo Daniel Franco-Caballero
* and
Esther Mena-Rodríguez
Department of Theory and History of Education and Research Methods and Diagnostic in Education, Univesidad de Málaga, 29010 Málaga, Spain
*
Author to whom correspondence should be addressed.
Educ. Sci. 2024, 14(4), 374; https://doi.org/10.3390/educsci14040374
Submission received: 23 February 2024 / Revised: 28 March 2024 / Accepted: 1 April 2024 / Published: 4 April 2024
(This article belongs to the Section Higher Education)

Abstract

:
The noticeable lack of knowledge among Spanish university students regarding the disciplinary content of research methodology is notable, despite the considerable potential benefits for curriculum design. This study represents the initial phase of a project aimed at analysing and ameliorating this deficiency. It sought to develop a scale to measure the attitudes of education students towards the content of research methods. The psychometric properties were analysed using an incidental sample of 447 students, of whom 87.9% were women and 12.1% were men, aged between 18 and 52 years. Of the total number of participants, 43.2% belonged to the Pedagogy Degree, 36.7% to the Early Childhood Education Degree, and 20.1% to the Social Education Degree of the Faculty of Educational Sciences of the University of Malaga. The instrument was developed based on the ATSQ scale by Ordoñez et al. Both exploratory and confirmatory factor analyses were conducted to assess its validity. The results demonstrate adequate psychometric properties and confirm a three-dimensional model. This model encompasses measures pertaining to three factors: two emotional (emotion− and emotion+) and one cognitive (estimated utility), facilitating the study of the students’ attitude towards the subjects of research methods. Furthermore, it provides arguments to consider a second-order unidimensional model. This study concludes with a discussion on the concept of attitudes towards research methods. Additionally, it identifies future challenges in measuring this construct without linking it to teacher evaluation.

1. Introduction and Objectives

This document introduces the initial phase of an ambitious research project, whose primary objective is to explore and understand the perceptions of students enrolled in education programs within the Spanish educational system regarding curricular contents associated with research methodology in education. Through this understanding, the project aims to identify and propose strategies for curricular improvement. This initial phase focuses on the development and validation of a psychometric instrument designed to capture the perceptions of Spanish students of education towards these methodological contents. This methodical approach will not only identify specific areas for improvement but also develop an empirical basis for future curricular interventions aimed at optimising the teaching of research methodology in education programs.
Education and pedagogy faculties in Spain offer degrees that include subjects incorporating research methodology content. This content is endorsed by Organic Law 2/2006 of 3 May [1], amended by Organic Law 3/2020 [2], which places special emphasis on the research dimension of teaching professionals, demanding a full research capability alongside a complete teaching capacity. Compliance with this regulatory framework is achieved through two main mechanisms: firstly, the integration of methodological instruction across various of subjects within the syllabus; and secondly, the inclusion of dedicated subjects focusing on research methodologies (RMs). Nonetheless, the regulatory latitude afforded by the Spanish university system permits each institution to tailor its academic programs to its unique context within a rather flexible regulatory ambit. Consequently, it proves challenging to articulate a comprehensive overview of the specific content distribution or the overarching curriculum structure here. For detailed insights, consulting the websites of the respective universities is advisable.
Including this content is not only nomologically justified but also fundamental, as it equips future researchers with the necessary tools and techniques to conduct high-quality research in the field of education [3].
It benefits not only those dedicated to research but also teaching itself. For instance, McKenney and Schunn [4] argue that educational research can provide teachers with a solid theoretical framework for curriculum design, so training in research can help teachers apply this framework in practice. Similarly, previous authors concluded that teachers trained in educational research have a deeper understanding of the teaching and learning process, are able to implement research in their professional practice to enhance student performances, and acquire a greater capacity for making informed, evidence-based decisions [5,6,7].
As a discipline, RM in education focuses on studying procedures for designing, implementing, and analysing educational research [8]. As Fraenkel and Wallen [9] pointed out, the goal of this discipline is to provide tools and techniques for conducting high-quality research in education. Cohen et al. [8] expanded on this perspective, noting that it also aims to develop skills and knowledge that enable educational researchers to conduct rigorous and reliable research.
Research methodology in the social sciences (especially in education), in terms of its disciplinary corpus, includes theoretical, procedural, and practical content on the epistemological analysis of different paradigms, approaches, techniques, and research instruments [10,11]. It also deals with the cognitive and social processes that occur during the interpretation of research results to answer the posed research questions [12]. All of this is with the intention of fostering a culture of evidence, so that educational decisions are based on empirical research rather than intuition or unverified assumptions [13]. In summary, the discipline of RM in education is fundamental for advancing educational practice and theory, as it provides the necessary tools to conduct rigorous research and address important questions in the field of education. Given this, a question that arises is how education students perceive these contents and what attitude they have towards them, as the studies consulted indicate that both the attitude and perception of academic content are related to academic performance [14,15].
Although at an international level there is a notable corpus of research on the attitude of university students towards scientific research [16,17,18,19,20,21,22], considerably fewer studies focus on research methodology as an academic discipline.
Within the context of the Spanish educational system, there is a notable absence of studies that specifically examine the perceptions of these students regarding research methods in education. This gap in the literature highlights the need to direct research attention towards understanding how methodological content is received and processed by students, in order to address possible deficiencies and optimise the teaching of these crucial competencies for future professional development (see [23]).
When conducting studies on student attitudes, the first challenge is to define the concept of attitude itself [24]. One of the most cited approaches to attitudes is the three-dimensional model by Rosenberg and Hovland [25], which has played a prominent role in studies on attitudes towards statistics in both psychology and education students (e.g., [26,27,28]). From this perspective, attitudes are predispositions to respond to certain stimuli with specific cognitive, affective, and conative-behavioural responses.
Among the instruments used to measure attitudes towards statistics in university students from social and legal sciences, notable are the Statistic Attitude Survey (SAS) by Roberts and Bilderback [29], Attitudes Toward Statistics (ATS) by Wise [30], and the Survey of Attitudes Toward Statistics (SATS) by Schau et al. [31]. In Spain, the Attitudes towards Statistics Scale (EAE) by Auzmendi [26], which analyses five factors linked to attitude, utility, anxiety, confidence, liking, and motivation, has led to a prolific line of studies. Two subsequent validation studies identified four factors [32,33]: certainty, importance, utility, and desire to know. The Attitudes toward Statistics Questionnaire (ATSQ) by Ordóñez et al. [34], developed from the EAE [26] and the SATS [31], is also noteworthy. The ATSQ is presented as an easily applicable tool, with initial validation studies identifying three latent dimensions: positive emotions, negative emotions, and utility.
The aforementioned points establish a general framework for both current and future research, summarised as follows:
  • Studies on the attitudes and perceptions of university students towards the subjects they take help understand the development of the teaching and learning process, facilitating curricular adaptation.
  • Attitudes towards statistics content in social and legal sciences degrees have been prolifically studied, leading to the development of specific scales for this purpose.
  • The attitude of students towards RM subjects as a holistic educational unit has not been studied in the Spanish higher educational system.
Bearing all this in mind, this study aims to develop an instrument for measuring education students’ attitudes towards RM content, encompassing issues related to the Philosophy of Science, research procedures, data analysis, and the dissemination of scientific findings, rather than merely focusing on statistics. The second objective is to analyse the psychometric properties of this instrument. The goal of all of this is to be able to make an initial assessment of the students of education in subsequent studies.

2. Methodology

2.1. Design and Participants

To achieve the proposed objectives, a psychometric design was conducted using a nonprobabilistic incidental sample of 447 individuals. The sample consisted of university students from various education science degrees: 43.20% from the Pedagogy Degree, 36.7% from the Early Childhood Education Degree, and 20.1% from the Social Education Degree. Of all participants, 87.9% were female and 12.1% male. The age range was between 18 and 52 years, with an average age of 21.4 years (SD = 3.80). The average age for women was 21.3 years (SD = 3.91), and for men it was 21.7 years (SD = 2.76). No first-year students participated in the sample, ensuring that all participants had been exposed to research methodology subjects.

2.2. Instrument

This study used an instrument comprising the following sections:
  • Sociodemographic questions: age, gender, family members with a similar degree, and employment status. Academic questions of interest: degree program, year of study, whether the degree was the first choice of access, overall satisfaction with the degree, and general satisfaction with RM.
  • Two items on positioning regarding RM. These two items were taken from Estrada (2002) and used as external comparison criteria for the convergence and divergence of measures.
  • An adapted version of the ATSQ [34]. The original version of this questionnaire (named CAHE in its original version in Spanish) consists of 16 items grouped into three dimensions (see Appendix A). For this research, an adaptation was made, which could be considered naïve, as it simply involved changing the word “statistics” to “research methods”.
The ATSQ was presented as a Likert scale with five response options for its items, ranging from (1) strongly disagree to (2) disagree, (3) neither agree nor disagree, (4) agree, and (5) strongly agree. A sixth option was added for respondents who did not know how to answer (6 = I don’t know) to differentiate a lack of knowledge from a neutral position [35]. Appendix A includes the psychometric characteristics of the ATSQ as reported by its authors, to compare its results with those of the present study.
Firstly, the naïve version of the ATSQ, henceforth referred to as the ATRMQ (Attitudes towards Research Methods Questionnaire), was developed. The research team replaced the word “statistics” from the original version with “research methods”. This seemingly simplistic approach is founded on the epistemology of inductive reasoning by analogy, premised on the notion that if two or more elements exhibit similarities in certain respects, it is reasonable to infer that these similarities may extend to other, unexamined aspects. Such a method has been shown to be particularly valuable in the scientific domain for exploring and formulating theories and tools that build upon pre-existing knowledge. In this context, Hill [36] delved into the significance of relevance and similarity in the logical underpinnings of the analogy, proposing a semantic framework for assessing its applicability. Similarly, Fisher [37] underscored the methodological significance of this approach in structuring scientific inquiries. However, employing this strategy necessitates the examination of certain psychometrically crucial aspects, such as a comprehensive evaluation of the assumptions underlying psychometric techniques. This highlights the necessity of scrutinising and validating these premises in new contexts, as well as analysing the influence of latent variables [38,39]. To analyse the appropriateness of this version, a group of three education teachers was asked to assess the semantic and grammatical consistency of the items. They were also requested to evaluate the extent to which the items covered the domain of dimensions linked to RM in education. These teachers have the following profiles:
  • Teacher with 23 years of experience in RM and Diagnostics in Education.
  • Specialist in Early Intervention and Diagnostics in Education.
  • Teacher with 20 years of experience in Didactics and School Organisation, specialising in inclusive education and with one six-year period of research.
  • Teacher with 30 years of experience in RM and Diagnostics in Education.
  • Specialist in Educational Diagnosis, with one six-year period of research.
The assessment of the consulted individuals was very positive, considering that the items were well understood and optimally linked to the corresponding domain.
Once the instrument was developed, it was administered to the participating sample. All data were collected throughout October and November of the first semester of the 2022–2023 academic year, across different degrees of the Faculty of Educational Sciences (Degree in Pedagogy, Degree in Early Childhood Education, and Degree in Social Education) at a Spanish university.
The research project was undertaken with strict adherence to the ethical principles delineated in the Declaration of Helsinki, encompassing a commitment to the dignity, rights, safety, and well-being of all participants. Rigorous protocols were established to secure informed consent, ensure privacy, and maintain confidentiality. Accordingly, permission to administer the questionnaires was sought via email from teachers in the classrooms where data collection occurred, detailing the research objectives and the nature of the information being collected.
The survey was administered in person to all students, and at the start of each data collection session, the research objectives were explained to the students, along with a brief overview of the test. Informed consent was requested and provided, and the confidential nature of the information gathered was communicated.

2.3. Data Analysis

In preparing the data for subsequent analysis, items 2 and 4, as well as items 5, 8, 10, 13, 14, 15, 17, 18, 19, and 20 from the ATRMQ scale (see Appendix A), were reverse-coded. Additionally, responses with the option “6—I don’t know” were removed from the data matrix.
The data were divided into two subgroups or datasets to examine the psychometric properties. One dataset was designated for exploratory analysis (70% of the cases) and the other for confirmatory analyses, ensuring a sufficiently large sample size (more than 150 cases and at least 5 cases per variable) as recommended by Pallant [40].
In the exploratory factor analysis (EFA), factorisation with an oblimin rotation was carried out to identify the factorial structure of the scale and assess the coherence of the items, taking into account that factors could be correlated through consultation with literature notes, as advised by Carretero-Dios and Pérez [41]. A conservative criterion was used, considering factor loadings below 0.40 as low [42,43].
For the retention of the number of factors, the optimised parallel analysis procedure was used, which is considered more appropriate to avoid overfactorisation, which often occurs with the Kaiser–Guttman criterion of eigenvalues greater than 1 [44]. Maximum likelihood estimation (MLM) was used, which has been shown to perform well even under non-normality conditions [45].
Subsequently, a confirmatory factor analysis (CFA) was conducted, based on the results of the previous exploratory analysis and the structure identified by Ordóñez et al. [34] in the ATSQ. To evaluate the goodness of fit of the models, the following measures were used:
  • The normalised robust Chi-square test (X2/d.f.), the absolute Chi-square index, and its ratio to degrees of freedom, where values between 3 and 5 are considered acceptable for a global fit.
  • The RMSEA (Root Mean Square Error of Approximation) parsimony statistic to assess the residual matrix, which is considered acceptable with values below 0.08.
  • The SRMR (Standardised Root Mean Square Residual) index, with a cut-off point of 0.08 or less recommended [46].
  • Standardised indices, the CFI (Comparative Fit Index) and TLI (Tucker–Lewis Index), where values between 0.90 and 0.95 are considered acceptable. Values above 0.95 are considered good [47]. The BIC (Bayesian Information Criterion) and the AIC (Akaike Information Criterion) were used in model comparison, selecting the one with smaller indices [48]. In the next phase, the reliability of the scale and subscales was calculated using Cronbach’s alpha coefficient and McDonald’s omega.
Once the latent structure and consistency of measurement were confirmed, average scores derived from each latent dimension were calculated. Subsequently, the correlation of these scores with the criterion item scores was applied to obtain a measure of concurrent and divergent validity.
Analyses were conducted using the R program [49] and Jamovi [50].

3. Results

3.1. Exploratory Factor Analysis (EFA)

The EFA was conducted on 70% of the sample cases (n = 267). To verify the appropriateness of the EFA, the Kaiser–Meyer–Olkin (KMO) measure was calculated, yielding a value of 0.892. This value, along with Bartlett’s test of sphericity (X2 = 1093; df = 120; p < 0.001), indicates that the EFA is suitable for the characteristics of the data collected from the sample. Factor loadings are presented in Table 1.
The model explains 50.7% of the total variance, with a BIC value of −301, a TLI of 0.993, and a Chi-square value of 79.2 (df = 75; p = 0.348). This structure aligns with that of the original ATSQ (see [34]).

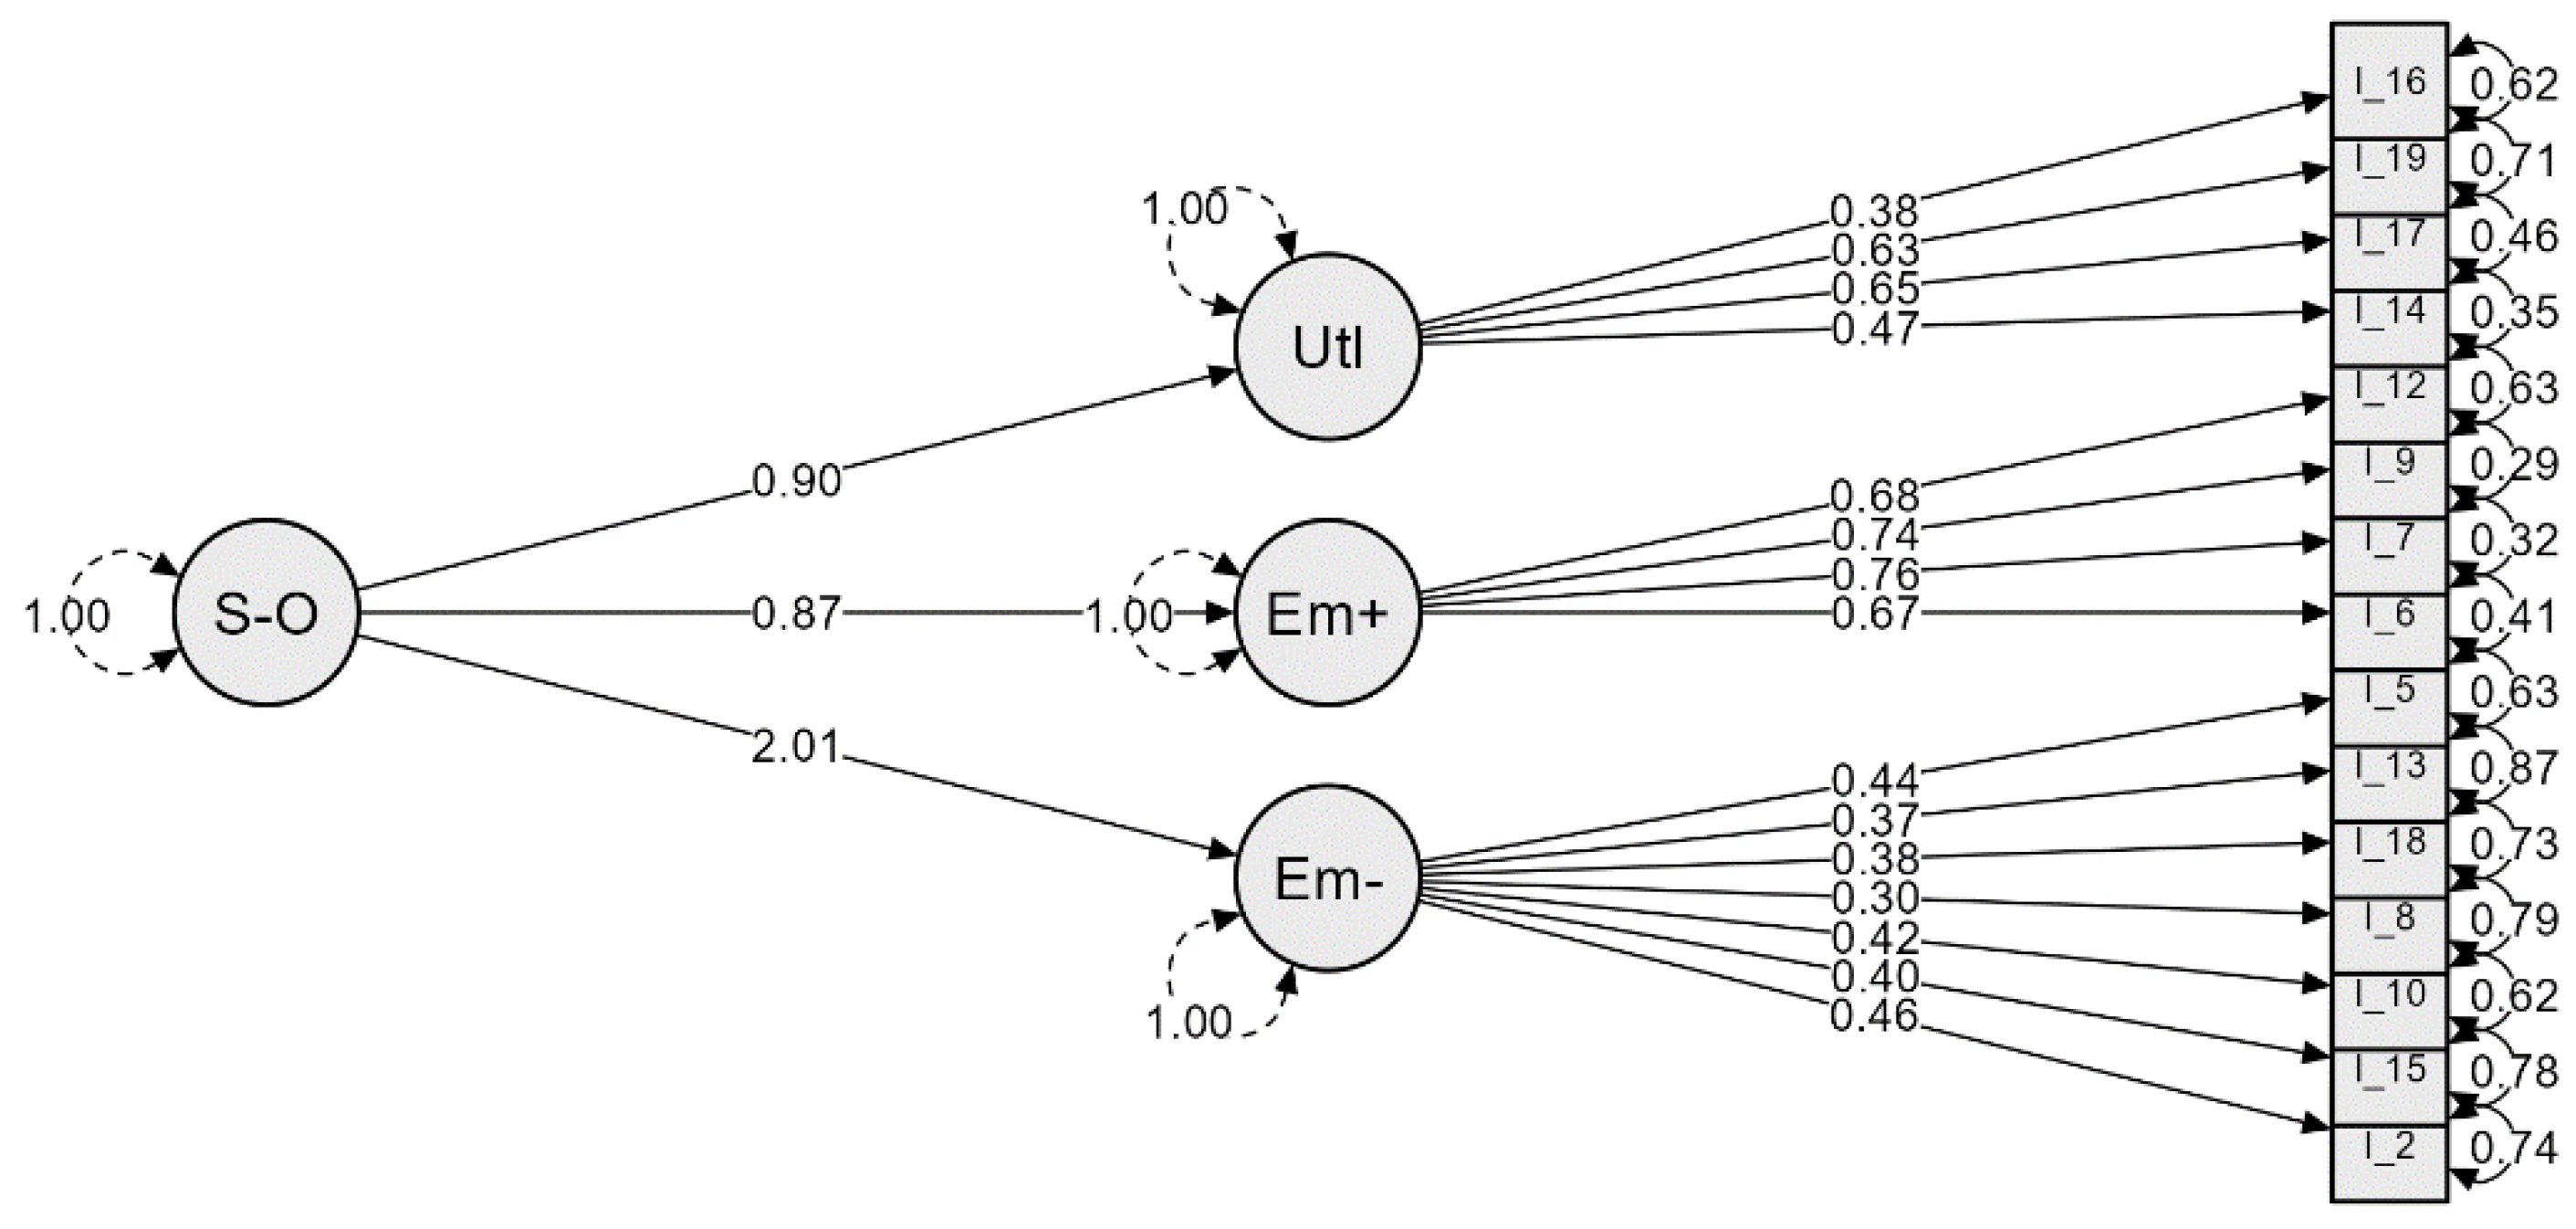
3.2. Confirmatory Factor Analysis (CFA)

The CFA was conducted on the ATRMQ structure to corroborate the instrument’s three-dimensionality using a subset of 178 cases randomly selected from the total sample. Considering the ambivalence of item 11 (“I don’t get upset when I have to work on research methods problems”) in the EFA, three models were analysed (see Table 2): a first (A) model including item 11, which also matches the original ATSQ model [34]; a second (B) model without item 11; and a third (B) model considering a second-order structure, including the general construct of “attitude”).
Given these indicators, the model proposed is the third one (Model C), as illustrated in Figure 1, considering the indicators’ alignment and their consistency with the previously reviewed literature, which delineates three interconnected factors contributing to a latent construct.

3.3. Reliability of the Measure

The internal consistency of the entire scale, as well as its three comprising dimensions, was calculated (see Table 3). Cronbach’s alpha coefficient was used due to its common application in these designs, along with McDonald’s omega, considering its advantages for multiple-choice scales. The total sample of participants was used for the analysis of internal consistency.
The results can be interpreted as highly satisfactory. The values are close to the optimal score of 0.9, where it can be considered that there is a balance between the internal consistency and the number of items, avoiding the redundancy that can arise from unnecessarily increasing the number of items to boost reliability. However, it is also noted that the utility scale achieves improvable results, with acceptable, albeit somewhat low, Cronbach’s and McDonald’s scores.

3.4. Correlation with Criterion Items

Correlations of the dimensions and the total score of the scale with the items taken as criteria have been calculated. The results are shown in Table 4. Considering that the criteria items had a five-option response scale, the correlation was calculated using Spearman’s Rho coefficient. The results show statistically significant correlations at a significance level above 99% in all cases. However, as expected, the negative emotions factor (emotion−) has a higher relationship with item 2. It should be noted that item 2 is reverse-scored, meaning a higher score indicates a position against the item. Thus, the result is consistent with the meaning of the factor. Regarding the positive emotions factor (emotion+), the highest correlations are presented with the second item. Lastly, the utility factor has a higher correlation with item 1, which is also reverse-scored. All these results suggest that the factors are not clearly linked to a position against or in favour, depending on the items. This would be evidenced if the negative or positive emotion scale only correlated with items clearly against or in favour of RMs.

4. Discussion

To address the absence of instruments measuring university students’ attitudes towards RM content within the Spanish higher education system—particularly those enrolled in education—this study aimed to develop and validate a psychometric scale for this purpose. This was based on the ATSQ scale by Ordoñez et al. [34], with some variations made after consulting a group of experts.
In terms of psychometric validation, the exploratory factor analysis revelated a structure comprising three factors—positive emotions, negative emotions, and utility—with an acceptable level of explained variance. This result was consistent with those obtained in the confirmatory factor analysis. This three-dimensionality is common in attitude studies [51]. Specifically, the results show that students’ attitudes revolve primarily around emotional aspects, both positive and negative, and participants’ assessment of professional utility. However, the results also suggest the existence of a unidimensional latent structure with quite good fit indices, giving meaning to the three aforementioned factors.
Concerning the overall consistency of the instrument, the results are considerably good for the total scale, as well as for the positive emotion and negative emotion subscales. However, it is somewhat low for the utility subscale according to common cut-off criteria [52].
It is worth noting that McDonald’s analysis allows for an assessment of the degree to which a scale is unidimensional [53]. In this regard, the confirmatory factor analysis and McDonald’s coefficient provide two different approaches to analysing construct validity. This is important, as the second-order model extracted in the confirmatory factor analysis and the result of McDonald’s omega coefficient are sufficient arguments to consider that the scale measures a general construct that can be called attitude towards RM content.
Thus, this study demonstrates that students’ attitudes towards the discipline and content of RM can be conceived as a global concept, which can be measured, though it articulates over three components, two emotional and one cognitive. Drawing a parallel with Gómez Chacón’s [54] definition of attitudes towards mathematics, it is proposed to understand the construct of attitudes towards RM in education as a set of evaluations and emotions related to events occurring in classes where RM content is offered. This conceptualisation of the attitude construct is consistent with authors like Renaud [55], who consider attitude an internal state of a person towards anything that the person can evaluate, including academic matters.
Lastly, this study sought to analyse the potential divergence and convergence of latent dimensions, using two items as external criteria, one related to utility and the other to emotional and cognitive issues. The results are consistent with what was expected. The utility item is clearly related to the utility factor, while the decision-making item is related to all factors. These results align with decision-making processes, where both emotional aspects (positive and negative) and evaluation of the utility of decision objects are involved [56,57,58].

5. Conclusions

This study has successfully developed a scale measuring students’ attitudes towards RM content and its components, demonstrating satisfactory psychometric properties. This instrument signifies an initial step towards exploring the reality of the discipline and content of RM in the field of social sciences, covering various dimensions, such as student perspectives, curriculum design, and social impact. It lays an empirical foundation for informed decision-making in educational management, curriculum development, and teaching practices, potentially elevating the overall quality of higher education in social sciences and related fields. For university administrators, the validated scale serves as a tool for assessing and enhancing educational quality, enabling a precise identification of students’ attitudes towards research methodology and facilitating targeted interventions to improve the educational experience. Curriculum designers are provided with valuable data to fine-tune research methodology content, ensuring that educational programs more closely align with student needs and perceptions.
For educators, particularly those teaching research methodology, the scale offers insights into students’ emotional and cognitive attitudes towards these subjects. This aids in tailoring teaching methods to boost engagement and perceived relevance while also pre-empting and managing potential emotional obstacles to learning.
Moreover, informing students that their attitudes are considered in curriculum planning communicates respect for their experiences, fostering their engagement in the educational process. Adapting content and methodologies to better suit their needs and preferences may not only enhance academic outcomes but also deepen their commitment to and valuation of research methodology, which is crucial for their future professional endeavours.
This research’s initial phase paves the way for future studies and the potential to extend these findings to different cultural and linguistic contexts, after appropriate modifications, thereby broadening its applicability and significance.
Despite its promising potential, it is crucial to acknowledge this study’s limitations. Firstly, it encompasses only a sample from education degrees at one university, limiting the generalisability of the conclusions to other institutions and social sciences disciplines. Secondly, while the scale aims to measure attitudes towards research methodology content, students’ responses may be influenced by their instructional experiences. It is essential to differentiate between content evaluation and teaching methodologies. Responses might inadvertently reflect perceptions of teaching effectiveness, a distinct aspect from attitudes towards the RM discipline. Recognising this overlap is essential for accurately interpreting the scale’s outcomes and for guiding specific curricular and pedagogical revisions. Future scale applications should strive to separate students’ content attitudes from their teaching evaluations, possibly by integrating items that directly address teaching methods or by controlling for instructional quality variables. This approach will enable educators and curriculum designers to identify the aspects of research methodology that resonate with or challenge students, independently of their opinions on teaching methods.

Author Contributions

Conceptualization, A.M.-T.; methodology, A.M.-T., L.A. and P.D.F.-C.; software, A.M.-T. and P.D.F.-C.; validation, A.M.-T. and P.D.F.-C.; formal analysis, A.M.-T., P.D.F.-C. and E.M.-R.; investigation, L.A.; resources, A.M.-T.; data curation, P.D.F.-C.; writing—original draft preparation, A.M.-T. and P.D.F.-C.; writing—review and editing, A.M.-T., L.A., P.D.F.-C. and E.M.-R.; visualization, L.A.; supervision, A.M.-T.; project administration, A.M.-T.; funding acquisition, A.M.-T. All authors have read and agreed to the published version of the manuscript.

Funding

This research received no specific grant from funding agencies in the public, commercial, or not-for-profit sectors.

Institutional Review Board Statement

We have diligently adhered to the ethical principles outlined in the Helsinki Declaration and have taken steps to ensure the protection of participants’ rights and well-being in our study. Below are the arguments supporting our position: 1. Helsinki Declaration: We have followed the ethical guidelines set forth in the Helsinki Declaration, which is an internationally recognized framework for medical and scientific research. Our study has been designed and conducted in accordance with these principles. 2. Informed Consent: All participants in our study have provided written informed consent prior to their inclusion. They have been informed about the study’s objectives, procedures involved, potential risks and benefits, and their right to withdraw at any time without adverse consequences. 3. Absence of Harmful Consequences: The study does not involve invasive interventions or procedures that could cause physical or psychological harm to participants. Furthermore, we have carefully assessed any potential risks and implemented measures to minimize them. In summary, although our university lacks a specific ethics committee, we have adhered to rigorous ethical standards and safeguarded the rights and interests of our participants.

Informed Consent Statement

Informed consent was obtained from all subjects involved in this study.

Data Availability Statement

The data presented in this study are openly available in Zenodo at https://doi.org/10.5281/zenodo.10913021 (accessed on 20 March 2024).

Conflicts of Interest

The authors declare no conflicts of interest.

Appendix A

The psychometric results of the ATSQ by Ordoñez et al. [34] are added in Table A1. To facilitate comparison, in the “included items” column, the numbering used in this study has been applied instead of the original.
Table A1. Factors and items of the ATSQ [34].
FactorItems IncludedExplained VarianceInternal Consistency (Cronbach’s Alpha)
Emotion−20, 15, 10, 8, 18, 13, 5, 1133.485%0.921
Emotion+6, 7, 9, 1215.938%0.774
Utility14, 17, 19, 1613.352%0.745
Attitude (global) 62.775%0.902

References

  1. Ordoñez, X.G.; Romero, S.J.; Ruiz De Miguel, C. Cuestionario de Actitudes Hacia La Estadística (CAHE): Evidencias de Validez y Fiabilidad de Las Puntuaciones En Una Muestra de Alumnos de Educación. Bord. Rev. Pedag. 2016, 68, 121. [Google Scholar] [CrossRef]
  2. Jefatura del Estado. Ley Orgánica 2/2006, de 3 de Mayo, de Educación; Boletín Oficial del Estado: Madrid, Spain, 2006; Volume BOE-A-2006-7899, pp. 17158–17207. Available online: https://www.boe.es/eli/es/lo/2006/05/03/2/con (accessed on 23 February 2024).
  3. Jefatura del Estado. Ley Orgánica 3/2020, de 29 de Diciembre, Por La Que Se Modifica La Ley Orgánica 2/2006, de 3 de Mayo, de Educación; Boletín Oficial del Estado: Madrid, Spain, 2020; Volume BOE-A-2020-17264, pp. 122868–122953. Available online: https://www.boe.es/eli/es/lo/2020/12/29/3 (accessed on 23 February 2024).
  4. Johnson, R.B.; Christensen, L.B. Educational Research: Quantitative, Qualitative, and Mixed Approaches, 7th ed.; SAGE: Los Angeles, CA, USA, 2020; ISBN 978-1-5443-3783-8. [Google Scholar]
  5. McKenney, S.; Schunn, C.D. How Can Educational Research Support Practice at Scale? Attending to Educational Designer Needs. Br. Educ. Res. J. 2018, 44, 1084–1100. [Google Scholar] [CrossRef]
  6. Everton, T.; Galton, M.J.; Pell, T. Educational Research and the Teacher. Res. Pap. Educ. 2002, 17, 373–401. [Google Scholar] [CrossRef]
  7. Cain, T. Teachers’ Engagement with Published Research: Addressing the Knowledge Problem. Curr. J. 2015, 26, 488–509. [Google Scholar] [CrossRef]
  8. Winch, C.; Oancea, A.; Orchard, J. The Contribution of Educational Research to Teachers’ Professional Learning: Philosophical Understandings. Oxf. Rev. Educ. 2015, 41, 202–216. [Google Scholar] [CrossRef]
  9. Cohen, L.; Manion, L.; Morrison, K. Research Methods in Education, 8th ed.; Routledge: London, NY, USA, 2017; ISBN 978-1-315-45653-9. [Google Scholar] [CrossRef]
  10. Fraenkel, J.; Wallen, N.; Hyun, H. How to Design and Evaluate Research in Education; McGraw-Hill: New York, NY, USA, 2011; Volume 60, ISBN 978-0-07-809785-0. [Google Scholar]
  11. Patton, M.Q. Qualitative Research & Evaluation Methods: Integrating Theory and Practice, 4th ed.; SAGE Publications, Inc.: Thousand Oaks, CA, USA, 2015; ISBN 978-1-4129-7212-3. [Google Scholar]
  12. Guba, E.G.; Lincoln, Y.S. Paradigmatic Controversies, Contradictions, and Emerging Confluences. In The Sage Handbook of Qualitative Research, 3rd ed.; Sage Publications Ltd.: Thousand Oaks, CA, USA, 2005; pp. 191–215. ISBN 978-0-7619-2757-0. [Google Scholar]
  13. Tabachnick, B.G.; Fidell, L.S.; Ullman, J.B. Using Multivariate Statistic, 7th ed.; Pearson: New York, NY, USA, 2019; ISBN 978-0-13-479054-1. [Google Scholar]
  14. Erickson, F. Métodos Cualitativos de Investigación Sobre La Enseñanza. In La Investigación de la Enseñanza II. Métodos Cualitativos de Observación; Wittrock, M.C., Ed.; Coll. Paidós Educador; Paidós MEC: Barcelona, Spain, 1989; pp. 203–247. ISBN 84-7509-518-6. [Google Scholar]
  15. Eccles, J.S.; Wigfield, A. Motivational Beliefs, Values, and Goals. Annu. Rev. Psychol. 2002, 53, 109–132. [Google Scholar] [CrossRef]
  16. Fives, H.; Gill, M.G. International Handbook of Research on Teachers’ Beliefs, 1 ed.; Routledge: New York, NY, USA, 2014; ISBN 978-1-136-26583-9. [Google Scholar]
  17. Wishkoski, R.; Meter, D.J.; Tulane, S.; King, M.Q.; Butler, K.; Woodland, L.A. Student Attitudes toward Research in an Undergraduate Social Science Research Methods Course. High. Educ. Pedagog. 2022, 7, 20–36. [Google Scholar] [CrossRef]
  18. Byman, R.; Maaranen, K.; Kansanen, P. Consuming, Producing, and Justifying: Finnish Student Teachers’ Views of Research Methods. Int. J. Res. Method Educ. 2021, 44, 319–334. [Google Scholar] [CrossRef]
  19. Hidalgo, J.P.; Aldana, G.M.; León, P.; Ucedo, V.H. Escala de Actitudes Hacia La Investigación (EACIN-R): Propiedades Psicométricas En Universitarios Peruanos. Propósitos Y Represent. 2023, 11. [Google Scholar] [CrossRef]
  20. Howard, A.; Michael, P.G. Psychometric Properties and Factor Structure of the Attitudes Toward Research Scale in a Graduate Student Sample. Psychol. Learn. Teach. 2019, 18, 259–274. [Google Scholar] [CrossRef]
  21. Papanastasiou, E.C.; Schumacker, R. Attitudes Toward Research Scale--30 Item 2014. APA PsycTests. [CrossRef]
  22. Böttcher, F.; Thiel, F. Evaluating Research-Oriented Teaching: A New Instrument to Assess University Students’ Research Competences. High. Educ. 2018, 75, 91–110. [Google Scholar] [CrossRef]
  23. Böttcher-Oschmann, F.; Groß Ophoff, J.; Thiel, F. Preparing Teacher Training Students for Evidence-Based Practice Promoting Students’ Research Competencies in Research-Learning Projects. Front. Educ. 2021, 6, 642107. [Google Scholar] [CrossRef]
  24. Vilà Baños, R.; Rubio Hurtado, M.J. Actitudes Hacia La Estadística En El Alumnado Del Grado de Pedagogía de La Universidad de Barcelona. REDU Rev. Docencia Univ. 2016, 14, 131. [Google Scholar] [CrossRef]
  25. Ruiz De Miguel, C. Actitudes Hacia La Estadística de Los Alumnos Del Grado En Pedagogía, Educación Social, y Maestro de Educación Infantil y Maestro de Educación Primaria de La UCM. Educ. XX1 2015, 18, 351–374. [Google Scholar] [CrossRef]
  26. Rosenberg, M.J.; Hovland, C.I. Cognitive, Affective and Behavioral Components of Attitudes. In Attitude Organization and Change: An Analysis of Consistency among Attitude Components; Yale studies in attitude and communication; Yale University Press: New Haven, CT, USA, 1960; Volume 3. [Google Scholar]
  27. Auzmendi, E. Las Actitudes Hacia la Matemática-Estadística en Las Enseñanzas Medias y Universitaria: Características y Medición; Recursos e Instrumentos Psico-Pedagógicos; Mensajero: Bilbao, Spain, 1992; ISBN 978-84-271-1768-6. [Google Scholar]
  28. Gil Flores, J. Actitudes hacia la estadística. Incidencia de las variables sexo y formación previa. Rev. Esp. Pedagog. 1999, 57, 567–589. [Google Scholar] [CrossRef]
  29. Rodríguez-Santero, J.; Gil-Flores, J. Actitudes Hacia La Estadística En Estudiantes de Ciencias de La Educación. Propiedades Psicométicas de La Versión Española Del Survey of Attitudes Toward Statistics (SATS-36). RELIEVE-Rev. Electrónica Investig. Eval. Educ. 2019, 25. [Google Scholar] [CrossRef]
  30. Roberts, D.M.; Bilderback, E.W. Reliability and Validity of a Statistics Attitude Survey. Educ. Psychol. Meas. 1980, 40, 235–238. [Google Scholar] [CrossRef]
  31. Wise, S.L. The Development and Validation of a Scale Measuring Attitudes toward Statistics. Educ. Psychol. Meas. 1985, 45, 401–405. [Google Scholar] [CrossRef]
  32. Schau, C.; Stevens, J.; Dauphinee, T.L.; Vecchio, A.D. The Development and Validation of the Survey of Antitudes toward Statistics. Educ. Psychol. Meas. 1995, 55, 868–875. [Google Scholar] [CrossRef]
  33. Darias-Morales, E.J. Escala de Actitudes Hacia La Estadística. Psicothema 2000, 12, 175–178. [Google Scholar]
  34. Méndez, D.; Macía, F. Análisis factorial confirmatorio de la escala de actitudes hacia la estadística. Cuad. Neuropsicol. 2007, 1, 337–345. [Google Scholar]
  35. Matas, A. Diseño Del Formato de Escalas Tipo Likert: Un Estado de La Cuestión. Rev. Electrónica Investig. Educ. 2018, 20, 38–47. [Google Scholar] [CrossRef]
  36. Hill, A.; Pelis, M.; Puncochar, V. Reasoning by Analogy in Inductive Logic. In The Logica Yearbook 2011; Pelis, M., Puncochar, V., Eds.; College Publications: Oxfordshire, UK, 2012; pp. 63–76. [Google Scholar]
  37. Fisher, A.A. Inductive Reasoning in the Context of Discovery: Analogy as an Experimental Stratagem in the History and Philosophy of Science. Stud. Hist. Philos. Sci. Part A 2018, 69, 23–33. [Google Scholar] [CrossRef]
  38. Curado, M.A.S.; Teles, J.; Marôco, J. Analysis of Variables That Are Not Directly Observable: Influence on Decision-Making during the Research Process. Rev. Esc. Enferm. USP 2014, 48, 146–152. [Google Scholar] [CrossRef] [PubMed]
  39. Dima, A.L. Scale Validation in Applied Health Research: Tutorial for a 6-Step R-Based Psychometrics Protocol. Health Psychol. Behav. Med. 2018, 6, 136–161. [Google Scholar] [CrossRef] [PubMed]
  40. Pallant, J. SPSS Survival Manual: A Step by Step Guide to Data Analysis Using SPSS, 4th ed.; Open University Press: Maidenhead, UK, 2010; ISBN 978-0-335-24239-9. [Google Scholar]
  41. Carretero-Dios, H.; Pérez, C. Normas Para El Desarrollo y Revisión de Estudios Instrumentales: Consideraciones Sobre La Selección de Tests En La Investigación Psicológica. Int. J. Clin. Health Psychol. 2007, 7, 863–882. [Google Scholar]
  42. Hair, J.F.; Black, W.C.; Babin, B.J.; Anderson, R.E. Multivariate Data Analysis, 7th ed.; Pearson Prentice Hall: Upper Saddle River, NJ, USA, 2010; ISBN 978-0-13-813263-7. [Google Scholar]
  43. Stevens, J. Applied Multivariate Statistics for the Social Sciences, 3rd ed.; Lawrence Erlbaum Associates: Mahwah, NJ, USA, 1996; ISBN 978-0-8058-1670-9. [Google Scholar]
  44. Lorenzo-Seva, U.; Ferrando, P.J. FACTOR: A Computer Program to Fit the Exploratory Factor Analysis Model. Behav. Res. Methods 2006, 38, 88–91. [Google Scholar] [CrossRef] [PubMed]
  45. Brown, T.A. Confirmatory Factor Analysis for Applied Research; Confirmatory Factor Analysis for Applied Research; The Guilford Press: New York, NY, USA, 2006; ISBN 978-1-59385-274-0. [Google Scholar]
  46. Cho, G.; Hwang, H.; Sarstedt, M.; Ringle, C.M. Cutoff Criteria for Overall Model Fit Indexes in Generalized Structured Component Analysis. J. Mark. Anal. 2020, 8, 189–202. [Google Scholar] [CrossRef]
  47. Hu, L.; Bentler, P.M. Cutoff Criteria for Fit Indexes in Covariance Structure Analysis: Conventional Criteria versus New Alternatives. Struct. Equ. Model. Multidiscip. J. 1999, 6, 1–55. [Google Scholar] [CrossRef]
  48. Akaike, H. Information Theory and the Maximum Likelihood Principle. In Information Theory: Proceedings of the 2nd International Symposium; Petrov, B.N., Csäki, F., Eds.; Akademiai Ki à do: Budapest, Hungary, 1973. [Google Scholar]
  49. R Core Team. R: A Language and Environment for Statistical Computing; R Foundation for Statistical Computing: Vienna, Austria, 2018. [Google Scholar]
  50. The Jamovi Project. Jamovi (version 2.3). 2022. Available online: https://www.jamovi.org (accessed on 20 March 2024).
  51. Jain, V. 3D Model of Attitude. Int. J. Adv. Res. Manag. Soc. Sci. 2014, 3, 1–12. [Google Scholar]
  52. George, D.; Mallery, P. SPSS for Windows Step-by-Step: A Simple Guide and Reference, 14.0 Updat, 7th ed.; Pearson Education: Boston, MA, USA, 2003; ISBN 0-205-51585-1. [Google Scholar]
  53. Barbero García, M.I.; Holgado Trello, F.P.; Vila Abad, E. Psicometría; Sanz y Torres SL: Madrid, Spain, 2015; ISBN 978-84-15550-89-1. [Google Scholar]
  54. Sarabia Liaño, A. Inés Gómez Chacón (2000). Matemática Emocional. Los Afectos En El Aprendizaje Matemático. Madrid: Narcea, 276 pp. Estud. Sobre Educ. 2018, 3, 158. [Google Scholar] [CrossRef]
  55. Renaud, R.D. Attitudes and Dispositions. In International Guide to Student Achievement; Hattie, J., Anderman, E.M., Eds.; Routledge: New York, NY, USA, 2013; pp. 57–59. ISBN 978-0-415-87898-2. [Google Scholar]
  56. Angie, A.D.; Connelly, S.; Waples, E.P.; Kligyte, V. The Influence of Discrete Emotions on Judgement and Decision-Making: A Meta-Analytic Review. Cogn. Emot. 2011, 25, 1393–1422. [Google Scholar] [CrossRef] [PubMed]
  57. Bandyopadhyay, D.; Pammi, V.S.C.; Srinivasan, N. Role of Affect in Decision Making. In Progress in Brain Research; Elsevier: Amsterdam, The Netherlands, 2013; Volume 202, pp. 37–53. ISBN 978-0-444-62604-2. [Google Scholar]
  58. Lerner, J.S.; Li, Y.; Valdesolo, P.; Kassam, K.S. Emotion and Decision Making. Annu. Rev. Psychol. 2015, 66, 799–823. [Google Scholar] [CrossRef] [PubMed]
Figure 1. Confirmatory model of the ATRMQ.
Education 14 00374 g001
Table 1. Factor Loadings.
Factor
Emotion−Emotion+UtilityUniqueness
20. I’m afraid of research methods.0.74079
15. Research methods are complicated subjects.0.73455 0.548
10. Working with research methods makes me feel very nervous.0.70037 0.403
8. When I face a research methods problem, I feel incapable of thinking clearly.0.67867 0.455
18. I feel frustrated when doing research methods tests.0.66143 0.476
13. I feel insecure when working on research methods problems.0.64978 0.546
5. I’m not very good at research methods subjects.0.47494 0.497
11. I don’t get upset when I have to work on research methods problems. 0.793
6. Using research methods is fun for me. 0.8558
7. I enjoy discussing research methods with others. 0.8314
9. Research methods are enjoyable and stimulating for me. 0.8072
12. I would like to have an occupation that requires the use of research methods. 0.5514 0.585
14. Statistics are useless. 0.64920.509
17. Research methods are not useful for the common professional. 0.56590.687
19. I will not use research methods in my profession. 0.52180.485
16. Research methods are a requirement in my professional training. 0.47150.615
Explained Variance22.6%17.3%10.8%50.7%
Note. The “maximum likelihood” extraction method was used in combination with an “oblimin” rotation.
Table 2. Fit indices of the confirmatory models.
ModelX2/df.CFILTISRMRRMSEAAICBIC
[A] ATRMQ with item 11 (original ATSQ).1.8010.9390.9270.0600.06772377399
[B] ATRMQ without 11.1.7930.9440.9330.0580.06667346887
[C] ATRMQ without 11—second order.1.7940.9440.9330.0580.06767346887
Table 3. Scale reliability.
CoefficientEmotion−Emotion+UtilityAttitude
Cronbach’s alpha 0.8860.8620.7520.897
McDonald’s omega 0.8770.8640.7540.898
Table 4. Scale reliability.
ItemsCriterionEmotion−Emotion+UtilityAttitude
I1. Research methods are useless.Utility0.3830.3750.6250.507
I2. Research methods help make more informed decisions.Decision-making0.5310.4610.5130.584
Disclaimer/Publisher’s Note: The statements, opinions and data contained in all publications are solely those of the individual author(s) and contributor(s) and not of MDPI and/or the editor(s). MDPI and/or the editor(s) disclaim responsibility for any injury to people or property resulting from any ideas, methods, instructions or products referred to in the content.

