Article

Analyzing the Associations between Facets of Physical Literacy, Physical Fitness, and Physical Activity Levels: Gender- and Age-Specific Cross-Sectional Study in Preadolescent Children

1
Faculty of Kinesiology, University of Split, 21000 Split, Croatia
2
Faculty of Kinesiology, University of Zagreb, 10000 Zagreb, Croatia
3
Faculty for Sport and Physical Education, University of Montenegro, 81400 Niksic, Montenegro
4
Faculty of Kinesiology, University of Osijek, 31000 Osijek, Croatia
5
Faculty of Sport and Physical Education, University of Novi Sad, 21000 Novi Sad, Serbia
*
Author to whom correspondence should be addressed.
Educ. Sci. 2024, 14(4), 391; https://doi.org/10.3390/educsci14040391
Submission received: 11 February 2024 / Revised: 2 April 2024 / Accepted: 3 April 2024 / Published: 9 April 2024

Abstract

:
Physical literacy (PL) is theorized to be an important determinant of physical fitness (PF) and physical activity levels (PALs), but studies have rarely examined possible correlations between PL, PF, and PAL in preadolescent children. This study aimed to evaluate age-specific and gender-specific correlations between the affective and cognitive domains of PL (PLAC), PF, and PAL in preadolescents. Additionally, the test–retest reliability of the applied PF tests was examined. The participants were 107 children (9 to 11 years of age; 53 girls). Apart from gender and school age (third graders, fourth graders), the variables included PLAC, PAL, and PF. PF was evaluated by anthropometrics and body composition indices, sit-ups, push-ups, PACER tests, torso lifts, and broad jump. PLAC was evaluated using the PLAYself questionnaire, and the PAQ-C was used to evaluate PAL. The test–retest reliability of the PF tests was appropriate to high (ICC: 0.65–0.91). Analyses showed nonsignificant associations between PLAC and PAL in both genders and age groups. PAL was significantly correlated with PL in girls (low correlation) and fourth graders (moderate correlation). The nonsignificant associations between PLAC and PF could be a consequence of the influence of biological maturity on PF in this age group. The correlation between PAL and PLAC can be explained by the differences in physical activity habits between genders and age groups, with participation in structured physical activities (organized sports and physical education) being the most important source of PAL in girls and older children.

1. Introduction

Physical fitness (PF) is a state of health and well-being and, more specifically, the ability to perform aspects of sports, occupations, and daily activities [1]. A good PF in childhood and adolescence is the basis for a healthy lifestyle and an important indicator of the current and future health status, because high levels of PF during childhood and adolescence have a positive effect on the health in adulthood [2,3].
It is well-known that maintaining satisfactory PF in children and adolescents reduces the risks of obesity, cardiovascular diseases, and diabetes in adulthood [4,5]. Furthermore, the results of research on mental health indicate a positive connection between PF and overall mental health in children and young people [6]. Finally, studies have confirmed the positive association between PF, quality of life, and the health of children and adolescents, in addition to a strong body of evidence demonstrating a positive relationship between PF and academic success [7,8].
Physical activity (PA) is considered a crucial factor in achieving good PF. There is strong evidence that PA has multiple benefits for children and adolescents, such as improving physical and mental health; sleep quality; brain development; bone health; and social, psychological, and cognitive health [9]. Furthermore, PA is recognized as an important factor in the prevention of excess body weight and obesity in children and in slowing the development of obesity in adulthood [10]. During childhood, adequate levels of PA are a fundamental prerequisite for developing basic cognitive, motor, and social skills, as well as musculoskeletal, cardiovascular, and metabolic health [11]. Unfortunately, most of the young population is not physically active, i.e., 81% of children and adolescents do not have a sufficient level of PA [12], and studies that state that children and adolescents have an insufficient level of PF emphasize that the reason is mainly insufficient PA [12,13,14].
Previous studies have investigated the influence of PA on PF [15,16]. In general, an increase in PA is considered to lead to an improvement in PF [14,17,18]. However, some studies indicate that increasing PA alone is insufficient for children [19]. The reason for this is that the risk of cardiovascular diseases in the future is determined by the level of PF [20], so the emphasis should be on promoting physical activity that will directly increase the level of PF [21]. Recently, in this sense, there has been an increasingly visible interest in the issue of “physical literacy”.
Physical literacy (PL) is defined as “the motivation, confidence, physical competence, knowledge, and understanding to value and take responsibility for engagement in physical activities for life” [22]. The domains of PL (i.e., physical competence, motivation and self-confidence, and knowledge) are inter-related and are crucial for supporting participation in PA while growing up and in adulthood [23]. The concept of PL is seen as a way of encouraging and maintaining lifelong engagement in PA. Indeed, PL is a holistic concept and consists of numerous domains including PA behavior, physical competence, motivation, confidence, knowledge, and understanding, which emphasize the affective, physical, and cognitive predispositions necessary to take part in PA throughout the life course [24,25]. The affective domain, which is potentially the most important for lifelong participation in PA, includes confidence, motivation, enjoyment, commitment, autonomy, self-esteem, and perceived physical competence [25].
Different concepts of PL and tools for assessing PL levels have been developed worldwide, and there is no consensus on which is the most appropriate [26,27]. Among the most popular and commonly used tools for assessing PL in the research are the Canadian Assessment of Physical Literacy (CAPL) and the Physical Literacy Assessment of Youth (PLAY) [27,28]. Attributes of physical competence in the multidimensional concept of PL have a close link with individual domains of PF and, as constructs, are connected through common basic components [29]. It is, therefore, not surprising that researchers have addressed the relationship between the affective and cognitive domains of PL (PLAC) and PF measures. For example, Canadian studies performed with children aged 8 to 12 and 9 to 11 years have reported a positive association between cardiorespiratory fitness (aerobic fitness) and PLAC [29,30]. This is supported by a very recent French study with children aged 11 and 12, where the authors reported that PLAC was positively related to the percentage of muscle mass and negatively related to the percentage of body fat [31].
From the previous literature overview, it is clear that the affective and cognitive domains of PL may be related to the overall fitness status of children. However, it seems that studies have rarely examined various indices of PF in relation to PLAC in preadolescent children, and those that did were mostly focused on cardiovascular fitness [29,30,31]. Also, it seems that studies on the relationships between PF and PL performed so far have observed different age groups at the same time [29,30,31], which may have introduced bias. Specifically, previous investigations have highlighted that children evaluate their PL based on comparison with their similarly aged peers [32]. This means that different age groups should be observed as stratified samples, at least in situations when PL is intended to be correlated with objectively measured PF. Therefore, this study aimed to evaluate the age-stratified and gender-stratified associations between PLAC, PAL, and various indices of PF in preadolescent children (9 to 11 years of age). Additionally, we examined the test–retest reliability of the PF tests in the studied preadolescent children. Initially, we had two study hypotheses: (i) PL will be positively associated with PF, and (ii) facets of PL will be positively associated with PAL in preadolescents.

2. Materials and Methods

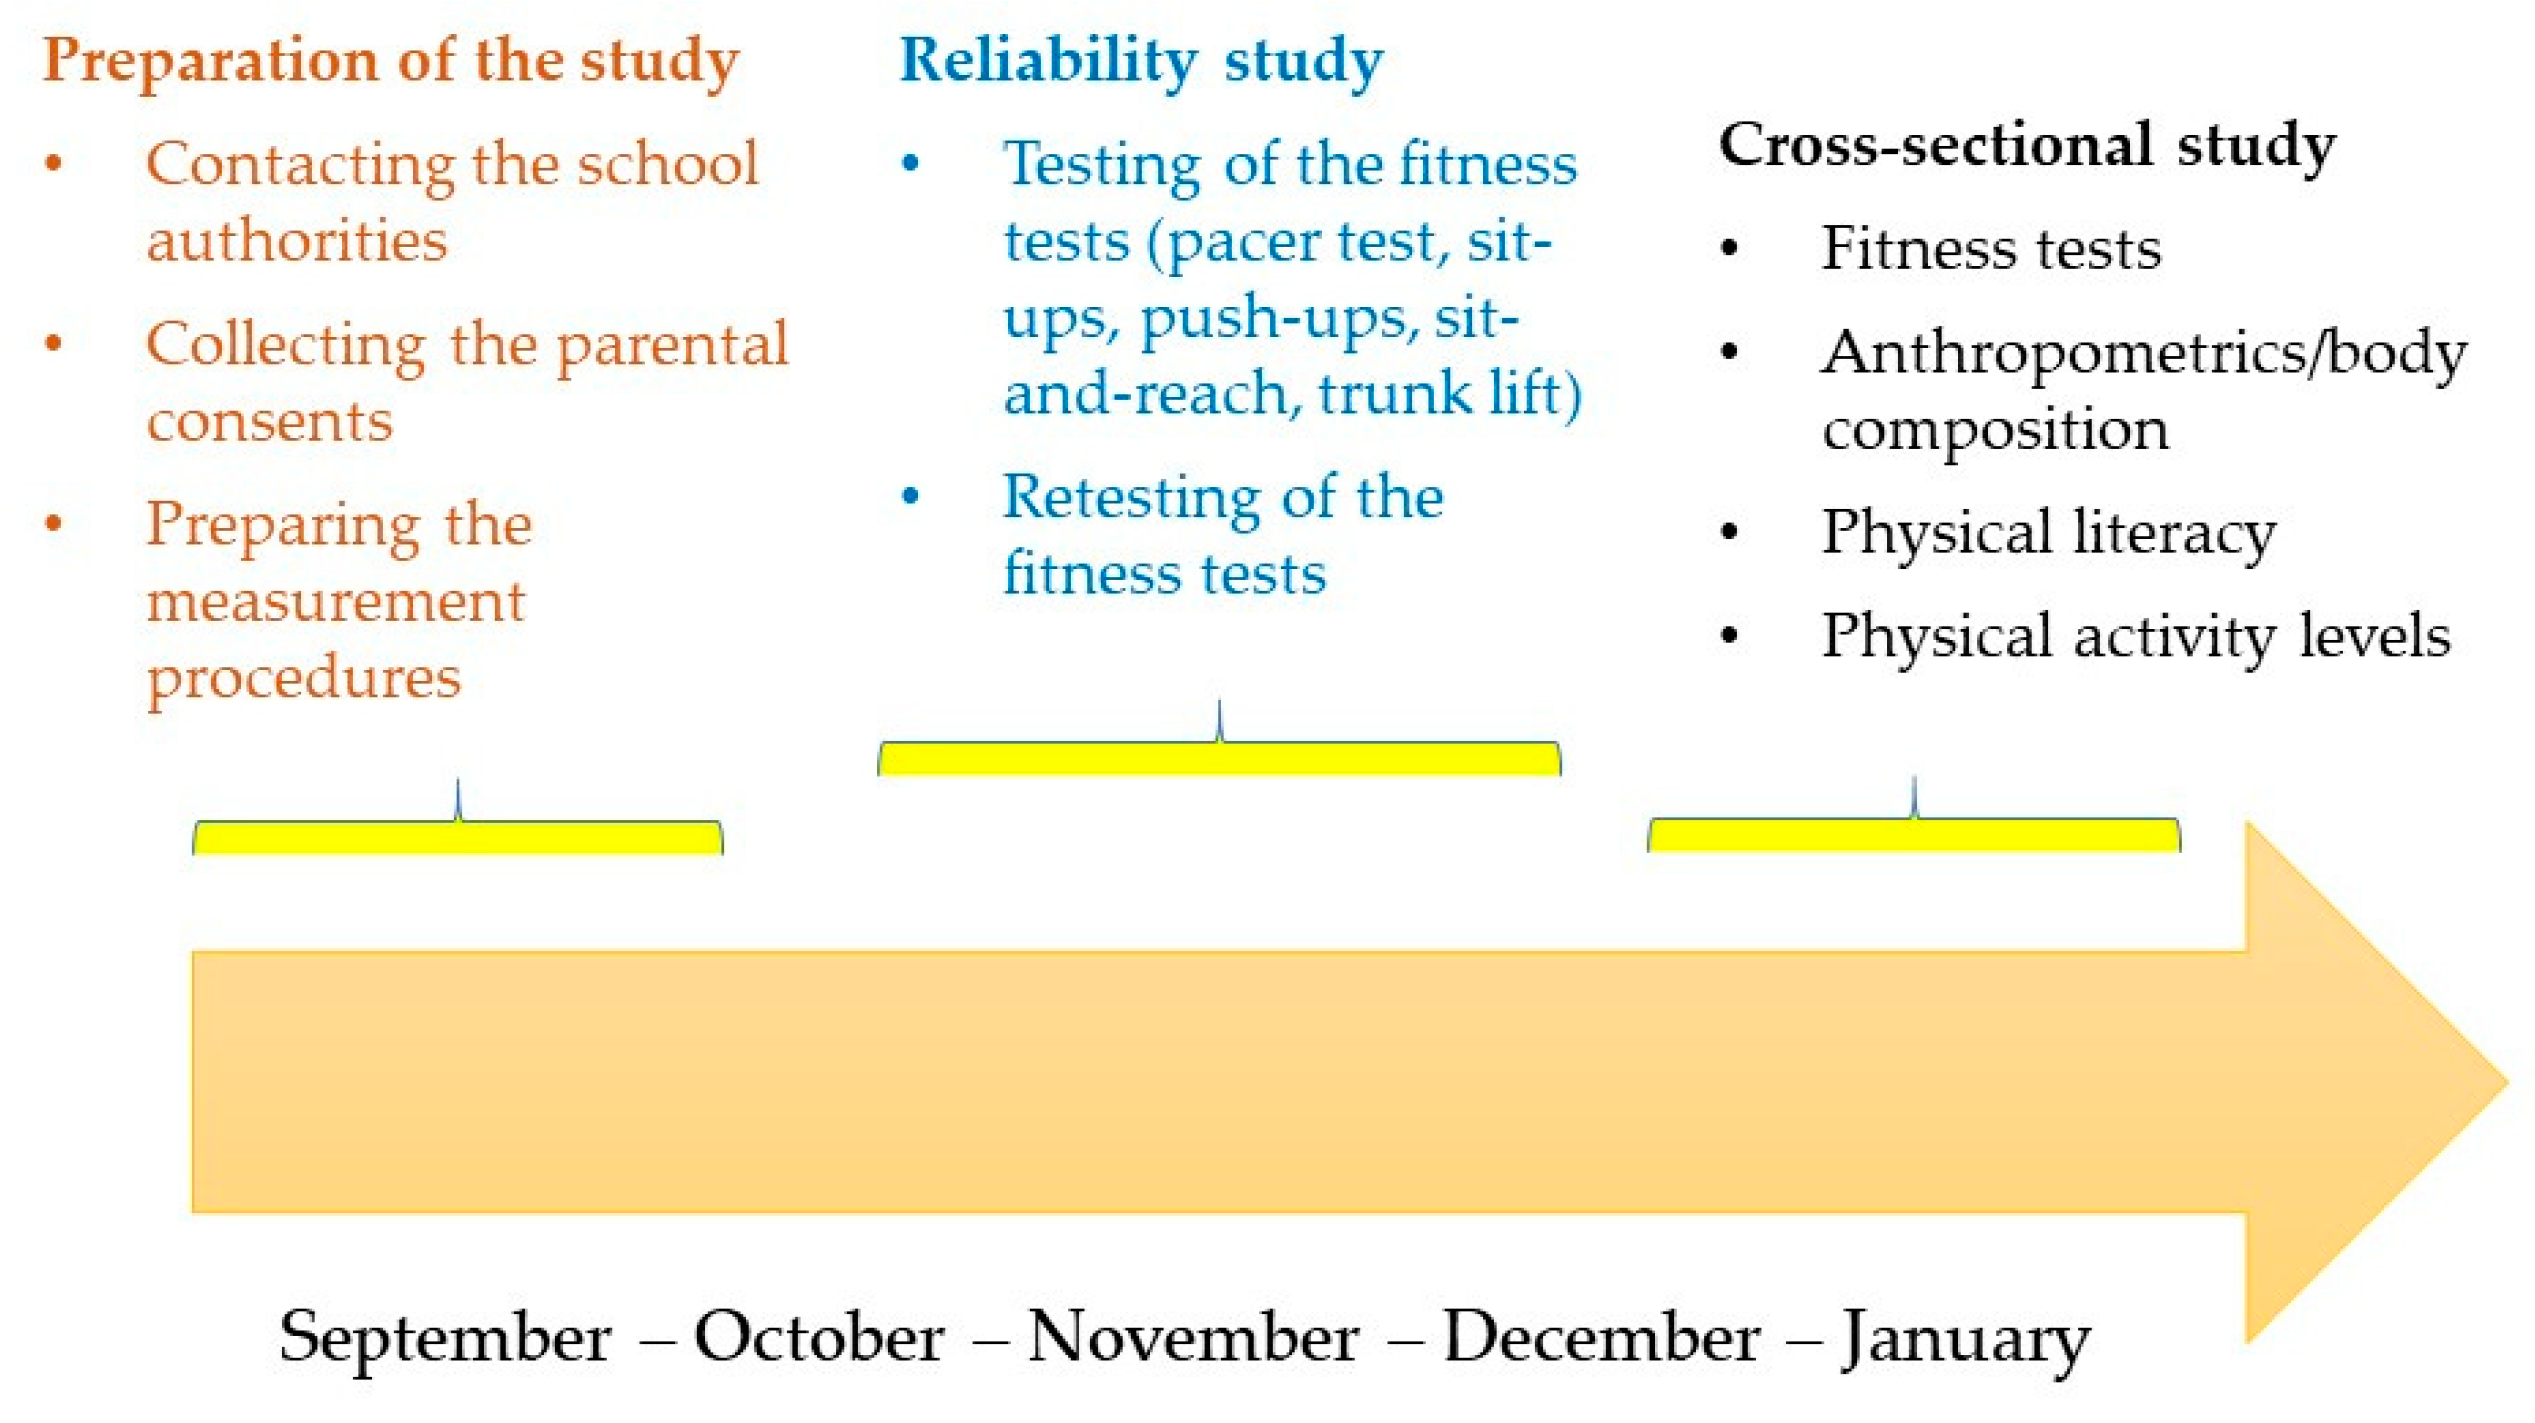
2.1. Participants and Study Design

The participants in this study were 107 preadolescent children (53 girls) from Croatia. When conducting the research, all participants were between the ages of 9 and 11, attended the 3rd (n = 52) or 4th grade (n = 55) of elementary school, were in good health, and regularly attended physical education (PE) classes. Children who were ill or had a locomotor injury during the two weeks prior to the test did not participate in this study. Prior to this study, the parents/guardians were informed by the research team about the goals and procedures of this research, and they signed informed consent for the children’s participation. For the reliability study, a subsample of 21 randomly selected children was tested across a test and retest trial, within the time frame of 7–10 days. The number of participants tested in the reliability study ensured we gained a sufficient number of observations in order to achieve a normal distribution of results, while, at the same time, allowing for similar testing conditions in relatively short time period, which was crucial for the stability of testing.
The research was approved by the Ethics Committee of the Faculty of Kinesiology, University of Split. The study design is presented in Figure 1.

2.2. Variables and Procedures

In addition to the school grade (3rd or 4th), gender (male or female), and age (years), we also observed anthropometric and body composition indices, PL, PF (including anthropometric/body composition indices), and PAL. Body composition and anthropometrics were evaluated by a highly skilled technician with long-term experience in testing. Fitness tests were carried out by physical education teachers, where one examiner tested all children at once. Altogether five examiners tested all children. All evaluators were experienced and specifically instructed in performing the tests before this study. Furthermore, the PF tests were well-known to all evaluators (please see later for details) because they are regularly used in schools in Croatia.
The PLAC was evaluated by the PLAYself questionnaire, a part of the PLAY tools (PLAYfun, PLAYbasic, PLAYself, PLAYparent, PLAYcoach, and PLAYinventory) [33]. This questionnaire is used by children and adolescents for self-assessment of their PLAC level and has four subdomains: (i) Environment, which assesses the degree of confidence of movement in different environments (e.g., activities in the gym, in and on water, and on snow and ice). (ii) Self-report of PL, which assesses a number of affective and cognitive segments (e.g., motivation, confidence, and self-esteem) related to PL that determine an individual’s self-efficacy and ability to participate in PA, including questions such as “It does not take me long to learn new skills, sports or activities”, “I think that being active is important for my physical and mental health”, “I think that exercise makes me happier”, and “I understand the words used by trainers and PE teachers”. (iii) The relative ranking of literacy with its subdomains of Literacy, Numeracy, and Physical Literacy assesses literacy in different environments (e.g., school, home, and friends) and assesses how much an individual values each of the mentioned literacies. (iv) The state of fitness (fitness) is determined by the question, “My state of fitness is good enough to allow me to participate in all the activities I choose”. However, this subdomain is not included in the final score of PLAYself. The final result of the questionnaire consists of the sum of points from the first three subdomains divided by the number of questions (27 in total). The maximum number of PLAYself points is 100, which represents a high self-concept of PLAC. The Croatian version of the PLAYself questionnaire has recently proved to be feasible and reliable in Croatian children aged 9 to 11 [32].
The level of PA was assessed using the “Physical Activity Questionnaire for Older Children” (PAQ-C) [34]. The PAQ-C-Croatian version of the questionnaire for assessing the level of physical activity was constructed for children of a similar age to those sampled (from 8 to 14 years) to quantitatively assess the overall level of physical activity [35]. The questionnaire consists of 9 questions that are evaluated on a 5-point scale, for example, “In the last 7 days, what did you mostly do during a long break (except eating a snack)?” and “Indicate how often you were engaged in some physical activity (e.g., sports, games, dancing or any other physical activity) every day of the last week.” The total physical activity score is predicted based on the mean of the answers given. A score of 5 is the maximum value of the PAQ-C and represents high activity, while a score of 1 represents very low or no activity. For the testing of the PAL and PLAC, an online testing platform was used, and children were tested in school classroom in small groups. One of the examiners was available if the children needed help during the test, but the examiner was positioned behind the computer screen and could not see the answers. Testing was carried out in small groups, of up to 10 children, and the children could not see the other participants’ answers.
The PF was evaluated by tests included in the FitnessGram battery [36]. The battery includes tests to assess aerobic endurance, abdominal muscular strength and endurance, torso extensor strength and flexibility, upper body strength and endurance, flexibility, body height, body mass, and body composition. Additionally, we included a broad jump test because this procedure is regularly used in Croatian PE.
Body height (BH) was measured with an altimeter. The measurement is performed with the participant standing barefoot on a flat and firm surface in an upright position. The position of the participant’s head fulfills the requirement of the Frankfurt horizontal, looking straight ahead. The result is measured in centimeters, with an accuracy of 0.1 cm. Body mass (BM) was measured with a digital diagnostic scale (Tanita BC 418 scale; serial number 15010067, 2015). The measurement is performed with the participant standing barefoot and upright on the scale, wearing a sports shirt and shorts. The result is expressed in kilograms with an accuracy of 0.1 kilograms. The scale also measures body composition using the bioimpedance method (Tanita BC 418 scale; serial number 15010067, 2015), and, in this research, we assessed body fat percentage and muscle mass percentage.
The 15 m PACER test was used to assess aerobic endurance. The test consists of 21 or more levels of 7 or more intervals of running segments of 15 m. Students run from one end to the other of a segment marked with cones and must touch the line when the buzzer sounds. At the sound of the beep, they turn and run back to the other end. Participants continue to do this until they reach the line before two beeps. The goal is to cross as many levels as possible, and the result is expressed numerically in levels. Additionally, we calculated VO2 max/kg using the Leger et al. equation: VO2 max/kg = 31.025 + 3.238 (running speed in km/h) − 3.248 (age in years) + 0.1536 (running speed × age) [36,37].
The curl-up test was used to assess abdominal muscular strength and endurance. The test is performed by having the participant lift the torso as many times as possible, up to a maximum of 75. The result is the maximum number of correctly performed torso lifts.
The torso lift test assessed torso extensor strength and flexibility. On cue, the participant independently raises the cervical and thoracic parts of the spine in a controlled manner to their maximum, with the head in a neutral position in line with the spine.
The push-up test was used to assess upper body strength and endurance. The test is performed so the participant takes a pronated position on the mat with the palms under the shoulders, fingers extended, legs extended and parallel, and feet slightly apart, resting on the toes. The participant pushes off the mat with their hands until their arms are extended, keeping their legs and back straight. The participant then lowers their body using their arms until their elbows are bent at 90 degrees and their upper arms are parallel to the floor. The result is the maximum number of correctly performed push-ups [36,38].
The sit-and-reach test was used to obtain the flexibility for the lower back and hamstring muscles. The participant sits on the floor with their legs extended straight ahead, feet shoulder-width apart, and positioned against the box or measuring device. With their palms down and fingers pointing forward, the individual reaches forward along the measuring device as far as possible, holding the position for at least two seconds. Three trials are performed and the average score is used as a final result.
The standing long jump assessed the jumping performance/power capacity. The test is performed so the participant stands behind the starting mark and jumps from the place with bare feet as far as they can. A standardized measurement mat was used (ELAN, Begunje, Slovenia). The result was measured in centimeters, as a best of three attempts [39].

2.3. Statistics

In the first phase, all variables were checked for normality by the Kolmogorov–Smirnov test (Supplementary Table S1). For normally distributed variables, means and standard deviations were reported, while counts and percentages were reported for categorical and ordinal variables (i.e., gender, age).
To identify the reliability of the fitness tests, intraclass correlation coefficients (ICCs) were calculated for multiple trial tests (e.g., torso lift, standing long jump, sit-and-reach), while test–retest correlation was calculated for single-trial tests (sit-ups, push-ups, PACER test). To identify potential measurement bias, analysis of variance (ANOVA) was calculated among trials for multiple-trial tests (with the consecutive Scheffe post hoc test), while a t-test for dependent samples was calculated for single-trial tests.
Two-way factorial analysis of variance (2-way ANOVA) with “Group” (3rd vs. 4th class) and “Gender” as the main effects and “Group x Gender” as the interaction effect was performed to evaluate the differences in the study variables.
The associations between study variables were evaluated by Pearson’s correlations (Pearson’s R) calculated for the total sample, gender-stratified sample, and age-stratified sample. Numerical values of correlation coefficients were translated into magnitude-based descriptors, as previously suggested (very low correlation (0.00–0.20), low correlation (0.21–0.40), moderate correlation (0.41–0.60), high correlation (0.61–0.80), and very high correlation (0.81–1.00)) [40].
Statistica ver. 14.0 (Tibco Inc., Palo Alto, CA, USA) was used for all calculations, and a statistical significance of p < 0.05 was applied.

3. Results

The results of the reliability analyses for multiple-trial tests are shown in Table 1. The highest reliability was obtained for the broad jump test, followed by the sit-and-reach test and the torso lift test.
ANOVA revealed differences among the testing trials for the broad jump (F-test = 14.11, p < 0.01). In general, the test results improved across trials (Trial 1: 127.17 ± 18.9, Trial 2: 131.16 ± 20.97, Trial 3: 134.19 ± 20.47 cm) but significant post hoc differences (p < 0.05) were detected only between the first and remaining two trials, indicating stabilization of the results until the third trial. Similarly, significant ANOVA differences among testing trials were found for trunk lift (F-test = 6.36, p < 0.01), with significant (p < 0.05) post hoc differences when the results of the first and second trials were compared to those of the third trial. Finally, the ANOVA effect was significant for the sit-and-reach test (F = 15.11, p < 0.01), as was the difference between the first and remaining two trials. Therefore, the reliability and stability of the measurements were evidenced for all multiple-trial fitness tests.
Figure 2 presents the test–retest correlations for the push-up (Figure 2A), sit-up (Figure 2B), and PACER tests (Figure 2C).
The test and retest results for all three tests were significantly correlated, with 64% common variance in the PACER test, 66% in the sit-up test, and 57% in the push-up test. A dependent-samples t-test revealed no significant differences between the test and retest results for any of the single-item tests, altogether indicating the reliability of the single-trial fitness tests (t test =1.47, 0.91, and 0.90 for sit-ups, push-ups, and the PACER test, respectively; all p > 0.05).
Descriptive statistics and the results of the Kolmogorov–Smirnov tests for the total sample are presented in Supplementary Table S1. The results of the two-way ANOVA are presented in Table 2. Significant main effects for gender were evidenced for the torso lift, sit-and-reach, PACER, and push-ups. Significant interaction effects were found for the body mass, body mass index, fat mass, and muscle mass.
The descriptive statistics for specific subgroups and post hoc differences are presented in Table 3. Boys achieved better results than girls in the PACER test (in third grade) and push-ups (in third and fourth grades). Girls were better than boys in the torso lift and sit-and-reach test in both grades. In third grade, boys were heavier and had more fat mass than girls, but the figures were the opposite in fourth grade.
Correlations between study variables for the total sample are presented in Supplementary Table S2.
Age-stratified correlations with numerical values of Pearson’s correlation coefficients and corresponding 95% CI between study variables are presented in Supplementary Table S3, while Figure 3 presents the magnitudes of correlations for the two observed age groups.
In addition to the logical correlations between anthropometric indices (i.e., fat mass was highly correlated with BMI, body mass was highly correlated with BMI, fat mass was moderately correlated with body mass, and muscle mass was highly negatively correlated with fat mass), several important correlations were also found. In third graders, the PACER test (aerobic endurance) had a low negative correlation with the body mass, BMI, and body fat, and a low positive correlation with the broad jump. Push-ups were moderately positively correlated with the broad jump (in fourth graders), while same variables had low correlations in third graders.
In third graders, PLAC was moderately negatively correlated with the body mass and body height, and it was moderately correlated with PAL in fourth graders.
Numerical values of the gender-stratified correlations between study variables are presented in Supplementary Table S4, while the magnitudes of correlations are shown in Figure 4. This time, apart from logical correlations between different anthropometric indices in both genders (i.e., high positive correlations between BMI and body mass, and between fat mass and body mass), other correlations were generally very low to low in magnitude. Push-ups were moderately positively correlated with the broad jump among boys, and the PL and PAL had a low positive correlation in girls.

4. Discussion

This study evaluated the associations between PF, PLAC, and PAL in preadolescent children. With regard to the main study aims, there were two important findings. First, the PF was not correlated with PAL in any of the study groups. Second, PAL was significantly correlated with PLAC in girls (mixed ages) and in fourth graders (mixed genders). Therefore, our first hypothesis must be rejected, while the second one can be partially accepted. Before discussing the main findings of this study, we will provide an overview of the reliability of the applied PF tests.

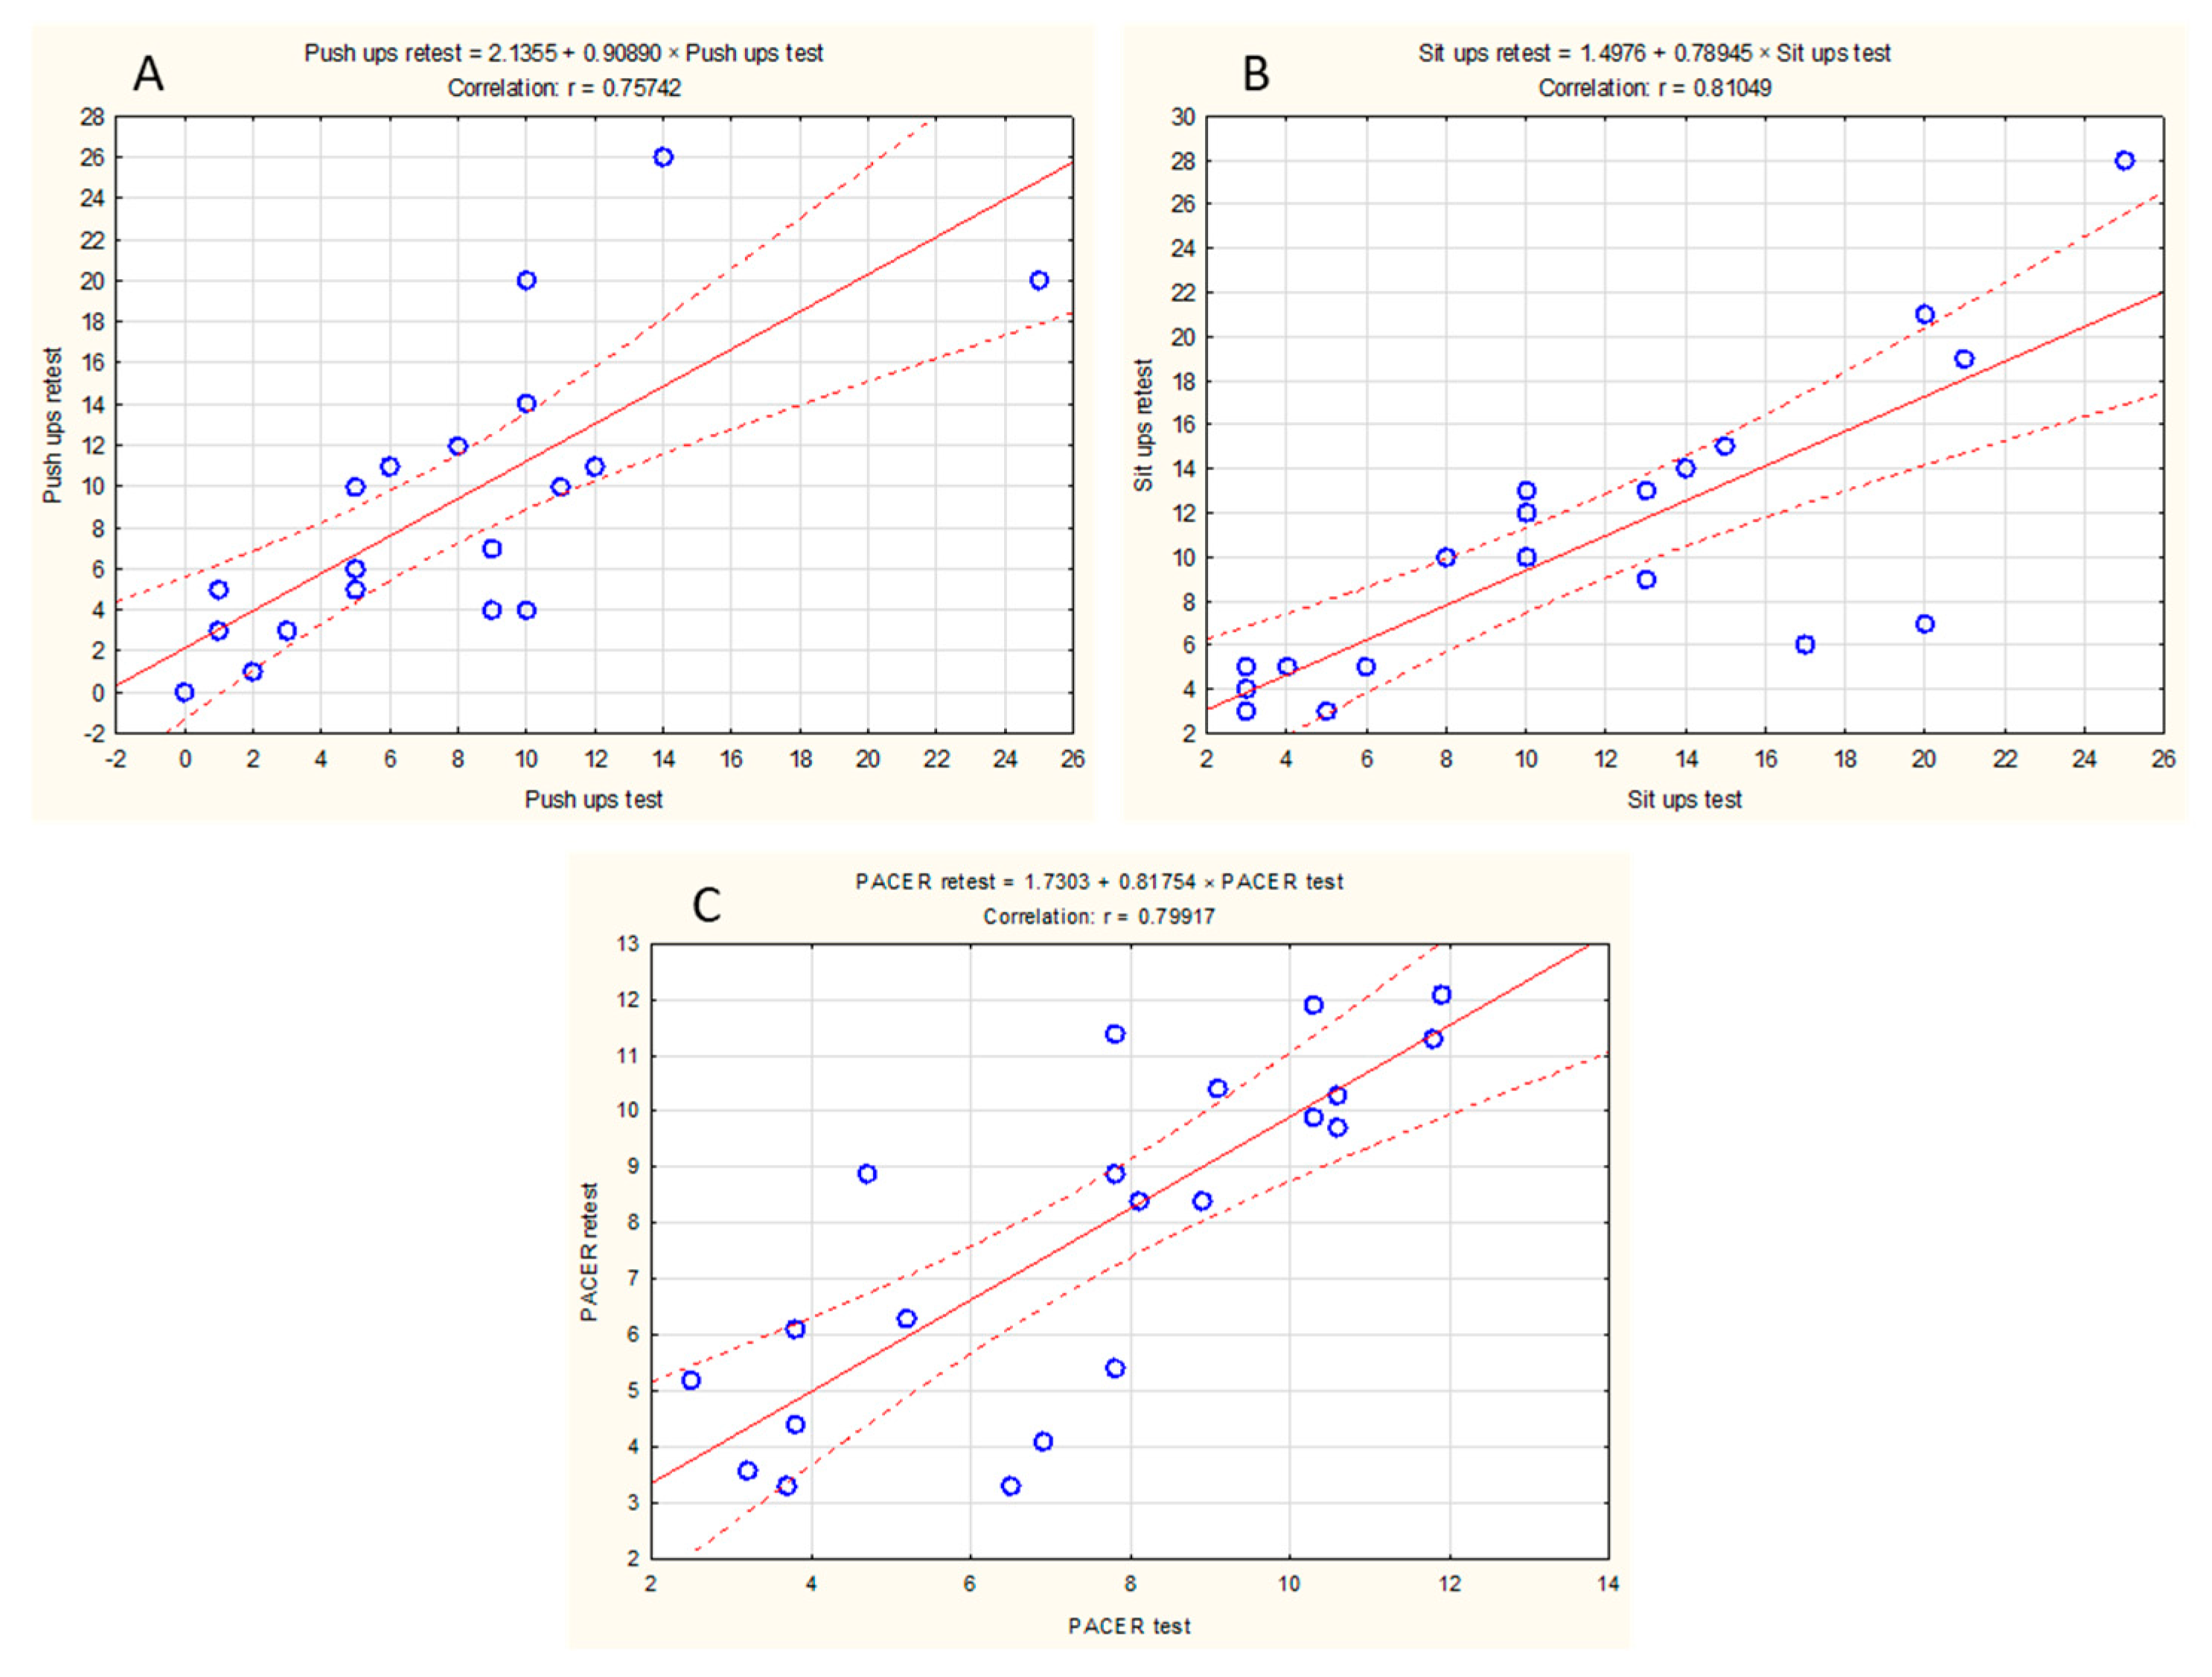
4.1. Reliability of the Physical Fitness Tests in Preadolescent Children

Reliability is a crucial characteristic of any measurement tool since it indicates consistency in measurement [41]. High reliability indicates low measurement error and ensures there is a stable evaluation of the tested capacity/characteristic [42]. Therefore, in the first phase of our investigation, we examined the inter-testing and intra-testing reliability of the applied fitness tests. Studies frequently report the reliability of the fitness tests in children, and tests included in the FitnessGram battery are also examined. However, it seems that studies rarely simultaneously examine the reliability of various fitness tests in early school-aged children (preadolescent children), including FitnessGram fitness tests [43,44].
Specifically, several studies report a good reliability for the push-ups test, with unsystematic differences in reliability between genders [45,46]. Likewise, the test–retest reliability of the curl-up test in 10–12-year-old children is also found to be appropriate [47]. In a study that involved children aged 8–15 years, the authors examined the reliability of the beep test performed at a 20 m distance and found a high test–retest correlation and no systematic differences between results obtained over two testing sessions [48]. High reliability was reported even for the broad jump in studies performed with 5–12- and 6–12-year-old children [49,50]. Finally, in a study performed with 5–12-year-old children, the authors investigated the reliability of the various FitnessGram tests. They found good reliability for the curl up, torso lift, 90° push up, and shoulder stretch [43].
Collectively, it seems that our results demonstrating a good reliability for push-ups, curl-ups, the sit-and-reach test, the PACER test (as a part of FitnessGram battery), and the broad jump correspond with previous studies performed with early school-aged children. This is particularly important considering the characteristics of our participants. Namely, our study involved children of a relatively narrow age span and, therefore, of similar biological maturity. On the other hand, in some of the previous investigations, the participants varied in age (i.e., 5–12-, 8–15-, 6–12-, and 5–14-year-old children) [43,48,49,50]. Since motor fitness in children is highly influenced by their biological maturity, it is possible that variations in biological maturity increased the variance of the fitness tests, resulting in (i) high correlations between tests and retests, and (ii) high reliability in the studied fitness tests [51].
In brief, the calculation of reliability parameters is based on the level of correlation between measurements (i.e., testing trials), and correlation is proportional to the (co)variance of executed trials [52]. Specifically, the higher the (co)variance (which is certainly the case in samples that include children of a wide age span), the higher the correlation coefficient. In most common wording, if one (or both) variable(s) have a high variability (large differences among the individual data points), this can affect the correlation. Large variance can accentuate the differences between data points and potentially lead to a higher correlation coefficient. Conversely, lower variability may result in a weaker correlation coefficient. Therefore, our results on the reliability of the studied fitness tests for the participants of a narrow age span (and consequently small variance of results) additionally confirm the reliability of the applied fitness tests.
The simultaneous investigation of the reliability performed here for different fitness tests allowed us to compare their reliability. Although differences in test type (some tests, such as beep tests, were performed as single-trial tests, while others, such as the sit-and-reach, were multi-trial tests) did not allow a precise comparison between them, some general considerations are still possible. For example, it is clear that the broad jump and sit-and-reach tests had the highest intra-testing and inter-testing reliability of all applied tests and, therefore, should be considered highly stable measurement tools. This is probably a consequence of the fact that these tests are regularly used in the school system as a part of the PE fitness-testing battery. Also, the tests are simple and performed with standardized procedures and equipment, which additionally ensure the stability of the measurements and high reliability [53].
On the other hand, the somewhat lower reliability of the torso lift could be attributed to the relative non-familiarity of participants and testers with this measurement tool. As long-term professionals in PE, the authors of this study are quite sure that our participants had not performed this test prior to this investigation. This almost certainly negatively influenced the stability of their test achievement in the test and retest. Also, the testers themselves were introduced to the testing protocol just before the study (i.e., this test is not included in physical education in the country), which could have altered the consistency of the testing and decreased the reliability.

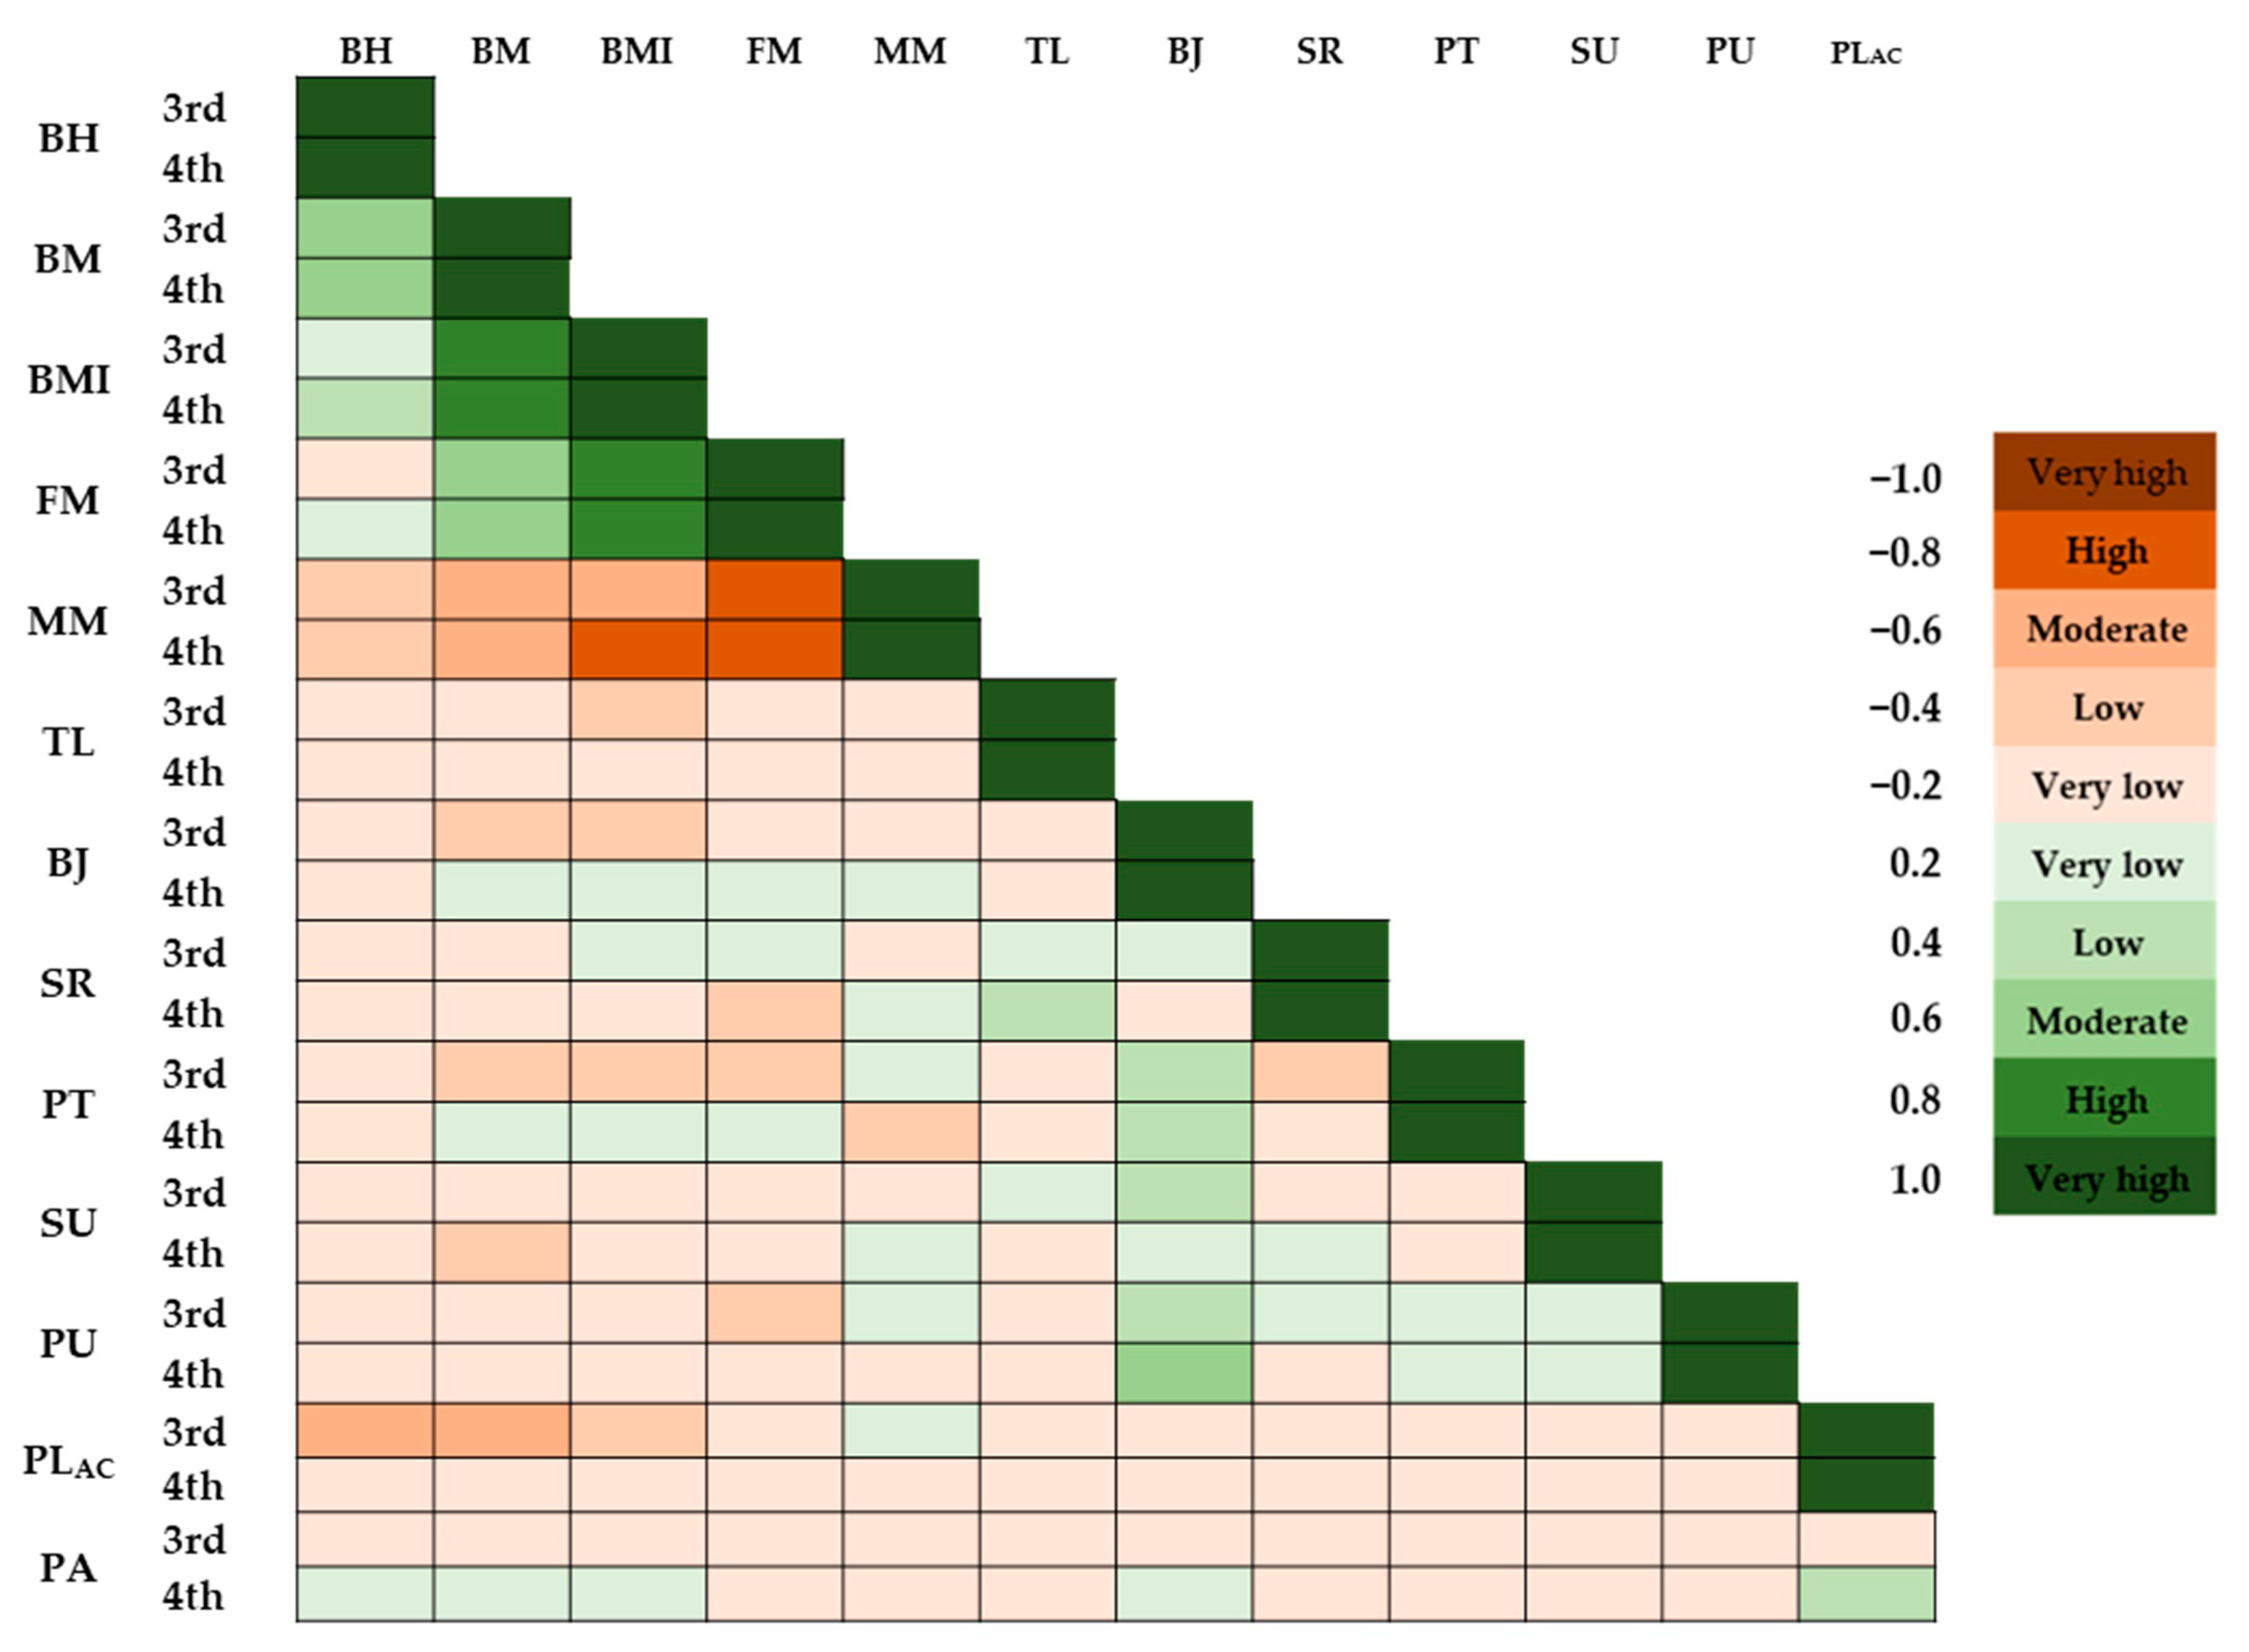
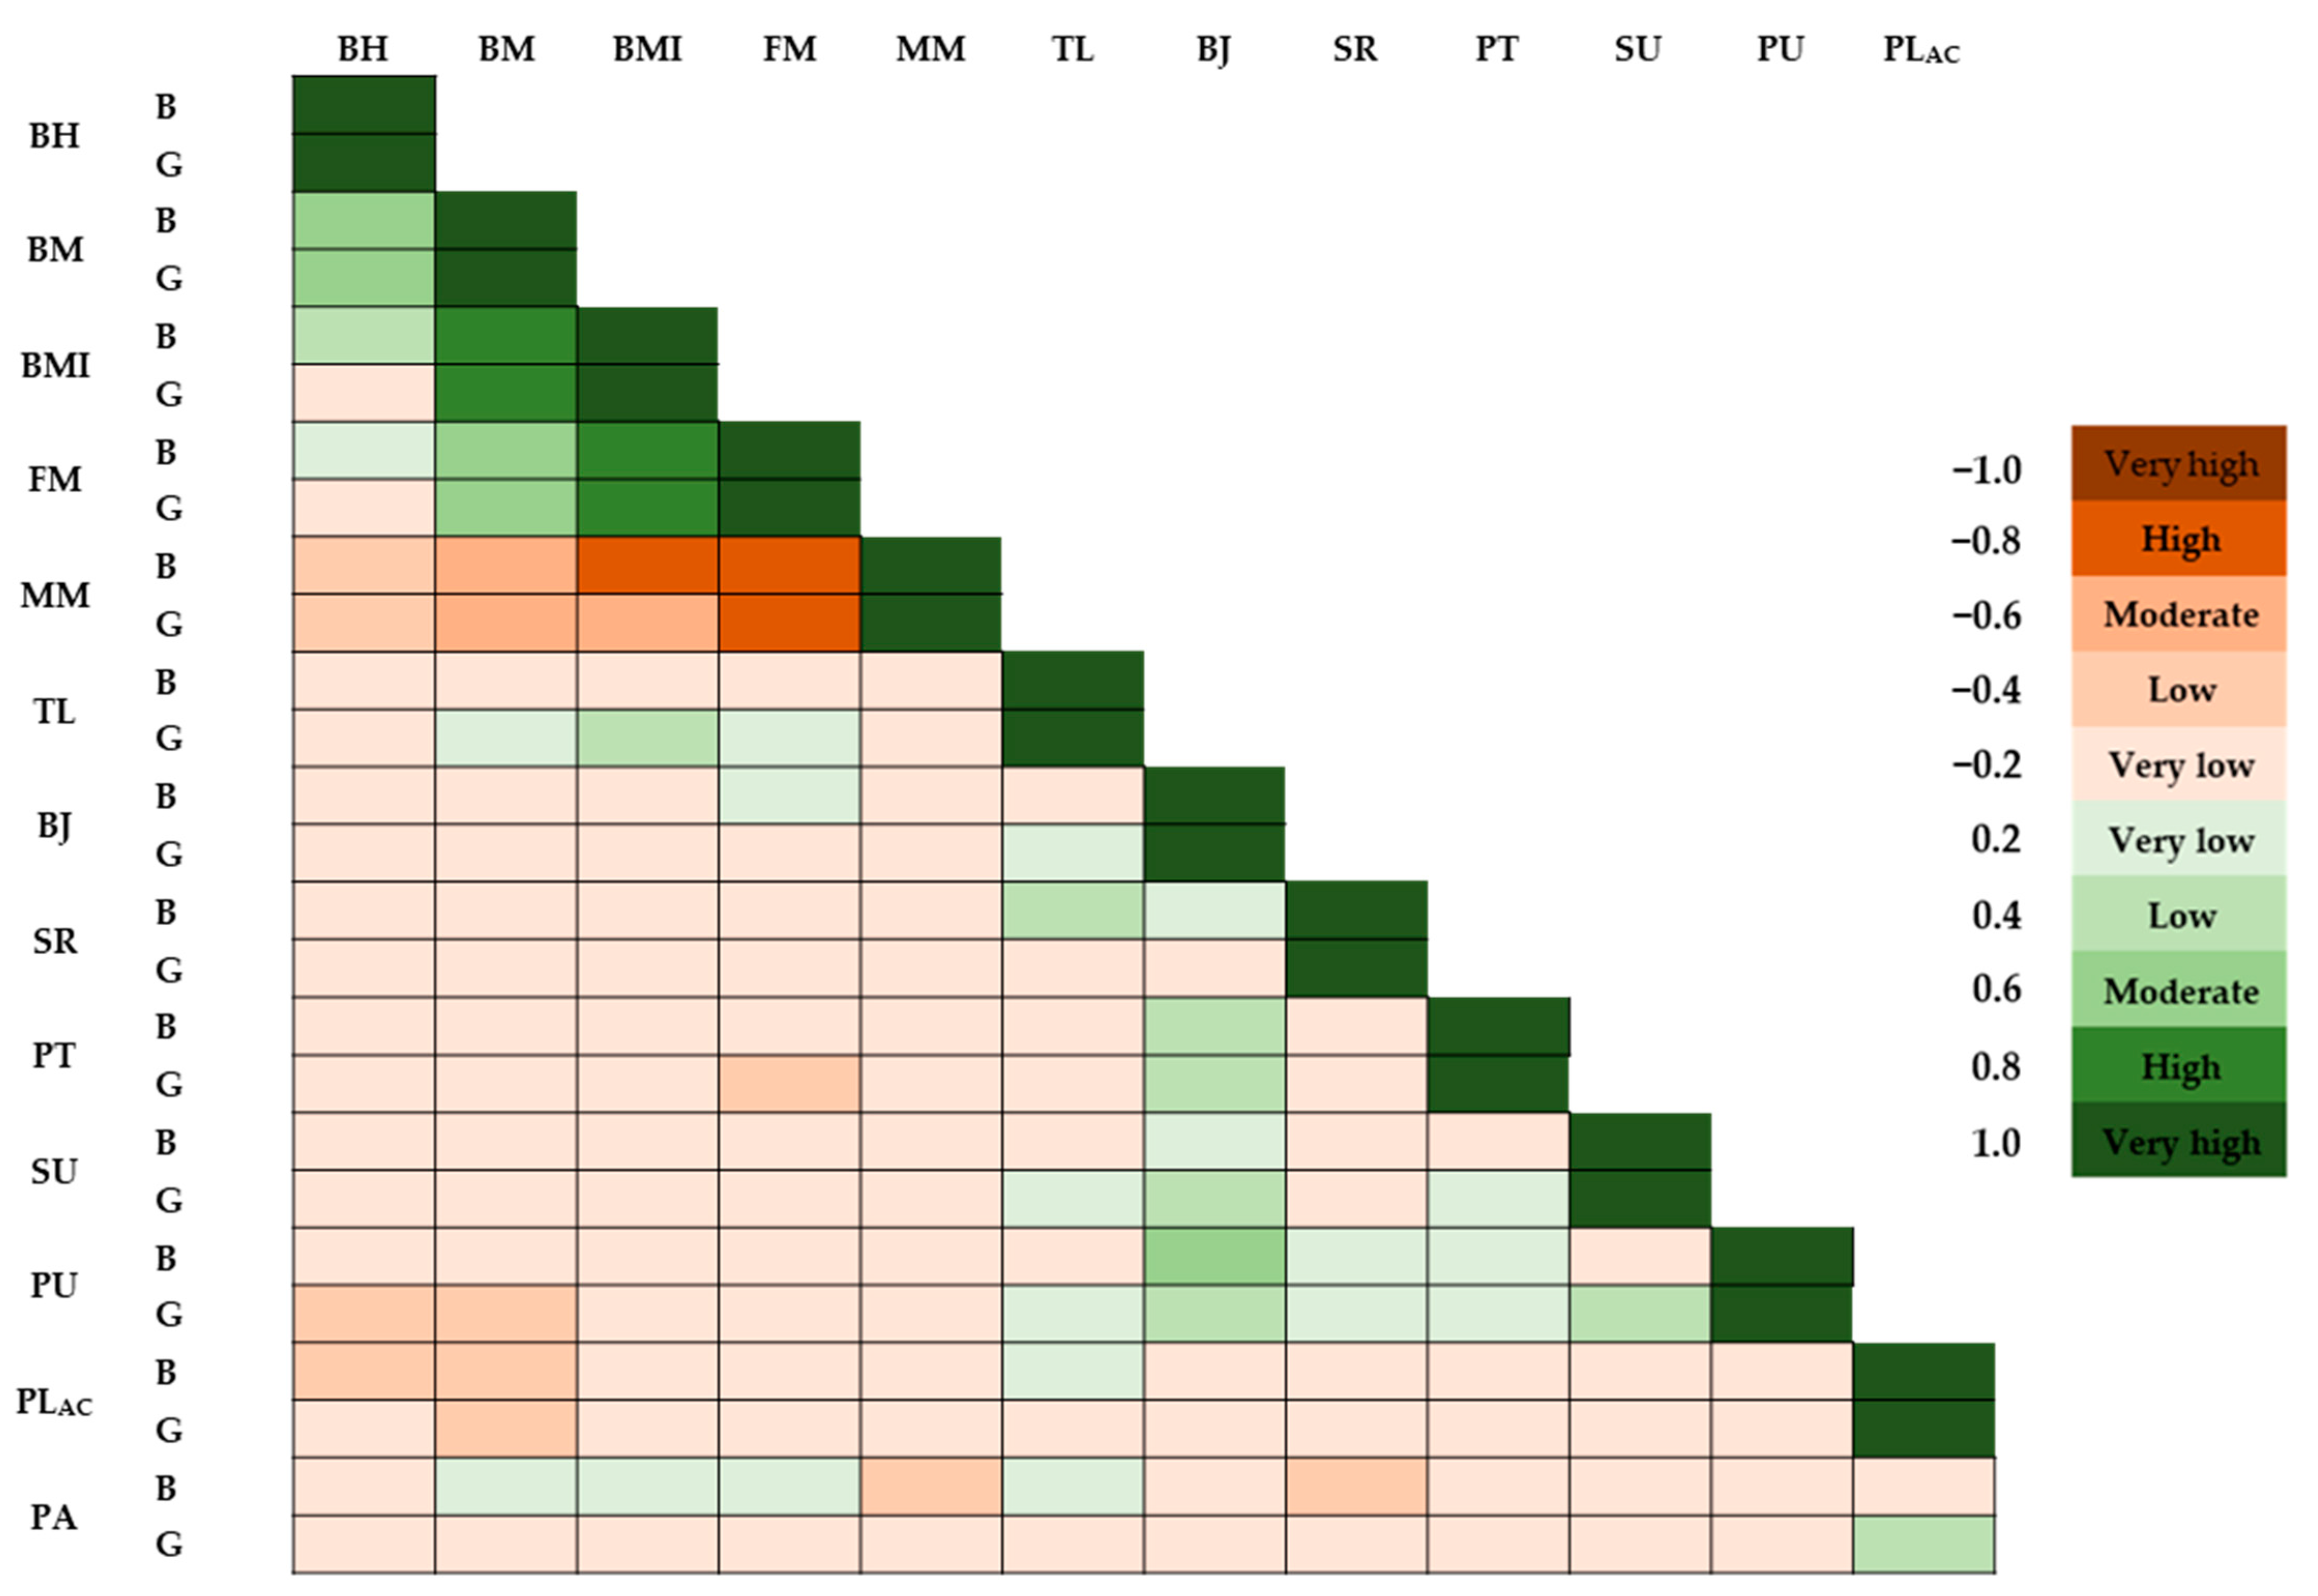
4.2. Association between Physical Literacy and Physical Fitness

It seems that most authors who have investigated correlations between PL and PF have been interested in cardiovascular fitness and its association with PL facets. In particular, several studies have found a favorable association between cardiorespiratory fitness and PLAC in preadolescent children [54]. Meanwhile, it seems that the associations between various PF indicators (i.e., strength, flexibility, power) and PL have so far been investigated only in adolescents.
In a recent study, the authors highlighted that adolescents with higher PLAC performed better in strength, power, flexibility, and cardiovascular endurance [55]. However, our analyses indicated poor relationships between fitness tests and PLAC in he studied children. It is also important that our associations between PF and PLAC were low and nonsignificant, even when all participants were observed as unique samples (i.e., not dividing younger from older children and/or genders) and in gender- and age-stratified analyses.
The most probable explanation for the lack of correlation between PLAC and fitness tests in our sample can be attributed to biological (sexual) maturity and its influence on PF in preadolescent children [56]. In general, it is well-known that more biologically mature children have an advantage in the level of motor performance [57]. Indeed, studies have repeatedly confirmed that biological maturity is one of the most important determinants of fitness status in children, with those children who are advanced in maturity status having a better performance on various fitness tests, including power, strength, and endurance [57].
It is also important to note that biological maturity influences not only the current level of motor performance of children but also their responses to learning and training stimuli [57]. In other words, more mature children can tolerate intensive workouts more effectively and learn better while performing physically demanding exercises. This could have resulted in the smaller influence of the PLAC on PF in our studied participants.

4.3. Correlations between Physical Literacy and Physical Activity Levels

Studies have rarely investigated the associations between PL and PAL in preadolescent children, and the results have generally been inconsistent. While some investigations have shown positive correlations, others have found no significant association between PAL indices and PL in children and adolescents [58,59], while research on preschool children has found that PL is predictive of PAL in girls but not in boys [60]. Since we found a significant correlation between PLAC and PAL in girls and fourth graders, and no significant association in boys and third graders, we may say that our results are not surprising. Possible explanations of such findings are discussed in the following.
There is a substantial body of evidence that structural and organized PA are almost exclusive sources of PA among girls, while boys are, in addition to organized sports, more likely to be engaged in unstructured PA (i.e., free play) [61,62,63,64]. In other words, girls are more likely to reach their PAL through organized sports than through non-organized activity. It is logical that (only) those girls who were engaged in structural activities had higher PAL and higher results for PLAC. This leads to a significant correlation between PLAC and PAL among girls. Similarly, older children (fourth graders) are less likely to be engaged in free play, and their PAL is more a consequence of participation in structured sport activities. Indeed, research consistently shows a decline in free play as children age, with factors such as daycare attendance, parental fear of risk, and changes in family structure contributing to this trend [65]. Logically, girls are more likely to follow this trend. In the meantime, the PAL among boys and younger children is not related only to structured activities (i.e., sports and PE) but is also a consequence of other unstructured activities and free play. Although unstructured activities are directly related to higher PAL, those activities are not likely to influence PLAC as much as organized and supervised participation in structured sports [32,66,67]. Consequently, this results in the low correlation between PLAC and PAL among boys.
In support of this, previous research has found that youth engaged in sports have higher PL levels than their peers not involved in sports. Specifically, a study conducted on adolescents aged 14–18 years from Croatia reported that students who participated in sports had better PLAC compared to those who did not participate in organized sports [68]. Moreover, a recent study on children aged 9–11 years from Croatia also supported the idea that sports are an important determinant of PLAC, as the years of organized sports training were positively associated with PLAC [32]. Thus, as sports are an important mediator in reaching optimal PLAC, the finding that girls with higher PAL (which is most likely a consequence of sports participation) have better PLAC is also logical.
One could argue that PE could also positively influence the PL in children. However, in this study, we are not able to discuss such an influence in more detail. In brief, PE is a mandatory school subject for all (healthy) children, and we observed only children who regularly participated in PE classes (please see the Methods section for the inclusion criteria). Therefore, we could not calculate the eventual differences between the groups of interest (included vs. non-included in PE).
In explaining gender-specific correlations between PLAC and PAL, we should also highlight differences in social support for physical activity engagement. Specifically, boys are generally perceived as active and involved in sports and free play, while girls are more engaged in sedentary activities and play that does not include vigorous movement activities. In support of this, research shows that during school recess, boys tend to engage in competitive games, while girls often use the time to socialize with their friends [69]. Moreover, a study on elementary school children found that girls had lower levels of school-based moderate-to-vigorous physical activity time compared to boys [70]. As we are actively involved in school activities and observe the situations during school recess and after-school activities, we can comment that boys are usually involved in various kinds of vigorous activities during free time, while girls at the same time are sitting, drawing, playing with dolls, or talking. This altogether could at least partially result in a higher correlation between PAL and PL in girls than in boys.

4.4. Limitations and Strengths

This study was cross-sectional, and such a design does not allow for a clear interpretation of the causality between variables. Therefore, in order to more precisely evaluate the possible relationships between PLAC, PF, and PAL, intervention studies are needed. Furthermore, we observed participants from urban communities exclusively, and, therefore, the results should be generalized only to similar samples. In addition, since only one study has examined the validity of the PLAC questionnaire in local languages in the region (i.e., the territory of former Yugoslavia) so far, we do not have definite proof of the validity of this measurement tool. Also, in this study, we performed gender-specific and age-stratified correlation analyses while using simple univariate procedures; in further studies, more complex (multiple) regression analyses are needed to consider possible interactions between the variables of interest. Next, the PAL was evaluated by a questionnaire and not directly monitored, which should certainly be observed as a study limitation. Finally, this study examined only the affective and cognitive domains of PL, and, in the future, a more holistic approach is needed in order to evaluate the associations between the observed factors in more detail.
This is one of the first studies that has examined the associations between PLAC, various indices of PF, and PAL in preadolescents. This represents a valuable contribution to the literature, and since we included children of a relatively narrow age span, this allowed for the precise identification of the characteristics of the studied associations. Additionally, we evaluated PF by using various PF tests, which has rarely been performed previously. Finally, the gender-specific and age-specific approaches were important strengths of this investigation.

5. Conclusions

The results of this study confirm the reliability of the applied PF tests in preadolescent children, including those included in the FitnessGram battery. However, while the reliability was almost perfect for tests that are regularly used in PE, the results showed lower reliability for tests that the participants and testers had not performed prior to this study. Therefore, it is clear that systematic familiarization with the testing procedures is needed in order to achieve stability and consistency of a PF evaluation in this age group.
The PF and PLAC were poorly correlated in both boys and girls. It is likely that the more mature children were more successful in the PF tests, which consequently diminished the eventual influence of PLAC on PF achievement in this age group. In future studies, larger cohorts of children should be explored, allowing for eventual clustering of the participants into maturity-homogenous groups and for a more precise evaluation of the association between PL and PAL.
PAL and PLAC were significantly correlated among girls and the older group of children. The gender difference in participation in structured and unstructured activities probably explains such findings. Namely, the PAL of the girls and older children is more a consequence of their participation in structured activities (i.e., organized sport, PE), which simultaneously increases the PAL and improves the PL.
While this study has made initial process toward defining the correlations between fitness, physical activity, and PL indices, further intervention studies are needed. Specifically, it will be important to identify the effects of targeted interventions—aimed at specific factors (i.e., PL)—on changes in PL, as well as corresponding changes in PF and PAL.

Supplementary Materials

The following supporting information can be downloaded at https://www.mdpi.com/article/10.3390/educsci14040391/s1, Table S1: Descriptive statistics and results of the Kolmogorov–Smirnov test (KS) for the total sample of participants; Table S2: Correlations between study variables for the total sample of participants (* denotes p < 0.05), where results are presented as Pearson’s correlation (95% CI); Table S3: Age-stratified correlations (3rd graders and 4th graders) between study variables (* denotes p < 0.05), where results are presented as Pearson’s correlation (95% CI); Table S4: Gender-stratified (B—boys, G—girls) correlations between study variables for the total sample of participants (* denotes p < 0.05), where results are presented as Pearson’s correlation (95% CI).

Author Contributions

Methodology, B.G., N.Z., M.G.K., K.I., M.S. and D.S.; Software, M.M. Formal analysis, N.Z. and M.M.; Investigation, P.R.V., V.P. and M.G.K.; Resources, P.R.V., N.Z. and M.S.; Data curation, P.R.V., B.G. and V.P.; Writing—original draft, P.R.V., B.G., M.G.K. and K.I.; Supervision, M.S. and D.S.; Project administration, D.S. All authors have read and agreed to the published version of the manuscript.

Funding

This research received no external funding.

Institutional Review Board Statement

Institutional Review Board Statement: The study was conducted in accordance with the Dec-laration of Helsinki, and approved by the Institutional Ethics Committee of University of Split, Faculty of Kinesiology (EBO: 2181-205-02-01-21-0011; date of approval, 23 September 2021).

Informed Consent Statement

Written consent was obtained from the parents of the children who participated in this study. Informed consent was obtained from all subjects involved in this study.

Data Availability Statement

Data will be provided to all interested parties upon reasonable request.

Acknowledgments

Authors are particularly grateful to school authorities and teachers, who helped us in the investigation. Special thanks goes to parents and children for their participation in the study.

Conflicts of Interest

The authors declare no conflicts of interest.

References

  1. Siedentop, D.; Van der Mars, H. Introduction to Physical Education, Fitness, and Sport; Human kinetics: Champaign, IL, USA, 2022. [Google Scholar]
  2. Moliner-Urdiales, D.; Ruiz, J.R.; Ortega, F.B.; Jiménez-Pavón, D.; Vicente-Rodriguez, G.; Rey-López, J.P.; Martínez-Gómez, D.; Casajús, J.A.; Mesana, M.I.; Marcos, A.; et al. Secular trends in health-related physical fitness in Spanish adolescents The AVENA and HELENA Studies. J. Sci. Med. Sport 2010, 13, 584–588. [Google Scholar] [CrossRef] [PubMed]
  3. Silventoinen, K.; Maia, J.; Jelenkovic, A.; Pereira, S.; Gouveia, É.; Antunes, A.; Thomis, M.; Lefevre, J.; Kaprio, J.; Freitas, D. Genetics of somatotype and physical fitness in children and adolescents. Am. J. Hum. Biol. 2021, 33, e23470. [Google Scholar] [CrossRef] [PubMed]
  4. Hills, A.P.; Andersen, L.B.; Byrne, N.M. Physical activity and obesity in children. Brit J. Sport Med. 2011, 45, 866–870. [Google Scholar] [CrossRef] [PubMed]
  5. Smith, J.J.; Eather, N.; Morgan, P.J.; Plotnikoff, R.C.; Faigenbaum, A.D.; Lubans, D.R. The Health Benefits of Muscular Fitness for Children and Adolescents: A Systematic Review and Meta-Analysis. Sports Med. 2014, 44, 1209–1223. [Google Scholar] [CrossRef]
  6. Cadenas-Sanchez, C.; Mena-Molina, A.; Torres-Lopez, L.V.; Migueles, J.H.; Rodriguez-Ayllon, M.; Lubans, D.R.; Ortega, F.B. Healthier Minds in Fitter Bodies: A Systematic Review and Meta-Analysis of the Association between Physical Fitness and Mental Health in Youth. Sports Med. 2021, 51, 2571–2605. [Google Scholar] [CrossRef] [PubMed]
  7. Bermejo-Cantarero, A.; Álvarez-Bueno, C.; Martínez-Vizcaino, V.; Redondo-Tébar, A.; Pozuelo-Carrascosa, D.P.; Sánchez-López, M. Relationship between both cardiorespiratory and muscular fitness and health-related quality of life in children and adolescents: A systematic review and meta-analysis of observational studies. Health Qual. Life Outcomes 2021, 19, 127. [Google Scholar] [CrossRef]
  8. Rodriguez, C.C.; de Camargo, E.M.; Rodriguez-Añez, C.R.; Reis, R.S. Physical Activity, Physical Fitness and Academic Achievement in Adolescents: A Systematic Review. Rev. Bras. Med. Esporte 2020, 26, 441–448. [Google Scholar] [CrossRef]
  9. Alvarez-Pitti, J.; Mallen, J.A.C.; Trabazo, R.L.; Lucia, A.; de Lara, D.L.; Aznar, L.A.M.; Martinez, G.R. Exercise as medicine in chronic diseases during childhood and adolescence. An. Pediatr. 2020, 92, 173.e1–173.e8. [Google Scholar] [CrossRef]
  10. Ariza, C.; Sanchez-Martinez, F.; Serral, G.; Valmayor, S.; Juarez, O.; Pasarin, M.I.; Castell, C.; Rajmil, L.; Lopez, M.J.; Ariza, C.; et al. The Incidence of Obesity, Assessed as Adiposity, Is Reduced After 1 Year in Primary Schoolchildren by the POIBA Intervention. J. Nutr. 2019, 149, 258–269. [Google Scholar] [CrossRef]
  11. Whiting, S.; Buoncristiano, M.; Gelius, P.; Abu-Omar, K.; Pattison, M.; Hyska, J.; Duleva, V.; Musić Milanović, S.; Zamrazilová, H.; Hejgaard, T. Physical activity, screen time, and sleep duration of children aged 6–9 years in 25 countries: An analysis within the WHO European childhood obesity surveillance initiative (COSI) 2015–2017. Obes. Facts 2021, 14, 32–44. [Google Scholar] [CrossRef]
  12. Guthold, R.; Stevens, G.A.; Riley, L.M.; Bull, F.C. Global trends in insufficient physical activity among adolescents: A pooled analysis of 298 population-based surveys with 1· 6 million participants. Lancet Child Adolesc. Health 2020, 4, 23–35. [Google Scholar] [CrossRef] [PubMed]
  13. Giroir, B.P.; Wright, D. Physical Activity Guidelines for Health and Prosperity in the United States. J. Am. Med. Assoc. 2018, 320, 1971–1972. [Google Scholar] [CrossRef] [PubMed]
  14. Pojskic, H.; Eslamis, B. Relationship Between Obesity, Physical Activity, and Cardiorespiratory Fitness Levels in Children and Adolescents in Bosnia and Herzegovina: An Analysis of Gender Differences. Front. Physiol. 2018, 9, 1734. [Google Scholar] [CrossRef] [PubMed]
  15. Escapite, A.O.; Lopez-Alonzo, S.J.; Barron-Lujan, J.C.; Guedea-Delgado, J.C.; Balderrama, C.V.V. Physical education, motor development and physical activity in preschool children: A systematic review. Viref-Rev. Educ. Fis. 2022, 11, 28–41. [Google Scholar]
  16. Goodyear, V.A.; Skinner, B.; McKeever, J.; Grifftiths, M. The influence of online physical activity interventions on children and young people‘s engagement with physical activity: A systematic review. Phys. Educ. Sport Peda 2023, 28, 94–108. [Google Scholar] [CrossRef]
  17. Holt, N.L.; Deal, C.J.; Pankow, K. Positive youth development through sport. In Handbook of Sport Psychology, 4th ed.; John Wiley & Sons, Inc.: Hoboken, NJ, USA, 2020; pp. 429–446. [Google Scholar]
  18. Kriemler, S.; Meyer, U.; Martin, E.; van Sluijs, E.M.F.; Andersen, L.B.; Martin, B.W. Effect of school-based interventions on physical activity and fitness in children and adolescents: A review of reviews and systematic update. Brit J. Sport Med. 2011, 45, 923–930. [Google Scholar] [CrossRef] [PubMed]
  19. Twisk, J.W.R.; Kemper, H.C.G.; van Mechelen, W. The relationship between physical fitness and physical activity during adolescence and cardiovascular disease risk factors at adult age. The Amsterdam Growth and Health Longitudinal Study. Study Int. J. Sports Med. 2002, 23, S8–S14. [Google Scholar]
  20. Kodama, S.; Saito, K.; Tanaka, S.; Maki, M.; Yachi, Y.; Asumi, M.; Sugawara, A.; Totsuka, K.; Shimano, H.; Ohashi, Y. Cardiorespiratory fitness as a quantitative predictor of all-cause mortality and cardiovascular events in healthy men and women: A meta-analysis. JAMA 2009, 301, 2024–2035. [Google Scholar] [CrossRef] [PubMed]
  21. Martínez-Vizcaíno, V.; Sánchez-López, M. Relación entre actividad física y condición física en niños y adolescentes. Elsevier Doyma 2008, 61, 108–111. [Google Scholar] [CrossRef]
  22. Whitehead, M. Definition of physical literacy and clarification of related issues. Icsspe Bull. 2013, 65, 28–33. [Google Scholar]
  23. Cairney, J.; Dudley, D.; Kwan, M.; Bulten, R.; Kriellaars, D. Physical Literacy, Physical Activity and Health: Toward an Evidence-Informed Conceptual Model. Sports Med. 2019, 49, 371–383. [Google Scholar] [CrossRef] [PubMed]
  24. Holler, P.; Carl, J.; van Poppel, M.N.M.; Jaunig, J. Development of the Perceived Physical Literacy Questionnaire (PPLQ) for the adult population. J. Exerc. Sci. Fit. 2023, 21, 424–433. [Google Scholar] [CrossRef] [PubMed]
  25. Shearer, C.; Goss, H.R.; Boddy, L.M.; Knowles, Z.R.; Durden-Myers, E.J.; Foweather, L. Assessments Related to the Physical, Affective and Cognitive Domains of Physical Literacy Amongst Children Aged 7–11.9 Years: A Systematic Review. Sports Med. Open 2021, 7, 37. [Google Scholar] [CrossRef] [PubMed]
  26. Liu, Y.; Chen, S.L. Physical literacy in children and adolescents: Definitions, assessments, and interventions. Eur. Phys. Educ. Rev. 2021, 27, 96–112. [Google Scholar] [CrossRef]
  27. de Dieu, H.J.; Zhou, K. Physical Literacy Assessment Tools: A Systematic Literature Review for Why, What, Who, and How. Int. J. Environ. Res. Public Health 2021, 18, 7954. [Google Scholar] [CrossRef]
  28. Geets-Kesić, M.; Maras, N.; Gilić, B. Analysis of the Association Between Health Literacy, Physical Literacy, and Scholastic Achievement; A Preliminary Cross-Sectional Study Among High-School Students From Southern Croatia. Montenegrin J. Sports Sci. Med. 2023, 12. [Google Scholar] [CrossRef]
  29. Zhang, C.; Liu, Y.; Xu, S.; Sum, R.K.W.; Ma, R.S.; Zhong, P.; Liu, S.X.; Li, M.H. Exploring the Level of Physical Fitness on Physical Activity and Physical Literacy Among Chinese University Students: A Cross-Sectional Study. Front. Psychol. 2022, 13, 833461. [Google Scholar] [CrossRef]
  30. Caldwell, H.A.T.; Di Cristofaro, N.A.; Cairney, J.; Bray, S.R.; MacDonald, M.J.; Timmons, B.W. Physical Literacy, Physical Activity, and Health Indicators in School-Age Children. Int. J. Environ. Res. Public Health 2020, 17, 5367. [Google Scholar] [CrossRef] [PubMed]
  31. Nezondet, C.; Gandrieau, J.; Nguyen, P.; Zunquin, G. Perceived Physical Literacy Is Associated with Cardiorespiratory Fitness, Body Composition and Physical Activity Levels in Secondary School Students. Children 2023, 10, 712. [Google Scholar] [CrossRef]
  32. Vuletic, P.R.; Kesic, M.G.; Gilic, B.; Pehar, M.; Uzicanin, E.; Idrizovic, K.; Sekulic, D. Evaluation of Physical Literacy in 9-to 11-Year-Old Children: Reliability and Validity of Two Measurement Tools in Three Southeastern European Countries. Children 2023, 10, 1722. [Google Scholar] [CrossRef]
  33. Kriellaars, D.; Kozera, T.; Robillard, B. Physical literacy assessment for youth. PLAY Workbook. Canadian Sport Institute—Pacific. 2013. Available online: http://sportforlife.ca/wp-content/uploads/2016/12/PLAYbasic-workbook.pdf (accessed on 10 February 2024).
  34. Crocker, P.; Bailey, D.A.; Faulkner, R.A.; Kowalski, K.C.; McGrath, R. Measuring general levels of physical activity: Preliminary evidence for the Physical Activity Questionnaire for Older Children. Med. Sci. Sports Exerc. 1997, 29, 1344–1349. [Google Scholar] [CrossRef] [PubMed]
  35. Samaržija, D.V.; Mišigoj-Duraković, M. Reliability of Croatian version of the questionnaire for assessment of overall level of physical activity of younger school children. Hrvat. Športskomedicinski Vjesn. 2013, 28, 24–32. [Google Scholar]
  36. Meredith, M.D.; Welk, G. Fitnessgram and Activitygram Test Administration Manual-Updated, 4th ed.; Human Kinetics: Champaign, IL, USA, 2010. [Google Scholar]
  37. Leger, L.A.; Mercier, D.; Gadoury, C.; Lambert, J. The multistage 20 metre shuttle run test for aerobic fitness. J. Sports Sci. 1988, 6, 93–101. [Google Scholar] [CrossRef] [PubMed]
  38. Chen, W.Y.; Hammond-Bennett, A.; Hypnar, A.; Mason, S. Health-related physical fitness and physical activity in elementary school students. BMC Public Health 2018, 18, 195. [Google Scholar] [CrossRef]
  39. Thomas, E.; Petrigna, L.; Tabacchi, G.; Teixeira, E.; Pajaujiene, S.; Sturm, D.J.; Sahin, F.N.; Gomez-Lopez, M.; Pausic, J.; Paoli, A.; et al. Percentile values of the standing broad jump in children and adolescents aged 6–18 years old. Eur. J. Transl. Myol. 2020, 30, 240–246. [Google Scholar] [CrossRef]
  40. Schober, P.; Boer, C.; Schwarte, L.A. Correlation Coefficients: Appropriate Use and Interpretation. Anesth. Analg. 2018, 126, 1763–1768. [Google Scholar] [CrossRef]
  41. Sekulic, D.; Uljevic, O.; Peric, M.; Spasic, M.; Kondric, M. Reliability and Factorial Validity of Non-Specific and Tennis-Specific Pre-Planned Agility Tests; Preliminary Analysis. J. Hum. Kinet. 2017, 55, 107–116. [Google Scholar] [CrossRef]
  42. Uljevic, O.; Esco, M.R.; Sekulic, D. Reliability, validity, and applicability of isolated and combined sport-specific tests of conditioning capacities in top-level junior water polo athletes. J. Strength. Cond. Res. 2014, 28, 1595–1605. [Google Scholar] [CrossRef]
  43. Gogoi, P.; Bhattacharyya, N.C. Interrater reliability of fitness gram test to be used as a reliable tool for assessing physical fitness for school children in guwahati urban society of north-east india. Int. J. Res. Med. Sci. 2020, 8, 312. [Google Scholar] [CrossRef]
  44. Morrow, J.R.; Martin, S.B.; Jackson, A.W. Reliability and Validity of the FITNESSGRAM®: Quality of Teacher-Collected Health-Related Fitness Surveillance Data. Res. Q. Exerc. Sport 2010, 81, S24–S30. [Google Scholar] [CrossRef]
  45. McManis, B.G.; Baumgartner, T.A.; Wuest, D.A. Objectivity and reliability of the 90 push-up test. Meas. Phys. Educ. Exerc. 2000, 4, 57–67. [Google Scholar] [CrossRef]
  46. Saint Romain, B.; Mahar, M.T. Norm-referenced and criterion-referenced reliability of the push-up and modified pull-up. Meas. Phys. Educ. Exerc. 2001, 5, 67–80. [Google Scholar] [CrossRef]
  47. Patterson, P.; Bennington, J.; De la Rosa, T. Psychometric properties of child- and teacher-reported curl-up scores in children ages 10–12 years. Res. Q. Exerc. Sport 2001, 72, 117–124. [Google Scholar] [CrossRef] [PubMed]
  48. Pitetti, K.H.; Fernhall, B.; Figoni, S. Comparing two regression formulas that predict VO using the 20-m shuttle run for children and adolescents. Pediatr. Exerc. Sci. 2002, 14, 125–134. [Google Scholar] [CrossRef]
  49. Fernandez-Santos, J.R.; Ruiz, J.R.; Cohen, D.D.; Gonzalez-Montesinos, J.L.; Castro-Piñero, J. Reliability and Validity of Tests to Assess Lower-Body Muscular Power in Children. J. Strength. Cond. Res. 2015, 29, 2277–2285. [Google Scholar] [CrossRef] [PubMed]
  50. Fjortoft, I.; Pedersen, A.V.; Sigmundsson, H.; Vereijken, B. Measuring Physical Fitness in Children Who Are 5 to 12 Years Old With a Test Battery That Is Functional and Easy to Administer. Phys. Ther. 2011, 91, 1087–1095. [Google Scholar] [CrossRef] [PubMed]
  51. Katzmarzyk, P.; Malina, R.; Beunen, G. The contribution of biological maturation to the strength and motor fitness of children. Ann. Hum. Biol. 1997, 24, 493–505. [Google Scholar] [CrossRef] [PubMed]
  52. Huck, S.W. Reading Statistics and Research: Pearson New International Edition; Pearson Education: London, UK, 2013. [Google Scholar]
  53. Neljak, B.; Novak, D.; Sporiš, G.; Višković, S.; Markuš, D. Cro-Fit Norme; Faculty of Kinesiology, University of Zagreb: Zagreb, Croatia, 2012. (In Croatian) [Google Scholar]
  54. Lang, J.J.; Chaput, J.P.; Longmuir, P.E.; Barnes, J.D.; Belanger, K.; Tomkinson, G.R.; Anderson, K.D.; Bruner, B.; Copeland, J.L.; Gregg, M.J.; et al. Cardiorespiratory fitness is associated with physical literacy in a large sample of Canadian children aged 8 to 12 years. BMC Public Health 2018, 18, 1041. [Google Scholar] [CrossRef] [PubMed]
  55. Gilic, B.; Malovic, P.; Sunda, M.; Maras, N.; Zenic, N. Adolescents with Higher Cognitive and Affective Domains of Physical Literacy Possess Better Physical Fitness: The Importance of Developing the Concept of Physical Literacy in High Schools. Children 2022, 9, 796. [Google Scholar] [CrossRef]
  56. Jones, M.A.; Hitchen, P.J.; Stratton, G. The importance of considering biological maturity when assessing physical fitness measures in girls and boys aged 10 to 16 years. Ann. Hum. Biol. 2000, 27, 57–65. [Google Scholar] [CrossRef]
  57. Marta, C.C.; Marinho, D.A.; Izquierdo, M.; Marques, M.C. Differentiating maturational influence on training-induced strength and endurance adaptations in prepubescent children. Am. J. Hum. Biol. 2014, 26, 469–475. [Google Scholar] [CrossRef] [PubMed]
  58. Belanger, K.; Barnes, J.D.; Longmuir, P.E.; Anderson, K.D.; Bruner, B.; Copeland, J.L.; Gregg, M.J.; Hall, N.; Kolen, A.M.; Lane, K.N.; et al. The relationship between physical literacy scores and adherence to Canadian physical activity and sedentary behaviour guidelines. Bmc Public Health 2018, 18, 1042. [Google Scholar] [CrossRef] [PubMed]
  59. Yan, W.; Meng, Y.; Wang, L.; Zhang, T.; Chen, L.; Li, H. Research on the Relationship between Physical Literacy, Physical Activity and Sedentary Behavior. Int. J. Environ. Res. Public Health 2022, 19, 16455. [Google Scholar] [CrossRef] [PubMed]
  60. Cairney, J.; Clark, H.J.; James, M.E.; Mitchell, D.; Dudley, D.A.; Kriellaars, D. The Preschool Physical Literacy Assessment Tool: Testing a New Physical Literacy Tool for the Early Years. Front. Pediatr. 2018, 6, 138. [Google Scholar] [CrossRef] [PubMed]
  61. Bucksch, J.; Sigmundova, D.; Hamrik, Z.; Troped, P.J.; Melkevik, O.; Ahluwalia, N.; Borraccino, A.; Tynjälä, J.; Kalman, M.; Inchley, J. International Trends in Adolescent Screen-Time Behaviors From 2002 to 2010. J. Adolesc. Health 2016, 58, 417–425. [Google Scholar] [CrossRef] [PubMed]
  62. Jekauc, D.; Reimers, A.K.; Wagner, M.O.; Woll, A. Physical activity in sports clubs of children and adolescents in Germany: Results from a nationwide representative survey. J. Public Health-Heid 2013, 21, 505–513. [Google Scholar] [CrossRef]
  63. Kalman, M.; Inchley, J.; Sigmundova, D.; Iannotti, R.J.; Tynjälä, J.A.; Hamrik, Z.; Haug, E.; Bucksch, J. Secular trends in moderate-to-vigorous physical activity in 32 countries from 2002 to 2010: A cross-national perspective. Eur. J. Public Health 2015, 25, 37–40. [Google Scholar] [CrossRef]
  64. Van Hecke, L.; Loyen, A.; Verloigne, M.; van der Ploeg, H.P.; Lakerveld, J.; Brug, J.; De Bourdeaudhuij, I.; Ekelund, U.; Donnelly, A.; Hendriksen, I.; et al. Variation in population levels of physical activity in European children and adolescents according to cross-European studies: A systematic literature review within DEDIPAC. Int. J. Behav. Nutr. Phy 2016, 13, 70. [Google Scholar] [CrossRef] [PubMed]
  65. Carsley, S.; Liang, L.Y.; Chen, Y.; Parkin, P.; Maguire, J.; Birken, C.S.; Collaboration, T.A.K. The impact of daycare attendance on outdoor free play in young children. J. Public Health 2017, 39, 145–152. [Google Scholar] [CrossRef]
  66. Jefferies, P.; Bremer, E.; Kozera, T.; Cairney, J.; Kriellaars, D. Psychometric properties and construct validity of PLAYself: A self-reported measure of physical literacy for children and youth. Appl. Physiol. Nutr. Metab. 2021, 46, 579–588. [Google Scholar] [CrossRef]
  67. Šunda, M. Utjecaj Učenja na Daljinu i Unaprjeđenja Tjelesne Pismenosti na Promjene Stanja Fitnesa i Tjelesne Aktivnosti Adolescenata. Ph.D. Thesis, Faculty of Kinesiology, University of Zagreb, Zagreb, Croatia, 2022. [Google Scholar]
  68. Sunda, M.; Gilic, B.; Sekulic, D.; Matic, R.; Drid, P.; Alexe, D.I.; Cucui, G.G.; Lupu, G.S. Out-of-School Sports Participation Is Positively Associated with Physical Literacy, but What about Physical Education? A Cross-Sectional Gender-Stratified Analysis during the COVID-19 Pandemic among High-School Adolescents. Children 2022, 9, 753. [Google Scholar] [CrossRef] [PubMed]
  69. Ridgers, N.D.; Salmon, J.; Parrish, A.M.; Stanley, R.M.; Okely, A.D. Physical Activity During School Recess A Systematic Review. Am. J. Prev. Med. 2012, 43, 320–328. [Google Scholar] [CrossRef] [PubMed]
  70. Gu, X.; Chen, S.; Zhang, X. Physical Literacy at the Start Line: Young Children’s Motor Competence, Fitness, Physical Activity, and Fitness Knowledge. J. Teach. Phys. Educ. 2019, 38, 146–154. [Google Scholar] [CrossRef]
Figure 1. Study design and time frames.
Education 14 00391 g001
Figure 2. Test–retest correlations for the push-ups (A), sit-ups (B), and PACER test (C) in preadolescent children.
Education 14 00391 g002
Figure 3. Age-stratified (3rd—3rd grade, 4th—4th grade) magnitudes of correlations between study variables (BH—body height, BM—body mass, BMI—body mass index, FM—fat mass, MM—muscle mass, TL—torso lift, BJ—broad jump, SR—sit and reach, PT—PACER test, SU—sit-ups, PU—push-ups, PLAC—physical literacy (affective and cognitive domains) obtained by PLAYself questionnaire, PA—physical activity obtained by PAQ-C).
Education 14 00391 g003
Figure 4. Gender-stratified (B—boys, G—girls) magnitudes of correlations between study variables (BH—body height, BM—body mass, BMI—body mass index, FM—fat mass, MM—muscle mass, TL—torso lift, BJ—broad jump, SR—sit and reach, PT—PACER test, SU—sit-ups, PU—push-ups, PLAC—physical literacy (affective and cognitive domains) obtained by PLAYself questionnaire, PA—physical activity obtained by PAQ-C).
Education 14 00391 g004
Table 1. Between-testing reliability of the multiple trial fitness tests in preadolescent children (ICC—intraclass correlation, CI—confidence interval).
ICC95% CI
Trunk lift0.660.61–0.71
Broad jump0.910.89–0.93
Sit and reach0.830.80–0.86
Table 2. Two-way ANOVA results for study variables.
Main EffectsInteraction
GroupGenderGroup x Gender
F-TestpF-TestpF-Testp
Body height3.310.070.780.381.530.22
Body mass0.400.530.290.595.090.03
Body mass index0.420.520.050.824.20.04
Fat mass0.320.570.010.947.860.01
Muscle mass0.860.360.200.654.000.06
Torso lift0.470.4914.310.0010.010.94
Broad jump6.050.022.680.110.220.64
Sit and reach0.880.3518.820.0010.090.76
PACER1.220.2912.110.0013.470.08
Sit-ups0.730.400.870.350.050.82
Push-ups0.560.467.550.012.380.13
PLAYself0.460.500.001.000.390.53
PAQ-C3.550.060.230.631.170.28
Table 3. Descriptive statistics (means ± standard deviations) for study variables according to gender and age group with post hoc differences (* denotes significant differences between genders, ¥ indicates significant differences within genders).
Third GradeFourth Grade
Boys (n = 27)Girls (n = 25)Boys (n = 27)Girls (n = 28)
Body height (cm)143.79 ± 5.8143.85 ± 6.2147.42 ± 6.29144.93 ± 7.06
Body mass (kg)36.37 ± 7.34 * ¥39.1 ± 8.63 ¥40.54 ± 8.78 *36.49 ± 7.49
Body mass index (kg/m2)17.49 ± 2.8 *18.83 ± 3.54 ¥18.32 ± 3.0517.24 ± 2.47
Fat mass (%)22.86 ± 4.08 *¥25.78 ± 5.5725.64 ± 6.43 23.55 ± 5.2
Muscle mass (%)43.67 ± 2.3142.52 ± 3.8542.08 ± 3.6343.26 ± 2.95
Torso lift (cm)16.62 ± 3.88 *19.45 ± 5.1917.46 ± 4.45 *20.48 ± 3.94
Broad jump (cm)134.79 ± 19.38131.00 ± 13.58145.71 ± 20.63137.16 ± 22.15
Sit and reach (cm)42.41 ± 7.72 *53.00 ± 15.2741.75 ± 11.4 *55.00 ± 9.69
PACER (ml/kg/min)56.65 ± 6.81 *50.85 ± 4.554.63 ± 6.552.32 ± 3.9
Sit-ups (reps)12.24 ± 8.4613.82 ± 13.929.83 ± 6.9112.32 ± 10.17
Push-ups (reps)8.97 ± 6.39 *6.5 ± 6.0511.73 ± 9.96 *6.2 ± 6.79
PLAYself (score)71.6 ± 13.3173.06 ± 10.6675.18 ± 8.6973.57 ± 10.99
PAQ-C (score)3.38 ± 0.623.43 ± 0.683.69 ± 0.383.48 ± 0.6
Disclaimer/Publisher’s Note: The statements, opinions and data contained in all publications are solely those of the individual author(s) and contributor(s) and not of MDPI and/or the editor(s). MDPI and/or the editor(s) disclaim responsibility for any injury to people or property resulting from any ideas, methods, instructions or products referred to in the content.

