Abstract
Life cycle diagrams communicate the developmental life stages of an organism. Design choices may inadvertently communicate additional information about survivorship rates, genetic variation, and microevolutionary change. In this controlled experiment, we randomly assigned one of three life cycle diagrams to 684 college students. Each figure included identical life stages of a fictitious organism’s development but differed in (1) the number of offspring (single or multiple) and (2) layout (cyclical or linear). Each participant could reference the figure when answering questions about organism survival, variation among offspring, and variation between generations. Students scored 28–30% higher on questions about survivorship when the available diagram included multiple offspring. Students scored 19–30% higher on questions about microevolution when the diagram layout was linear. Overall, students who received the figure with a linear layout and multiple offspring earned the highest average score (54.5%, or 3.3 of six questions) on the assessment, while students with the traditional figure (cyclical layout with single offspring) scored the lowest average (26.1%, or 1.6 of six questions). These results suggest that figure design affects student interpretations and may assist student learning about ecology and evolution concepts and common misconceptions.
1. Introduction
Life cycle figures are ubiquitous in biology textbooks and related educational media. The figures convey information about organism development and life history, as well as related concepts such as parasitic disease transmission, alternation of generations, sexual and asexual reproduction, and metamorphosis. The visual display of life cycle information has changed over time from a series of images portraying each life stage to a circular clock-like representation prevalent in today’s science media. This change in design may align more with technological innovation in print and digital media or a scientific shift of focus from identification to processes, rather than with research on the effectiveness of science communication or attainment of educational outcomes. Our experimental study examines learning outcomes associated with various design choices in the life cycle figure and suggests that the current standard design may reinforce student misconceptions of ecology and evolution topics.
Throughout this paper, we refer to the terms “conception” and “misconception”. We define a conception as a student’s interpretation of a scientific concept. Misconceptions, or alternative conceptions, are participants’ responses that do not correspond to scientifically accepted knowledge or explanations.
1.1. Importance of Visuals in Science Education
Biology textbooks at the start of the 20th century contained few figures. For example, Herbert Spencer’s The Principles of Biology (2nd Ed.), published in 1900, contained no images. Over the past century, the number, size, and color of diagrams and photographs in educational resources have increased dramatically [1]. Teachers rely upon published figures for lectures, classroom activities, and assessments [2]. Many research studies show that figures, closely aligned to text material, positively influence student educational outcomes related to reading comprehension, recall of vocabulary, and application of material [3,4,5,6,7,8,9,10].
The educational importance of figures calls for thoughtful and careful design decisions. However, many instructional figures include errors or reinforce common misconceptions [11,12]. Students, when asked to draw a concept, often recreate the image that appeared in their textbook or course materials, including any errors [13,14,15]. Therefore, research into the effects and effectiveness of figure design supports pedagogical decision making, teacher preparedness, and curricular planning.
1.2. Historical Variation in Life Cycle Figures
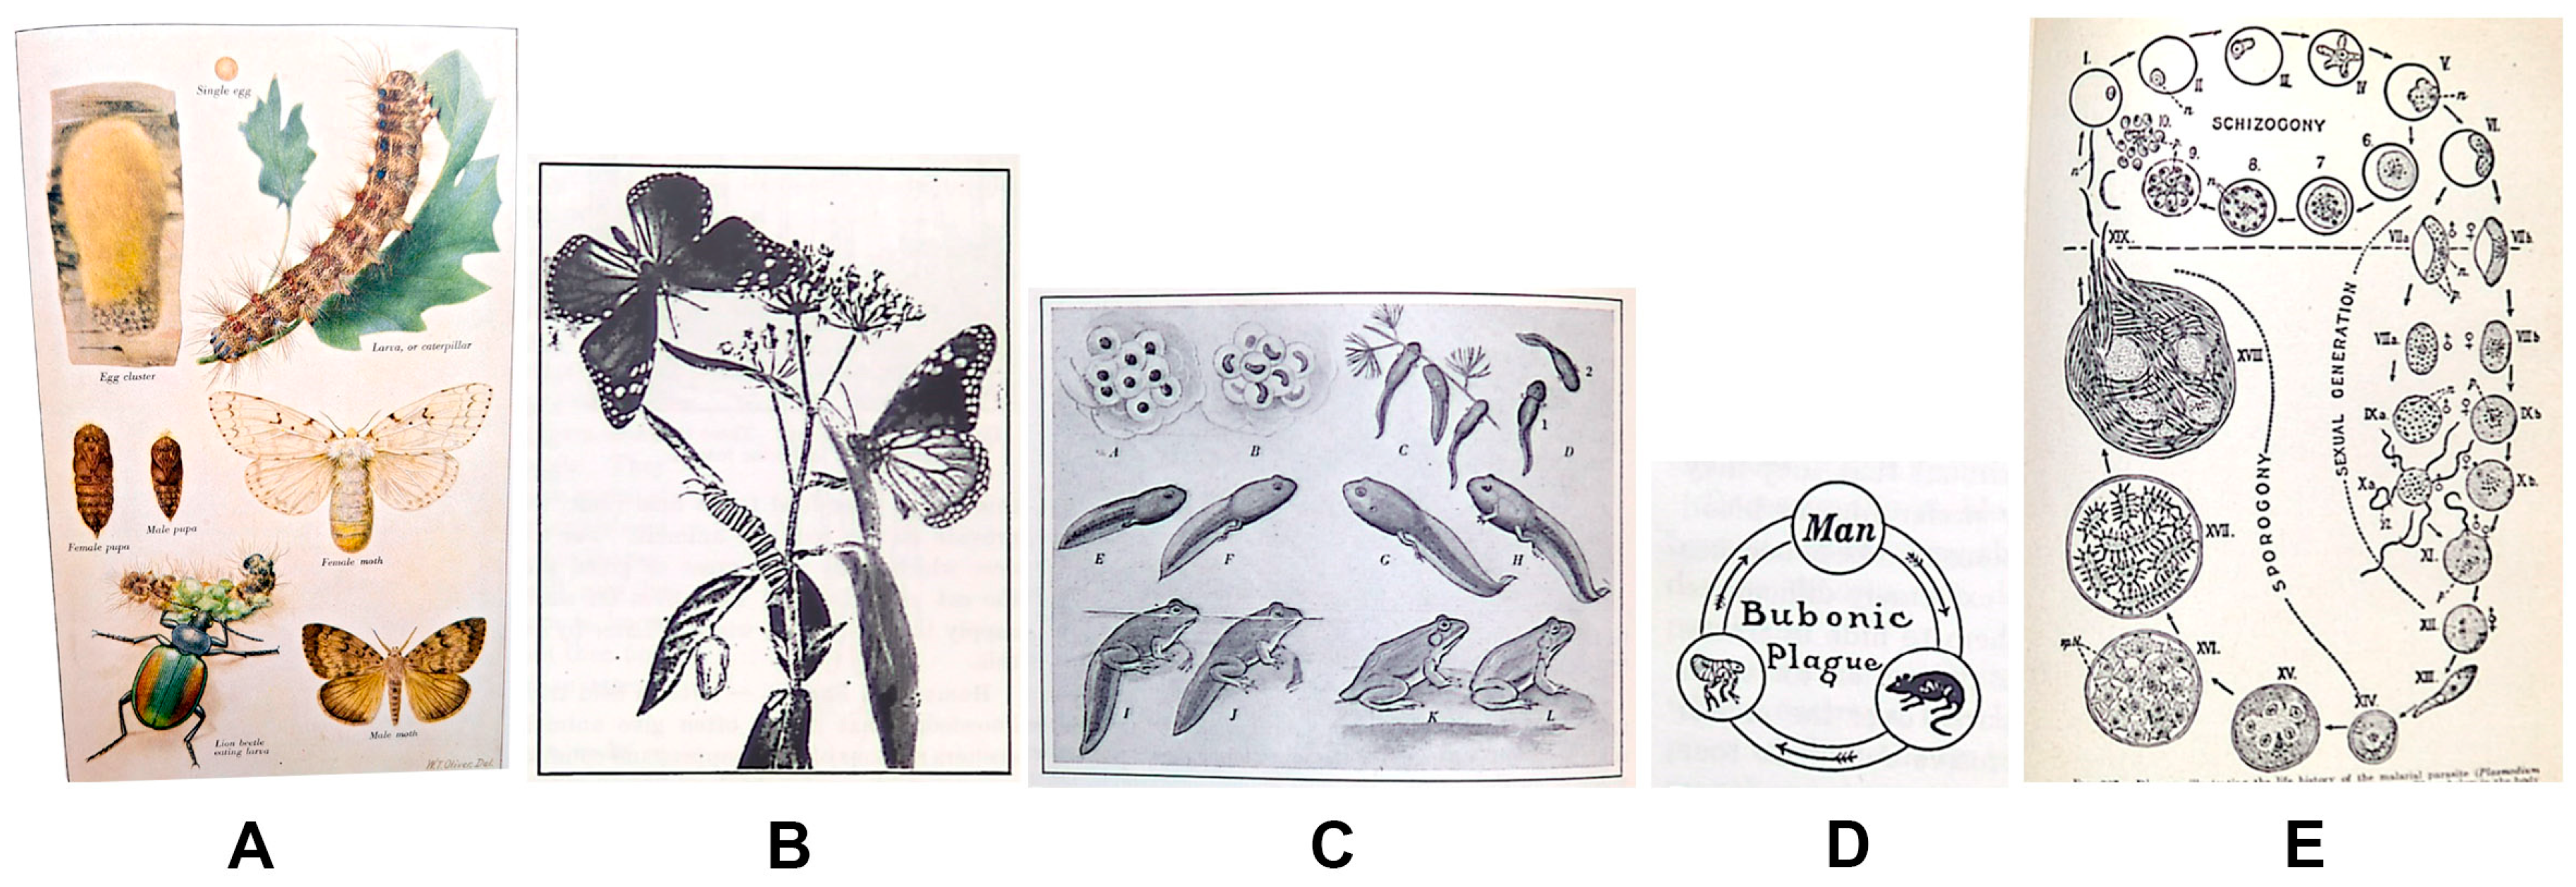
Today’s standard life cycle figure is circular, progresses in a clockwise direction, and illustrates one representative of each developmental life stage. This design evolved from illustrative plates that presented various life stages, often with magnified anatomical details or cross-sections, compiled for the function of identification (Figure 1A). The arrangement of figure elements on these plates focused on aesthetics or maximized the number of images, subsequently reducing the expense and challenge of printing and binding figures into books or other publications. As printing technology advanced and complex visuals could be included with the text on a printed page, biology textbooks incorporated figures of organism development in a scenic or linear layout. Early biology textbooks show “life history” or “development” figures as a composite of life stages or a habitat (scenic) drawing with developmental stages scattered throughout (Figure 1B). Most depictions of life stages in textbooks published before 1950 occur in a linear format, read from left-to-right and line-by-line, like text (Figure 1C). If circular life cycle figures are included in these early texts, they are small, simple diagrams depicting hosts of parasitic infections or disease (Figure 1D). The precursors of today’s standard life cycle figure increasingly appear in biology textbooks between the 1940s and 1970s, starting with life cycles of parasites and then expanding to the life cycles of insects, plants, and other organisms (Figure 1E). By the 1980s, circular diagrams of life cycles were ubiquitous in biology textbooks.
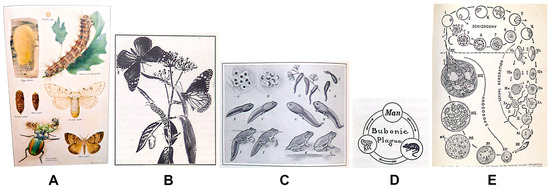
Figure 1.
Types of life cycle figures appearing in biology textbooks over time. (A) Color plate of gypsy moth life cycle, in Biology for Today by Curtis, Caldwell, and Sherman (1934) [16], plate opposite p. 200; (B) metamorphosis of monarch butterfly, in Biology for Beginners by Moon (1921) ([17], p. 210); (C) life history of a frog, in Biology for Today by Curtis, Caldwell, and Sherman (1934) ([16], p. 216); (D) life cycle of the bubonic plague, in A Civic Biology by Hunter (1914) ([18], p. 227); (E) life history of the malarial parasite, in Fundamentals of Biology by Haupt (1940) ([19], p. 327).
The transition between scenic/linear and circular layouts could have been prompted by increased knowledge of and research into the development of parasites. Scenic/linear figures emphasize identification of various life stages, rather than the transition or development between them. Other possible reasons for the shift in layout are educational. The cyclical layout would have been new and unusual, eliciting more engagement from students, educators, and biologists. In addition, cyclic figures are comparatively easier to use than scenic figures. It can be challenging to locate all life stages in a scenic figure, and the progression of life stages is not indicated. Linear layouts with multiple rows require figure labels to determine the order of life stages. Difficulty in reading these figures increases when animals face different directions, leading a viewer’s eye to misread the progression from one line to the next (as seen in Figure 1C). An unlikely yet possible complementary reason for the shift from linear to cyclical formats may have been the rise of anti-evolution sentiments in schools during the period from the 1920s to the late 1960s [20]. Cyclical layouts imply a constant return to an original condition, or an absence of change over time.
While today’s standard life cycle is portrayed in a circular format, other cyclical biological processes or time-based events often use a linear arrangement (e.g., mitosis or the cell cycle, bacterial reproduction, and the menstrual cycle). Menendez et al. [15] examined student preferences and influences of timelines versus time cycles and found no significant difference in content learning between the different layouts. Therefore, the shift in life cycle figures over time is likely the result of factors other than educational learning outcomes, such as aesthetics, social influences, technology advances, a shifting focus in scientific research, or communication standards of the time.
1.3. Design Challenges of Life Cycle Figures
Creating a figure involves a myriad of design choices related to the number and scale of elements, labels and other text, colors, lines or arrows, and the placement or juxtaposition of objects. Changes to any of these variables may affect how the figure is interpreted by viewers. For example, an arrow placed in the figure of a food web could lead from herbivore to carnivore, indicating the flow of energy or carbon in an ecosystem. Reversing the arrow implies animal behavior (i.e., the carnivore seeks its prey). A student in an introductory biology course interchanged the two interpretations and expressed confusion as to why an herbivore seeks out a carnivore for the purpose of being eaten.
The standard life cycle figure has several design challenges that can lead to misconceptions or miscommunications. The first challenge relates to reading a circular image. People are generally proficient at reading in one direction. The circular format of the life cycle figure forces a viewer’s eye to travel in multiple directions; one direction will invariably create a conflict between reading the visual and reading text labels. While clockwise directionality should lower cognitive load for students due to the basic skill of reading analog clocks, students of the digital age are struggling with the skill to the degree that some educational systems have replaced analog clocks during standardized testing [21]. These students may face greater cognitive loads or more reliance on arrows when interpreting life cycle figures. In addition, some life cycles include one or more circles which occasionally reverse direction from clockwise to counterclockwise.
Second, the arrows in life cycles often communicate multiple meanings. While most arrows are interpreted as “develops, grows, or transitions into”, an arrow from a mature adult to offspring should be interpreted as “produces”. Other arrows placed in these figures indicate a fertilization event, movement of a parasite into a host, change in magnification, or a structure label. In many cases, these arrows are identical in size, shape, and color. Some life cycles split arrows at confusing locations, indicating multiple organisms or a change in magnification despite the pre- and post-space occurring in the same individual. Arrow design often conveys different meanings to readers. In a study by Wright et al. [22], a solid arrow shown in a cellular process conveyed a single step to students, while a dotted arrow conveyed time passing. Many graphic design elements are not standardized and may differ arbitrarily based on the decisions of the designer.
Third, life cycle figures have functions beyond the identification of an organism’s life stages or developmental transitions. These ancillary functions include detailed anatomy identification, ploidy information, processes or actions within various structures, habitat or environmental conditions of each life stage, descriptions of transitions from one life stage to another, and the timing of each life stage. For these reasons, life cycle figures often confuse or overwhelm students [23].
Life cycle figures intentionally convey information related to the primary function or ancillary functions. The figures can also unintentionally communicate messages to students. This unintentional communication is the focus of our study. For instance, a life cycle figure may communicate about the number of offspring an organism produces, genetic variation among those offspring, the speed of development or growth, intra- or interspecies interactions, ecological roles, teleology, and survival rates.
1.4. Focal Concepts of This Study
Our study focuses on unintentional messages communicated about ecology and evolution in life cycle figures. Many student preconceptions about ecological concepts of survivorship and over-reproduction develop from their own experiences and cultural norms. Humans in industrialized communities have low reproductive rates and high survival. In addition, most organisms familiar to students are domestic animals and charismatic megafauna, which also produce few offspring with relatively high survival rates. Therefore, many students expect all populations to have similar high survivorship. However, few species, including megafauna, experience this high rate of survival. For example, only half of polar bear cubs survive their first year of life [24]; elephants and dolphins experience 25–30% mortality during their first year [25,26]. Historically, humans had a similar mortality rate during the first year of life, though global infant mortality today is less than 3% [27]. Most species of plants and animals produce large numbers of offspring, which experience low survivorship. Fewer than 10% of sea turtle nestlings survive to reach the ocean. Around 2% of acorns survive past the sapling stage of development [28]. Insect survivorship is low yet variable. Potato beetles have 74% egg mortality, and only 1 in 60 swallowtail butterflies survive to adulthood [29,30]. A misconception about the mortality rate before adulthood impacts understanding of ecology as well as the evolutionary concepts of natural selection and differential survival.
Life cycle diagrams also misrepresent genetic variation among offspring and between generations. The presence of a singular organism in each life stage does not convey diversity of offspring, differential fitness, or the struggle for survival. Menendez et al. [31] analyzed life cycle figures in biology textbooks and digital resources and found that 89% of the figures included just one member of each life stage, resulting in a visual lack of within-species variability. Identical members of a species and stable characteristics over time are common misconceptions in evolutionary thinking [32]. The cyclical format of the figure implies that there is no change in traits between generations. Even the term “cycle” defines a series of events that progresses in one direction yet returns to an original condition. For these reasons, we propose that the standard life cycle figure can reinforce or create significant misconceptions in understanding foundational evolutionary concepts.
Working with grades 1–3 (ages 6–8), Sisk-Hilton et al. [33] developed a “life spiral” diagraming activity. Each loop of the spiral indicates one generation. The spiral, progressing from left to right, allows for evolutionary change to occur. This linear aspect of the life spiral representation is designed to demonstrate microevolution and changes in phenotype due to selective pressures.
1.5. Experiment Research Questions and Predictions
Our first question relates to ecological concepts: will a life cycle figure, which varies only in the number of offspring displayed, influence student responses to questions about ecological topics of survivorship and mortality? We predict that students will score higher when presented with a figure that shows multiple offspring in the early stages of development.
Our second question relates to evolutionary concepts: will a life cycle figure, which varies only in layout (circular or linear), influence student responses to questions about evolutionary concepts of genetic diversity among offspring and intergenerational microevolutionary changes? We predict that students will score higher on questions about evolution topics when the figure has a linear layout. A cyclical layout implies that offspring develop into the same form as the parent, continuously returning to the original phenotype. A linear layout, with an adult parent and the offspring that develops into a separate adult, visually allows for the concept of change over time.
Two factors call our predictions into question. First, the cyclical format of the life cycle figure is most common. Familiar images allow viewers to read and interpret the figure correctly due to their experience interpreting the graphical standards [34]. While familiarity with the cyclical layout should reduce cognitive load, we consider that familiarity with linear layouts in reading and other diagrams should eliminate this variable as a concern. Menendez et al. found that both linear and cyclical layouts produced similar results on an assessment of life stage concepts [15]. Second, the change in the number of offspring will add visual complexity to the image, which may increase cognitive load [23]. Since our life cycle is relatively simple compared to many published figures, we do not expect this factor to interfere with students’ abilities to read and process the image.
2. Materials and Methods
We recruited 684 participants from four introductory biology courses, two intended for science majors and two intended for non-science majors. The participants were enrolled in a land-grant, R1 university in the southeastern United States. Most students were incoming freshmen, and this study was conducted during the first week of the school year to limit the influence from college course content.
The survey data were collected anonymously, and we did not request demographic information. The demographics for the university’s undergraduate population overall is 49% identifying as female, 88% recruitment from within the state with 24% from rural counties, 88% under the age of 30, and 68% identifying as white with 20% identifying as Asian, Hispanic, or Black.
2.1. Figure Design
We examined life cycle diagrams published in introductory biology textbooks from the three largest publishers (i.e., Pearson, McGraw-Hill, and Freeman/Macmillan). Figures were coded for layout (cyclical or linear progression), inclusion of habitat context, number of life stages depicted, and number of organisms shown at each stage. Common life cycles included plants (e.g., moss or fern), insects (e.g., butterfly), amphibians, and parasites (e.g., liver fluke or Schistosoma). We developed a “Cyclical–Single” (CS) figure to mimic the most common design elements in these texts: cyclical layout of five life stages with one representative of each life stage. Our figure presented a fictitious organism, based on microscopic plankton and epifaunal animals, generally unfamiliar to the study participants.
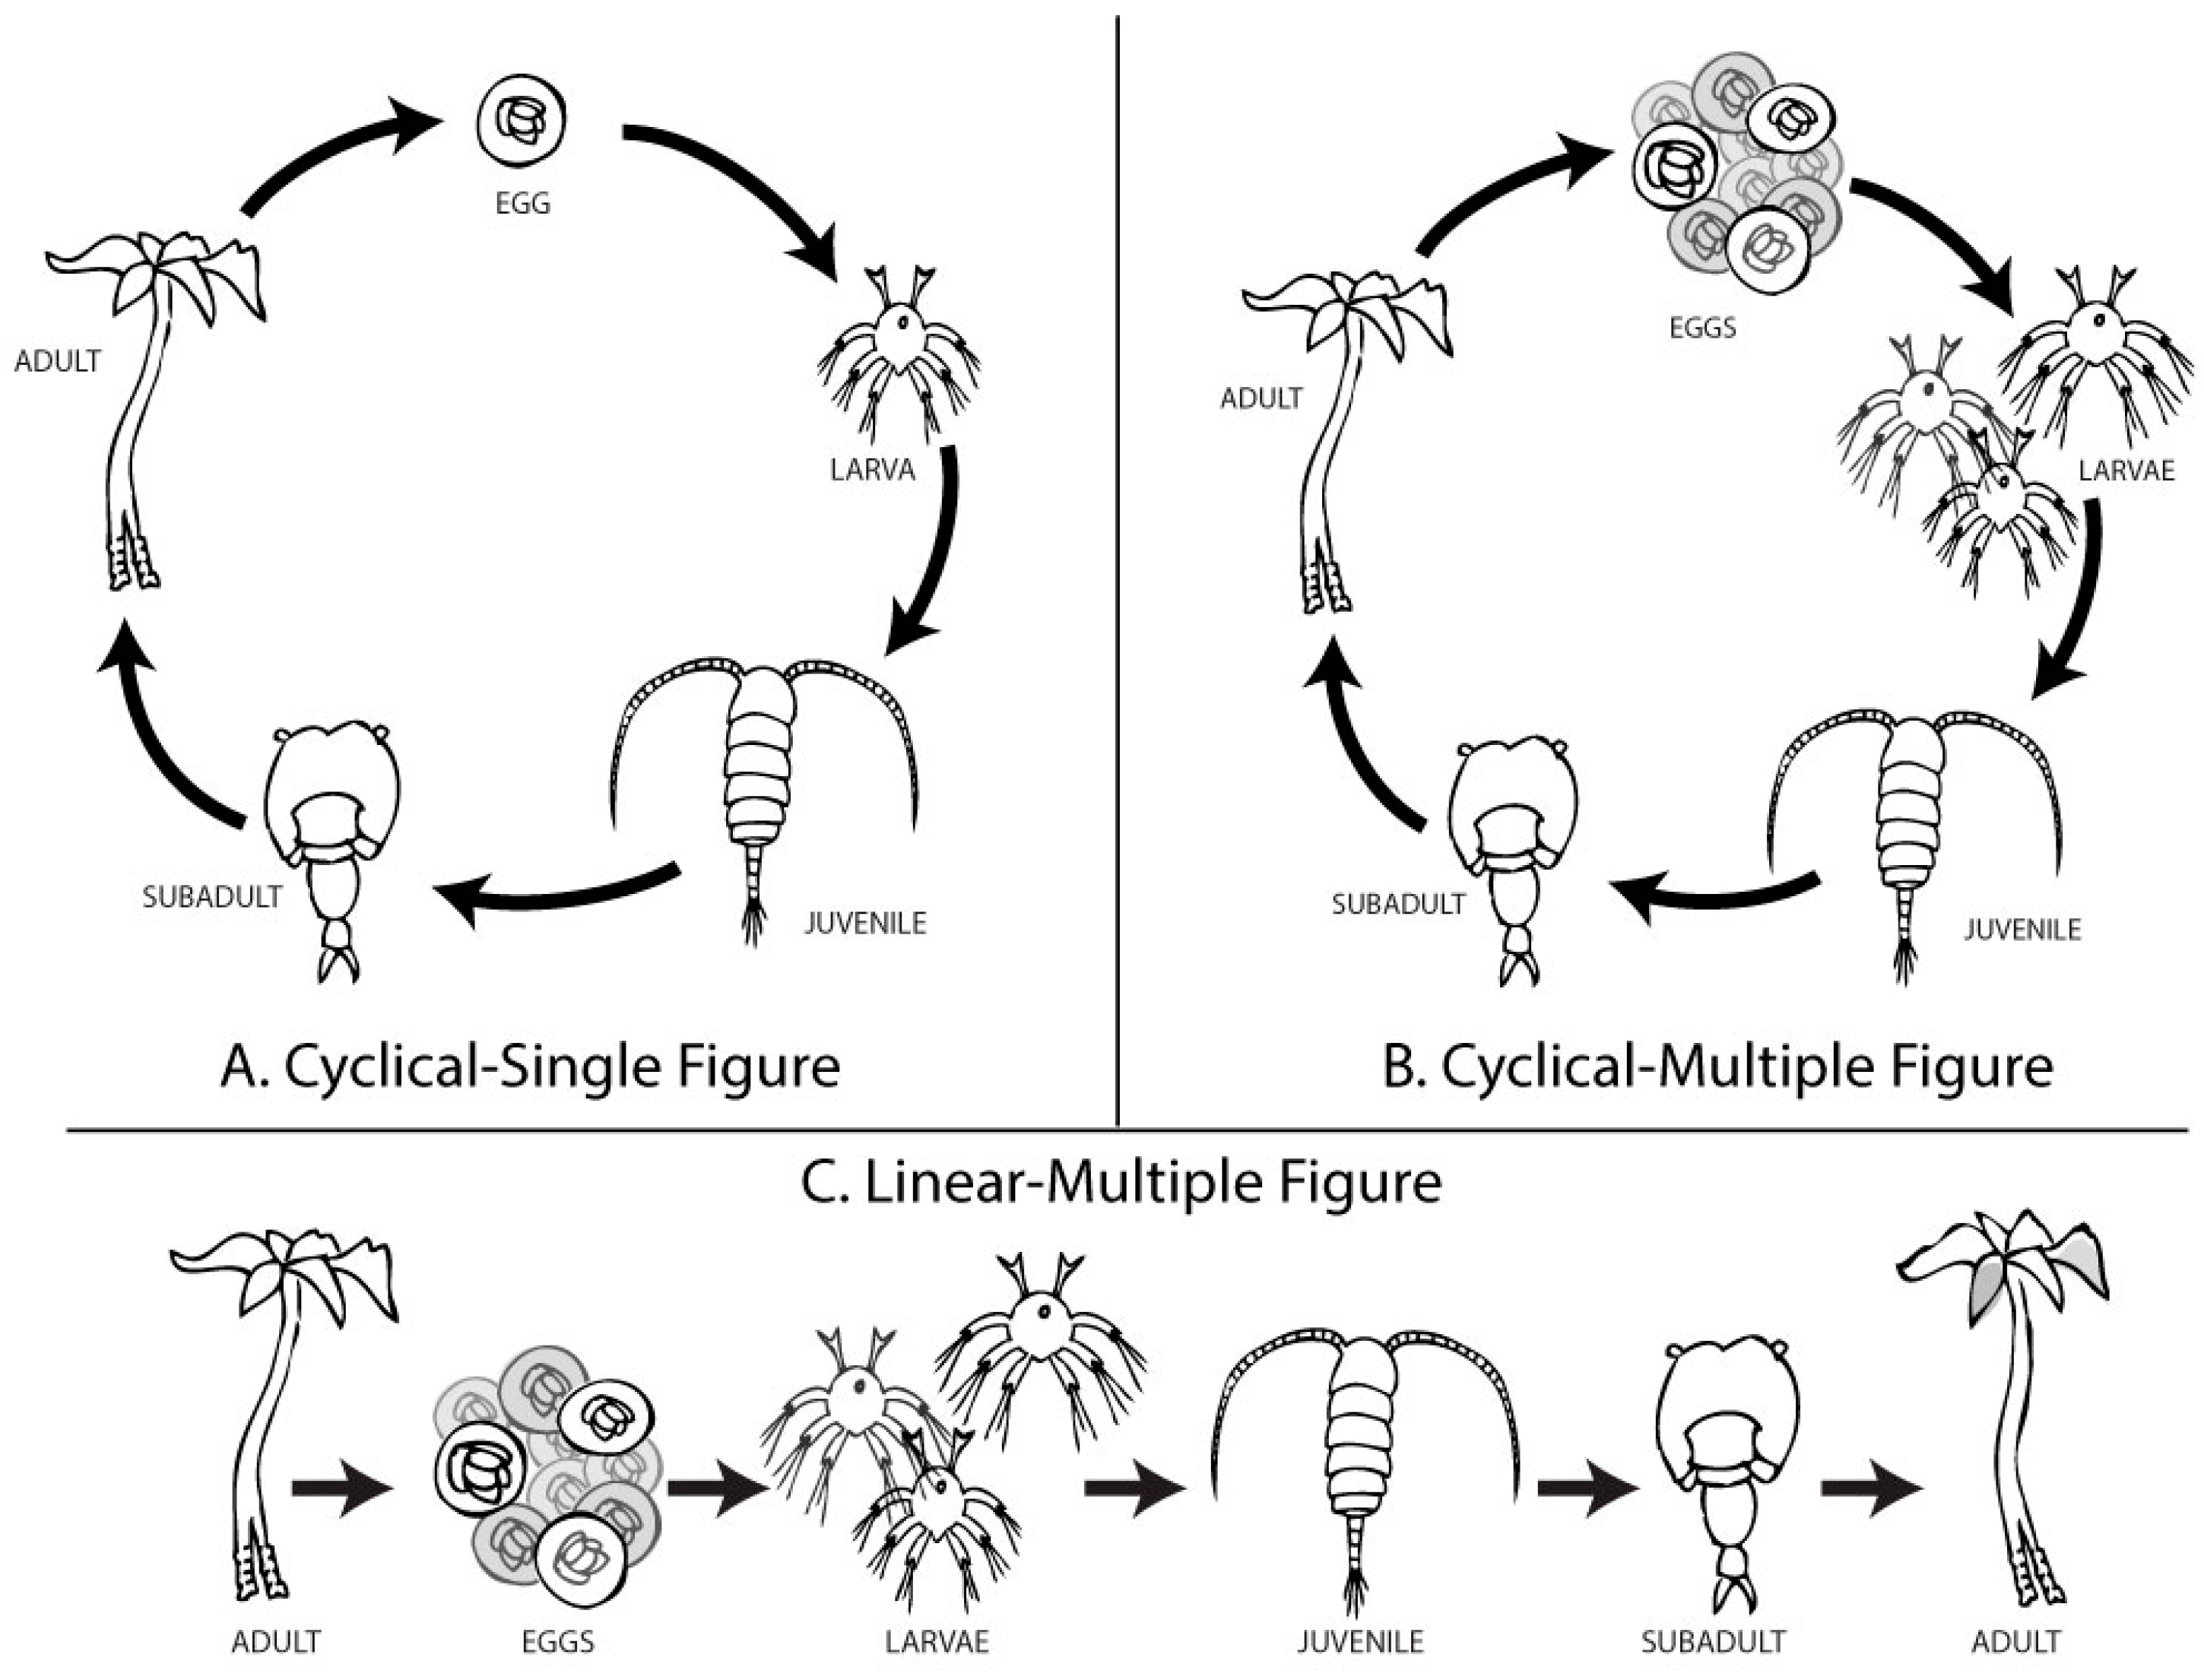
We modified the CS figure to isolate two variables: the number of offspring and the layout. The “Cyclical–Multiple” (CM) figure was identical to the CS image, except it included ten eggs and three larvae. The multiple eggs and larvae slightly varied in shape. We used the CS and CM figures to compare common misconceptions about intragenerational variation, biotic potential, and survivorship. The other figure, “Linear–Multiple” (LM), was identical to the CM image, except the life stages were presented in a linear format, with an adult at the starting position and a slightly altered adult at the end position. We used the CM and LM figures to compare student conceptions about intergenerational variation (Figure 2).

Figure 2.
Three distinct diagrams were developed to visualize an organism’s life progression. (A) The Cyclical–Single (CS) figure used characteristics common to textbook figures showing a “life cycle”. (B) The Cyclical–Multiple (CM) figure was modified to reflect the concept of over-reproduction, with 10 eggs, 3 larvae, and 1 representative of each further life stage. (C) The Linear–Multiple (LM) figure was identical to the CM figure but was arranged from left-to-right, starting and ending with adults. Each adult, each egg, and each larva displayed very slight variations in phenotype. A comparison between CS and CM figures isolates the independent variable, the number of offspring. A comparison between CM and LM figures isolates the independent variable, the layout.
We did not include a version of the figure reflecting Sisk-Hilton’s “Life Spiral” layout since it displays multiple generations. Each figure included in this study (CS, CM, and LM) visually portrays one generation and may imply others.
2.2. Survey Development
The pilot survey included 16 multiple-choice and open-ended questions based on our research questions and published records of common ecological and evolutionary misconceptions [35,36,37]. We recruited a convenience sample of 53 students from the university’s Student Center. These participant responses were used to clarify survey questions, convert open-ended questions to multiple-choice by using common student responses to create distractors, and ensure that the questions were at a sufficient difficulty level. The survey included question replicates for each concept to ensure reliability. For example, the survey included mortality questions: “On the diagram, circle where death is most likely to occur?” and “At what life stage is death most common? Explain why you selected this stage.” While both questions resulted in similar responses, the former was easily converted to a multiple-choice question since every respondent selected one of the five life stages rather than multiple life stages, the entire life cycle, or an arrow between stages. The latter question was converted to one about cause of death, with student responses used as answer options. We removed a general question that served as a check for unanticipated student responses (“Explain the stages of this diagram”). We also expanded two questions, converting one about the number of generations to an open numerical response, and increasing answer options to “What percentage of offspring survive to adulthood?” For our final survey, we used questions with difficulty levels (percent correct) between 0.2 and 0.8 (20–80%) to maximize the range of responses, and discrimination indices above 0.35 to strengthen the validity of the survey [38]. The final survey included the following questions:
- 1.
- Approximately what percentage of offspring survive to adulthood?
- [0% (none)|10% **| 25% *|50%|75%|90%|100% (all)]
- 2.
- Death is most likely to occur at which life stage?
- [Egg **|Larva *|Juvenile|Subadult|Adult]
- 3.
- ‡ What factor MOST affects the survival of an organism’s offspring?
- [Competition with other offspring|Genetics|Environmental conditions|Predation|Other (with text entry)]
- 4.
- Do the offspring of an organism vary between individuals?
- [Yes **|No]
- 5.
- Will the offspring grow to have identical or different traits compared to its parents?
- [Identical|Different **]
- 6.
- What is the LEAST number of generations required for change to occur in a species?
- [open-ended numeral response; 1 **]
- 7.
- Will this species undergo changes in each new generation?
- [Yes **|No]
- 8.
- ‡ What do the arrows on this diagram indicate?[Time|Growth|Reproduction|Transition|Evolution]
(** Full credit response, 1 point; * partial credit response, 0.5 point; ‡ feedback solicitation only with no credit for any response.)
Questions 3 and 8 were removed from the survey’s total score since no response was distinctly correct. For questions 1 and 2, addressing survivorship, we awarded full credit for the double-asterisked responses (10% and Egg) and half-credit for the next closest response (25% and Larva) to reflect the likelihood of survival/death. A common misconception, based on teleological thinking, is that all offspring survive to adulthood. Question 4 addresses the variation of traits among offspring. Questions 5, 6, and 7 focus on microevolution. The questions were re-ordered to separate similar topics. Each participant was awarded a total score of 0 to 6 points.
We acknowledge that eight select-response questions do not fully address student conceptions. The survey required a small amount of the participants’ time, the questions could be graded objectively, and the strength of each question could be confirmed with the use of item statistics. This consolidated survey focused on common misconceptions at the nexus between life cycle imagery and ecology–evolution topics.
2.3. Experimental Design
Students were offered a small amount of extra credit for volunteering to participate in this experiment during the first week of the semester. Of the 753 students enrolled in four introductory biology courses, 733 completed the survey. Responses were removed from our data set if the survey was not completed or if the participant was under the age of 18. This resulted in 684 participants.
Students were supplied a link to an online survey. The survey was comprised of one computer-randomized image (one of the three life cycle diagrams) followed by the eight-question survey. The instructions suggested that students refer to the diagram when answering the questions, focusing our study on the impact the graphics have on student responses rather than on student preconceptions. The figure and survey questions were displayed on the same page. To maintain anonymity, participants submitted their survey and then were redirected to a separate form to record their name and class for participation credit.
2.4. Data Analysis
We calculated the difficulty level and discrimination index for each question. The six questions used to calculate each participant’s total score had discrimination indices above 0.35. We calculated 95% confidence intervals for these total survey scores for each treatment group and conducted an ANOVA for total scores between groups and individual question scores between groups. For comparisons between Yes/No questions, we used Chi-squared tests to determine statistical difference [39].
3. Results
We processed the data by the total score on the survey as well as comparative scores for each question. We present averages on bar graphs with error bars indicating 95% confidence intervals. Line graphs show percentages of student responses; each line totals 100%.
There was no significant difference among the four sections of the introductory biology classes (two intended for science majors and two intended for non-science majors), so the data are presented in aggregate. Since all students completed the survey during the first week of the school year, and the courses are typically enrolled with first-year students, we propose that any differences in college coursework did not impact the students’ responses.
3.1. Total Survey Score
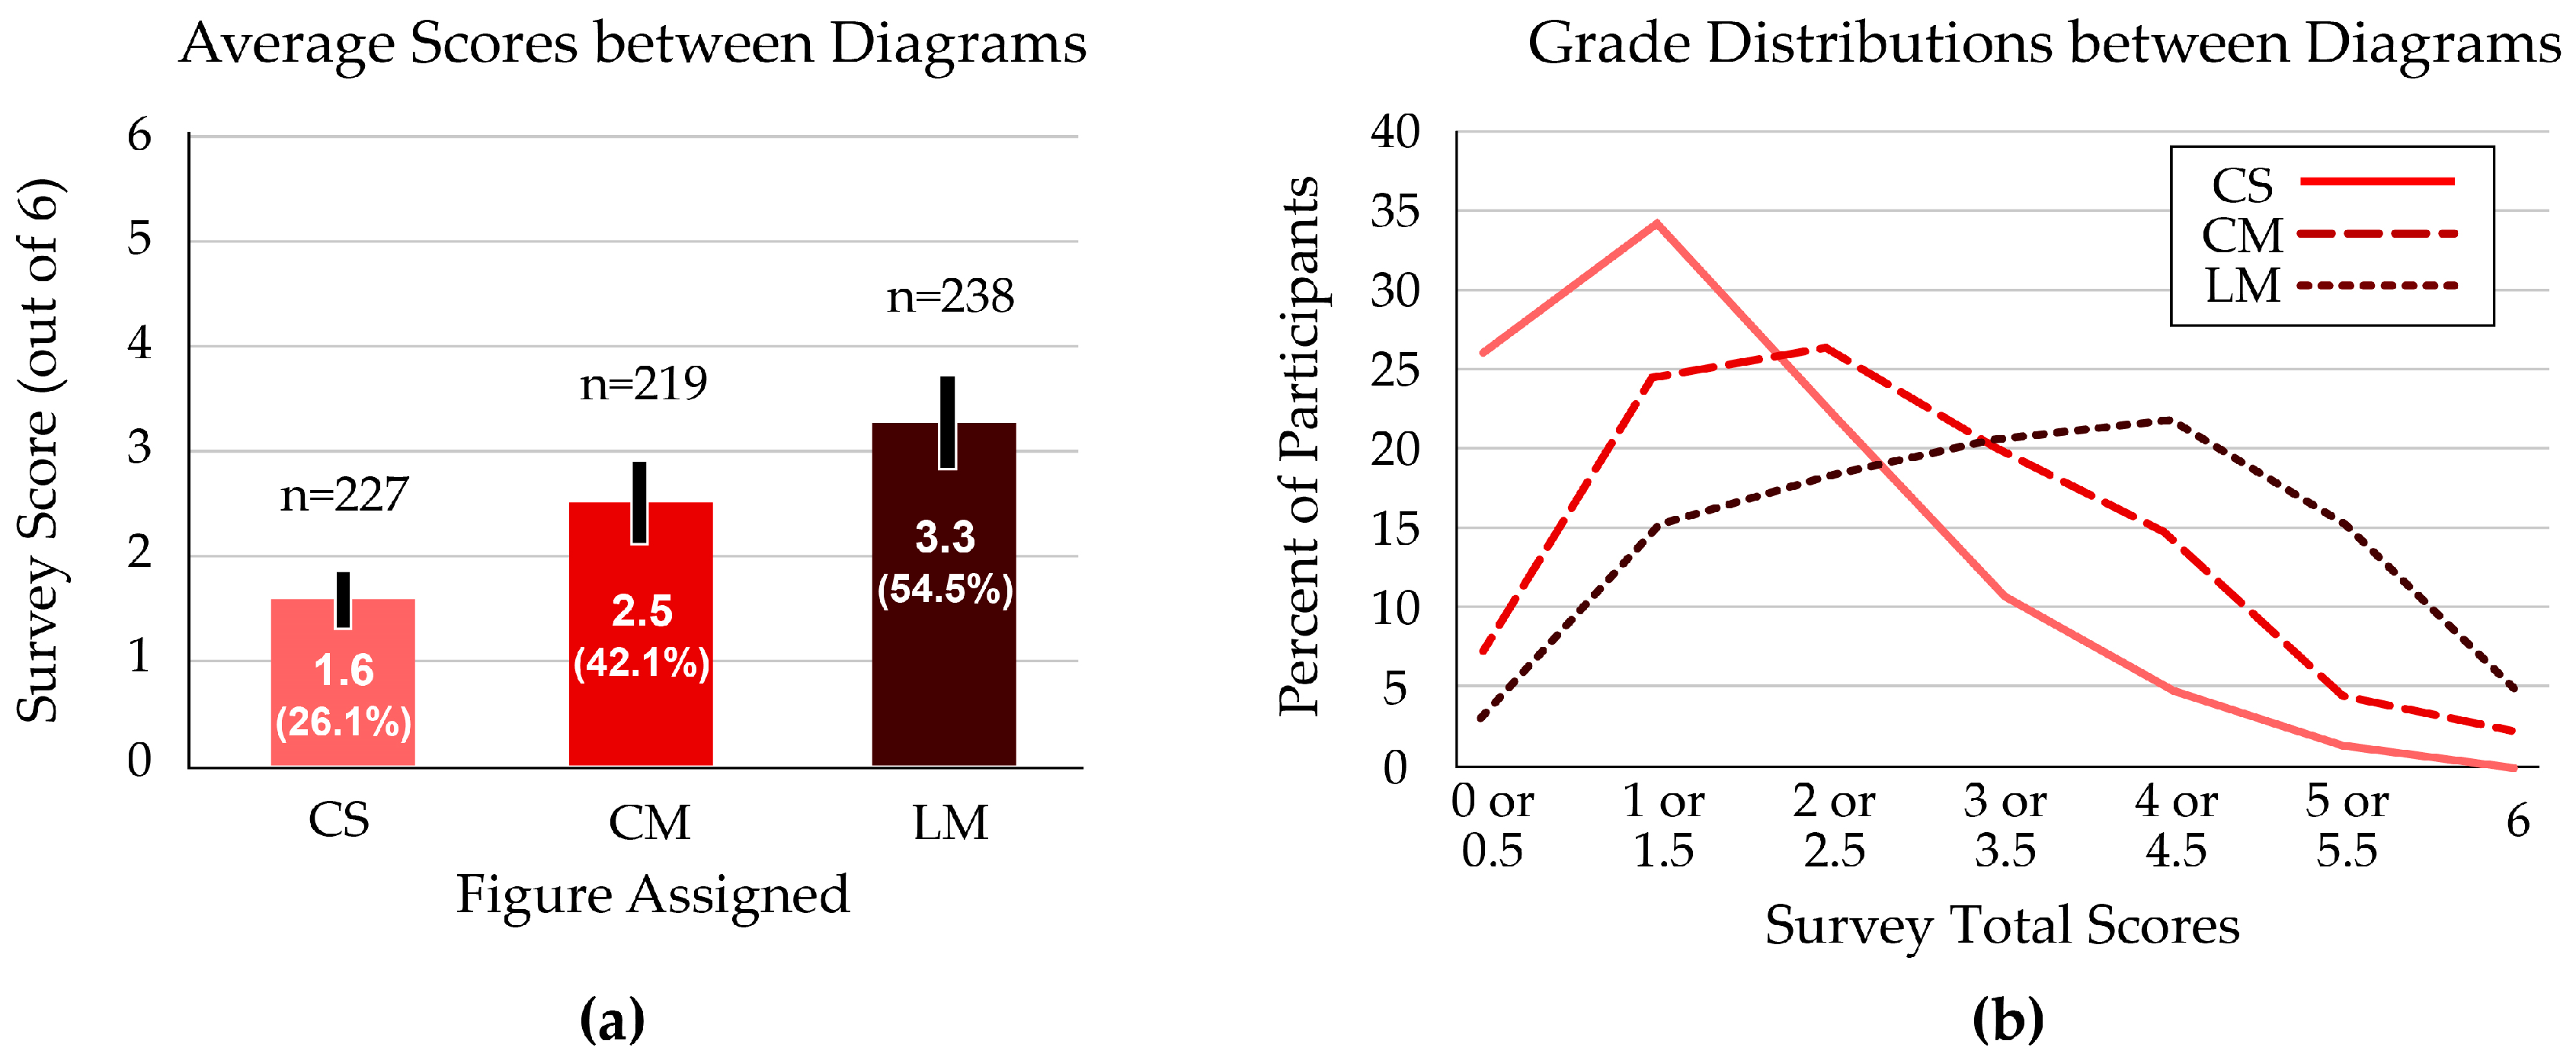
Overall scores were highest when students used the Linear–Multiple (LM) figure, with an average of 3.3 out of 6 questions correct. Students who received the standard Cyclical–Single (CS) figure scored the lowest average total, at 1.6 out of 6 questions (Figure 3a). These scores were significantly different between groups (p < 0.001).
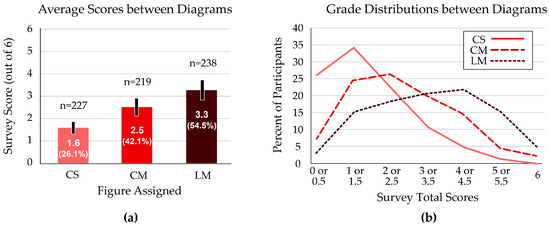
Figure 3.
Total scores on the six-question survey of ecology and evolution concepts. (a) The Linear–Multiple (LM) figure resulted in the highest average score; the Cyclical–Single (CS) figure produced the lowest average score on the assessment. Error bars indicate the 95% confidence interval. (b) The distribution of scores shows a bell-shaped curve for the students who received the Linear–Multiple figure. The Cyclical–Single figure resulted in the most left-skewed (low-score) curve.
The median score among students with the CS figure was 1 or 1.5; the Cyclical–Multiple (CM) figure performance peaked at 2 or 2.5 questions correct; the most common score for students with the LM figure was 4 or 4.5 (Figure 3b).
3.2. Single versus Multiple Offspring
We compared the effect of offspring numbers by using the Cyclical–Single (CS) figure, which displayed one representative of each life stage, with the Cyclical–Multiple (CM) figure, which showed ten eggs, three larvae, and one representative of further life stages. Survey questions relevant to this variable were related to survivorship rates and genetic variation among offspring.
Two survey questions addressed the survival rates of an organism over various life stages. One question (“Approximately what percentage of offspring survive to adulthood?”) focused on the overall survival rate. We scored “10%” with full credit (1 point) and “25%” with half credit. Both diagrams displaying multiple offspring scored significantly higher than the diagram with one offspring (p < 0.001) (Figure 4a).
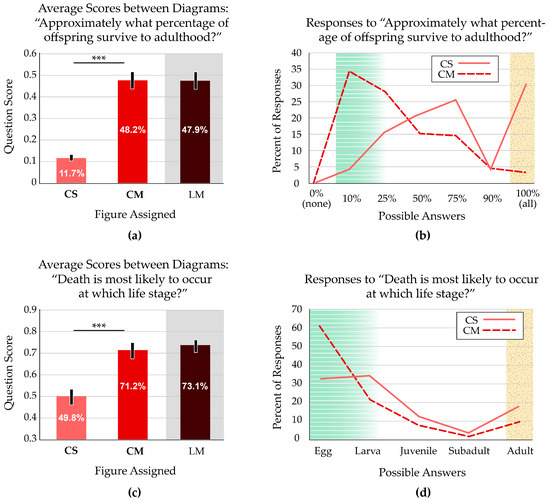
Figure 4.
Participant responses to survivorship questions. White zones on the bar graphs indicate the focal variable addressed in the question; grey zones indicate a treatment with a confounding variable. In the line graphs, green, striped zones indicate answers that reflect prevalence in nature, marked as correct; yellow, stippled zones indicate answers that reflect common misconceptions. (a) Average scores indicate more accurate views of offspring survivorship when students viewed figures with multiple offspring. For the CS and CM figures, which only differed in number of offspring, the average scores are significantly different. Asterisks indicate p < 0.001. Error bars indicate the 95% confidence interval. (b) When viewing the figure that displays multiple offspring (CM), participants generally reported that a small fraction of offspring reach adulthood. Participants viewing the figure with a single offspring (CS) were substantially more likely to report the teleological misconception that all offspring survive to adulthood. (c) Average scores indicate more accurate views of the likelihood of death over the life stages when students view a figure with multiple offspring. The CS and CM figures have average scores that are significantly different. Asterisks indicate p < 0.001. Error bars indicate the 95% confidence interval. Note that the y axis starts at 0.3 to show the same range of values (60%) as Figure 4a. (d) The distribution of responses indicates that most students viewing the figure with multiple offspring thought death occurred at younger ages, reflecting accurate survivorship rates for most organisms. Students viewing the figure with one representative of each life stage also thought that death mostly occurred at younger stages, though not to the same extent. This group had twice as many participants report the misconception that offspring survive to adulthood.
We were particularly interested in the misconception that all offspring survive to adulthood. There was almost a 10-fold difference in this response, with 30.0% of students responding that all offspring survive to adulthood if presented with the standard life cycle image (CS). Just 3.2% of students thought all offspring survive when the image showed multiple offspring (CM). The CM figure also resulted in more accurate views of low survivorship (i.e., 10% or 25%). The two curves are almost mirror images of each other; the CS figure results in the most inaccurate survival rates reported and is skewed toward high rates of survivorship, while the students with the CM figure present the most accurate views that are skewed toward low survivorship. Only one participant selected the illogical “0% (none)” option, supporting the validity of the data (Figure 4b).
The other survival-related question focused on the life stage when death most commonly occurs (“Death is most likely to occur at which life stage?”). We scored “Egg” with full credit (1 point) and “Larva” with half credit. Both diagrams displaying multiple offspring produced similar responses from the participants, which scored significantly higher than the diagram with one offspring (p < 0.001) (Figure 4c).
A common misconception, based in teleological thinking and personal experience with human survivorship, is that death generally affects adults. Almost twice as many students who received the traditional CS figure reported that the life stage when death most commonly occurs is adulthood (17.6%), compared with those who received the modified CM figure (9.1%). Students with the CM figure also responded that death is most likely during the egg stage (60.7%). Just 32.6% of students who received the CS figure reported the same (Figure 4d).
Another concept addressed by the different numbers of offspring (CS and CM figures) was variation among offspring. Genetic diversity within a cohort is foundational for both ecological and evolutionary thinking. Participants were almost twice as likely to report that offspring varied among individuals when presented with the image that showed multiple offspring. The difference was significant (p < 0.001) (Figure 5). The linear layout (LM) resulted in a further improved average score on this question. The additive effect of this confounding variable is addressed below, in Section 3.4.
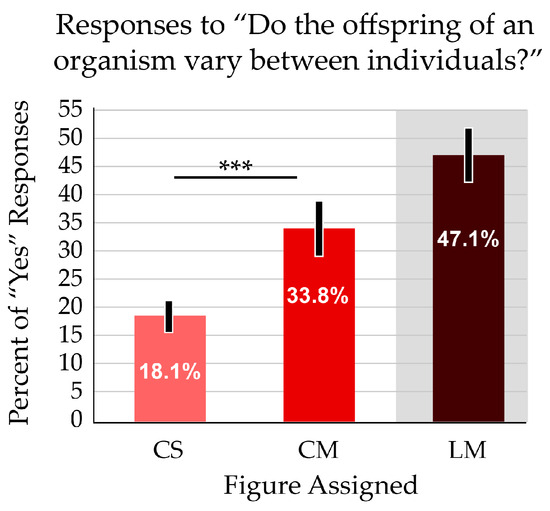
Figure 5.
When presented with a figure showing multiple offspring, participants more often responded “Yes” to the question “Do the offspring of an organism vary between individuals?” The average scores are significantly different. Asterisks indicate p < 0.001. Error bars indicate the 95% confidence interval. The white zone on the bar graphs indicates the focal variable addressed in the question; the grey zone indicates a treatment with a confounding variable.
3.3. Cyclical versus Linear Layout
The cyclical format of the life cycle figure implies that offspring grow into adults that are identical to the parent. We compared the CM figure with the linear version (LM) to address concepts of microevolution.
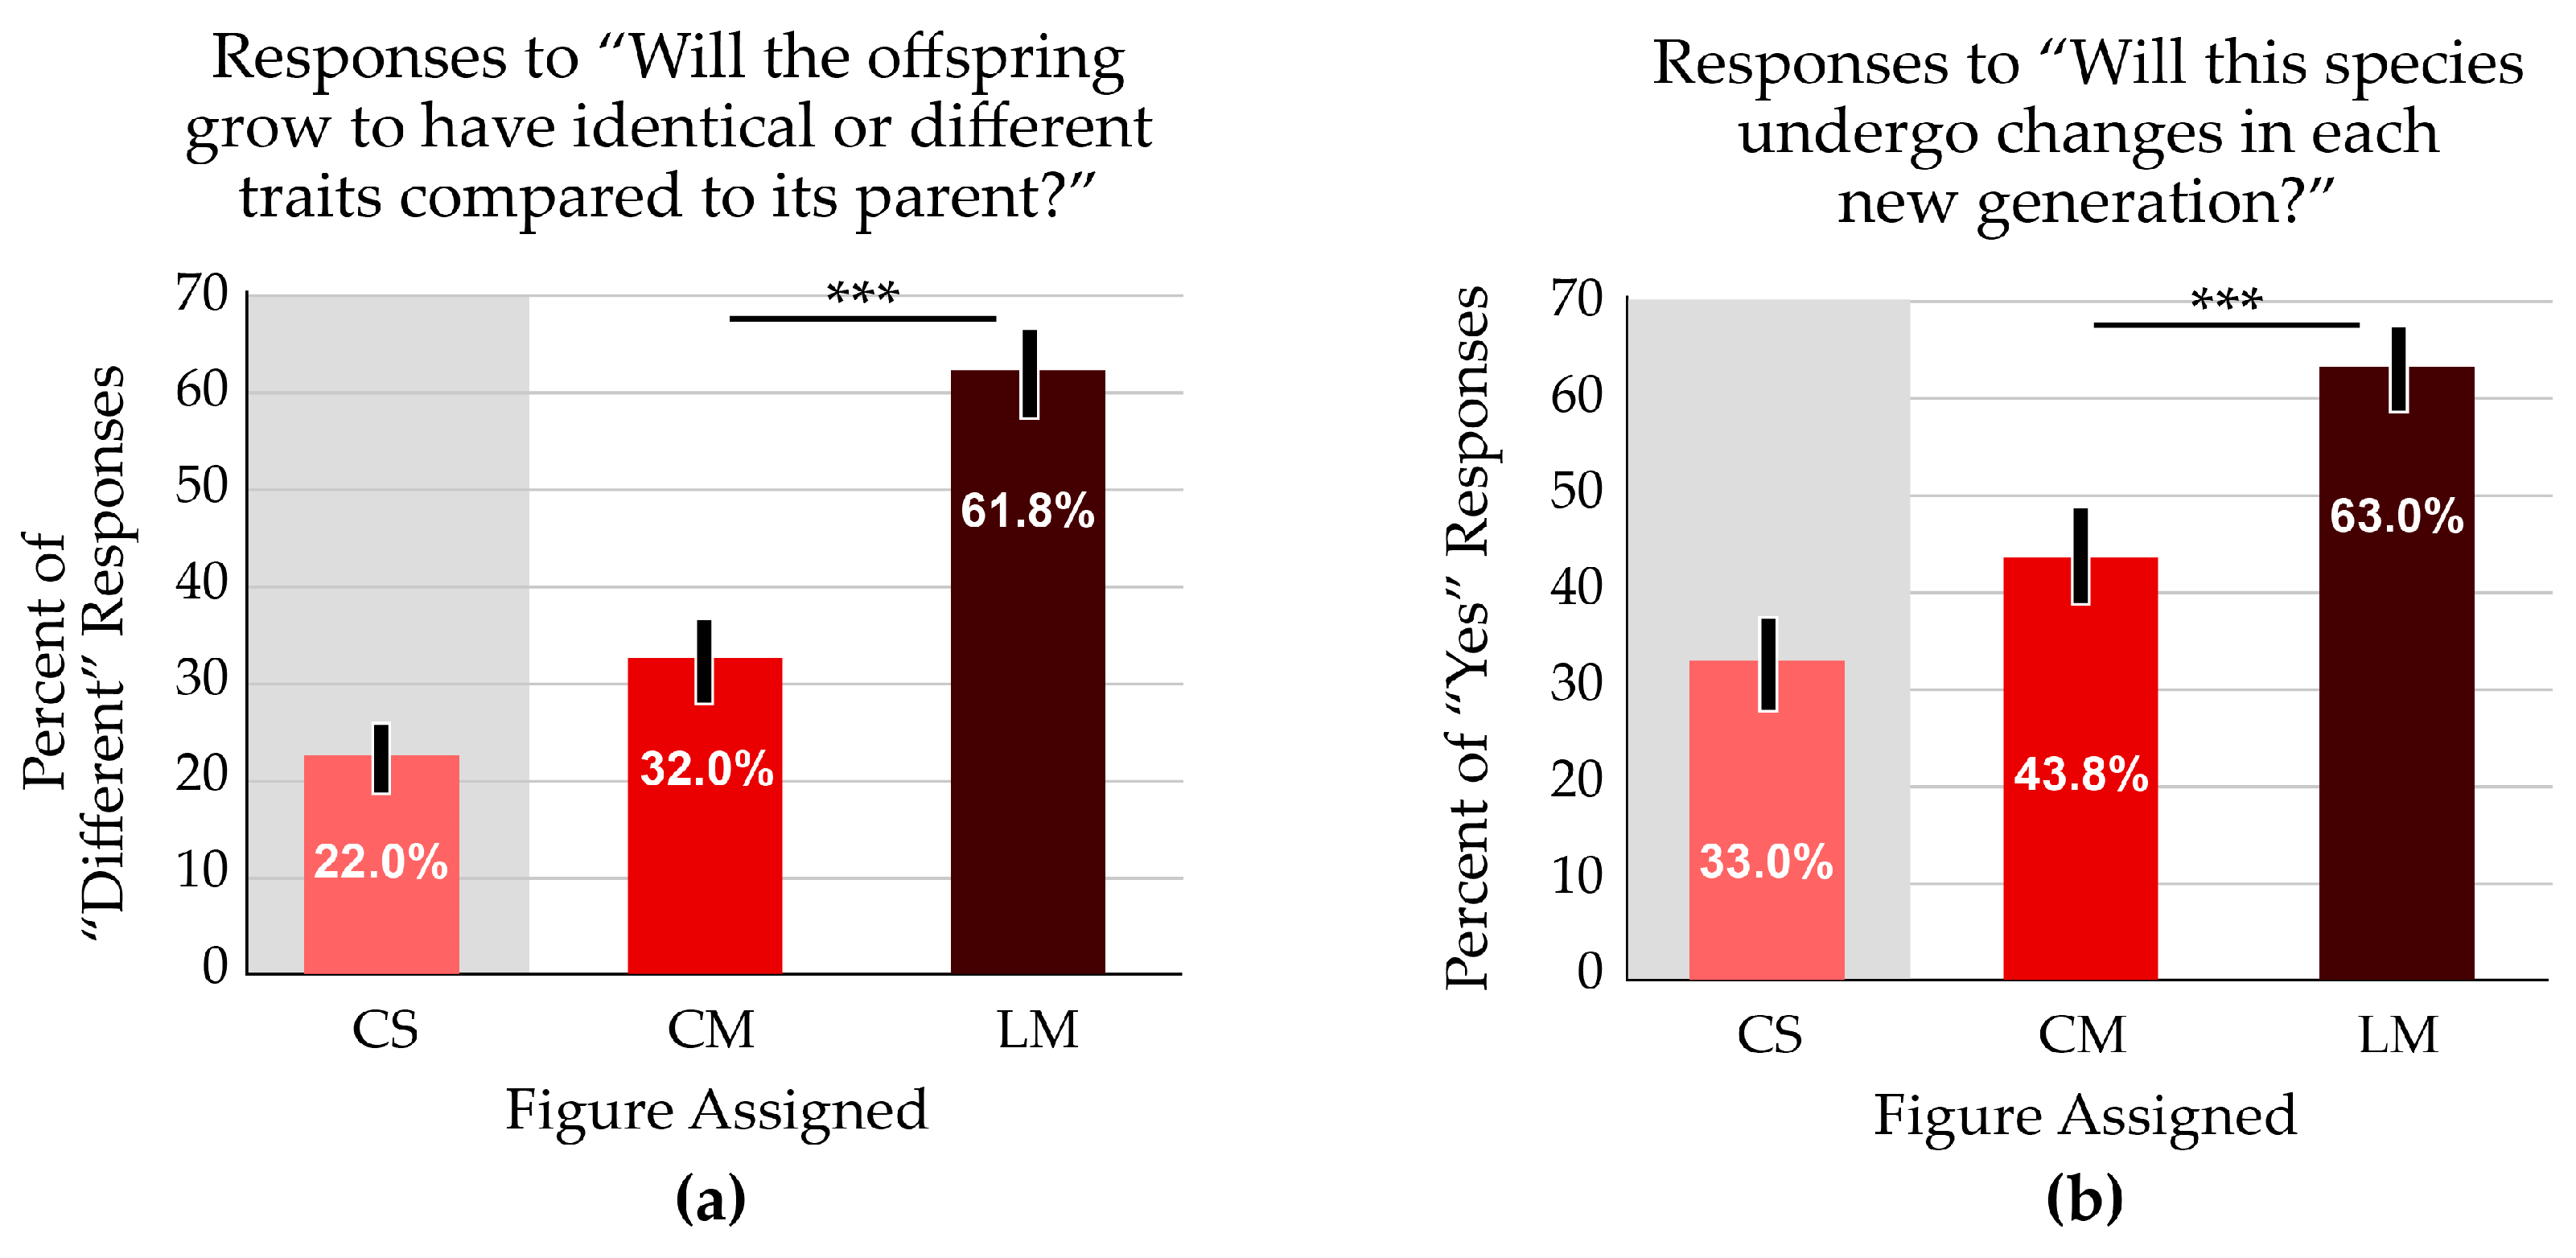
Two survey questions referred to phenotype change over time: “Will the offspring grow to have identical or different traits compared to its parents?” and “Will this species undergo changes in each new generation?” A majority of students (61.8%) who received the linear figure responded that offspring would have different traits compared to the parent; just 32.0% of those who received the cyclical figure answered that offspring would differ from the parent (Figure 6a). Most students (63.0%) who received the linear figure reported that species undergo changes in each generation, whereas 43.8% of those viewing the cyclical figure reported the same. (Figure 6b). For both questions, correct responses were significantly different between the treatment groups (p < 0.001).

Figure 6.
The linear format resulted in better outcomes for two questions that addressed evolutionary thinking. White zones on the bar graphs indicate the focal variable addressed in the question; grey zones indicate a treatment with a confounding variable. The average scores are significantly different. Asterisks indicate p < 0.001. Error bars indicate the 95% confidence interval. (a) Most participants reported that offspring would exhibit traits that differ from the parents when viewing the linear figure (LM). The percentage was almost double the responses from students who received the cyclical (CM) figure. (b) More students thought that a species would undergo changes in each generation when observing the linear figure.
The only open-response question in the survey related to microevolution. Students answered the question “What is the LEAST number of generations required for change to occur in a species?” with any number. The correct number was “1”, indicating that microevolutionary change can occur from one generation to the next. The largest percentage of any response (34.6%) was “1” for students who received the linear (LM) figure. Comparatively, 24.5% of students who viewed the cyclical (CM) figure reported “1” generation (Figure 7). Overall, more than 75% of the students responded with very few generations (< 5), though, indicating that they were not restricted to macroevolutionary thinking. Student responses ranged up to 100,000 generations.
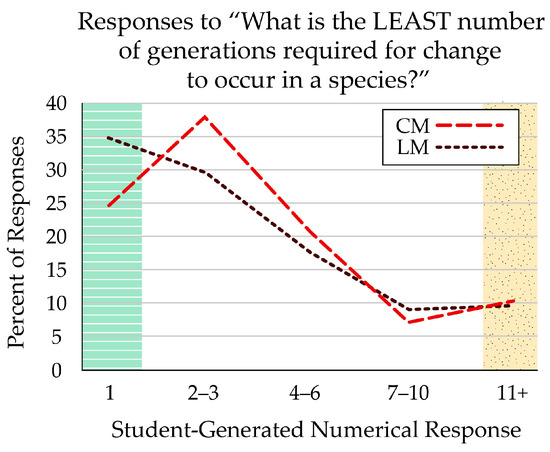
Figure 7.
Students who received the linear-format figure (LM) were most likely (34.6%) to respond that just one generation was required for evolutionary change in a species. Fewer students (24.5%) who received the cyclical-format figure (CM) responded with one generation, though most thought it would take two or three generations. Both formats had similar percentages of students who responded that it would take more than 10 generations for species change to appear. The green, striped zone indicates answers that reflect prevalence in nature, marked as correct; the yellow, stippled zone indicates answers that reflect common misconceptions.
3.4. Potential Additive Effects of Offspring Number and Layout
Each data set addressed above focuses on comparisons between two of the three figures, either differing in number of offspring (CS and CM) or layout (CM and LM). For questions about the survival of offspring, students who received figures displaying multiple offspring responded similarly regardless of layout (Figure 4a,c). These data indicate that interpretations of survivorship benefit from the display of multiple offspring but are not improved with a linear layout.
For questions about variation among offspring and microevolution, however, student responses show a gradient from CS to CM to LM figures (Figure 5 and Figure 6a,b). The percentage of correct responses increases by showing both multiple offspring and a linear format. All means are statistically significant between groups (p < 0.001).
3.5. Other Survey Questions: Arrows and Cause of Death
Two questions had multiple correct answers and were not included in the total survey score. The first question focused on the cause of offspring death (Table 1). The most common selection for cause of death was “Environmental conditions”. Considering that no figure showed any environmental context, the choice was unexpected and indicates that student responses were influenced by their conceptions, even when no visual cues were provided by the figure. The lowest percentage of students selected “Competition with other offspring” when provided with a figure showing a single offspring (CS). This choice was significantly different from the CM and LM figures (p < 0.001). Since the figures did not display cause of death, the students must have inferred that more offspring resulted in more competition.

Table 1.
Most students responded that “environmental conditions” were the leading cause of death among offspring. Fewer students selected “Competition with other offspring” when viewing the figure with a single offspring (CS). The percentages are significantly different. Asterisks indicate p < 0.001.
Another question focused on the meaning of arrows in the figure (Table 2). The greatest differences in responses described the arrows as indicators of “Growth” or “Reproduction”, each producing a gradient of responses from CS to CM to LM, increasing for the “Reproduction” response and decreasing for “Growth”. About 25% of student responses were attributed to figure layout, while around 10% corresponded to the varying number of offspring. The percentages are significantly different (p < 0.001).
Table 2.
A question about the interpretation of arrows in the figure produced opposing results for “Growth” and “Reproduction”. The numbers present a gradient, indicating some additive influences between figure layout and number of offspring. The percentages are significantly different. Asterisks indicate p < 0.001.
4. Discussion
Our data indicate that small changes in the design or elements of a life cycle figure can produce a large effect on student responses to ecology/evolution questions. The common portrayal of a life cycle (cyclical layout with a single representative of each life stage) produces more answer selections aligning with common misconceptions about organism survivorship and evolution. Viewing a figure with a linear layout and multiple offspring produces significantly and substantially better scores on a survey of ecology and evolution concepts. Exposure to the Cyclical–Single (CS) format produces fewer accurate responses to ecology and evolution questions. Biology textbooks and educational media overwhelmingly utilize the CS format, so this study raises questions about the impact of long-term exposure to the figure on student conceptions of life history and selective pressures.
Overall, our findings demonstrate the importance of the careful construction of figures. We suggest that educational figures be created or evaluated using design rules [40] with consideration of common student misconceptions of core concepts in biology [41], and examined or critiqued with criteria for biology image design [42]. In addition, we recommend experimental testing of variable image elements for their impact on student understanding or interpretation.
4.1. Survivorship, Mortality, and Cause of Death
Our first experimental research question asked whether varying the number of offspring would influence student responses about the biological concepts of survivorship and mortality. Based on our data, students are strongly benefited by seeing a larger number of offspring with fewer individuals at each life stage. The students who observed figures with multiple offspring (CM or LM) were eight times as likely to respond with accurate, low survivorship rates for our fictitious organism. The students who observed figures with single offspring (CS) were 10 times more likely to respond with the teleological misconception that all offspring survive to adulthood. Similarly, students viewing the multiple-offspring figures were twice as likely to accurately report that death occurs most often at earlier life stages.
These strong effects warrant further research into student conceptions of figures that display variable numbers of offspring. Our concern that the additional visual elements would increase cognitive load may have some evidence in student interpretation of arrows (Section 4.4, below). However, the benefits to concepts of reproduction and survivorship could outweigh these concerns.
Responses to the question “Approximately what percentage of offspring survive to adulthood?” were also strongly affected by the number of offspring displayed in the life cycle figure. The distribution of responses was skewed to the lower percentages, reflective of most organisms’ life histories, when students viewed figures with multiple offspring. Students with the CS figure had virtually opposite responses, skewed toward high survivorship. A common misconception among students is that most organisms have high survival rates.
The responses may indicate that students’ conceptions are either reinforced or contradicted by the figure. Alternatively, the students may have answered the question literally by counting offspring. In this case, students with the CS figure would have answered “100% (all)”; students with the CM or LM figure would have answered “10%”. Approximately one-third of students selected these corresponding responses, so this is the maximum number of students literally interpreting the question. Further research to investigate the logic behind, or mental processes during, answer selection could elucidate the percentage of students who calculate survivorship based on the visual display of numbers of offspring. We suspect the percentage is low, since no student in our pilot study, with open-ended questions, referred to counting offspring to determine survivorship, interpreting the figure literally.
The question “What factor MOST affects the survival of an organism’s offspring?” also supports this claim that students used their mental conceptions when selecting answers to the survey questions. Most students chose “Environmental conditions” despite no environmental context displayed in any figure. Students were more likely to select “Competition with other offspring” when the figure contained multiple offspring, yet the “Genetics” response was not different between groups. The figures with multiple offspring show very slight differences between individual eggs and individual larvae. These trait differences could have been identified as genetic diversity. Yet no student in the pilot study remarked on these slightly different traits.
Only the number of offspring, and not the layout of the figure, affected student responses to survivorship questions. However, the number of offspring did contribute to student answers to evolutionary questions addressing genetic variation and selective pressures.
4.2. Genetic Variation
The traditional cyclical diagram (CS) only shows one organism per life stage, so within-generation variation cannot be displayed. This observation was addressed as a concern by Menendez et al. [31], who found that “the vast majority of [life cycle] diagrams depicted only one organism per stage (604 of 633 diagrams, 95%)” (p. 10) and that this portrayal “could potentially reinforce the essentialist beliefs that categories are immutable and do not change and that all members of a category look the same” (p. 12). The Cyclical–Multiple (CM) and Linear–Multiple (LM) figures show multiple offspring with very slight variations between them, which may aid the student in applying the idea that offspring vary from each other. We were not able to determine if students registered the subtle variation between offspring or, instead, had mental frameworks influenced by the presentation of multiple offspring. Students who viewed the CM figure were almost twice as likely to report that traits differ among offspring, compared with students who viewed the CS figure. The percentage of students who stated that offspring do not vary was surprisingly high overall (~50–80%), considering that humans see genetic variation among human siblings and domestic animal litters. Additional qualitative research could reveal what level of visible differences can be clearly observed or conceptually internalized, or if a label pointing out phenotypic variation would be required.
The linear format (LM) had the highest percentage of students reporting variation among offspring, despite showing the same set of eggs and larvae as the circular format (CM). This may be an effect of reading left-to-right, which emphasizes the early stages of development.
4.3. Microevolution
Our second experimental research question focused on the cyclical or linear layout of the life cycle figure. The cyclical format, with its implicit message that each generation produces adults identical to every previous generation, resulted in fewer accurate responses about species change over time. The linear layout produced more accurate responses, contributing to 20–30% of the difference about intergenerational change in phenotype.
Tversky, summarizing several of her research projects, found that people create visuals of cyclic processes as a linear image format, which indicates linear thinking about time, but that they prefer observing cyclical displays [43]. She explains this discrepancy by proposing that it is easier to think of time as progressive, whereas cycles present a more abstract view by generalizing multiple, repeating units of time. Interestingly, Tversky differentiates between cyclical processes of cell division (which result in two daughter cells, separate from the parent) and washing dishes (which reuses the same dishes). We propose that, in the case of biological generations, the generalization of repeating units of time is detrimental to student conceptions of evolutionary change.
The linear layout produced better outcomes in our survey questions about evolutionary concepts. To a lesser degree, so did the portrayal of multiple offspring in a cyclical figure. The CM figure produced an additional 10–15% more correct responses than the CS figure. While greater numbers of offspring result in more genetic diversity and more selective pressures, corresponding with more potential for evolutionary change, our data are limited and do not present evidence of this thought process in the study participants. Further research should be conducted to determine if displaying this loss of organisms before reproductive maturity serves as a logic-based bridge toward evolutionary understanding. Sisk-Hilton’s life spiral activity, used with young children who are often considered too young to understand the complexity of survival advantage in evolution, were able to discuss the most likely survivors in various environmental conditions [33]. We recommend qualitative studies to investigate the thought processes that may link numbers of offspring with evolutionary thinking.
4.4. Arrow Interpretation
Both the figure layout and the numbers of offspring affected the participants’ interpretations of arrows. Almost 40% of students with the LM figure reported that the arrows indicated “Reproduction”, when only the first arrow should have been interpreted as such. Therefore, it may be deduced that students viewing the LM figure focused more on the stages at the left-side of the life progression (parent and eggs). The students with the cyclical figures were most likely to report that the arrows indicated “Growth”, which may suggest that they start reading the figure at the top of the circle (12 o’clock position), progressing clockwise from egg to larval stages.
Tversky also reported that participants started labeling circular figures from the 12 o’clock position [44]. The only exception she described was “when the ‘natural’ starting point of a cycle, for example, the one-cell stage of mitosis, was at another position” (p. 26). This could explain the intermediate responses that students assigned the CM figure recorded. The additional eggs may have caused some students to start reading the image from the simplest stage near the top: the single adult near the 9 o’clock position.
Because our figures were simple compared to most life cycle images in textbooks, we did not expect the number of additional offspring to impact student interpretations. Further studies, using eye-tracking technology and moving “start” locations, could clarify how people start reading a cyclical image and whether the additional increase in the number of visual elements (multiple offspring) increased cognitive load, causing students to read the image differently.
4.5. Recommendations for Further Research
We have presented several avenues for further research above to explain or address specific findings of our study. We also provide four recommendations for a modified study design.
First, we did not test a version of the figure using a linear layout and single representative of each life stage. Since our findings indicate that there is an unexpected additive effect between the two variables (number of offspring and figure layout), the inclusion of a Linear–Single figure could expound on this result. We also did not test a version of Sisk-Hilton’s life spiral design [33] since it displays multiple generations. Comparing the life spiral with several generations of the linear layout would test whether one format is easier to interpret, based on the familiarity or simplicity of the image, or whether one or both formats improve evolutionary thinking compared with images displaying a single generation. In addition, we considered the assignment of the CS figure to act as a control since it represents the most common presentation of life cycles in textbooks. Including a ‘No Image’ assignment would indicate average student preconceptions and whether the responses with the CS figure match those preconceptions.
Second, this study could be recreated with another population of students. Most of the participants in this study received their high school education from a southeastern U.S. state. While the geographic region is typically viewed as one with poor evolution education, the state received a high score in a review by the National Center for Science Education [44].
Third, further research is needed to explore the link between students’ observation, or interpretation, of figures and the development of (or change to) their conceptions about science topics.
Finally, our research focused on early college-age participants. These individuals have been exposed to traditional (CS) life cycles throughout their lives, either through formal or informal education or cultural transmission. A similar or long-term study, beginning with K-3 participants, could test whether the image has a larger or more lasting effect on frameworks of ecology and evolution concepts.
5. Conclusions
Educational materials overwhelmingly use a version of the Cyclical–Single figure to display the life stages of an organism. We have demonstrated that this type of figure is associated with responses indicating teleological thinking and misconceptions about survivorship rates and changes in populations over time. A linear progression with multiple offspring portrays the same information about organism development yet results in much improved outcomes for major biological concepts in ecology and evolution. We suggest that a simple change of format could benefit overarching themes of biology without detriment to the primary learning objectives of the life cycle figure.
There may be some concern about using the term “life cycle” if the format is not cyclical. The term “life cycle” had been used for decades before a cyclical diagram was consistently used in the scientific literature. Alternative phrases can be substituted, such as “life progression”, “life stage sequence”, or “developmental stages”.
The most intriguing results of this experimental research were the extremely large effects on student responses caused by very small changes to figure elements. We hope that more research will be similarly conducted to address explicit and implicit messages communicated by variables in other educational visuals.
Author Contributions
Conceptualization, J.M.L.; methodology, A.J.C. and J.M.L.; validation, A.J.C. and J.M.L.; formal analysis, A.J.C.; investigation, A.J.C. and J.M.L.; resources, A.J.C. and J.M.L.; data curation, A.J.C. and J.M.L.; writing—original draft preparation, A.J.C. and J.M.L.; writing—review and editing, A.J.C. and J.M.L.; visualization, A.J.C. and J.M.L.; supervision, J.M.L.; project administration, J.M.L. All authors have read and agreed to the published version of the manuscript.
Funding
This research received no external funding.
Institutional Review Board Statement
This study was reviewed and exempted by the Institutional Review Board of North Carolina State University (protocol code 12679, 18 April 2019).
Informed Consent Statement
Participant consent was waived due to anonymous data collection of course-related content, which is reported in aggregate.
Data Availability Statement
The original data presented in the study are openly available in Dryad at https://doi.org/10.5061/dryad.tb2rbp08t.
Acknowledgments
We thank Kerri Johnson and Katherine Kastl for their suggestions and assistance in collecting data for the pilot study. This project was aided by the Provost’s Professional Experience Program at North Carolina State University.
Conflicts of Interest
The authors declare no conflicts of interest.
References
- Blystone, R.V.; Barnard, K. The future direction of college biology textbooks. BioScience 1988, 38, 5–48. [Google Scholar] [CrossRef]
- García Fernández, B.; Ruiz-Gallardo, J.-R.; Paños, E.; Jiménez, A.M. Teachers’ experience and training with visual diagrams production. J. Vis. Lit. 2024, 43, 13–28. [Google Scholar] [CrossRef]
- Carney, R.N.; Levin, J.R. Pictorial illustrations still improve students’ learning from text. Educ. Psychol. Rev. 2002, 14, 5–26. [Google Scholar] [CrossRef]
- Dechsri, P.; Jones, L.L.; Heikkinen, H.W. Effect of a laboratory manual design incorporating visual information processing aids on student learning and attitudes. J. Res. Sci. Teach. 1997, 34, 891–904. [Google Scholar] [CrossRef]
- Guo, D.; McTigue, E.M.; Matthews, S.D.; Zimmer, W. The impact of visual displays on learning across the disciplines: A systematic review. Educ. Psychol. Rev. 2020, 32, 627–656. [Google Scholar] [CrossRef]
- Jian, Y.-C.; Wu, C.-J. Using eye tracking to investigate semantic and spatial representations of scientific diagrams during text-diagram integration. J. Sci. Educ. Technol. 2015, 24, 43–55. [Google Scholar] [CrossRef]
- Mayer, R.E.; Bove, W.; Bryman, A.; Mars, R.; Tapangco, L. When less is more: Meaningful learning from visual and verbal summaries of science textbook lessons. J. Educ. Psychol. 1996, 88, 64–73. [Google Scholar] [CrossRef]
- Peeck, J. The role of illustrations in processing and remembering illustrated text. In The Psychology of Illustrations: Basic Research; Willows, D.M., Houghton, H.A., Eds.; Springer: New York, NY, USA, 1987; p. 115. [Google Scholar]
- Sagoo, M.G.; Vorstenbosch, M.A.T.M.; Bazira, P.J.; Ellis, H.; Kambouri, M.; Owen, C. Online assessment of applied anatomy knowledge: The effect of images on medical students’ performance. Anat. Sci. Educ. 2021, 14, 342–351. [Google Scholar] [CrossRef]
- Vekiri, I. What is the value of graphical displays in learning? Educ. Psychol. Rev. 2002, 14, 261–312. [Google Scholar] [CrossRef]
- King, C.J.H. An analysis of misconceptions in science textbooks: Earth science in England and Wales. J. Sci. Educ. 2010, 32, 565–601. [Google Scholar] [CrossRef]
- Storey, R.D. Textbook errors and misconceptions in biology: Cell structure. Am. Biol. Teach. 1990, 52, 213–218. [Google Scholar] [CrossRef]
- Hay, D.B.; Williams, D.; Stahl, D.; Wingate, R.J. Using drawings of the brain cell to exhibit expertise in neuroscience: Exploring the boundaries of experimental culture. Sci. Educ. 2013, 97, 468–491. [Google Scholar] [CrossRef]
- Landin, J.M. Perceptual Drawing as a Learning Tool in a College Biology Laboratory. Ph.D. Dissertation, North Carolina State University, Raleigh, NC, USA, 2011. [Google Scholar]
- Menendez, D.; Sabbagh, N.F.; Alibali, M.W.; Rosengren, K.S. Timelines or time cycles: Exposure to different spatial representations of time influences sketching and diagram preferences. Educ. Res. Policy Pract. 2023. [Google Scholar] [CrossRef]
- Curtis, F.D.; Caldwell, O.W.; Sherman, N.H. Biology for Today; Ginn and Company: Boston, MA, USA, 1934. [Google Scholar]
- Moon, T.J. Biology for Beginners; Henry Holt & Company: New York, NY, USA, 1921. [Google Scholar]
- Hunter, G.W. A Civic Biology; American Book Company: New York, NY, USA, 1914. [Google Scholar]
- Haupt, A.W. Fundamentals of Biology; McGraw-Hill Book Company: New York, NY, USA, 1940. [Google Scholar]
- Woodward, A.; Elliott, D. Evolution and creationism in high school textbooks. Am. Biol. Teach. 1987, 49, 164–170. [Google Scholar] [CrossRef]
- U.K. Schools Getting Rid of Analog Clocks Because Teens “Cannot Tell Time”. Available online: https://www.cbsnews.com/news/u-k-schools-getting-rid-of-analog-clocks-because-teens-cannot-tell-time/ (accessed on 20 February 2024).
- Wright, L.K.; Fisk, J.N.; Newman, D.L. DNA → RNA: What do students think the arrow means? CBE Life Sci. Educ. 2014, 13, 338–348. [Google Scholar] [CrossRef] [PubMed]
- Cook, M.P. Visual representations in science education: The influence of prior knowledge and cognitive load theory on instructional design principles. Sci. Educ. 2006, 90, 1073–1091. [Google Scholar] [CrossRef]
- Wiig, Ø. Survival and reproductive rates for polar bears at Svalbard. Ursus 1998, 10, 25–32. [Google Scholar]
- Elephant Longevity & Causes of Death. Available online: https://seaworld.org/animals/all-about/elephants/longevity/ (accessed on 20 February 2024).
- Bottlenose Dolphin Longevity & Causes of Death. Available online: https://seaworld.org/animals/all-about/bottlenose-dolphin/longevity/ (accessed on 20 February 2024).
- Roser, M. Mortality in the Past: Every Second Child Died. Published online at OurWorldInData.org. 2023. Available online: https://ourworldindata.org/child-mortality-in-the-past (accessed on 20 February 2024).
- Boom-or-Bust Breeding Cycle That Helps the Mighty Oak Survive. Available online: https://www.caryinstitute.org/news-insights/media-coverage/boom-or-bust-breeding-cycle-helps-mighty-oak-survive#:~:text=Pennsylvania%20in%202001.-,Dr.,acorns%20survived%20for%20eight%20years (accessed on 25 March 2024).
- Hilbeck, A.; Eckel, C.; Kennedy, G.G. Predation on Colorado potato beetle eggs by generalist predators in research and commercial potato plantings. Biol. Control 1997, 8, 191–196. [Google Scholar] [CrossRef]
- Feeny, P.; Blau, W.S.; Kareiva, P.M. Larval growth and survivorship of the black swallowtail butterfly in central New York. Ecol. Monogr. 1985, 55, 167–187. [Google Scholar] [CrossRef]
- Menedez, D.; Mathiaparanam, O.N.; Liu, D.; Seitz, V.; Alibali, M.W.; Rosengren, K.S. Representing variability: The case of life cycle diagrams. CBE Life Sci. Educ. 2020, 19, ar49. [Google Scholar] [CrossRef]
- Stern, F.; Kampourakis, K.; Huneault, C.; Silveira, P.; Muller, A. Undergraduate biology students’ teleological and essential misconceptions. Educ. Sci. 2018, 8, 135. [Google Scholar] [CrossRef]
- Sisk-Hilton, S.; Metz, K.; Berson, E. Jumping into natural selection. Sci. Child. 2018, 55, 29–35. [Google Scholar] [CrossRef]
- Roth, W.-M.; McGinn, M.K. Inscriptions: Toward a theory of representing as social practice. Rev. Educ. Res. 1998, 68, 35–59. [Google Scholar] [CrossRef]
- Bishop, B.A.; Anderson, S.W. Student conceptions of natural selection and its role in evolution. J. Res. Sci. Teach. 1990, 27, 415–427. [Google Scholar] [CrossRef]
- Alred, A.R.; Doherty, J.H.; Hartley, L.M.; Harris, C.B.; Dauer, J.M. Exploring student ideas about biological variation. Int. J. Sci. Educ. 2019, 41, 1682–1700. [Google Scholar] [CrossRef]
- Anderson, D.L.; Fisher, K.M.; Norman, G.J. Development and evaluation of the Conceptual Inventory of Natural Selection. J. Res. Sci. Teach. 2002, 39, 952–978. [Google Scholar] [CrossRef]
- Lord, F.M. The relation of the reliability of multiple-choice tests to the distribution of item difficulties. Psychometrika 1952, 17, 181–194. [Google Scholar] [CrossRef]
- Ott, R.L.; Longnecker, M. An Introduction to Statistical Methods and Data Analysis, 5th ed.; Duxbury Thomas Learning: Pacific Grove, CA, USA, 2001. [Google Scholar]
- Rougier, N.P.; Droettboom, M.; Bourne, P.E. Ten simple rules for better figures. PLOS Comput. Biol. 2014, 10, e1003833. [Google Scholar] [CrossRef] [PubMed]
- American Association for the Advancement of Science. Vision and Change in Undergraduate Education: A Call to Action; AAAS: Washington, DC, USA, 2010; Available online: https://www.aps.org/programs/education/undergrad/upload/Revised-Vision-and-Change-Final-Report.pdf (accessed on 27 March 2024).
- Postigo, Y.; López-Manjón, A. Images in biology: Are instructional criteria used in textbook image design? Int. J. Sci. Educ. 2019, 41, 210–229. [Google Scholar] [CrossRef]
- Tversky, B. Visualizing thought. Top. Cogn. Sci. 2011, 3, 499–535. [Google Scholar] [CrossRef]
- National Center for Science Education. Evolution: How Does It Fare in State K-12 Science Standards? Reports of the NCSE; National Center for Science Education: Oakland, CA, USA, 2000; Volume 20, Available online: https://ncse.ngo/evolution-how-does-it-fare-state-k-12-science-standards (accessed on 27 March 2024).


Disclaimer/Publisher’s Note: The statements, opinions and data contained in all publications are solely those of the individual author(s) and contributor(s) and not of MDPI and/or the editor(s). MDPI and/or the editor(s) disclaim responsibility for any injury to people or property resulting from any ideas, methods, instructions or products referred to in the content. |
© 2024 by the authors. Licensee MDPI, Basel, Switzerland. This article is an open access article distributed under the terms and conditions of the Creative Commons Attribution (CC BY) license (https://creativecommons.org/licenses/by/4.0/).