

Finally Digital Natives? Changes in Media Use among Science Students during the COVID-19 Pandemic


Abstract
1. Introduction
1.1. Evolution of Digital Competencies: From Digital Natives to Pandemic-Induced Changes
1.2. Potential Factors Influencing the Use of Digital Tools in Science Teaching
- Attitudes towards learning with digital media,
- Social norm expectations regarding the use of digital media in the classroom,
- Self-efficacy expectations with regard to different forms of media use in science lessons,
- Motivation to use digital media in the classroom, and
- Subjectively perceived constraints on the use of media.
- Personal use of digital technologies,
- Previous experience of the students in school,
- Previous experience of digital media use during studies, and
- Beliefs about teaching and learning with digital technologies.
1.3. Current Study: Aims and Hypotheses
2. Materials and Methods
2.1. Sample
2.2. Materials
- Use of digital media
- Prior learning-related experience with digital media at school and university
- Attitudes towards learning with digital media in the classroom
- Motivational orientation for the use of digital media in the classroom
- Perceived constraints on the use of digital media
- Subjective norm expectations regarding the use of digital media
- Self-efficacy expectations for the use of digital media in (science) lessons
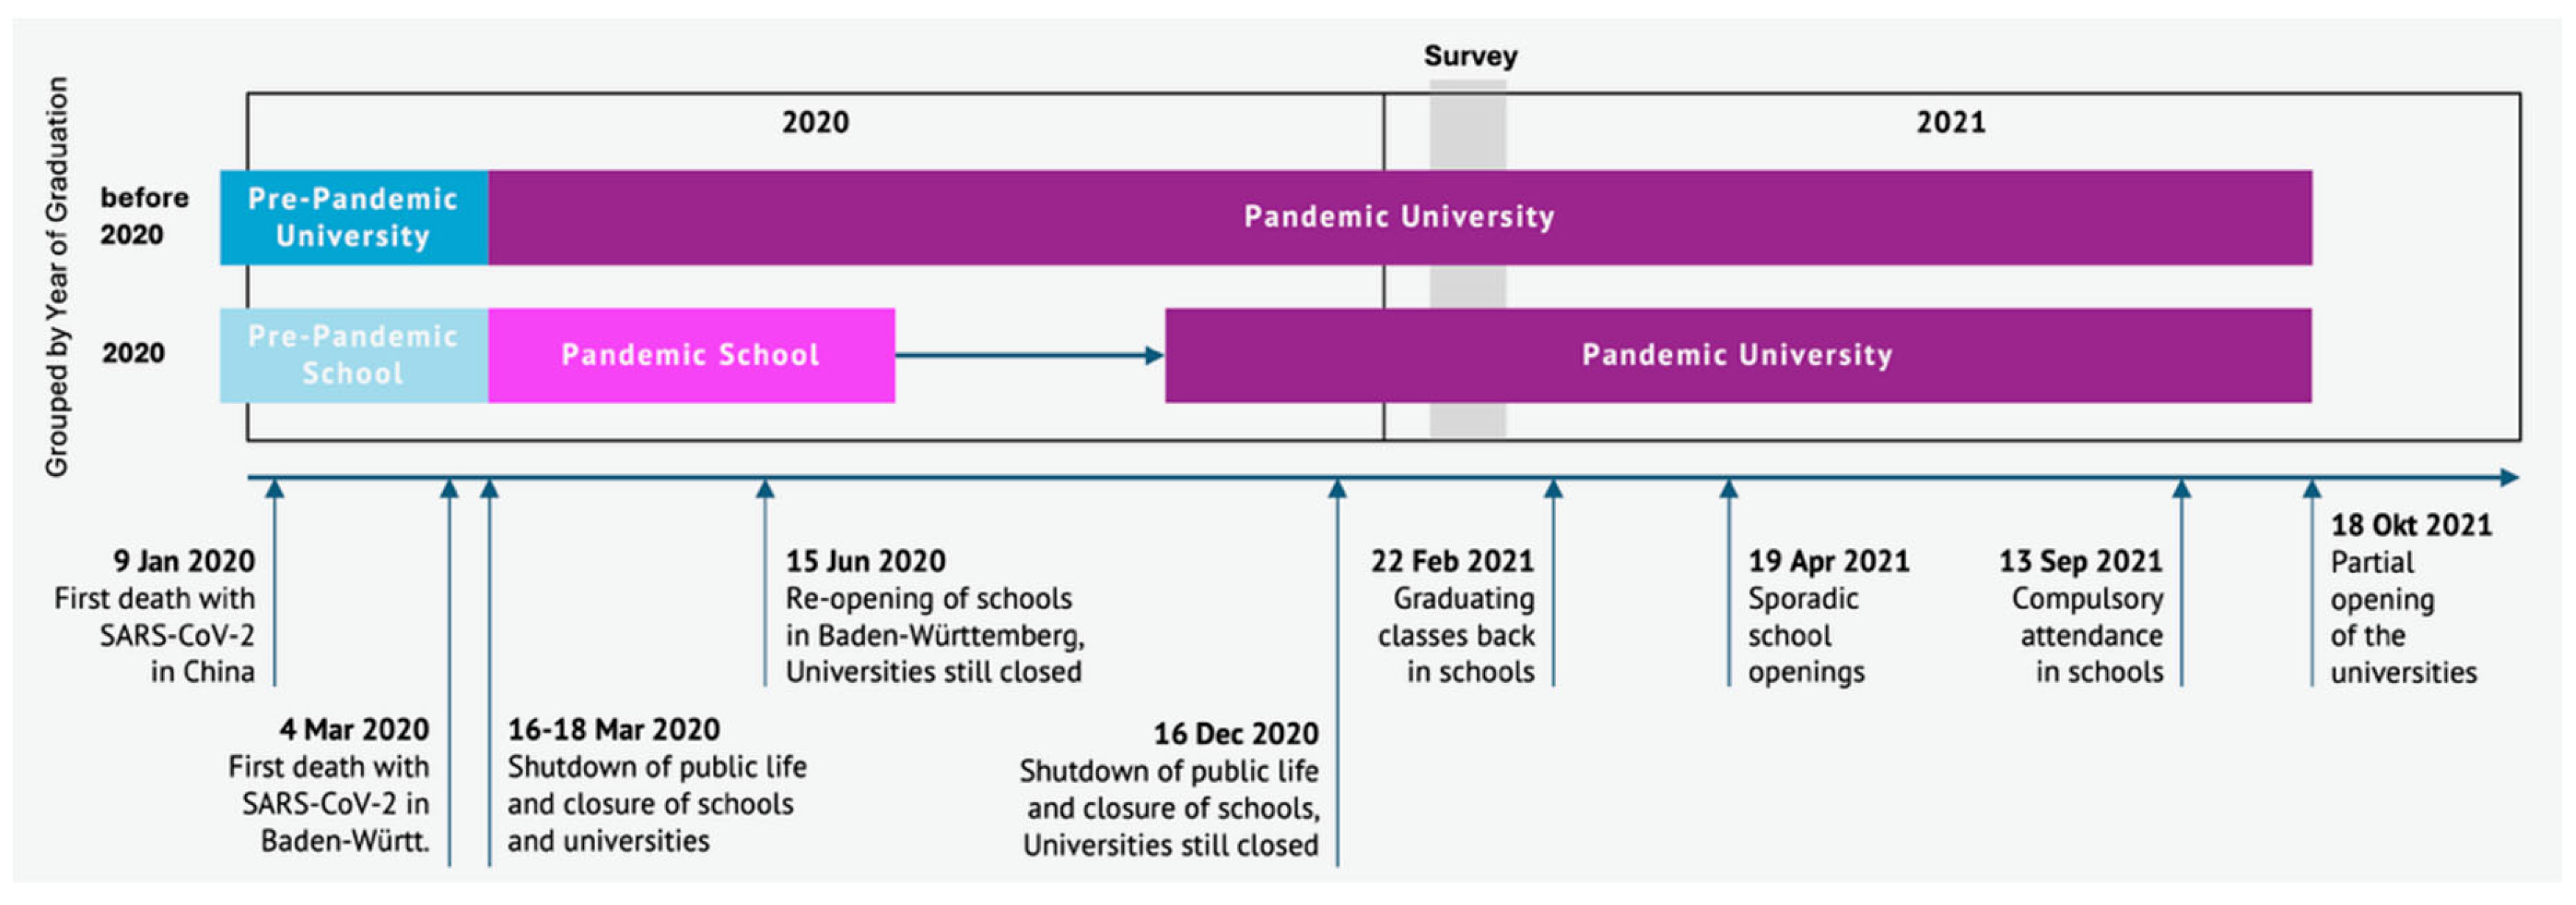
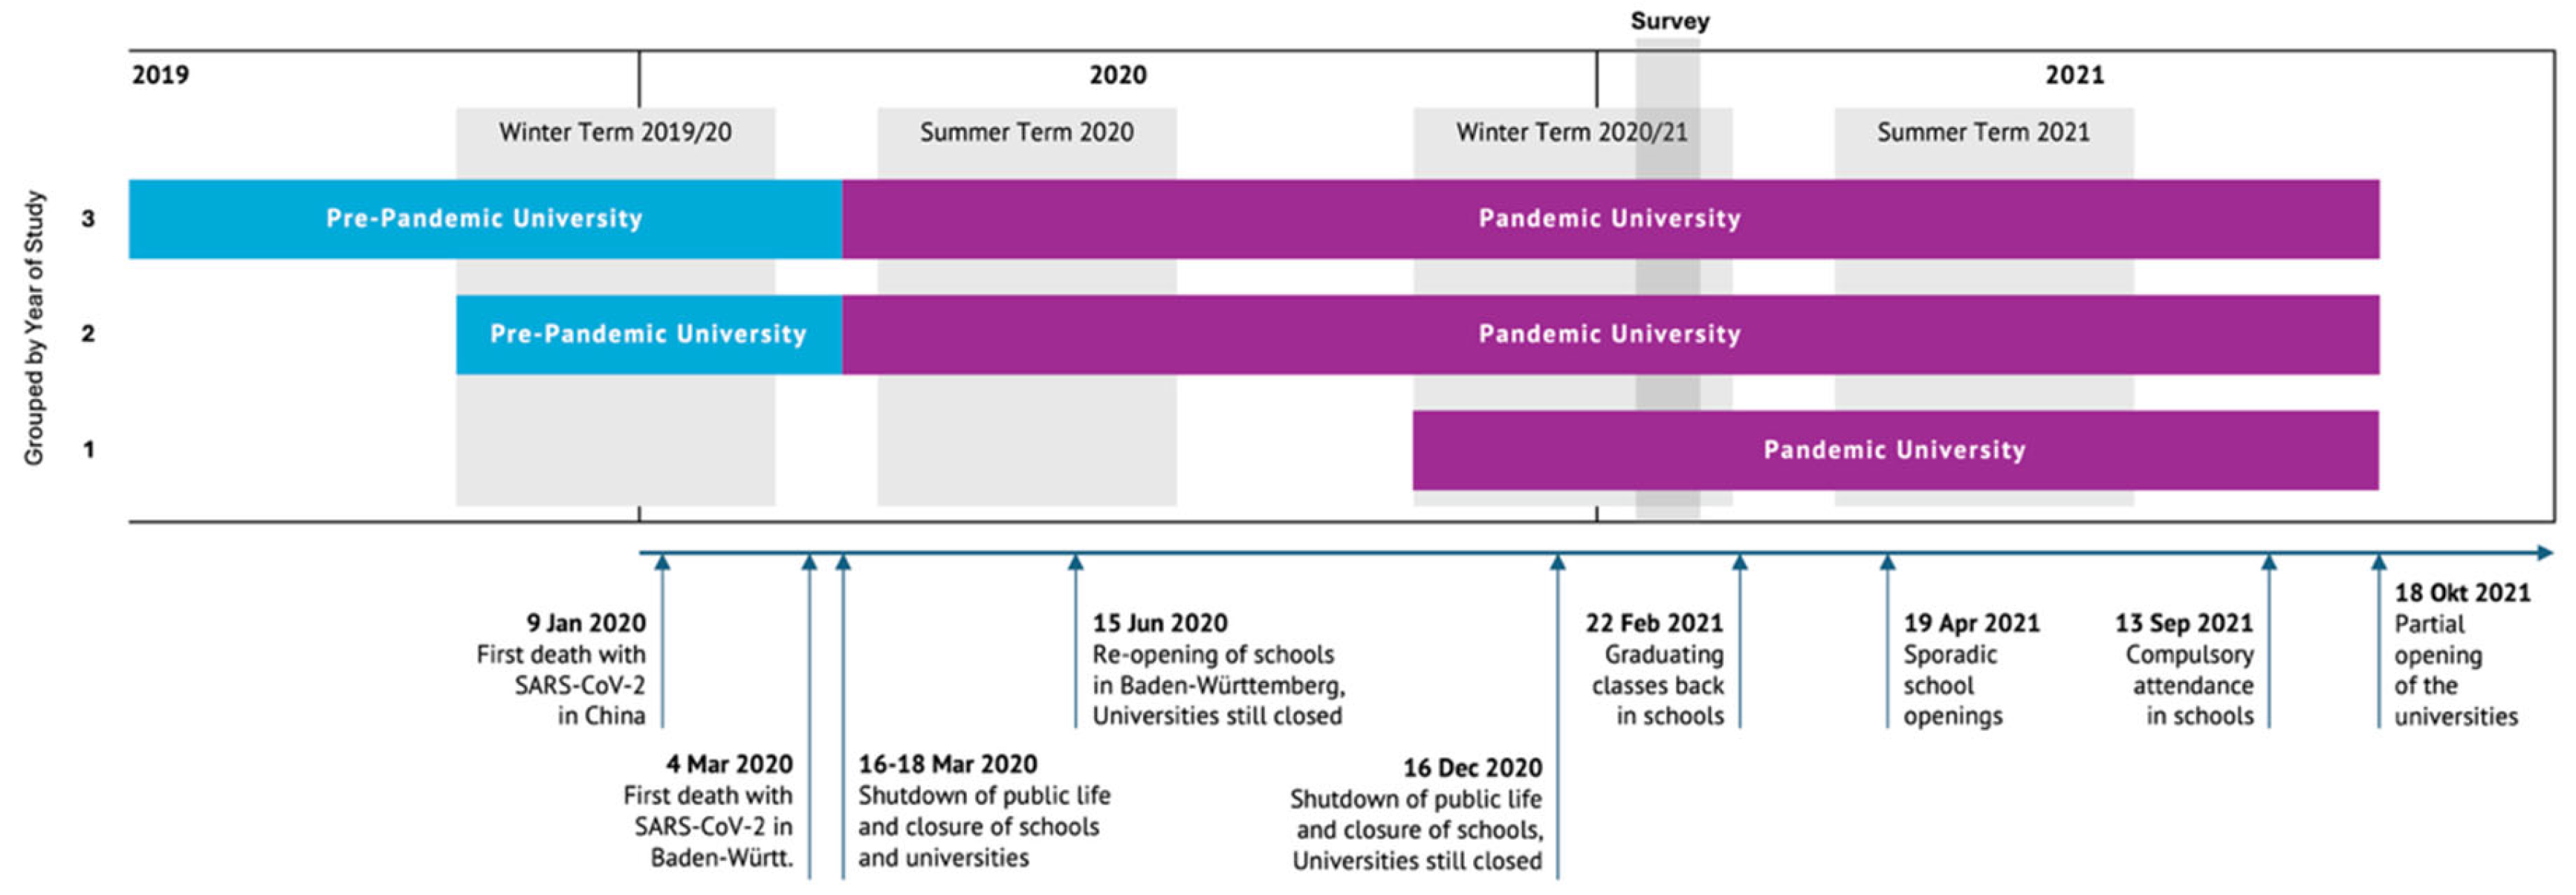
2.3. Study Design and Context
2.4. Statistical Analysis
3. Results
3.1. Use of Digital Media in School
3.2. Use of Digital Media at the University
3.3. Entertainment-Oriented and Creating Media Use
3.4. Attitudes towards Digital Media in Teaching
3.5. Scales and Scale Values of the Two Data Sets
4. Discussion
4.1. Use of Digital Media in School
4.2. Use of Digital Media at the University
4.3. Entertainment-Oriented and Creating Media Use
4.4. Attitudes towards Digital Media in Teaching
4.5. Limitations
4.6. Implication for Further Research
4.7. Implications for Teacher Education
5. Conclusions
6. Declaration of AI and AI-Assisted Technologies in the Writing Process
Author Contributions
Funding
Institutional Review Board Statement
Informed Consent Statement
Data Availability Statement
Acknowledgments
Conflicts of Interest
Appendix A. Questionnaire

| Item ID | Ich Nutze Digitale Medien… (German) | I Use Digital Media … |
|---|---|---|
| MN01 † | … um Informationen zu bestimmten Themen zu suchen. | … to search for information on specific topics. |
| MN02 † | … um (online und/oder offline) Spiele zu spielen. | … to play games (online and/or offline). |
| MN03 † | … um Texte oder Präsentationen zu erstellen. | … to create texts or presentations. |
| MN04 † | … um mit Freunden und Bekannten zu kommunizieren. | … to communicate with friends and acquaintances. |
| MN05 † | … um im Studium Aufgaben mit Hilfe von Programmen (z.B. Excel…) zu erledigen. | … to do tasks in my studies with the help of software (e.g., Excel…). |
| MN06 † | … damit ich Zugang zu sozialen Netzwerken oder Messenger-Diensten erhalte (z.B. Facebook, Whatsapp…). | … to have access to social networks or messenger services (e.g., Facebook, Whatsapp…). |
| MN07 † | … im Studium durch selbst geschriebene Programme bestimmte Aufgaben zu lösen. | … to solve certain tasks in my studies using programs I have written myself. |
| MN08 † | … um mir Filme oder Videos anzusehen. | … to watch movies or videos. |
| MN09 † | … zum Schreiben und Lesen von E-Mails für mein Studium. | … for writing and reading e-mails for my studies. |
| MN10 † | … wenn ich Fernsehen, Radio oder andere Entertainment-Anwendungen nutzen möchte. | … if I want to use television, radio or other entertainment applications. |
| MN11 † | … zur Erstellung von Podcasts (Audio, Video) in meinem Studium. | … for the creation of podcasts (audio, video) in my studies. |
| MN12 † | … um kreative Texte (z.B. Geschichten) zu verfassen. | … to write creative texts (e.g., stories). |
| MN13 † | … zum Hören bzw. Schauen von Podcasts (Audio, Video/auch YouTube) für mein Studium. | … for listening to or watching podcasts (audio, video/also YouTube) for my studies. |
| MN14 † | … zur Fotobearbeitung. | … for editing photos. |
| MN15 † | … um eine eigene Website oder einen Blog zu gestalten. | … to design a website or blog. |
| MN16 † | … um Unterricht als Vertretungslehrer, Tutor oder in einer vergleichbaren Tätigkeit zu gestalten. | … to plan lessons as a substitute teacher, tutor or in a comparable position. |
| MN17 † | … zur Videobearbeitung. | … for editing videos. |
| Item ID | Während Meiner Schulzeit Bzw. in Meinem Studium Habe Ich… (German) | During My Time at School and during My Studies I… |
|---|---|---|
| VE01_01 † | … Tabellenkalkulationsprogramme (z.B. Excel) zur Bearbeitung von Aufgaben genutzt. | … used spreadsheet programs (e.g., Excel) to process tasks. |
| VE01_02 † | … Experimente oder Beobachtungen mittels Videoanalyse ausgewertet. | … evaluated experiments or observations using video analysis. |
| VE01_03 † | … bei Experimenten mit Messwerterfassungssystemen gearbeitet. | … worked with data acquisition systems during experiments. |
| VE01_04 † | … mit Hilfe von digitalen Medien Texte verfasst. | … wrote texts with the help of digital media. |
| VE01_05 † | … das Smartphone zur Durchführung von Experimenten genutzt. | … used the smartphone to carry out experiments. |
| VE01_06 † | … das Fach Informatik belegt. | … took the subject computer science. |
| VE01_07 † | … zur Realisierung von sensor-basierten Experimenten (z.B. Lego Mindstorms, Arduino…) genutzt. | … used [digital media] for the realization of sensor-based experiments (e.g., Lego Mindstorms, Arduino…). |
| VE01_08 † | … mit Hilfe digitaler Medien Feedback im Unterricht bzw. Lehrveranstaltungen gegeben (z.B. Clicker). | … gave feedback in lessons or courses (e.g., Clicker) using digital media. |
| VE01_09 † | … mit Augmented-Reality-Anwendungen gearbeitet. | … worked with augmented reality applications. |
| VE01_10 † | … Prozesse und Phänomene mit Hilfe von Computerprogrammen modelliert (z.B. Simulationen). | … modelled processes and phenomena with the help of computer programs (e.g., simulations). |
| VE01_11 † | … Lernvideos oder-animationen zum Lernen genutzt (z.B. YouTube…). | … used educational videos or animations for learning (e.g., YouTube…). |
| VE01_12 † | … Lernvideos oder-animationen selbst erstellt. | … created educational videos or animations myself. |
| VE01_13 † | … Lehrinhalte mit digitalen Medien für andere aufbereitet (z.B. Quests, Animationen …) | … prepared course content for others using digital media (e.g., quests, animations …) |
| VE01_14 † | … digitale Fachbücher als ebook oder pdf genutzt. | … used digital reference books in ebook or pdf format. |
| VE01_15 ‡ | … digitale Medien genutzt, um kollaborativ ein Dokument zu bearbeiten (z. B. GoogleDocs, Nextcloud). | … used digital media to collaboratively edit a document (e.g., GoogleDocs, Nextcloud). |
| VE01_16 ‡ | … digitale Medien genutzt, um Dokumente auszutauschen (z. B. Moodle, ILIAS, Dropbox, Nextcloud). | … used digital media are to share documents (e.g., Moodle, ILIAS, Dropbox, Nextcloud). |
| VE01_17 ‡ | … Lernplattformen verwendet, um meinen Lernprozess zu begleiten (z. B. Moodle, ILIAS, Mahara). | … used learning platforms to support my learning process (e.g., Moodle, ILIAS, Mahara). |
| VE01_18 ‡ | … digitale Medien für den asynchronen Austausch mit Schullehrkräften/Hochschullehrenden (z. B. Chats, Foren, Lernplattformen) genutzt. | … used digital media for asynchronous exchange with schoolteachers/university lecturers (e.g., chats, forums, learning platforms). |
| VE01_19 ‡ | … digitale Medien für den synchronen Austausch im Unterricht/in der Lehrveranstaltung (z. B. Videokonferenztools) genutzt. | … used digital media for synchronous exchange in lessons/courses (e.g., video conferencing tools). |
| Item ID | Digitale Medien und Unterricht (German) | Digital Media and Teaching |
|---|---|---|
| DU01 ‡ | Das Lernen über digitale Medien sollte generell in den Lehrplänen der Schulen ein starkes Gewicht erhalten. | Learning via digital media should generally be given a strong position in school curricula. |
| DU02 ‡ | Das Lernen mit digitalen Medien sollte generell in den Lehrplänen der Schulen ein starkes Gewicht erhalten. | Learning with digital media should generally be given a strong position in school curricula. |
| DU03 † | Der Einsatz digitaler Medien in den Schulen führt zu einer Verflachung des Unterrichtsniveaus. | The use of digital media in schools leads to a lowering of the standards of teaching. |
| DU04 † | Negative Folgen digitaler Medien für das Lernen werden unterschätzt. | Negative consequences of digital media for learning are underestimated. |
| DU05 † | Der Einsatz digitaler Medien ermöglicht in hohem Maße selbstbestimmtes Lernen. | The use of digital media enables a high degree of self-regulated learning. |
| DU06 † | Durch den Einsatz digitaler Medien können SchülerInnen besser zum Lernen motiviert werden. | Pupils can be motivated easier to learn through the use of digital media. |
| DU07 † | Computer und digitale Medien eröffnen Spielräume für Kreativität beim Lernen. | Computers and digital media open up opportunities for creativity in learning. |
| DU08 † | Der Einsatz von digitalen Medien in der Schule sorgt dafür, dass Kinder gut auf das Berufsleben vorbereitet werden. | The use of digital media at school ensures that children are well prepared for working life. |
| DU09 † | Das Lernen mit digitalen Medien ist eine effiziente Form des Lernens. | Learning with digital media is an efficient way of learning. |
| DU10 † | Mit digitalen Medien kann ich Unterricht adressatengerechter planen und anpassen. | With digital media, I can plan and adapt lessons to suit the target group. |
| DU11 † | Digitale Medien erlauben eine höhere Schüleraktivierung. | Digital media allow for higher student activation. |
| DU12 ‡ | Der Einsatz digitaler Medien in den Schulen hebt das Unterrichtsniveau | The use of digital media in schools raises the standards of teaching. |
References
- Partnership for 21st Century Skills. A State Leaders Action Guide to 21st Century Skills: A New Vision for Education; Partnership for 21st Century Skills: Tucson, AZ, USA, 2006. [Google Scholar]
- Battelle for Kids (BFK). Framework for 21st Century Learning; Partnership for 21st Century Learning: Columbus, OH, USA, 2019. [Google Scholar]
- Carretero, S.; Vuorikari, R.; Punie, Y. DigComp 2.1—The Digital Competence Framework for Citizens with Eight Proficiency Levels and Examples of Use; Publications Office of the European Union: Luxembourg, 2017. [Google Scholar]
- Law, N.; Woo, D.; de la Torre, J.; Wong, G. A Global Framework of Reference on Digital Literacy Skills for Indicator 4.4.2; UNESCO Institute for Statistics: Montreal, QC, Canada, 2018. [Google Scholar]
- Martin, A. Digital literacy and the “digital society”. Digit. Literacies Concepts Policies Pract. 2008, 30, 1029–1055. [Google Scholar]
- United Nations Educational Scientific Cultural Organization (UNESCO). UNESCO ICT Competency Framework for Teachers; UNESCO: Paris, France, 2018. [Google Scholar]
- Stalder, F. Kultur der Digitalität; Suhrkamp: Berlin, Germany, 2016. [Google Scholar]
- Thyssen, C.; Huwer, J.; Irion, T.; Schaal, S. From TPACK to DPACK: The “Digitality-Related Pedagogical and Content Knowledge”-Model in STEM-Education. Educ. Sci. 2023, 13, 769. [Google Scholar] [CrossRef]
- Schwab, K. The Fourth Industrial Revolution; World Economic Forum: Cologny/Geneva, Switzerland, 2016. [Google Scholar]
- Xu, L.D. Industrial information integration—An emerging subject in industrialization and informatization process. J. Ind. Inf. Integr. 2020, 17, 100128. [Google Scholar] [CrossRef]
- Xu, L.D.; Xu, E.L.; Li, L. Industry 4.0: State of the art and future trends. Int. J. Prod. Res. 2018, 56, 2941–2962. [Google Scholar] [CrossRef]
- KMK, K. Bildung in der digitalen Welt. Strategie der Kultusministerkonferenz. Beschluss Der Kultusministerkonferenz Vom 2016, 8, 2016. [Google Scholar]
- Redecker, C.; Punie, Y. European Framework for the Digital Competence of Educators: DigCompEdu; Publications Office of the European Union: Luxembourg, 2017. [Google Scholar] [CrossRef]
- Besa, K.; Biehl, A.; Gensler, A.; Gesang, J.; Wilde, M.; Lüking, S. Interesse an digitalen Medien—Eine Frage der Persönlichkeit? Eine quantitative Untersuchung von Lehramtsstudierenden und Nicht-Lehramtsstudierenden. Lehrerbildung auf Prüfstand 2021, 14, 11–27. [Google Scholar]
- Kotzebue, L.v.; Meier, M.; Finger, A.; Kremser, E.; Huwer, J.; Thoms, L.-J.; Becker, S.; Bruckermann, T.; Thyssen, C. The Framework DiKoLAN (Digital Competencies for Teaching in Science Education) as Basis for the Self-Assessment Tool DiKoLAN-Grid. Educ. Sci. 2021, 11, 775. [Google Scholar] [CrossRef]
- Prensky, M. Digital Natives, Digital Immigrants Part 1. Horizon 2001, 9, 1–6. [Google Scholar] [CrossRef]
- Prensky, M. Digital Natives, Digital Immigrants Part 2: Do They Really Think Differently? Horizon 2001, 9, 1–6. [Google Scholar] [CrossRef]
- Kirschner, P.A.; De Bruyckere, P. The myths of the digital native and the multitasker. Teach. Teach. Educ. 2017, 67, 135–142. [Google Scholar] [CrossRef]
- Margaryan, A.; Littlejohn, A.; Vojt, G. Are digital natives a myth or reality? University students’ use of digital technologies. Comput. Educ. 2011, 56, 429–440. [Google Scholar] [CrossRef]
- Zawacki-Richter, O.; Dolch, C.; Müskens, W. Studiumsbezogene Mediennutzung im Wandel—Querschnittdaten 2012 und 2015 im Vergleich. Schriftenreihe Bild.-Und Wiss. 2016, 3, 1–44. [Google Scholar]
- Fraillon, J.; Ainley, J.; Schulz, W.; Friedman, T.; Duckworth, D. Preparing for Life in a Digital World: IEA International Computer and Information Literacy Study 2018 International Report; Springer Nature: Berlin/Heidelberg, Germany, 2020. [Google Scholar]
- Thompson, P. The digital natives as learners: Technology use patterns and approaches to learning. Comput. Educ. 2013, 65, 12–33. [Google Scholar] [CrossRef]
- Fraillon, J.; Ainley, J.; Schulz, W.; Friedman, T.; Gebhardt, E. Preparing for Life in a Digital Age: The IEA International Computer and Information Literacy Study International Report; Springer Nature: Berlin/Heidelberg, Germany, 2014. [Google Scholar]
- Fraillon, J.; Schulz, W.; Ainley, J. International Computer and Information Literacy Study: Assessment Framework; ERIC: Amsterdam, The Netherlands, 2013. [Google Scholar]
- Henne, A.; Möhrke, P.; Huwer, J.; Thoms, L.-J. Learning Science at University in Times of COVID-19 Crises from the Perspective of Lecturers—An Interview Study. Educ. Sci. 2023, 13, 319. [Google Scholar] [CrossRef]
- Cone, L.; Brøgger, K.; Berghmans, M.; Decuypere, M.; Förschler, A.; Grimaldi, E.; Hartong, S.; Hillman, T.; Ideland, M.; Landri, P.; et al. Pandemic Acceleration: COVID-19 and the emergency digitalization of European education. Eur. Educ. Res. J. 2021, 21, 845–868. [Google Scholar] [CrossRef]
- König, J.; Jäger-Biela, D.J.; Glutsch, N. Adapting to online teaching during COVID-19 school closure: Teacher education and teacher competence effects among early career teachers in Germany. Eur. J. Teach. Educ. 2020, 43, 608–622. [Google Scholar] [CrossRef]
- Beardsley, M.; Albó, L.; Aragón, P.; Hernández-Leo, D. Emergency education effects on teacher abilities and motivation to use digital technologies. Br. J. Educ. Technol. 2021, 52, 1455–1477. [Google Scholar] [CrossRef]
- Baker, C.N.; Peele, H.; Daniels, M.; Saybe, M.; Whalen, K.; Overstreet, S.; The New Orleans, T.-I.S.L.C. The Experience of COVID-19 and Its Impact on Teachers’ Mental Health, Coping, and Teaching. Sch. Psychol. Rev. 2021, 50, 491–504. [Google Scholar] [CrossRef]
- Greimel-Fuhrmann, B.; Riess, J.; Loibl, T.; Schuster, S. Lehren aus der Distanzlehre ziehen—Eine Interviewstudie zur Distanzlehre an der Wirtschaftsuniversität Wien. In Wie Corona die Hochschullehre Verändert: Erfahrungen und Gedanken aus der Krise zum zukünftigen Einsatz von eLearning; Dittler, U., Kreidl, C., Eds.; Springer Fachmedien Wiesbaden: Wiesbaden, Germany, 2021; pp. 89–103. [Google Scholar]
- Lühken, A. Chemie unterrichten und lernen in der Corona-Zeit—Neue Wege finden! Chemkon 2020, 27, 207. [Google Scholar] [CrossRef]
- Baumert, J.; Kunter, M. Stichwort: Professionelle Kompetenz von Lehrkräften. Z. Erzieh. 2006, 9, 469–520. [Google Scholar] [CrossRef]
- Lohmann, J.; Breithecker, J.; Ohl, U.; Gieß-Stüber, P.; Brandl-Bredenbeck, H. Teachers’ Professional Action Competence in Education for Sustainable Development: A Systematic Review from the Perspective of Physical Education. Sustainability 2021, 13, 13343. [Google Scholar] [CrossRef]
- Keller, M.M.; Neumann, K.; Fischer, H.E. The impact of physics teachers’ pedagogical content knowledge and motivation on students’ achievement and interest. J. Res. Sci. Teach. 2016, 54, 586–614. [Google Scholar] [CrossRef]
- Vogelsang, C.; Finger, A.; Laumann, D.; Thyssen, C. Experience, Attitudes and Motivational Orientations as Potential Factors Influencing the Use of Digital Tools in Science Teaching. Z. Didakt. Naturwiss. 2019, 25, 115–129. [Google Scholar] [CrossRef]
- van Ackeren, I.; Aufenanger, S.; Eickelmann, B.; Friedrich, S.; Kammerl, R.; Knopf, J.; Mayrberger, K.; Scheika, H.; Scheiter, K.; Schiefner-Rohs, M. Digitalisierung in der Lehrerbildung. Herausforderungen, Entwicklungsfelder und Förderung von Gesamtkonzepten. DDS—Die Dtsch. Sch. 2019, 111, 103–119. [Google Scholar] [CrossRef]
- Weinert, F.E. Vergleichende Leistungsmessung in Schulen—Eine umstrittene Selbstverständlichkeit. In Leistungsmessungen in Schulen; Beltz: Weinheim, Germany, 2001; pp. 17–32. [Google Scholar]
- Shavelson, R.J.; Hubner, J.J.; Stanton, G.C. Self-Concept: Validation of Construct Interpretations. Rev. Educ. Res. 2016, 46, 407–441. [Google Scholar] [CrossRef]
- Bandura, A. Self-Efficacy: The Exercise of Control; W H Freeman/Times Books/Henry Holt & Co.: New York, NY, USA, 1997; pp. ix, 604. [Google Scholar]
- Bong, M.; Clark, R.E. Comparison between self-concept and self-efficacy in academic motivation research. Educ. Psychol. 1999, 34, 139–153. [Google Scholar] [CrossRef]
- Bong, M.; Skaalvik, E.M. Academic Self-Concept and Self-Efficacy: How Different Are They Really? Educ. Psychol. Rev. 2003, 15, 1–40. [Google Scholar] [CrossRef]
- Valtonen, T.; Sointu, E.; Kukkonen, J.; Kontkanen, S.; Lambert, M.C.; Mäkitalo-Siegl, K. TPACK updated to measure pre-service teachers’ twenty-first century skills. Australas. J. Educ. Technol. 2017, 33, 15–31. [Google Scholar] [CrossRef]
- Fishbein, M.; Ajzen, I. Predicting and Changing Behavior: The Reasoned Action Approach, 1st ed.; Psychology Press: Hove, UK; New York, NY, USA, 2010. [Google Scholar]
- Ajzen, I. The theory of planned behavior. Organ. Behav. Hum. Decis. Process. 1991, 50, 179–211. [Google Scholar] [CrossRef]
- Bedenlier, S.; Händel, M.; Kammerl, R.; Gläser-Zikuda, M.; Kopp, B.; Ziegler, A. Akademische Mediennutzung Studierender im Corona-Semester 2020. Medien. Z. Theor. Prax. Medien. 2021, 40, 229–252. [Google Scholar] [CrossRef]
- Senkbeil, M.; Ihme, J.M.; Schöber, C. Wie gut sind angehende und fortgeschrittene Studierende auf das Leben und Arbeiten in der digitalen Welt vorbereitet? Ergebnisse eines Standard Setting-Verfahrens zur Beschreibung von ICT-bezogenen Kompetenzniveaus. Z. Erzieh. 2019, 22, 1359–1384. [Google Scholar] [CrossRef]
- Senkbeil, M.; Ihme, J.M.; Schöber, C. Empirische Arbeit: Schulische Medienkompetenzförderung in einer digitalen Welt: Über welche digitalen Kompetenzen verfügen angehende Lehrkräfte? Psychol. Erzieh. Und Unterr. 2020, 68, 4–22. [Google Scholar] [CrossRef]
- Brandle, M.; Sotiriadou, C.; Zinn, B. Self-assessments, attitudes, and motivational orientations towards the use of digital media in teaching a comparison between student teachers of different subject clusters. Heliyon 2023, 9, e19516. [Google Scholar] [CrossRef]
- Guggemos, J.; Seufert, S. Teaching with and teaching about technology—Evidence for professional development of in-service teachers. Comput. Hum. Behav. 2021, 115, 106613. [Google Scholar] [CrossRef]
- Finger, A.; Thyssen, C.; Laumann, D.; Vogelsang, C. Analyse von Einflussfaktoren auf den Einsatz digitaler Werkzeuge im naturwissenschaftlichen Unterricht. In Proceedings of the Naturwissenschaftliche Kompetenzen in der Gesellschaft von Morgen; Gesellschaft für Didaktik der Chemie und Physik, Jahrestagung in Wien 2019; Universität Duisburg-Essen: Duisburg/Essen, Germany, 2020; pp. 182–185. [Google Scholar]
- Zawacki-Richter, O. Zur Mediennutzung im Studium—Unter besonderer Berücksichtigung heterogener Studierender. Z. Erzieh. 2015, 18, 527–549. [Google Scholar] [CrossRef]
- Pozo, J.I.; Perez Echeverria, M.P.; Cabellos, B.; Sanchez, D.L. Teaching and Learning in Times of COVID-19: Uses of Digital Technologies during School Lockdowns. Front. Psychol. 2021, 12, 656776. [Google Scholar] [CrossRef] [PubMed]
- R Core Team. R: A Language and Environment for Statistical Computing; R Foundation for Statistical Computing: Vienna, Austria, 2023. [Google Scholar]
- Kruskal, W.H.; Wallis, W.A. Use of Ranks in One-Criterion Variance Analysis. J. Am. Stat. Assoc. 1952, 47, 583–621. [Google Scholar] [CrossRef]
- Dunn, O.J. Multiple Comparisons Using Rank Sums. Technometrics 1964, 6, 241–252. [Google Scholar] [CrossRef]
- Benjamini, Y.; Hochberg, Y. Controlling the False Discovery Rate: A Practical and Powerful Approach to Multiple Testing. J. R. Stat. Soc. Ser. B 2018, 57, 289–300. [Google Scholar] [CrossRef]
- Vargha, A.; Delaney, H.D. A Critique and Improvement of the CL Common Language Effect Size Statistics of McGraw and Wong. J. Educ. Behav. Stat. 2000, 25, 101–132. [Google Scholar] [CrossRef]
- Jiménez Sánchez, E.; Montes-López, E.; Santos Sánchez, M.J. Impact of the COVID-19 Confinement on the Physics and Chemistry Didactic in High Schools. Sustainability 2022, 14, 6754. [Google Scholar] [CrossRef]
- Adov, L.; Mäeots, M. What Can We Learn about Science Teachers’ Technology Use during the COVID-19 Pandemic? Educ. Sci. 2021, 11, 255. [Google Scholar] [CrossRef]
- Davis, F. A Technology Acceptance Model for Empirically Testing New End-User Information Systems. Ph.D. Thesis, Massachusetts Institute of Technology, Cambridge, MA, USA, 1985. [Google Scholar]
- Davis, F.; Bagozzi, R.; Warshaw, P. User Acceptance of Computer Technology: A Comparison of Two Theoretical Models. Manag. Sci. 1989, 35, 982–1003. [Google Scholar] [CrossRef]
- Schwabl, F.; Vogelsang, C. COVID-19 als Katalysator für die digitale Professionalisierung angehender Lehrpersonen? Analysen am Beispiel des Praxissemesters. Medien. Z. Theor. Prax. Medien. 2021, 40, 253–281. [Google Scholar] [CrossRef]
- Vogelsang, C.; Wiethoff, C. Effects of school closures during the COVID-19 pandemic in early 2020 on prospective teachers in a one-semester school internship. Eur. J. Teach. Educ. 2022, 1–19. [Google Scholar] [CrossRef]
- Scull, J.; Phillips, M.; Sharma, U.; Garnier, K. Innovations in teacher education at the time of COVID19: An Australian perspective. J. Educ. Teach. 2020, 46, 497–506. [Google Scholar] [CrossRef]
- Besa, K.; Biehl, A. Veränderungen von Mediennutzung und Medieninteresse bei Lehramtsstudierenden während der Corona-Pandemie. In Digitale Bildung im Lehramtsstudium während der Corona-Pandemie; Porsch, R., Reintjes, C., Eds.; Waxmann: Münster, Germany, 2023; pp. 21–38. [Google Scholar]
- Muniz-Velazquez, J.A.; Gomez-Baya, D.; Lozano Delmar, J. Exploratory Study of the Relationship Between Happiness and the Rise of Media Consumption during COVID-19 Confinement. Front. Psychol. 2021, 12, 566517. [Google Scholar] [CrossRef]
- Guldin, R.; Noga-Styron, K.; Britto, S. Media Consumption and News Literacy Habits during the COVID-19 Pandemic. Int. J. Crit. Media Lit. 2021, 3, 43–71. [Google Scholar] [CrossRef]
- Balanskat, A. The ICT Impact Report: A Review of Studies of ICT Impact on Schools in Europe, European Schoolnet. 2006. Available online: http://insight.eun.org/shared/data/pdf/impact_study.pdf (accessed on 5 May 2024).
- Vogelsang, C.; Caruso, C.; Seifert, A.; Schwabl, F. Wie entwickeln sich medienbezogene Einstellungen, selbsteingeschätzte Medienkompetenzen und motivationale Orientierungen angehender Lehrkräfte? Eine Sekundäranalyse von Evaluationsdaten zum Praxissemester im zweiten COVID-19-bedingten Lockdown. In MedienPädagogik (Occasional Papers); DgfE: Zürich, Switzerland, 2023; pp. 22–50. [Google Scholar] [CrossRef]
- Schubatzky, T.; Burde, J.-P.; Große-Heilmann, R.; Haagen-Schützenhöfer, C.; Riese, J.; Weiler, D. Predicting the development of digital media PCK/TPACK: The role of PCK, motivation to use digital media, interest in and previous experience with digital media. Comput. Educ. 2023, 206, 104900. [Google Scholar] [CrossRef]
- Stinken-Rösner, L.; Hofer, E.; Rodenhauser, A.; Abels, S. Technology Implementation in Pre-Service Science Teacher Education Based on the Transformative View of TPACK: Effects on Pre-Service Teachers’ TPACK, Behavioral Orientations and Actions in Practice. Educ. Sci. 2023, 13, 732. [Google Scholar] [CrossRef]
- Henne, A.; Möhrke, P.; Thoms, L.-J.; Huwer, J. Implementing Digital Competencies in University Science Education Seminars Following the DiKoLAN Framework. Educ. Sci. 2022, 12, 356. [Google Scholar] [CrossRef]
- Weiler, D.; Burde, J.-P.; Große-Heilmann, R.; Lachner, A.; Riese, J.; Schubatzky, T. Förderung von digitalisierungsbezogenen Kompetenzen von angehenden Physiklehrkräften mit dem SQD-Modell im Projekt DiKoLeP. In Lehr-Lern-Labore und Digitalisierung; Meier, M., Greefrath, G., Hammann, M., Wodzinski, R., Ziepprecht, K., Eds.; Springer Fachmedien Wiesbaden: Wiesbaden, Germany, 2023; pp. 47–62. [Google Scholar]
- Thoms, L.-J.; Becker, S.; Kremser, E. Teaching and Learning Physics with Digital Technologies—What Digitalization-Related Competencies Are Needed? In New Challenges and Opportunities in Physics Education; Streit-Bianchi, M., Michelini, M., Bonivento, W., Tuveri, M., Eds.; Springer Nature Switzerland: Cham, Switzerland, 2023; pp. 313–326. [Google Scholar]
- BMBF (Bundesministerium für Bildung und Forschung). DigitalPakt Schule. Verwaltungsvereinbarung DigitalPakt Schule 2019 bis 2024. 2019. Available online: https://www.digitalpaktschule.de/files/VV_DigitalPaktSchule_Web.pdf (accessed on 30 March 2024).


| Df | SumOfSqs | R2 | F | p | |
|---|---|---|---|---|---|
| DA03 | 1 | 13.30 | 0.17 | 31.12 | 0.001 |
| Residual | 147 | 62.82 | 0.83 | ||
| Total | 148 | 76.12 | 1 |
| Before 2020 | 2020 | ||||||||||||
|---|---|---|---|---|---|---|---|---|---|---|---|---|---|
| Score | M | SD | M | SD | H | Df | N | p | VDA | CD | rg | ||
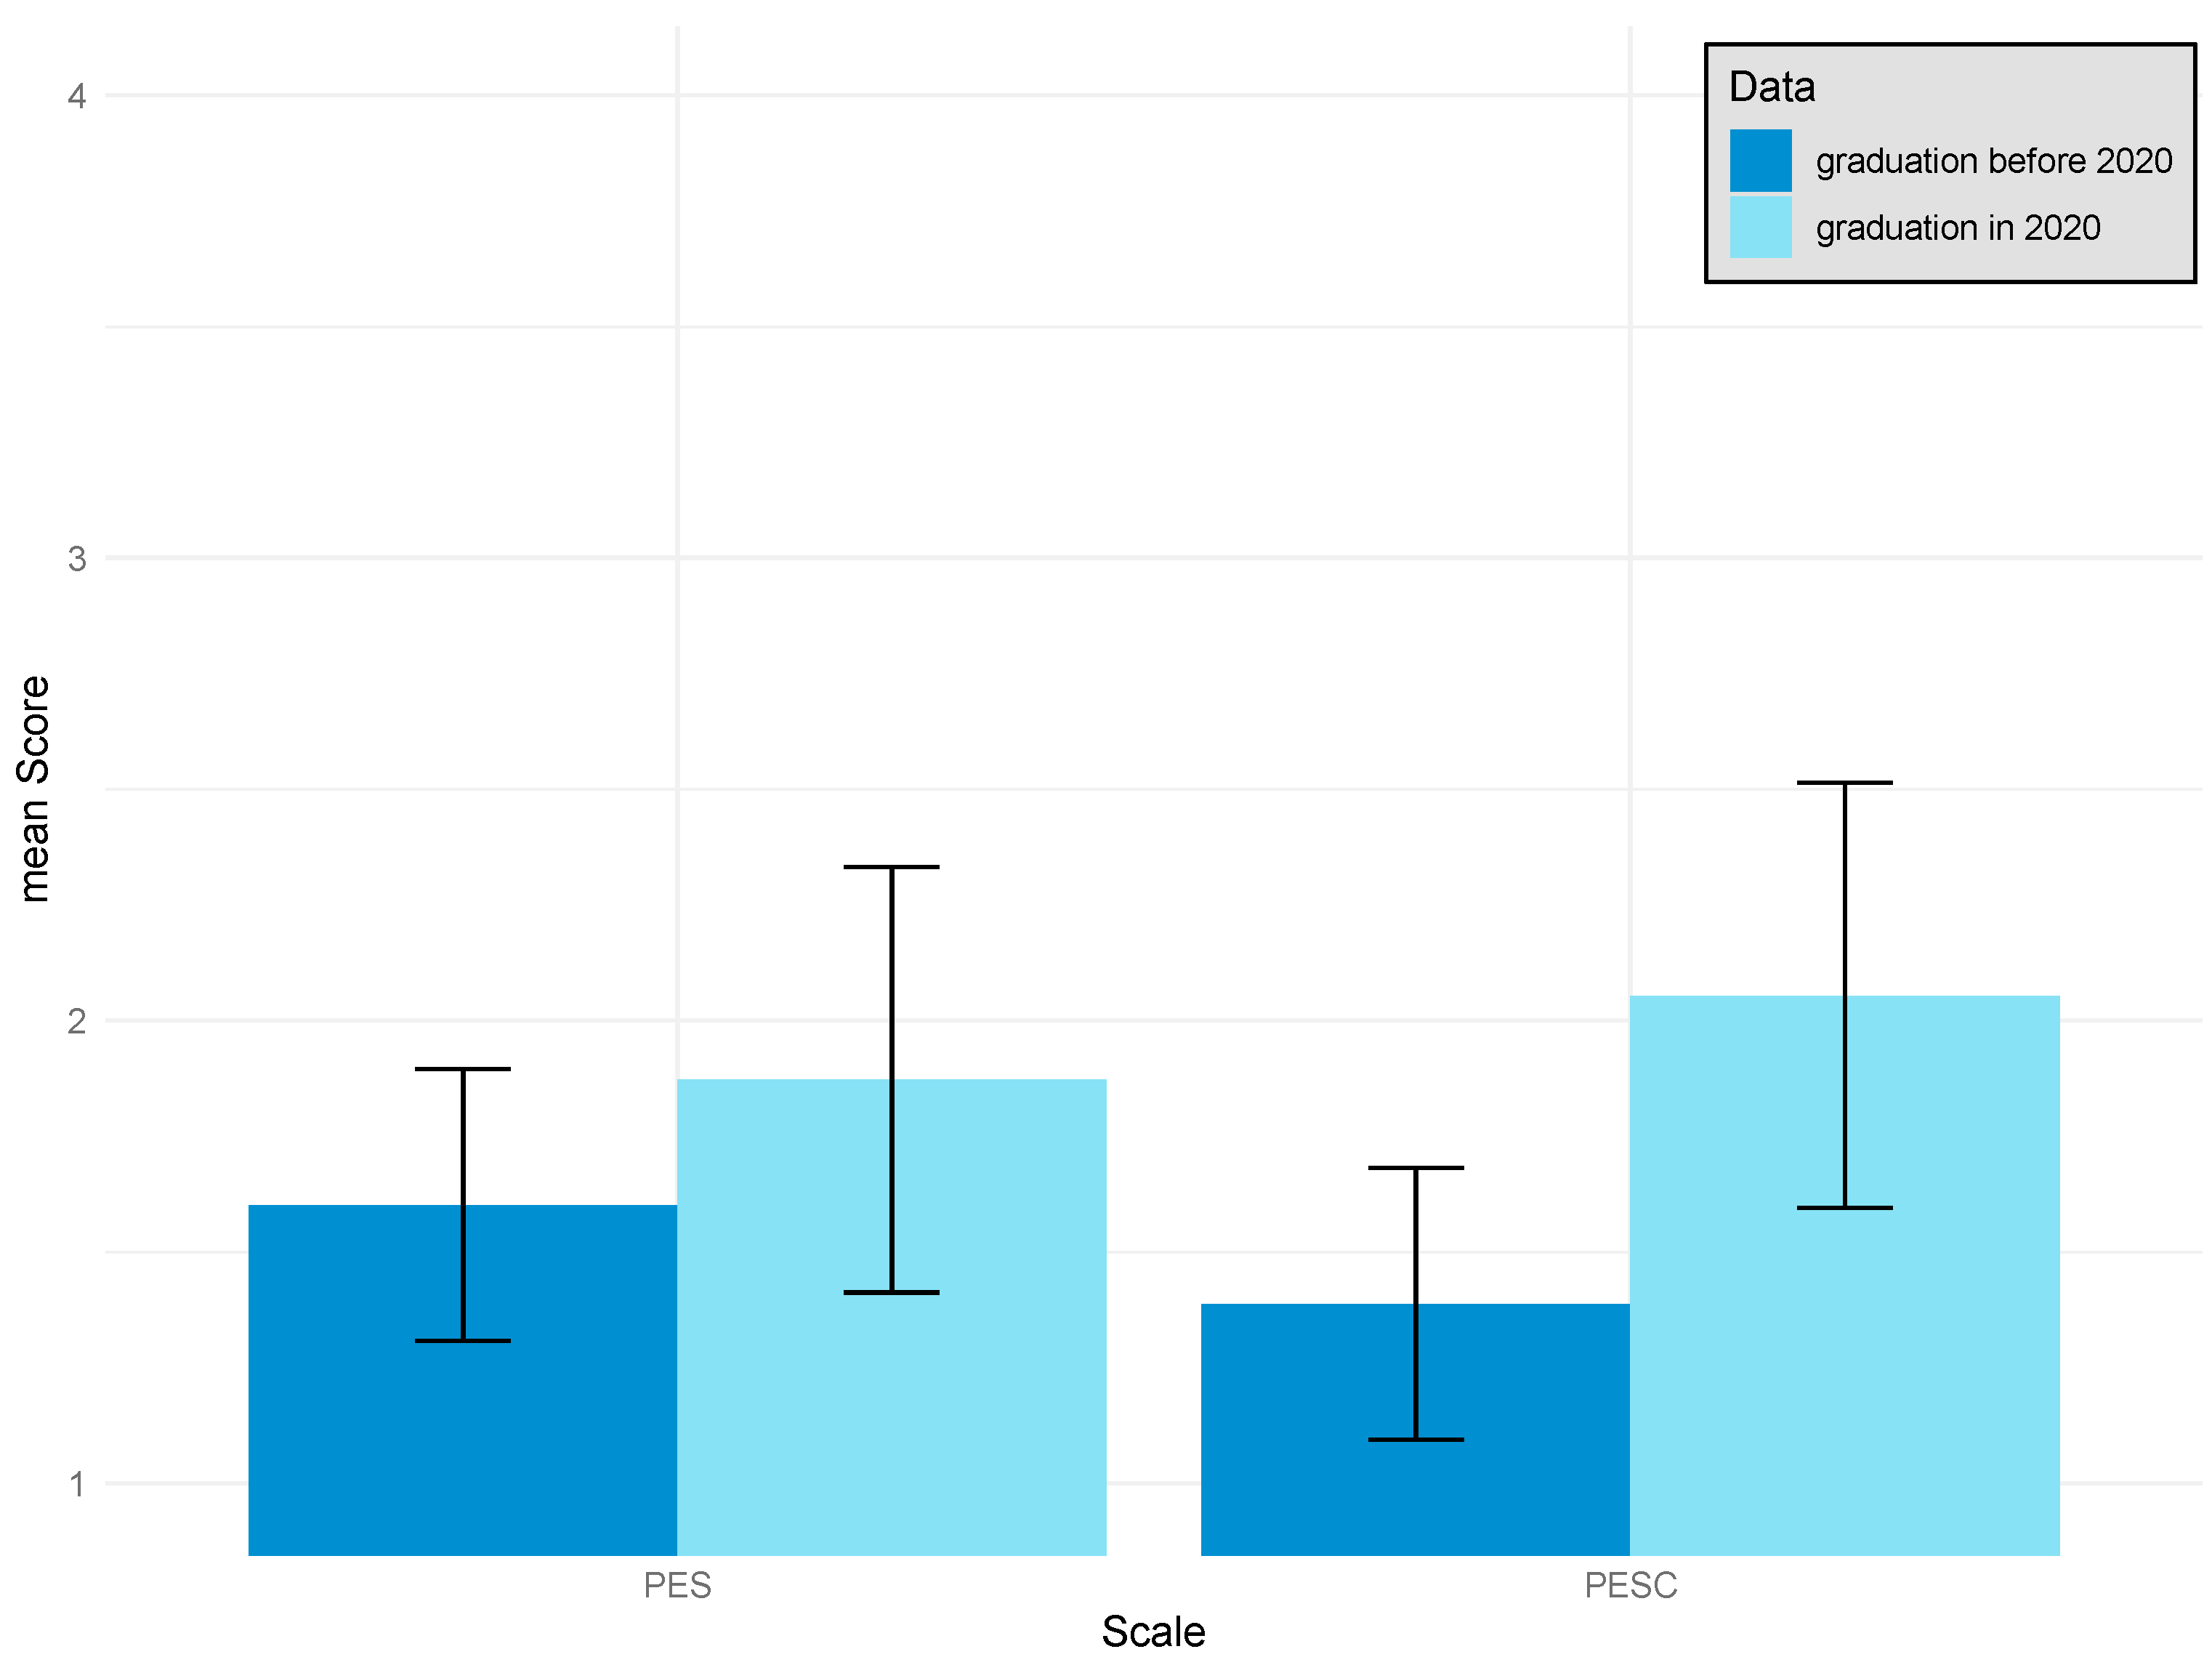
| PES | 1.60 | 0.29 | 1.87 | 0.46 | 9.39 | 1 | 149 | 0.002 | 57 | 63 | 0.325 | −0.350 | −0.349 |
| PESC | 1.39 | 0.45 | 2.05 | 0.84 | 23.55 | 1 | 149 | <0.001 | 153 | 159 | 0.227 | −0.546 | −0.546 |
| Df | SumOfSqs | R2 | F | p | |
|---|---|---|---|---|---|
| DA03 | 1 | 1.37 | 0.03 | 10.85 | 0.003 |
| Residual | 387 | 48.87 | 0.97 | ||
| Total | 388 | 50.24 | 1 |
| Group 1 | Group 2 | ||||||||||
|---|---|---|---|---|---|---|---|---|---|---|---|
| Comparison | M | SD | M | SD | Z | p | padj | VDA | CD | rg | |
| Pre-pandemic vs. before 2020 | 1.59 | 0.36 | 1.60 | 0.29 | 13.59 | −0.96 | 0.1687 | 0.1687 | |||
| Pre-pandemic vs. 2020 | 1.59 | 0.36 | 1.87 | 0.46 | 13.59 | −3.68 | <0.001 | <0.001 | 0.307 | −0.386 | −0.385 |
| Before 2020 vs. 2020 | 1.60 | 0.29 | 1.87 | 0.46 | 13.59 | −2.91 | 0.0018 | 0.0027 | 0.325 | −0.350 | −0.349 |
| Df | SumOfSqs | R2 | F | p | |
|---|---|---|---|---|---|
| DA02 | 1 | 7.58 | 0.17 | 67.79 | 0.001 |
| DS_ID | 1 | 2.75 | 0.06 | 24.57 | 0.001 |
| Residual | 305 | 34.10 | 0.77 | ||
| Total | 307 | 44.43 | 1 |
| Group 1 | Group 2 | ||||||||||
|---|---|---|---|---|---|---|---|---|---|---|---|
| Comparison | M | SD | M | SD | Z | p | padj | VDA | CD | rg | |
| First vs. third semester | 1.65 | 0.31 | 1.87 | 0.35 | 56.24 | −4.24 | <0.001 | <0.001 | 0.316 | −0.368 | −0.369 |
| First vs. fifth semester | 1.65 | 0.31 | 2.03 | 0.37 | 56.24 | −7.48 | <0.001 | <0.001 | 0.211 | −0.578 | −0.578 |
| Third vs. fifth semester | 1.87 | 0.35 | 2.03 | 0.37 | 56.24 | −2.98 | 0.0014 | 0.0014 | 0.373 | −0.254 | −0.255 |
| pre-pandemic vs. current study | 1.79 | 0.37 | 1.91 | 0.39 | 0.424 | −0.152 | −0.153 | ||||
| Df | SumOfSqs | R2 | F | p | |
|---|---|---|---|---|---|
| DA02 | 1 | 8.16 | 0.12 | 19.36 | 0.001 |
| Residual | 148 | 62.41 | 0.88 | ||
| Total | 149 | 70.57 | 1 |
| First Semester | Third Semester | Fifth Semester | ||||||||||
|---|---|---|---|---|---|---|---|---|---|---|---|---|
| Score | M | SD | M | SD | M | SD | H | Df | N | p | ||
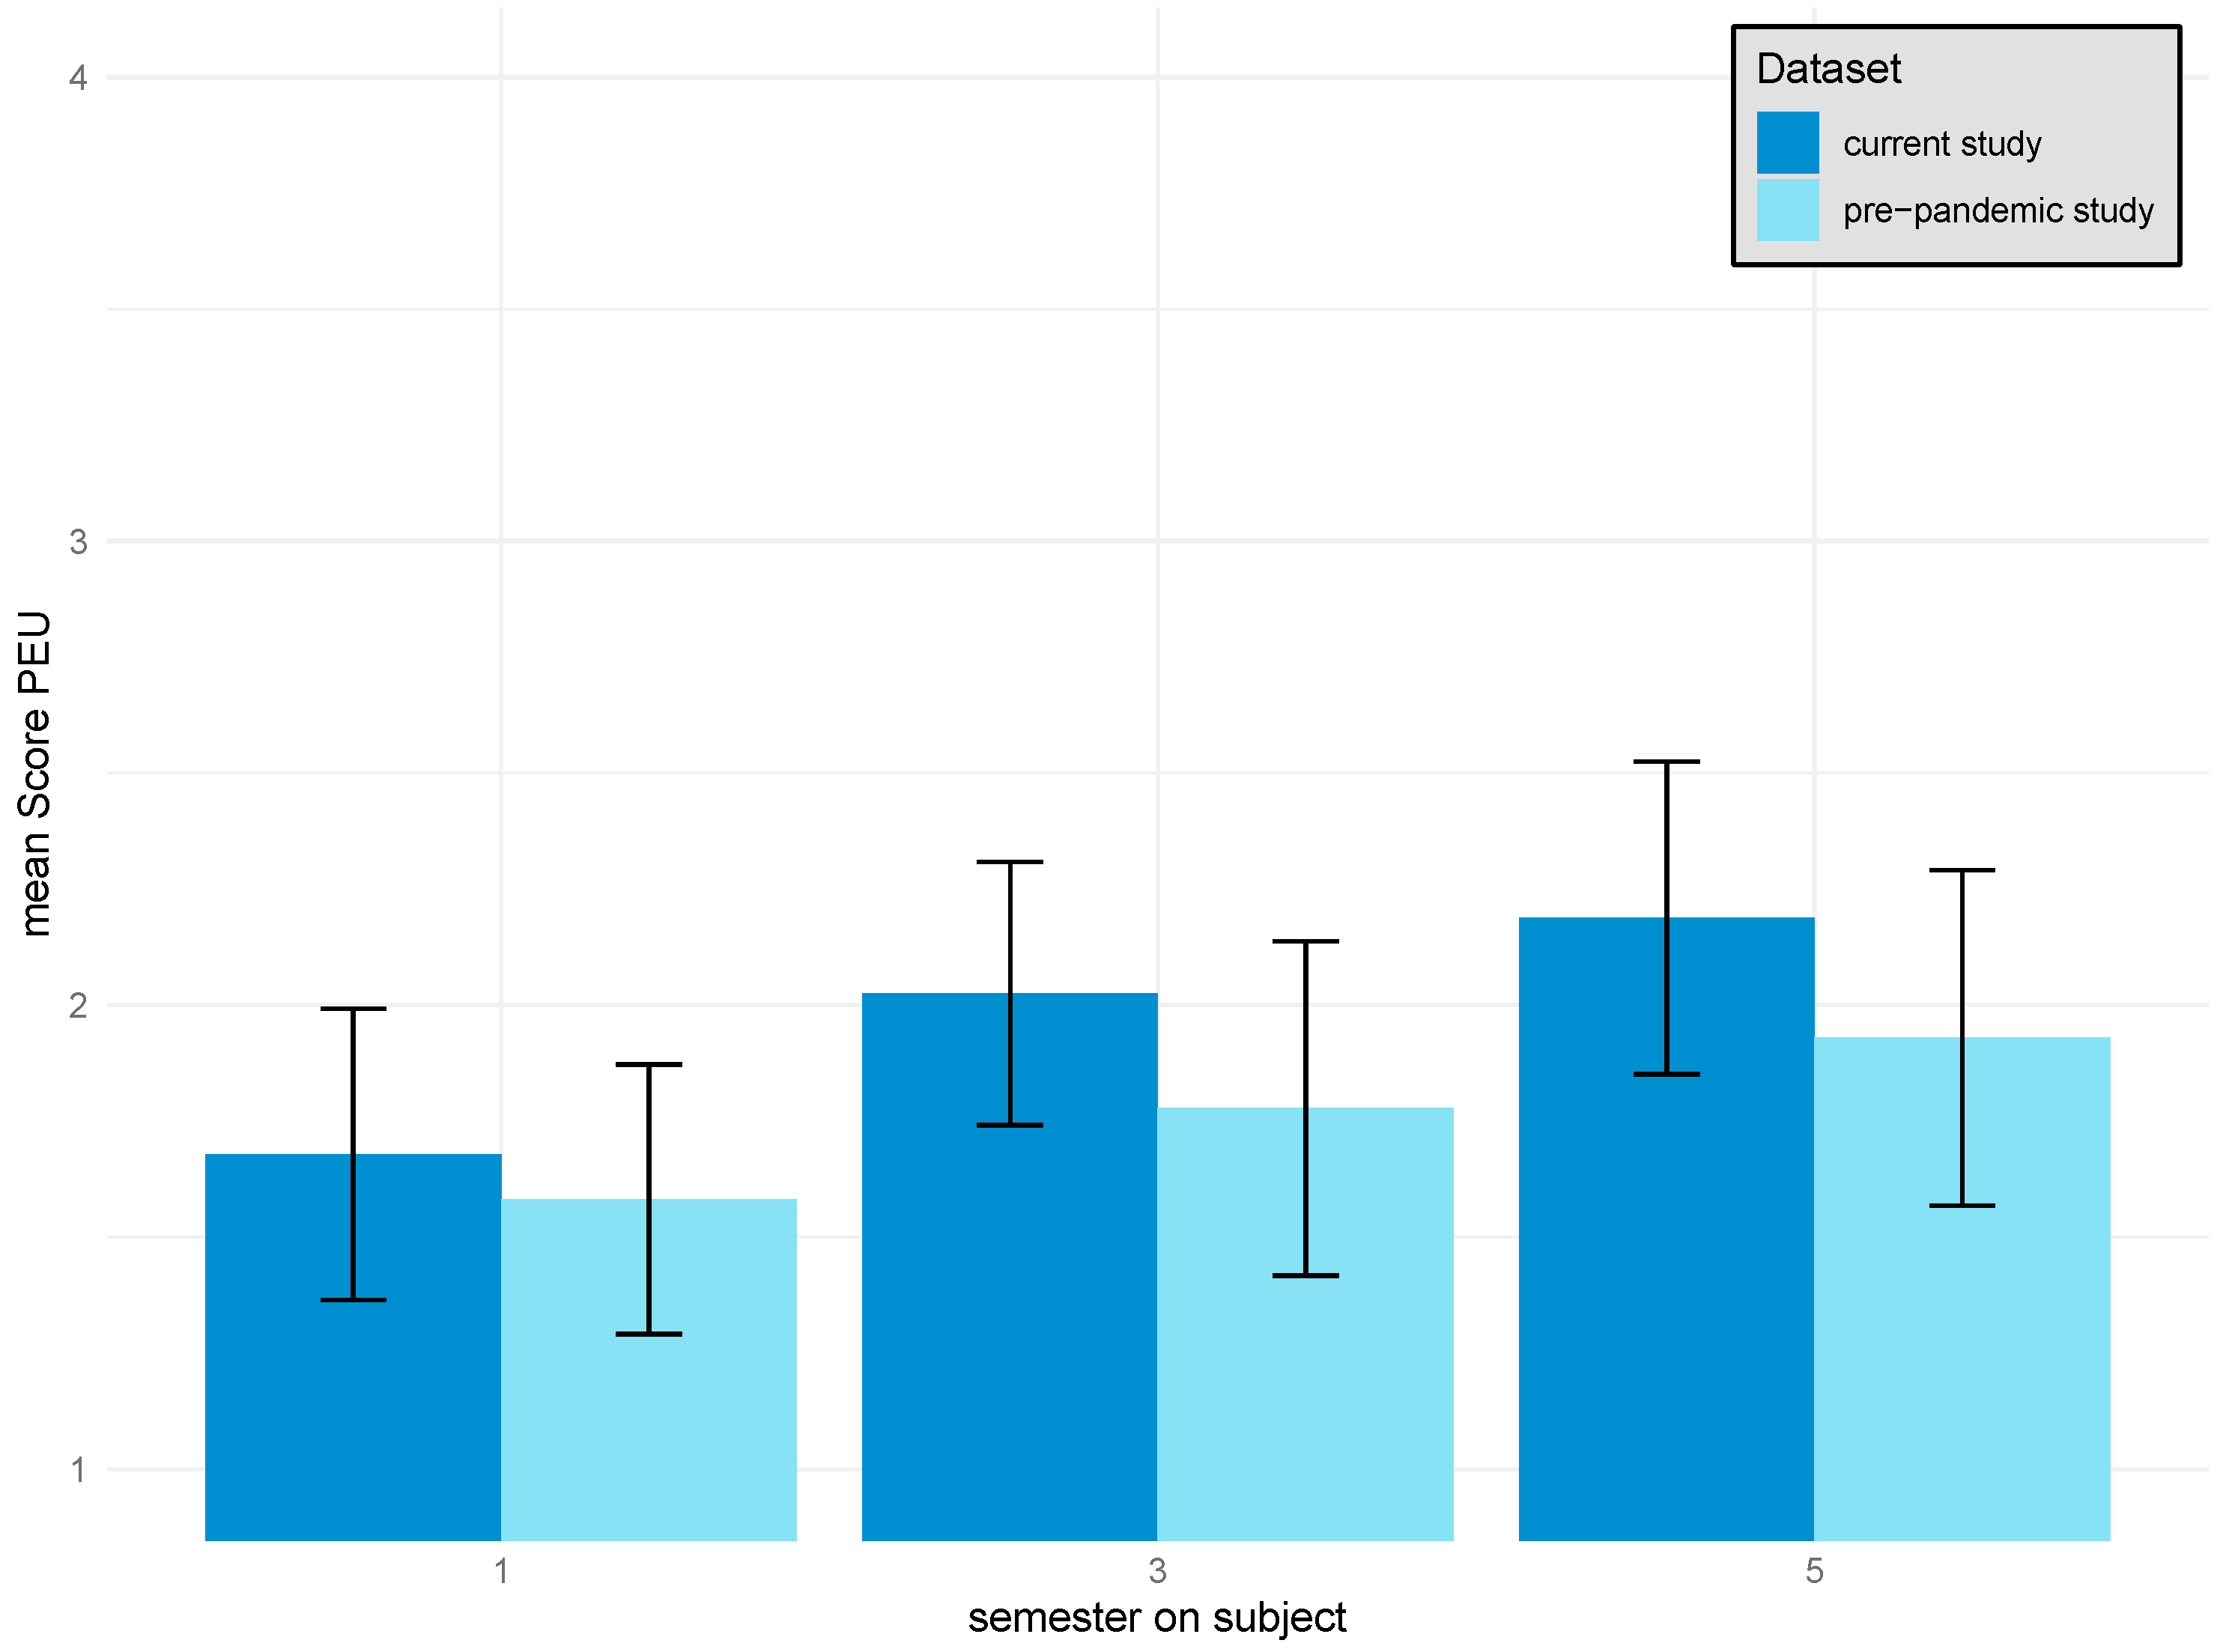
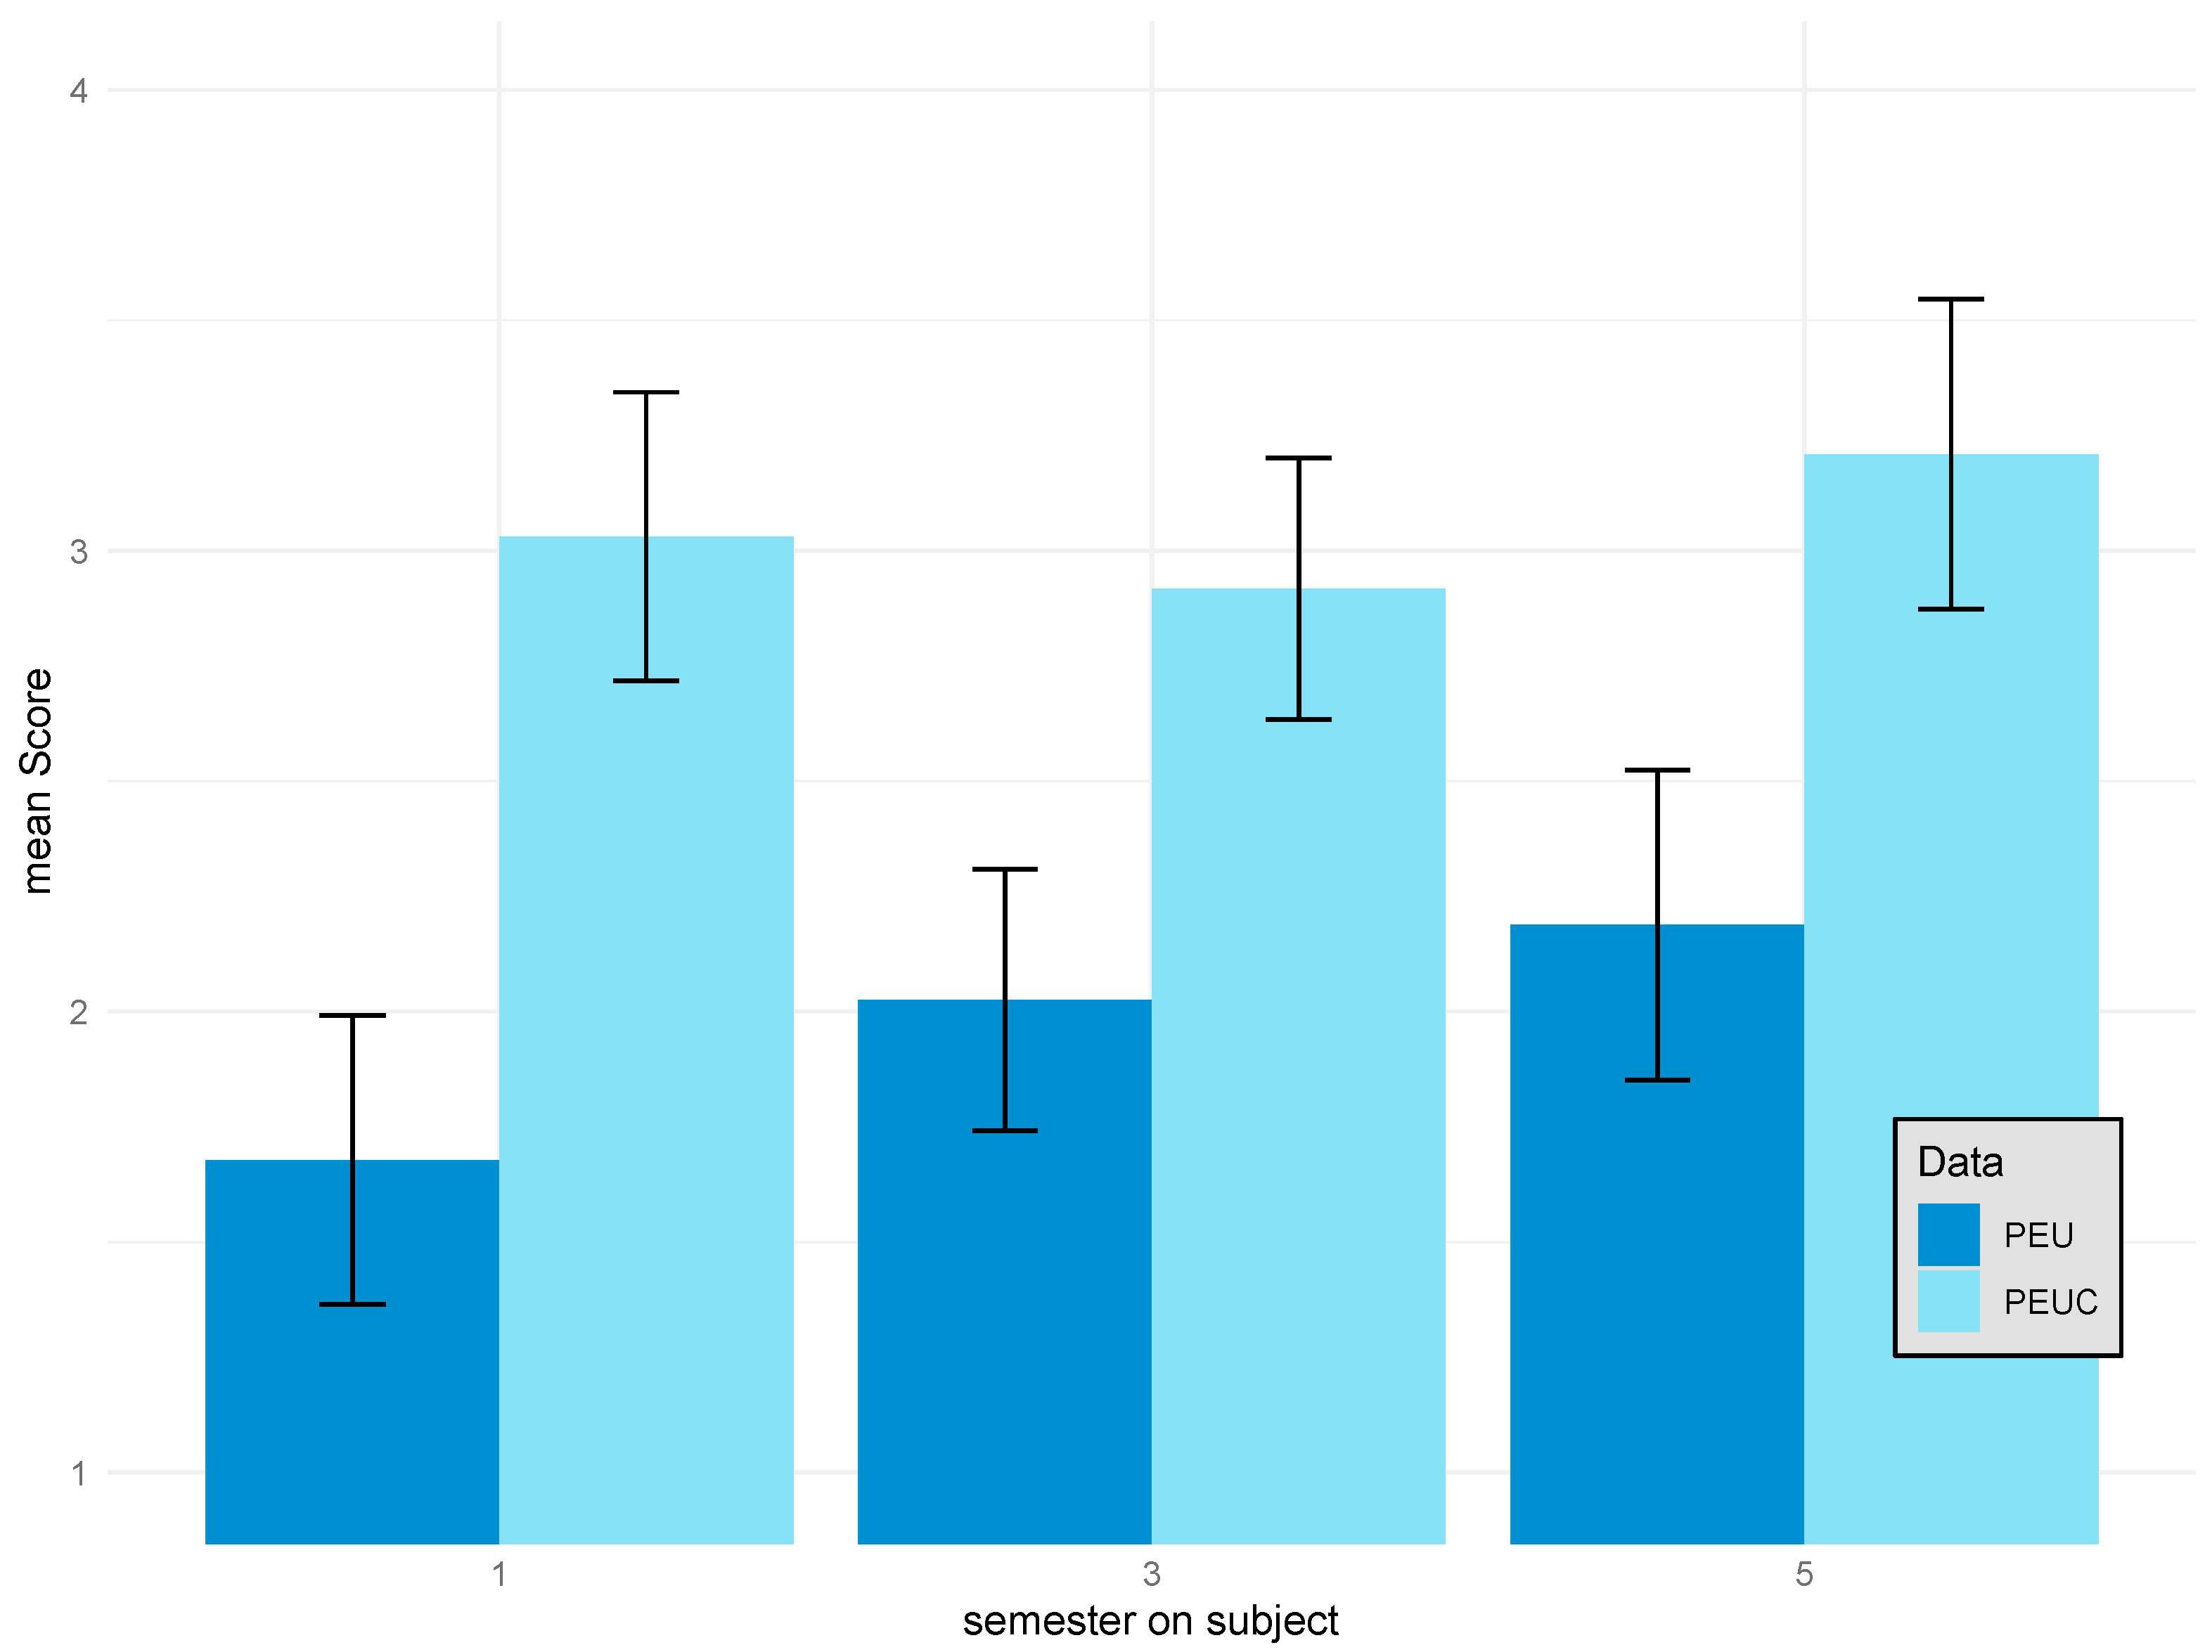
| PEU | 1.68 | 0.31 | 2.03 | 0.28 | 2.19 | 0.34 | 55.09 | 2 | 150 | <0.001 | 0.361 | 0.370 |
| PEUC | 4.46 | 2 | 150 | 0.11 | 0.017 | 0.030 | ||||||
| Group 1 | Group 2 | ||||||||||
|---|---|---|---|---|---|---|---|---|---|---|---|
| Comparison | M | SD | M | SD | Z | p | padj | VDA | CD | rg | |
| First vs. third semester | 1.68 | 0.31 | 2.03 | 0.28 | 55.09 | −4.73 | <0.001 | <0.001 | 0.193 | −0.614 | −0.614 |
| First vs. fifth semester | 1.68 | 0.31 | 2.19 | 0.34 | 55.09 | −7.01 | <0.001 | <0.001 | 0.130 | −0.740 | −0.741 |
| Third vs. fifth semester | 2.03 | 0.28 | 2.19 | 0.34 | 55.09 | −1.56 | 0.059 | 0.059 | 0.360 | −0.280 | −0.280 |
| Df | SumOfSqs | R2 | F | p | |
|---|---|---|---|---|---|
| DS_ID | 1 | 0.54 | 0.004 | 1.41 | 0.229 |
| Residual | 388 | 149.76 | 0.996 | ||
| Total | 389 | 150.30 | 1 |
| Df | SumOfSqs | R2 | F | p | |
|---|---|---|---|---|---|
| DS-ID | 1 | 1.69 | 0.01 | 5.50 | 0.016 |
| DA02 | 1 | 0.15 | 0 | 0.49 | 0.468 |
| Residual | 387 | 118.56 | 0.98 | ||
| Total | 389 | 120.40 | 1 |
| Scale Name | Abbreviation | Number of Items | Source | Anchor Item | N | M | SD | Mdn | IQR | β | κ | α |
|---|---|---|---|---|---|---|---|---|---|---|---|---|
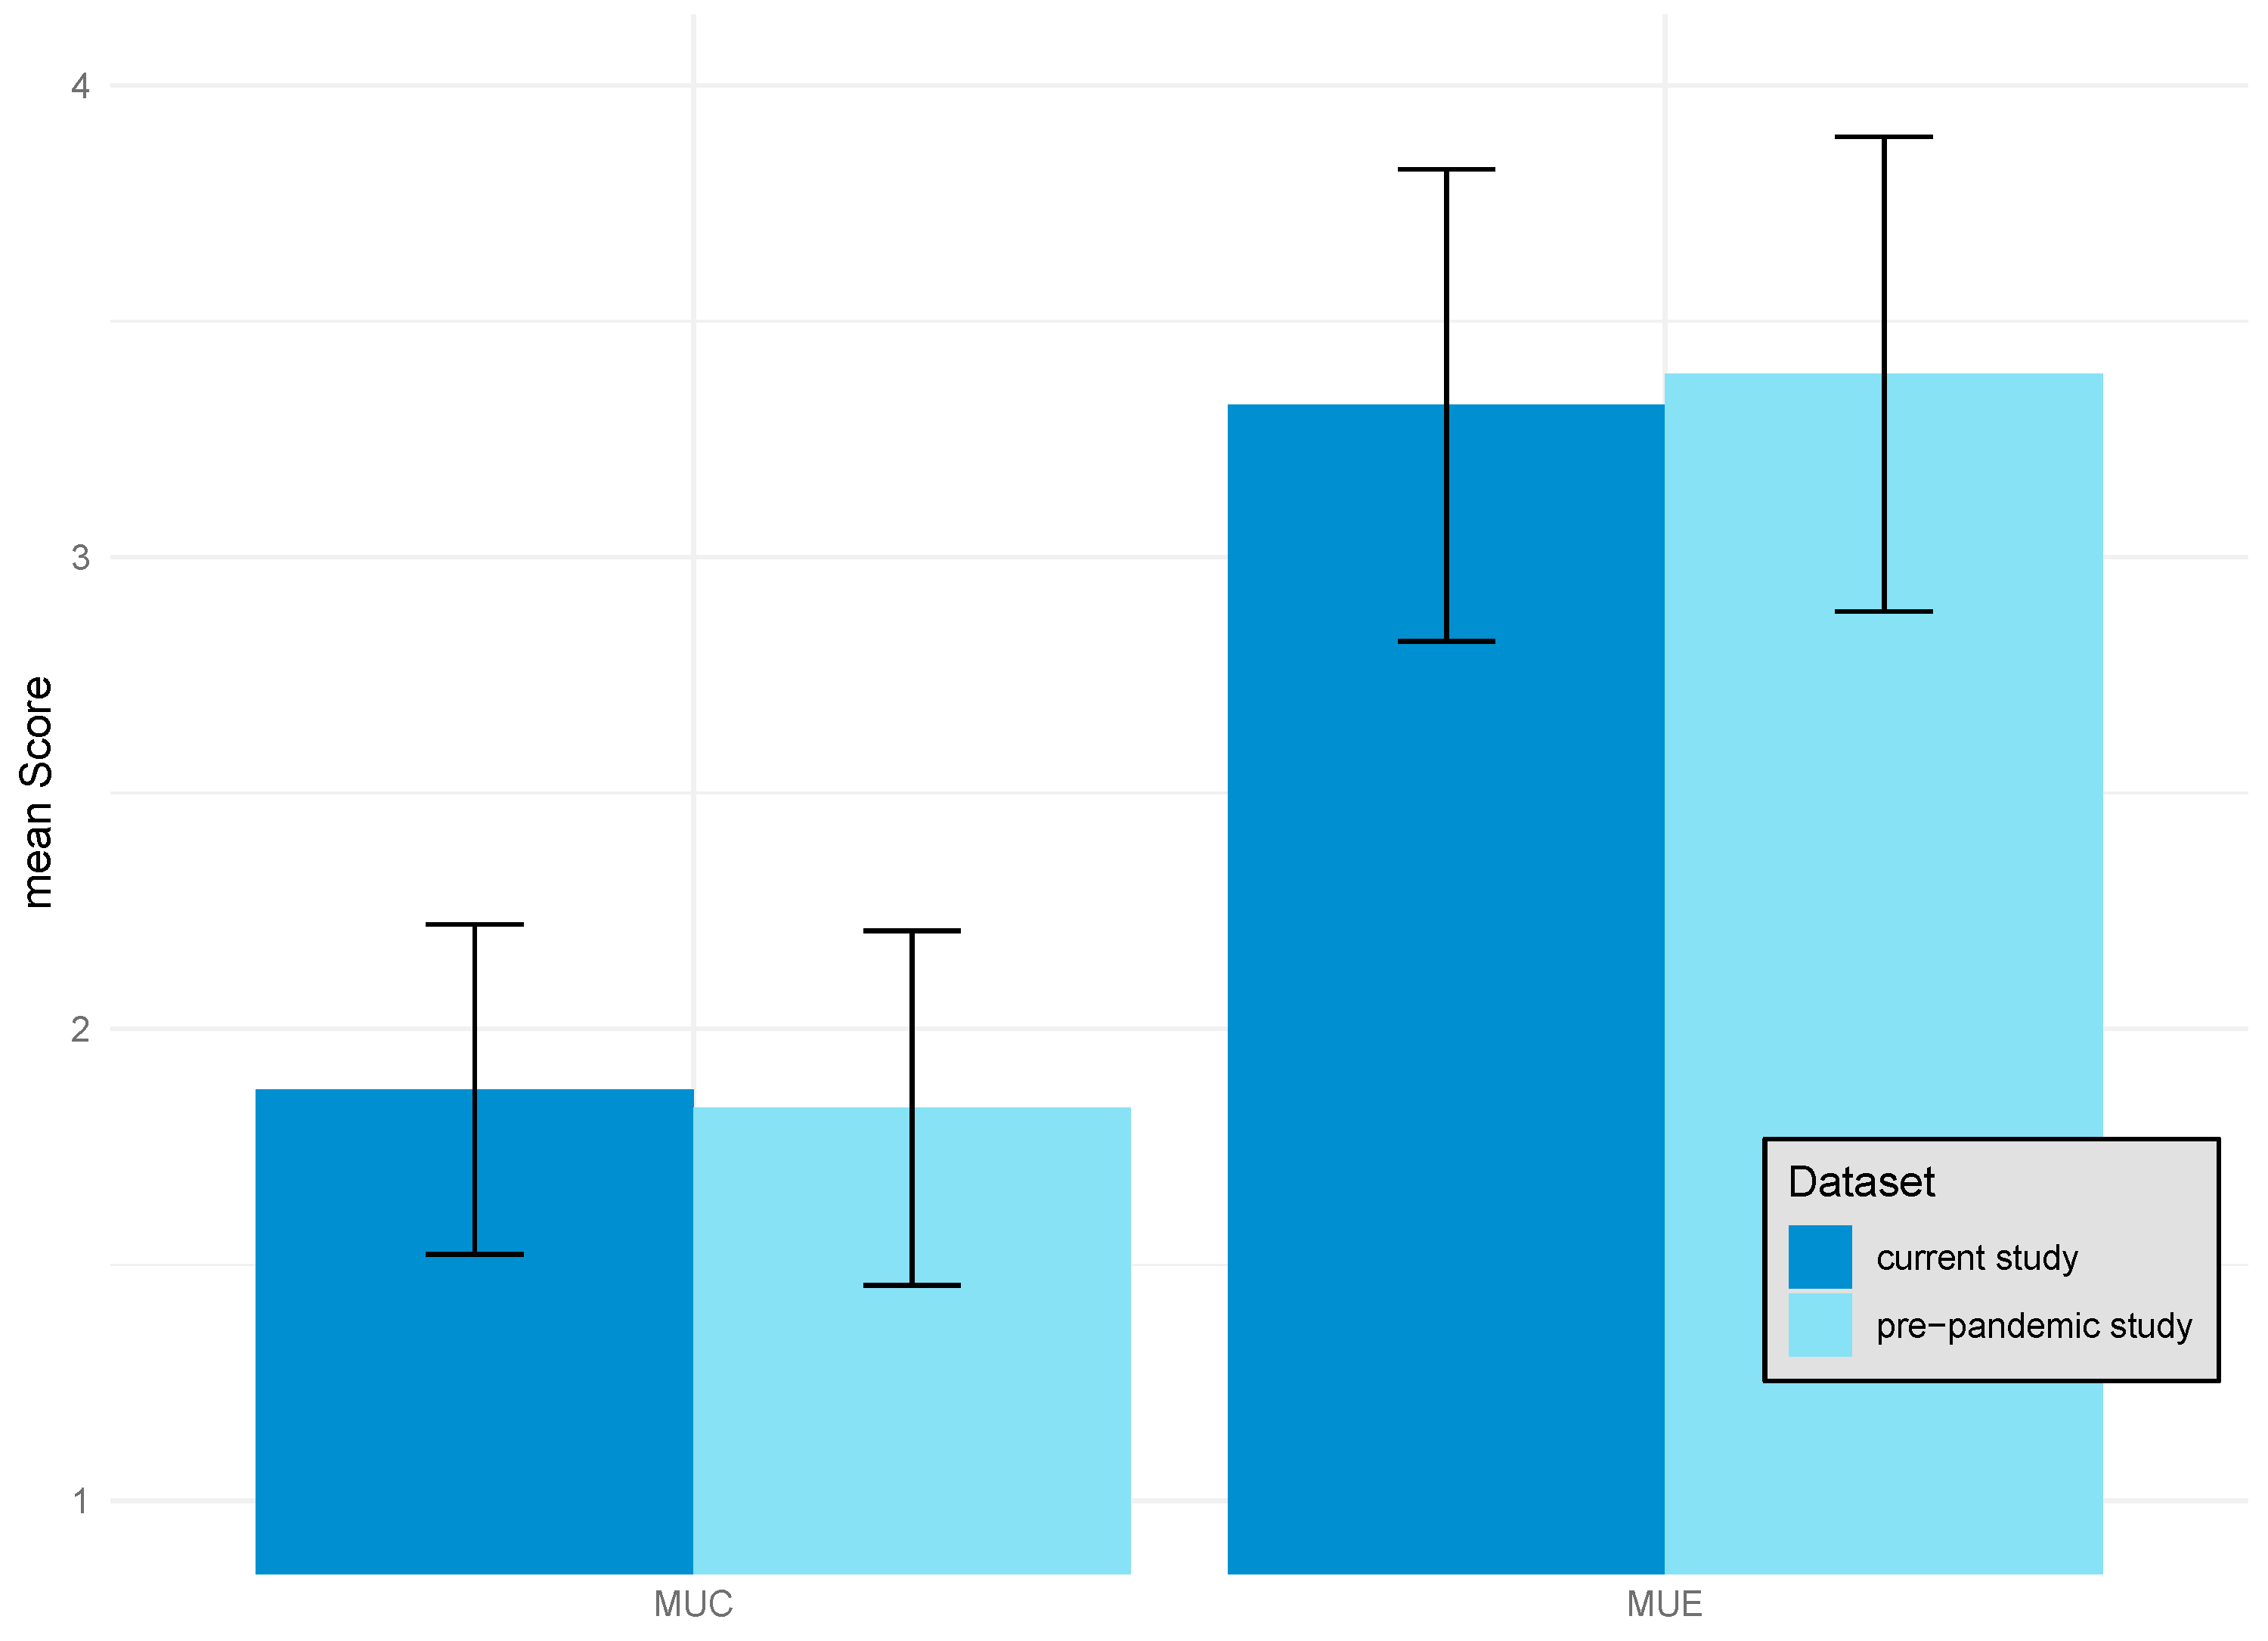
| Creating Media Use | MUC | 7 | Vogelsang | “I use digital media to design a website or blog”. | 150 | 1.87 | 1.1 | 1 | 2 | 0.87 | −0.71 | 0.4 |
| 238 | 1.84 | 0.97 | 2 | 1 | 0.86 | −0.39 | 0.58 | |||||
| Entertainment-oriented Media Use | MUE | 4 | Vogelsang | “I use digital media to have access to social networks or messenger services (e.g., Facebook, Whatsapp…).” | 150 | 3.32 | 0.81 | 4 | 1 | −0.93 | −0.03 | 0.57 |
| 239 | 3.39 | 0.81 | 4 | 1 | −1.2 | 0.7 | 0.55 | |||||
| Prior Experience School | PES | 14 | Vogelsang | “During my time at school I used the smartphone to carry out experiments”. | 148 | 1.66 | 0.97 | 1 | 1 | 1.24 | 0.27 | 0.71 |
| 240 | 1.59 | 0.91 | 1 | 1 | 1.36 | 0.7 | 0.77 | |||||
| Prior Experience School Communication Collaboration | PESC | 5 | newly developed | “During my time at school I used digital media to collaboratively edit a document (e.g., GoogleDocs, Nextcloud)”. | 148 | 1.54 | 0.88 | 1 | 1 | 1.6 | 1.58 | 0.77 |
| Prior Experience University | PEU | 14 | Vogelsang | “During my studies I used the smartphone to carry out experiments”. | 148 | 1.91 | 1.12 | 1 | 2 | 0.78 | −0.91 | 0.71 |
| 239 | 1.79 | 1.02 | 1 | 2 | 0.95 | −0.43 | 0.76 | |||||
| Prior Experience University Communication Collaboration | PEUC | 5 | newly developed | “During my studies I used digital media to collaboratively edit a document (e.g., GoogleDocs, Nextcloud)”. | 148 | 3.05 | 1.03 | 3 | 2 | −0.72 | −0.74 | 0.63 |
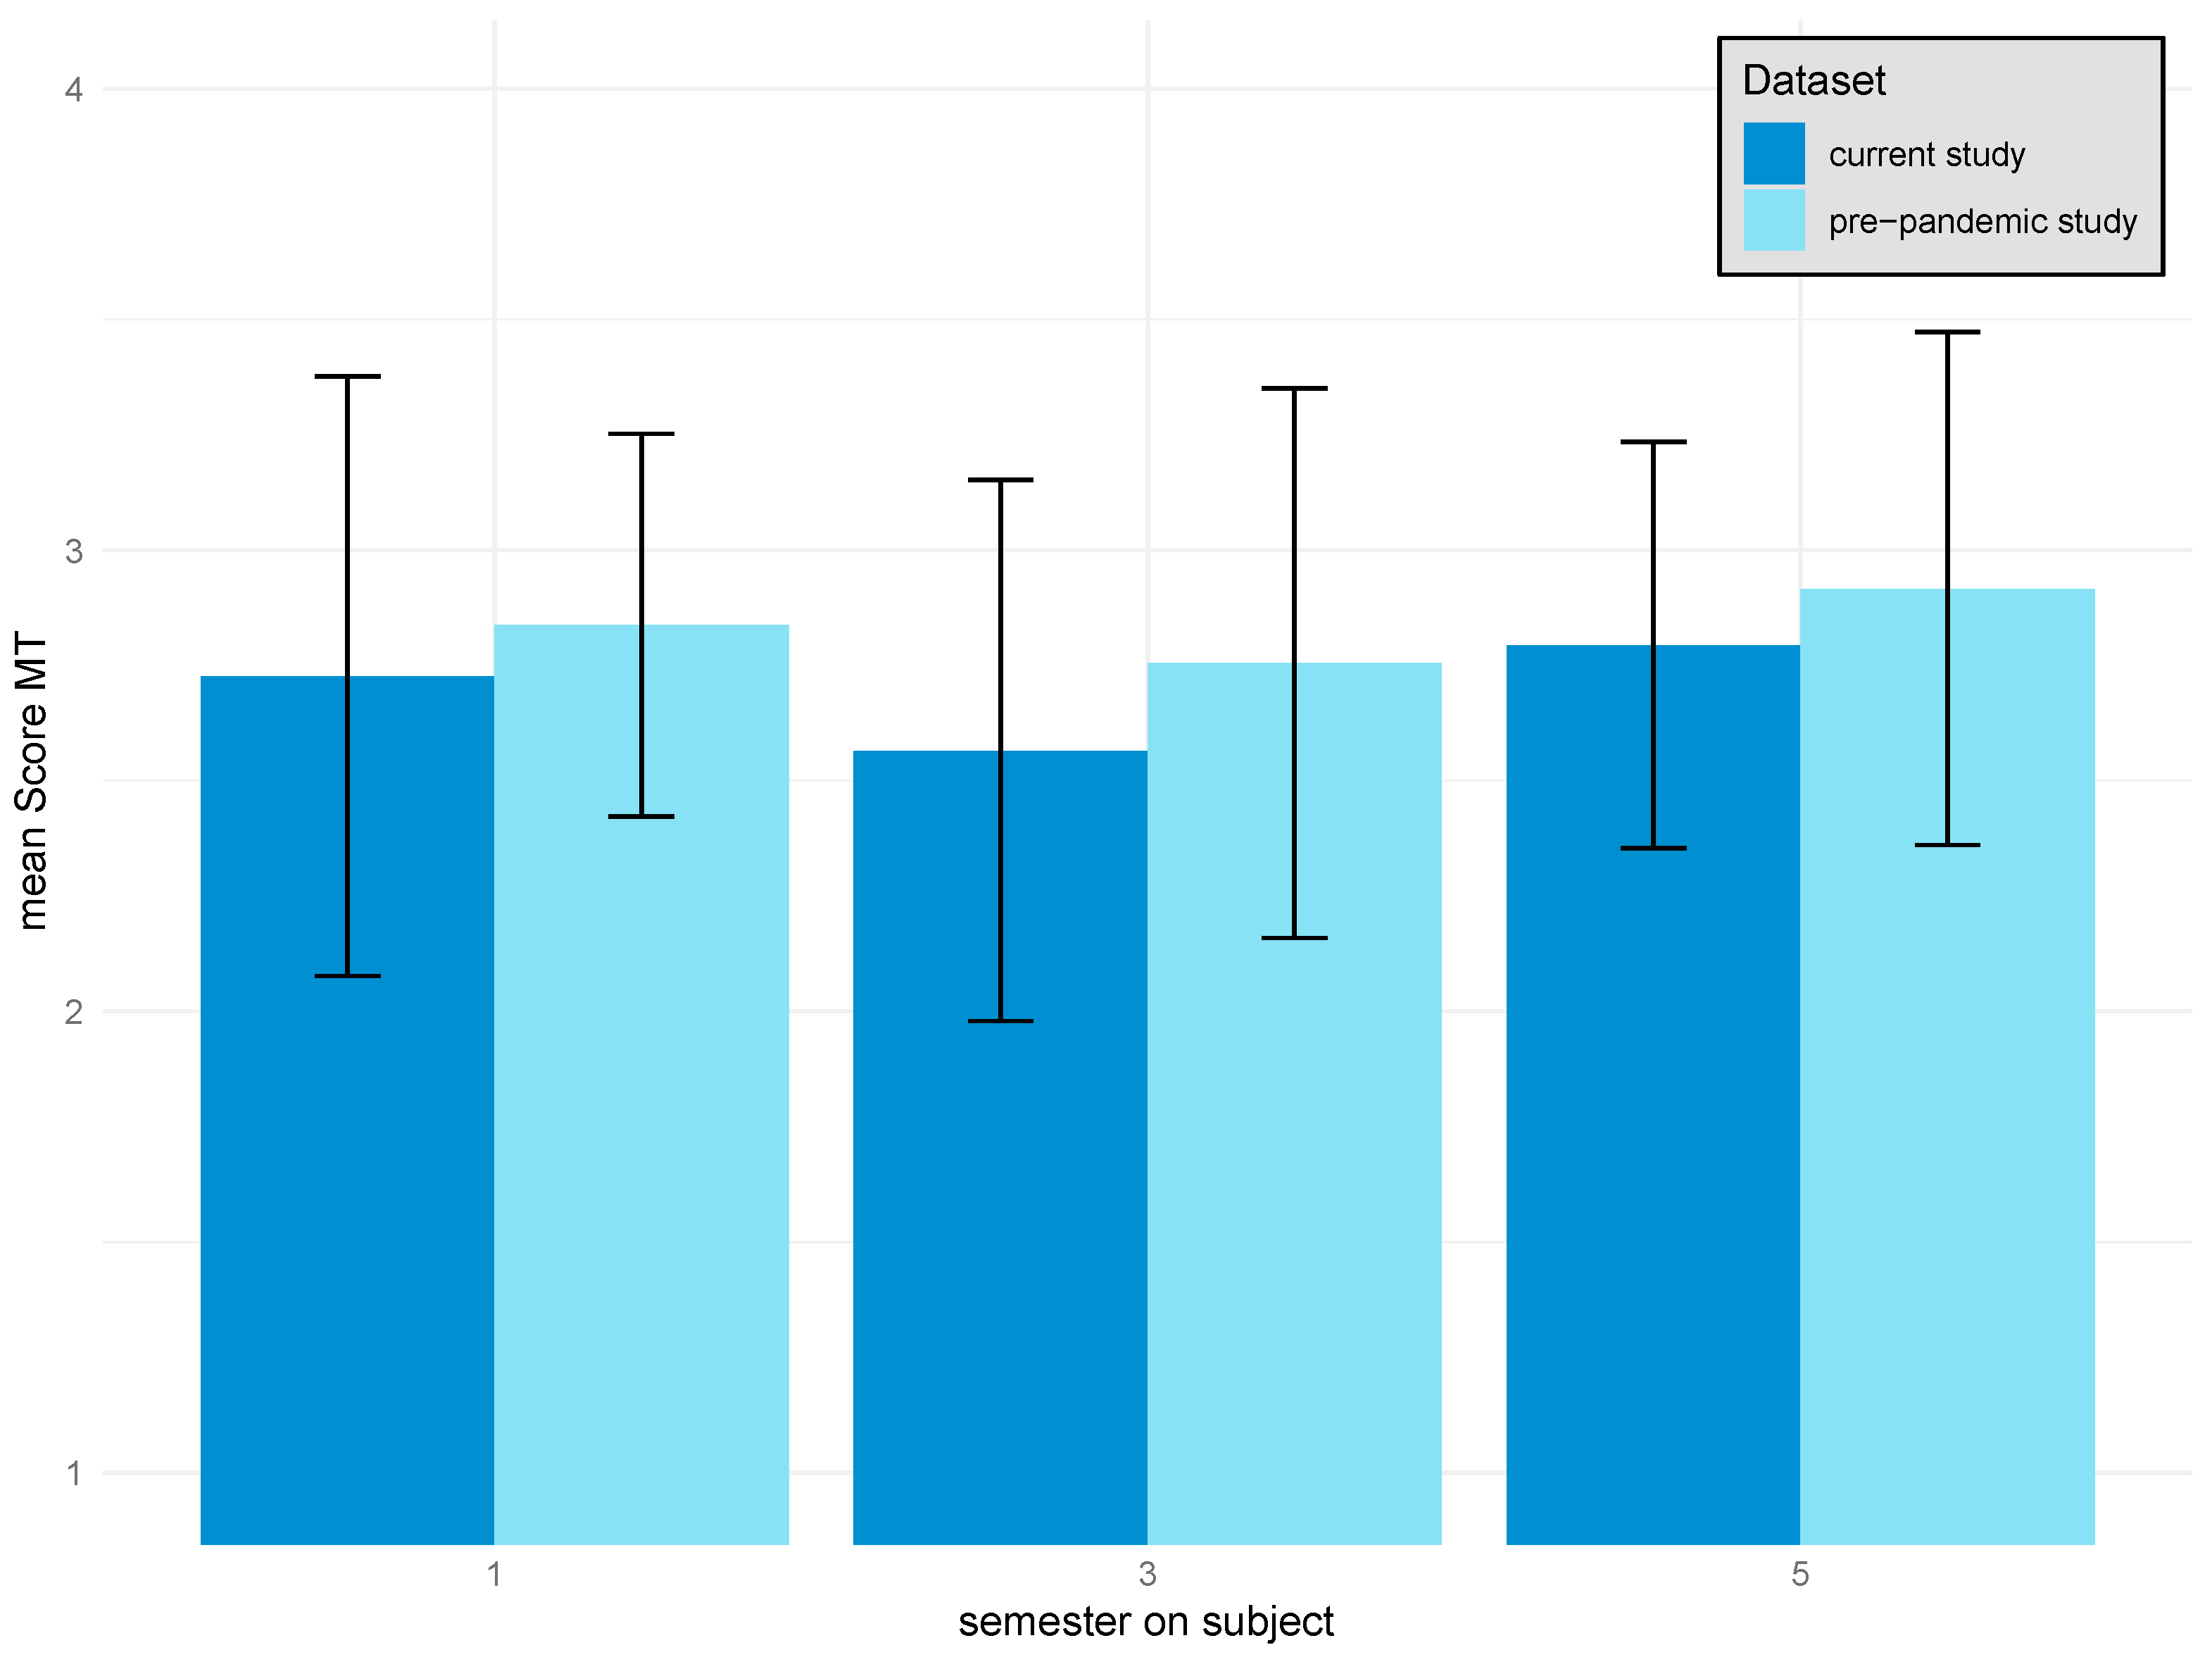
| Media In Teaching | MT | 7 | Vogelsang | “Pupils can be motivated easier to learn through the use of digital media”. | 146 | 2.71 | 0.89 | 3 | 1 | −0.27 | −0.65 | 0.81 |
| 239 | 2.84 | 0.8 | 3 | 1 | −0.29 | −0.38 | 0.81 | |||||
| Media In Teaching New | MTN | 3 | newly developed | “Learning with digital media should generally be given a strong position in school curricula”. | 147 | 2.8 | 0.89 | 3 | 1 | −0.27 | −0.68 | 0.73 |
Disclaimer/Publisher’s Note: The statements, opinions and data contained in all publications are solely those of the individual author(s) and contributor(s) and not of MDPI and/or the editor(s). MDPI and/or the editor(s) disclaim responsibility for any injury to people or property resulting from any ideas, methods, instructions or products referred to in the content. |
© 2024 by the authors. Licensee MDPI, Basel, Switzerland. This article is an open access article distributed under the terms and conditions of the Creative Commons Attribution (CC BY) license (https://creativecommons.org/licenses/by/4.0/).
Share and Cite
Henne, A.; Möhrke, P.; Huwer, J.; Thoms, L.-J. Finally Digital Natives? Changes in Media Use among Science Students during the COVID-19 Pandemic. Educ. Sci. 2024, 14, 555. https://doi.org/10.3390/educsci14060555
Henne A, Möhrke P, Huwer J, Thoms L-J. Finally Digital Natives? Changes in Media Use among Science Students during the COVID-19 Pandemic. Education Sciences. 2024; 14(6):555. https://doi.org/10.3390/educsci14060555
Chicago/Turabian StyleHenne, Anna, Philipp Möhrke, Johannes Huwer, and Lars-Jochen Thoms. 2024. "Finally Digital Natives? Changes in Media Use among Science Students during the COVID-19 Pandemic" Education Sciences 14, no. 6: 555. https://doi.org/10.3390/educsci14060555
APA StyleHenne, A., Möhrke, P., Huwer, J., & Thoms, L.-J. (2024). Finally Digital Natives? Changes in Media Use among Science Students during the COVID-19 Pandemic. Education Sciences, 14(6), 555. https://doi.org/10.3390/educsci14060555