Review

Impact and Classification of Augmented Reality in Science Experiments in Teaching—A Review

by
Sabrina Syskowski
1,2,*,
Sandra Wilfinger
1,2 and
Johannes Huwer
1,2,*
1
Chair of Science Education, Department of Chemistry, University of Konstanz, 78464 Konstanz, Germany
2
Chair of Science Education, Thurgau University of Education, 8280 Kreuzlingen, Switzerland
*
Authors to whom correspondence should be addressed.
Educ. Sci. 2024, 14(7), 760; https://doi.org/10.3390/educsci14070760
Submission received: 13 May 2024 / Revised: 27 June 2024 / Accepted: 7 July 2024 / Published: 12 July 2024
(This article belongs to the Special Issue Teaching and Learning with Virtual/Augmented Reality)

Abstract

:
Augmented reality (AR) improves science education by facilitating teaching and experiments in schools and universities. Studies show positive effects, like increased motivation and improved concept connections, but there is a lack of consistency in the implementation and investigation of AR in science experiments. This review examines AR usage, criteria, design parameters for the development of AR applications and the validation methods, taking into account the PRISMA guidelines. A Web of Science database search using “Publish or Perish” software (version 23.4.0) identified 247 potentially relevant articles from 2000 to March 2024 in international, peer-reviewed journals. After removing duplicates, inaccessible abstracts, and applying inclusion and exclusion criteria, 40 studies were selected for in-depth analysis. Physics had the most AR applications, primarily for visualizing invisible properties. Most studies used quantitative or qualitative methods, only a few used both or did not conduct empirical research. Research questions varied, but common drawbacks included small sample sizes and low use of AR design parameters such as interactivity, adaptivity, realistic representation and use of game elements. This review identifies opportunities for improvement in the implementation and investigation of AR in science education experiments and emphasizes consistent and rigorous approaches to fully exploit the benefits of AR in science education.

1. Introduction

Experiments play a central role in science education as they provide students with a unique opportunity to engage with science (chemistry, biology and physics) through multi-sensory experiences. These experiments not only promote hands-on and inquiry skills, but also familiarize students with various instruments, equipment, and substances, thus promoting deeper conceptual understanding [1]. However, historical debates have questioned the value of experiments in science education. In the 1970s and 1980s, researchers raised doubts about the efficacy of experiments, due to a lack of concrete evidence of their benefits [2,3,4]. This skepticism extended to concerns about the costs and time investment associated with traditional experiments, which led to investigations into more cost-effective alternatives [2,5]. In addition, issues such as students’ lack of understanding when conducting experiments and safety concerns further fueled the debate. Despite these reservations, Carnduff and Reid [6] highlighted the unique skills fostered through experimentation, particularly practical, observational, analytical, and problem-solving skills that are difficult to cultivate through traditional teaching methods.
The complex nature of experiments presents a challenge for science education, as students must bridge the macro-level of immediate sensory perception and the interpretation of sub-microscopic phenomena, while simultaneously capturing and representing these experiences [7]. Navigating these levels requires intricate cognitive processes that must be supported by educators. Students’ struggle to understand the underlying concepts, especially in relation to spatial understanding and three-dimensional thinking, highlighting the hurdles in science education [8]. However, studies indicate that improving spatial skills can lead to better academic performance, particularly in female students [9].
Tablets and smartphones as part of the student learning experience have been shown to benefit student motivation and learning achievement [10], as well as to enhance students’ self-efficacy [11]. Augmented Reality (AR) technology in particular, has proven to be a powerful tool in this context, bridging the gap between the virtual and real world. AR seamlessly integrates virtual objects, both 2D and 3D, into our tangible reality, creating a dynamic and interactive learning experience.
AR emerges as a transformative tool within science education, offering students an innovative means of interacting with subjects. AR has the potential to complement traditional learning approaches by providing engaging, immersive experiences. Numerous studies have demonstrated the positive impact of AR on motivation, self-efficacy, attitudes, and learning outcomes [12,13]. AR applications also aid in understanding abstract concepts, as seen in the study by Radu et al. [14], where students who used AR exhibited a deeper understanding of electromagnetism and faster knowledge transfer. The ability of AR to visualize otherwise invisible processes and structures at the sub-microscopic level further accentuates its potential [15,16].
Furthermore, AR addresses challenges associated with spatial skills and laboratory safety, while potentially reducing costs. Despite its promise, it is important to note that an excess of information through diverse channels can strain cognitive load. Nevertheless, depending on the AR application, cognitive load can either remain on par with traditional approaches or even be reduced [17,18,19].
Recent literature reviews underscore the growing prominence of AR in science education. Scholars have explored its benefits, challenges, and technology trends [20,21,22,23,24,25], revealing a surge in research related to AR in chemistry experiments over the past decade, particularly in the last three years [26].
This review aims to compare existing literature on AR applications in science experiments, with a focus on identifying key design parameters and their impact on successful implementations. By examining the designated design parameters employed for integrating AR into educational experiments, we strive to determine the critical conditions and factors that lead to effective use of AR in enhancing science education. Through this comprehensive analysis, we seek to identify trends, suggest future possibilities for optimized AR implementations, and derive guidelines for the appropriate design and application of AR in science experiments based on the identified parameters. Addressing key research questions, we delve into the experiments enhanced by AR, examine empirical evaluations of AR-enhanced laboratories, and analyze how the implementation of specific design parameters influences the outcomes and learning experiences for AR in educational experiments. This review follows the PRISMA standard, outlining the literature search process, selection criteria, and methodologies employed [27]. Ultimately, our goal is to provide evidence-based recommendations for leveraging the transformative potential of AR to advance science education effectively.
The following research questions (RQ) were established for this work:
RQ1: Which experiments in science education become enhanced through AR? How does AR become implemented in experiments in science education?
RQ2: How are the AR enhanced laboratories examined empirically?
RQ3: How are the designated design parameters for AR in educational experiments implemented?

2. Theoretical Background

2.1. Potential of Augmented Reality in Experiments in Science Education

Experiments hold significant importance in science education, although challenges persist, as discussed earlier, including issues around students’ understanding of experimental purpose and methodology [28]. Safety concerns are another deterrent, especially for novice students, who might lack familiarity with laboratory settings and protocols for instrument operation and chemical handling. Conversely, Carnduff and Reid [6] argue that experiments foster practical, analytical, and problem-solving skills that are hard to cultivate through other methods.
To address these concerns, the integration of AR offers potential benefits. AR enables students to interact with the learning material in novel ways, which can enhance the traditional learning experience. Studies have shown that AR has positive effects on motivation, self-efficacy, attitudes, and learning performance [29,30,31]. AR supports the understanding of abstract concepts [21,22,23,24,25], as demonstrated by Radu et al. [14], where AR users exhibited better understanding of electromagnetism and faster knowledge transfer.
AR’s potential extends to spatial skills enhancement [32]. An AR application to train spatial skills for chemistry students yielded better understanding and problem-solving skills [33]. AR can also address safety concerns, reduce costs, and increase confidence in instrument and chemical handling [1,34,35,36,37,38,39]. However, excessive information through various channels could strain cognitive load, though AR applications can alleviate this [17,19]. Radu et al. [14] found AR’s powerful stimulation engaged multiple dimensions of engagement. Recent literature reviews explore AR’s increasing significance in science education [21,22,23,24,25,26,40]. This review seeks to analyze the applications of AR in science education, focusing on experiments in teaching.

2.2. Defining Augmented Reality

Milgram defines AR as an intermediate step in the whole range from the real to the virtual environment: the reality–virtuality (RV) continuum [41]. It can be described as a fluid transition between the real environment to AR (real environment enhanced with virtual objects) and augmented virtuality (AV) and finally to a completely virtual environment, where an entire world is synthetically created. This transition occurs along a continuum. The middle of this continuum, where virtual and real objects are displayed side by side, are forms of mixed reality [41]. Azuma [42] refines the definition of AR as a variation of virtual reality (VR). Virtual environments allow users to completely immerse themselves in a synthetically created world while shutting off their real surroundings. The virtual environment can, but does not have to, mimic the characteristics of the real environment. AR does not replace the surroundings with a virtual one, but rather enhances the real environment with virtual objects that complement the user’s actual surroundings [42]. Azuma defines AR as a combination of reality and virtuality that works interactively in real time. AR should be registered in 3D so that devices other than head mounted displays (HMDs) can also be used [42].

2.3. Design Parameters to AR-Learning Environments

To select and compare the literature, a set of seven design parameters for AR-Learning environments was used that was developed from Krug et al. [43,44]. These parameters are adaptivity, interactivity, immersion, congruence with reality, content proximity to reality, game elements, and complexity.
Each parameter has different levels or indicators that allow the comparison of different AR applications. In the following section, the different parameters and their levels and indicators are explained individually.

2.3.1. Adaptivity

According to Krug et al. [43,44] adaptivity describes the capacity of the user or the program itself to adapt the application to different situations. It is the ability of a program to react to activities, events or changes in situations, or a combination of them. This definition is the result of authors combining the definitions from Paramythis and Loidl-Reisinger [45] and Söldner [46]. A reaction could be a dynamic adjustment in the software elements or service. The indicators of this parameter are split into four levels and defined in Table S1 in the Supplementary Material. The table shows the different levels of “adaptivity” and describes how the program can adapt to the user’s needs, from no adaptability (level 1) to fully automatic adaptation based on sensor input and user activity (level 4).

2.3.2. Interactivity

The definition of interactivity was defined by Krug et al. [43,44], according to Schulmeister [47], as the intended interaction with an object, device, or content of a digital media component. There are six levels of interactivity (see in detail Table S2). The levels of interactivity range from the observation and reproduction/reflection/reporting of an object (level 1) to the generation of processes, as well as construction and manipulation with situational feedback (level 6). Higher levels enable more active participation and influence of the user on the content.

2.3.3. Immersion

Slater and Wilbur [48] defined immersion as a description of a technology in which a digital media can influence the senses of a human user, particularly how it composes an “inclusive, extensive, surrounding and vivid illusion” for the user. To determine the level of immersion Krug et al. [43] constructed indicators around the human senses (visual, auditory, haptic, olfactory, gustatory). The degree of immersion gets higher as more senses are involved.

2.3.4. Congruence with Reality

This parameter is based on the definition of congruence with reality by Krug et al. [43,44] according to McMahan [49]. It is divided into social reality and perceptual reality. The former describes how plausible and realistic to life occurrences and social interactions are depicted. Perceptual reality specifies how real objects and events appear outwardly. It describes how realistic the appearance and acoustics of an object are. The more indicators an AR application has, the higher the degree of the congruence with reality. The various indicators are described in Table S3 in the Supplementary Material.

2.3.5. Content Proximity to Reality

The plausibility of AR content in terms of causal, local, and temporal factors is defined by this parameter, as well as the plausible use and depiction of the tracking method according to Krug et al. [43,44]. To avoid overlap with the previous parameter, the outer appearance of the object is not investigated with the indicators of content proximity to reality (see in detail Table S4). With each additional indicator, the degree of the parameter increases.

2.3.6. Game Elements

Gamification, or the use of game elements in education, can enhance the interactivity and motivation [50]. Krug et al. [43] established eight indicators for this parameter. The level of this parameter increases with the inclusion of each additional indicator.
The indicators include clear rules/goals, conflicts/challenges for users, opportunities for control and manipulation, scoring systems such as points or feedback, opportunities for interaction between user and program, social interaction between users, independence from a particular environment, and the presence of an overarching story or narrative (see in detail Table S5).

2.3.7. Complexity

This parameter illustrates the content and cognitive structures of the AR functions according to Krug et al. [43,44]. The user’s knowledge performance increases with increasing complexity [43,44]. Complexity was formulated according to the ESNAS model [51] (evaluation of standards in science, technology, engineering, art, and mathematics (STE(A)M) education in secondary school). For this parameter five levels are defined (see in detail Table S6) [43,44].
At the lowest level (1), individual facts such as technical terms or properties are described. Level 2 comprises two unrelated facts. At level 3, functional relationships between facts are placed in context. Level 4 links different contexts to form complex relationships such as cycles. The highest level 5 describes higher-level, situation-independent concepts.

3. Methodology

To determine the implementation of AR in science experiments in an educational context, we followed the four stages of the PRISMA standard [27] for the external structure of the selection process (see Figure 1). First, the literature entries from the database are identified by means of keywords, which are described in detail in the subsection “Literature search”. The next step was to check for duplicates. Then, in a combined screening phase, in which first the abstracts and then the articles were screened, non-qualifying papers were excluded. The exclusion criteria used are explained in more detail in the Section 3.2. The study of Krug et al. [43,44] was used to evaluate the AR applications with regard to the design parameters.

3.1. Selection of the Papers

To find appropriate literature, a search of the Web of Science database was conducted using the Publish or Perish software [52]. Only quality journals that meet the criteria of being international, peer-reviewed, and recognized in the scientific community can be found in the database Web of Science. Keywords were selected to filter publications related to AR in science education with an experimental context. The following keywords were used: “Augmented Reality AND Chemistry OR Biology OR Physics OR STEM OR STEAM AND experiment OR experiment*”. Only published studies between 2000 and March 2024 were chosen. As “Publish or Perish” only indicates 200 publications, the search was split into two searches: 2000–2021 and 2022–2024. To verify results, the search for 2021–2022 was also used as a comparison, and these searches matched. In April 2024, we identified 247 articles that may be suitable. Checking for duplicates showed only two articles that needed to be removed.

3.2. Criteria Screening

In this phase, the title and abstract of each potential paper were examined, and the full-text papers were retrieved. Five abstracts could not be retrieved so we deleted these reports. The next steps were carried out by using inclusion or exclusion criteria. The criteria were worded as a “yes” or “no” question, meaning that the articles could have a hit or a miss for each criterion. The reason for reports being excluded was no reference to a school or university science education (n = 62). If the reference to science education was given, we focused on the experiments and excluded 87 references with no experiments or reviews that did not include experiments of their own. We identified nine references that did not use AR in their experiments, and 40 references that used VR, which we also excluded.
We also excluded a reference with a remote experiment. If the paper could not be classified after reading the abstract, the full text was read. Only the article by Martinez et al. [53] was excluded at this stage of the analysis, as the corresponding article could not be obtained. After this selection process, 40 studies were chosen to be analyzed in detail for the present review.
The process of abstract and paper selection and sorting was deliberated through dialogic discourse between the authors.

3.3. Extraction of Study Content

The information needed to analyze the literature on the research questions was extracted and the AR applications developed were compared. The objective for each AR and the point in the experimentation process at which it was used were also recorded. The subjects, topics and experiments were compared. The literature was organized according to the type of research conducted and the different research interests and outcomes were analyzed. The different design indicators were also assessed [43]. To examine the design parameters used, the corresponding parameters and indicators were identified.

4. Results

The distribution of publications over a period of 14 years shows a significant increase in the integration of AR technology in science education experiments between 2016 and 2020. However, the number of new publications per year related to AR in science education with experiments has slightly declined since then (Figure 2). The trend between 2016 and 2020 aligns with the findings of Garzón et al. [54] and Sırakaya and Sırakaya [55], which report a steady increase in the utilization of AR in education. The growing popularity of mobile devices in academic settings [56] and the progressive enhancement of these devices’ processing capabilities [36] could potentially account for this surge in AR implementation. Mazzuco et al. [26] also demonstrated this for AR applications in the field of chemistry.

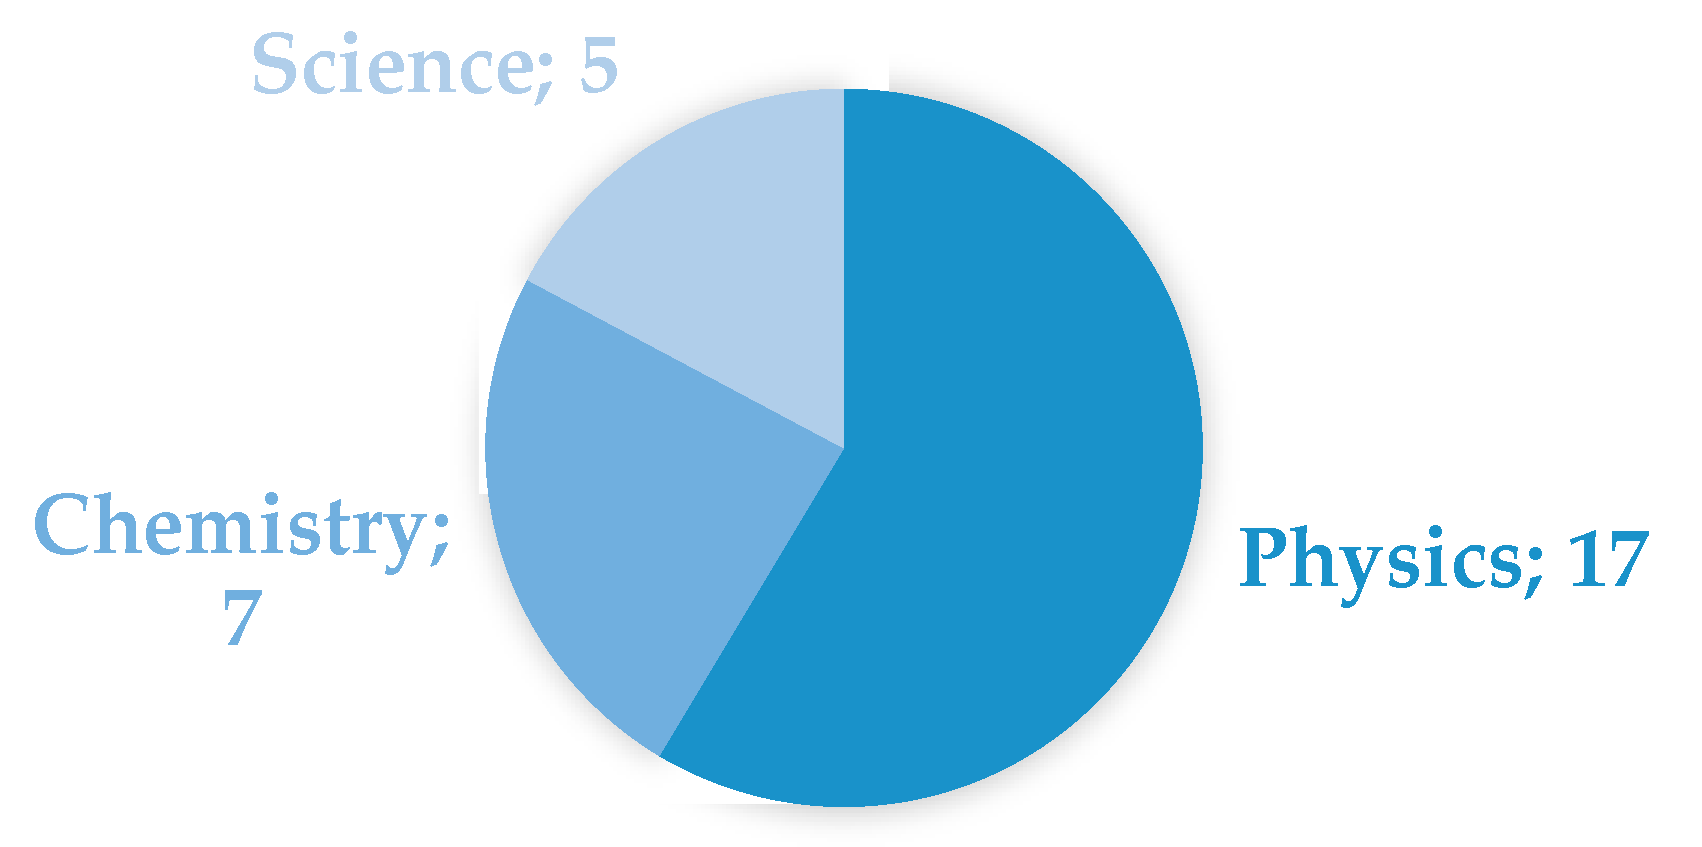
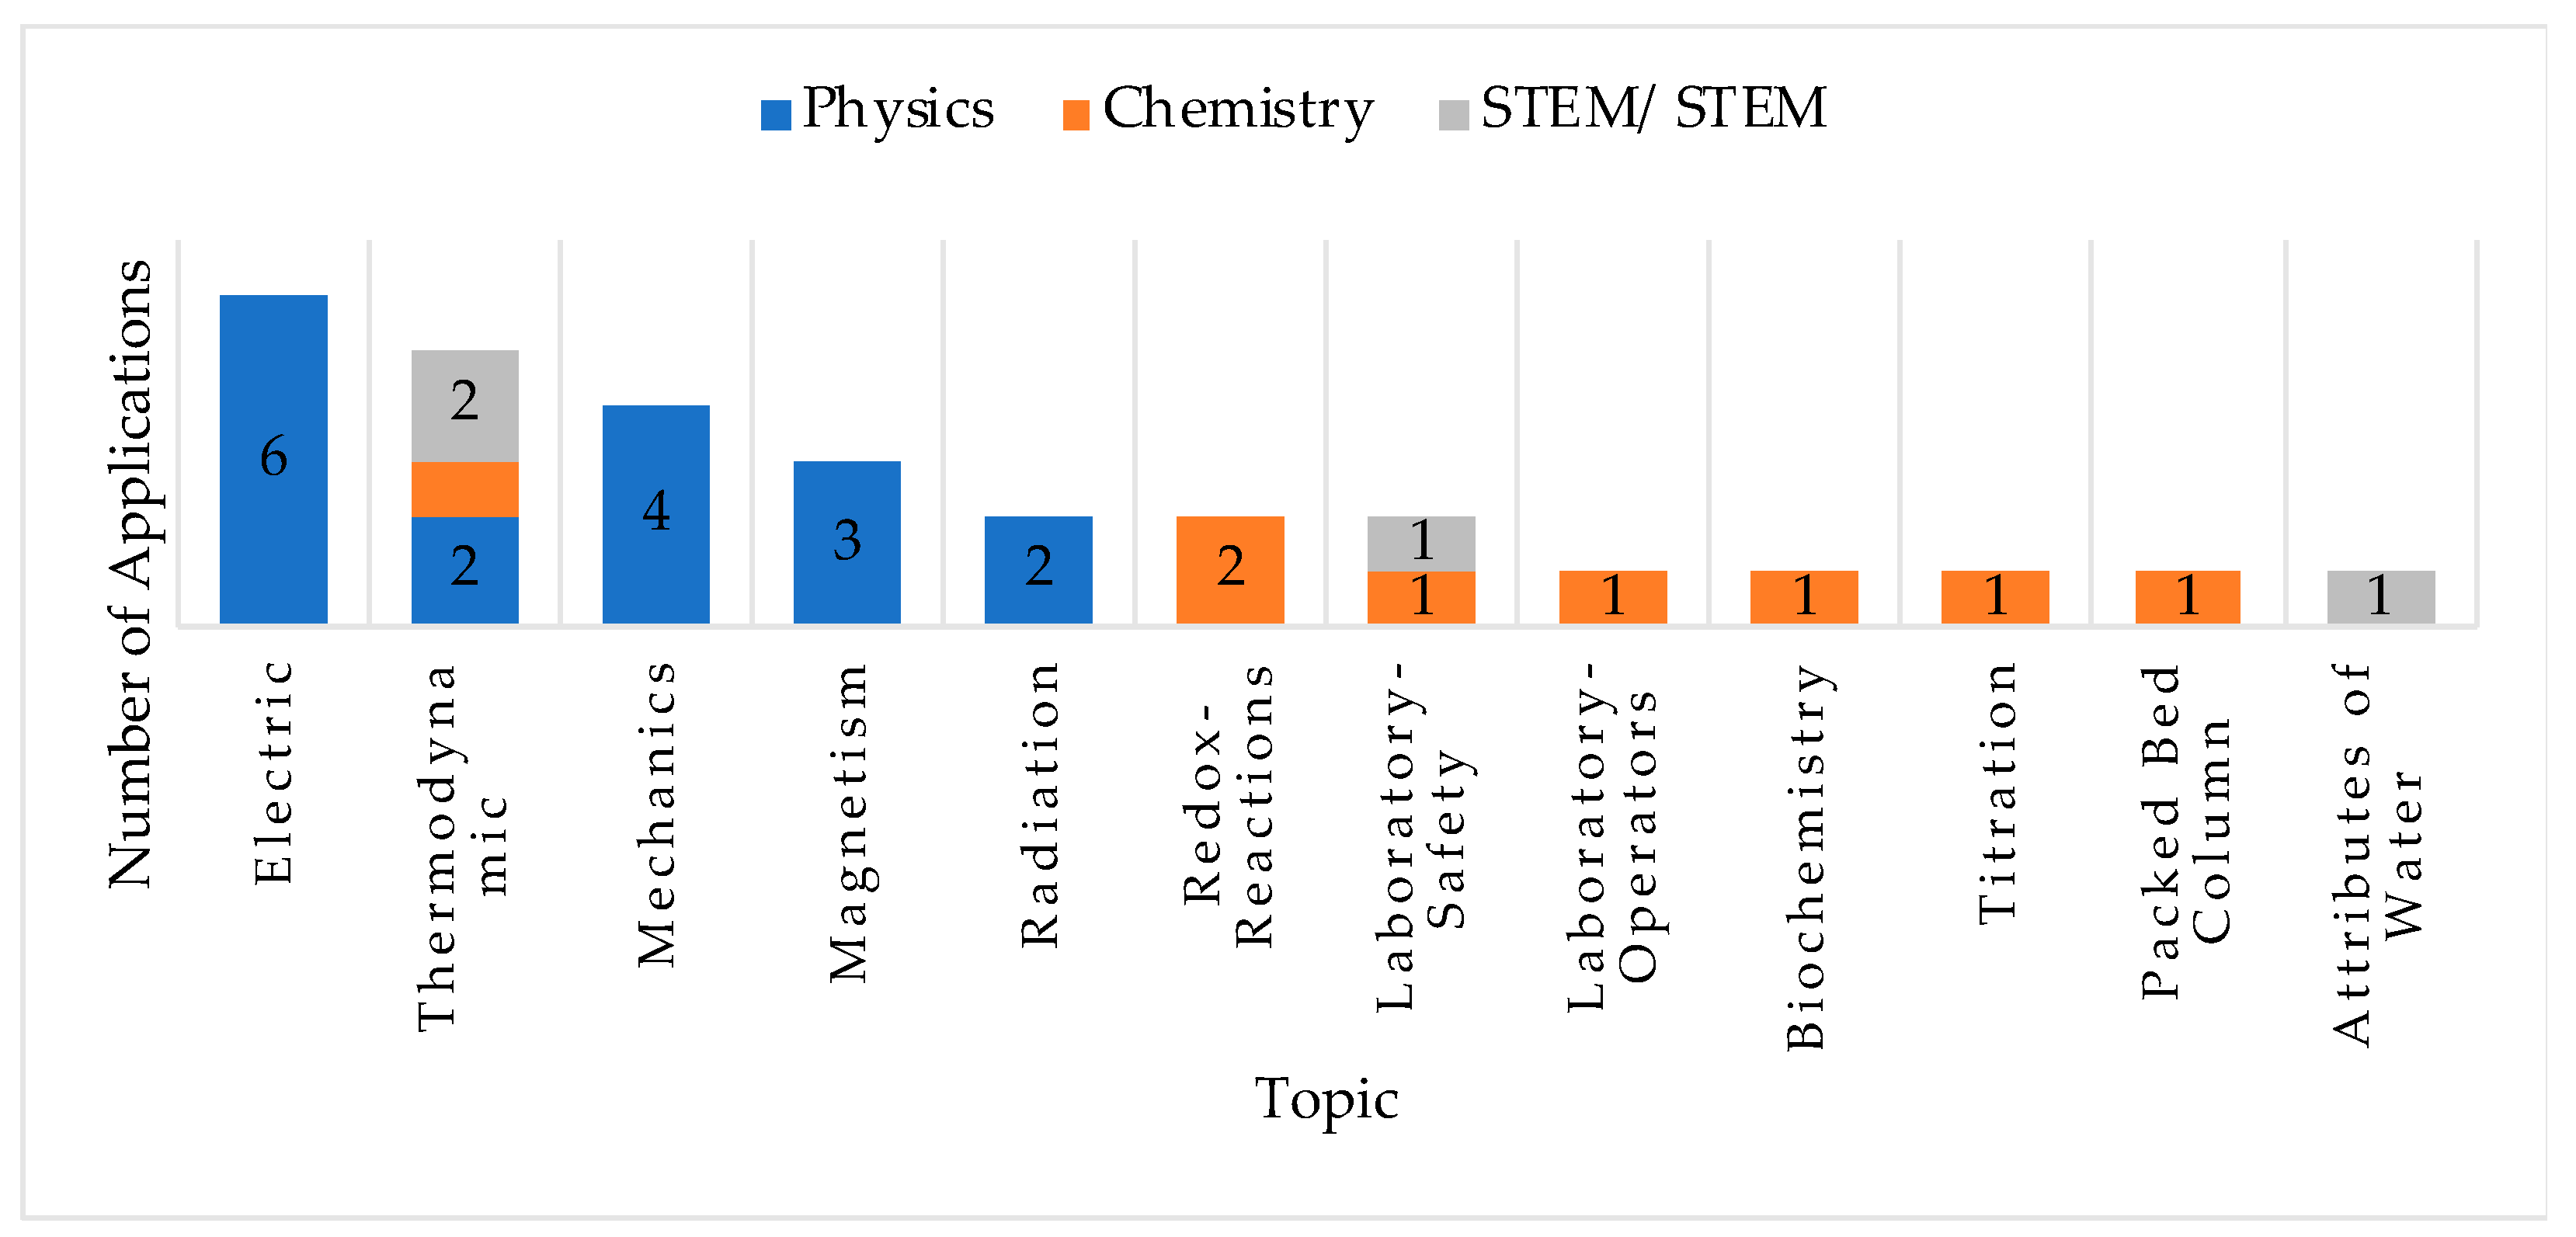
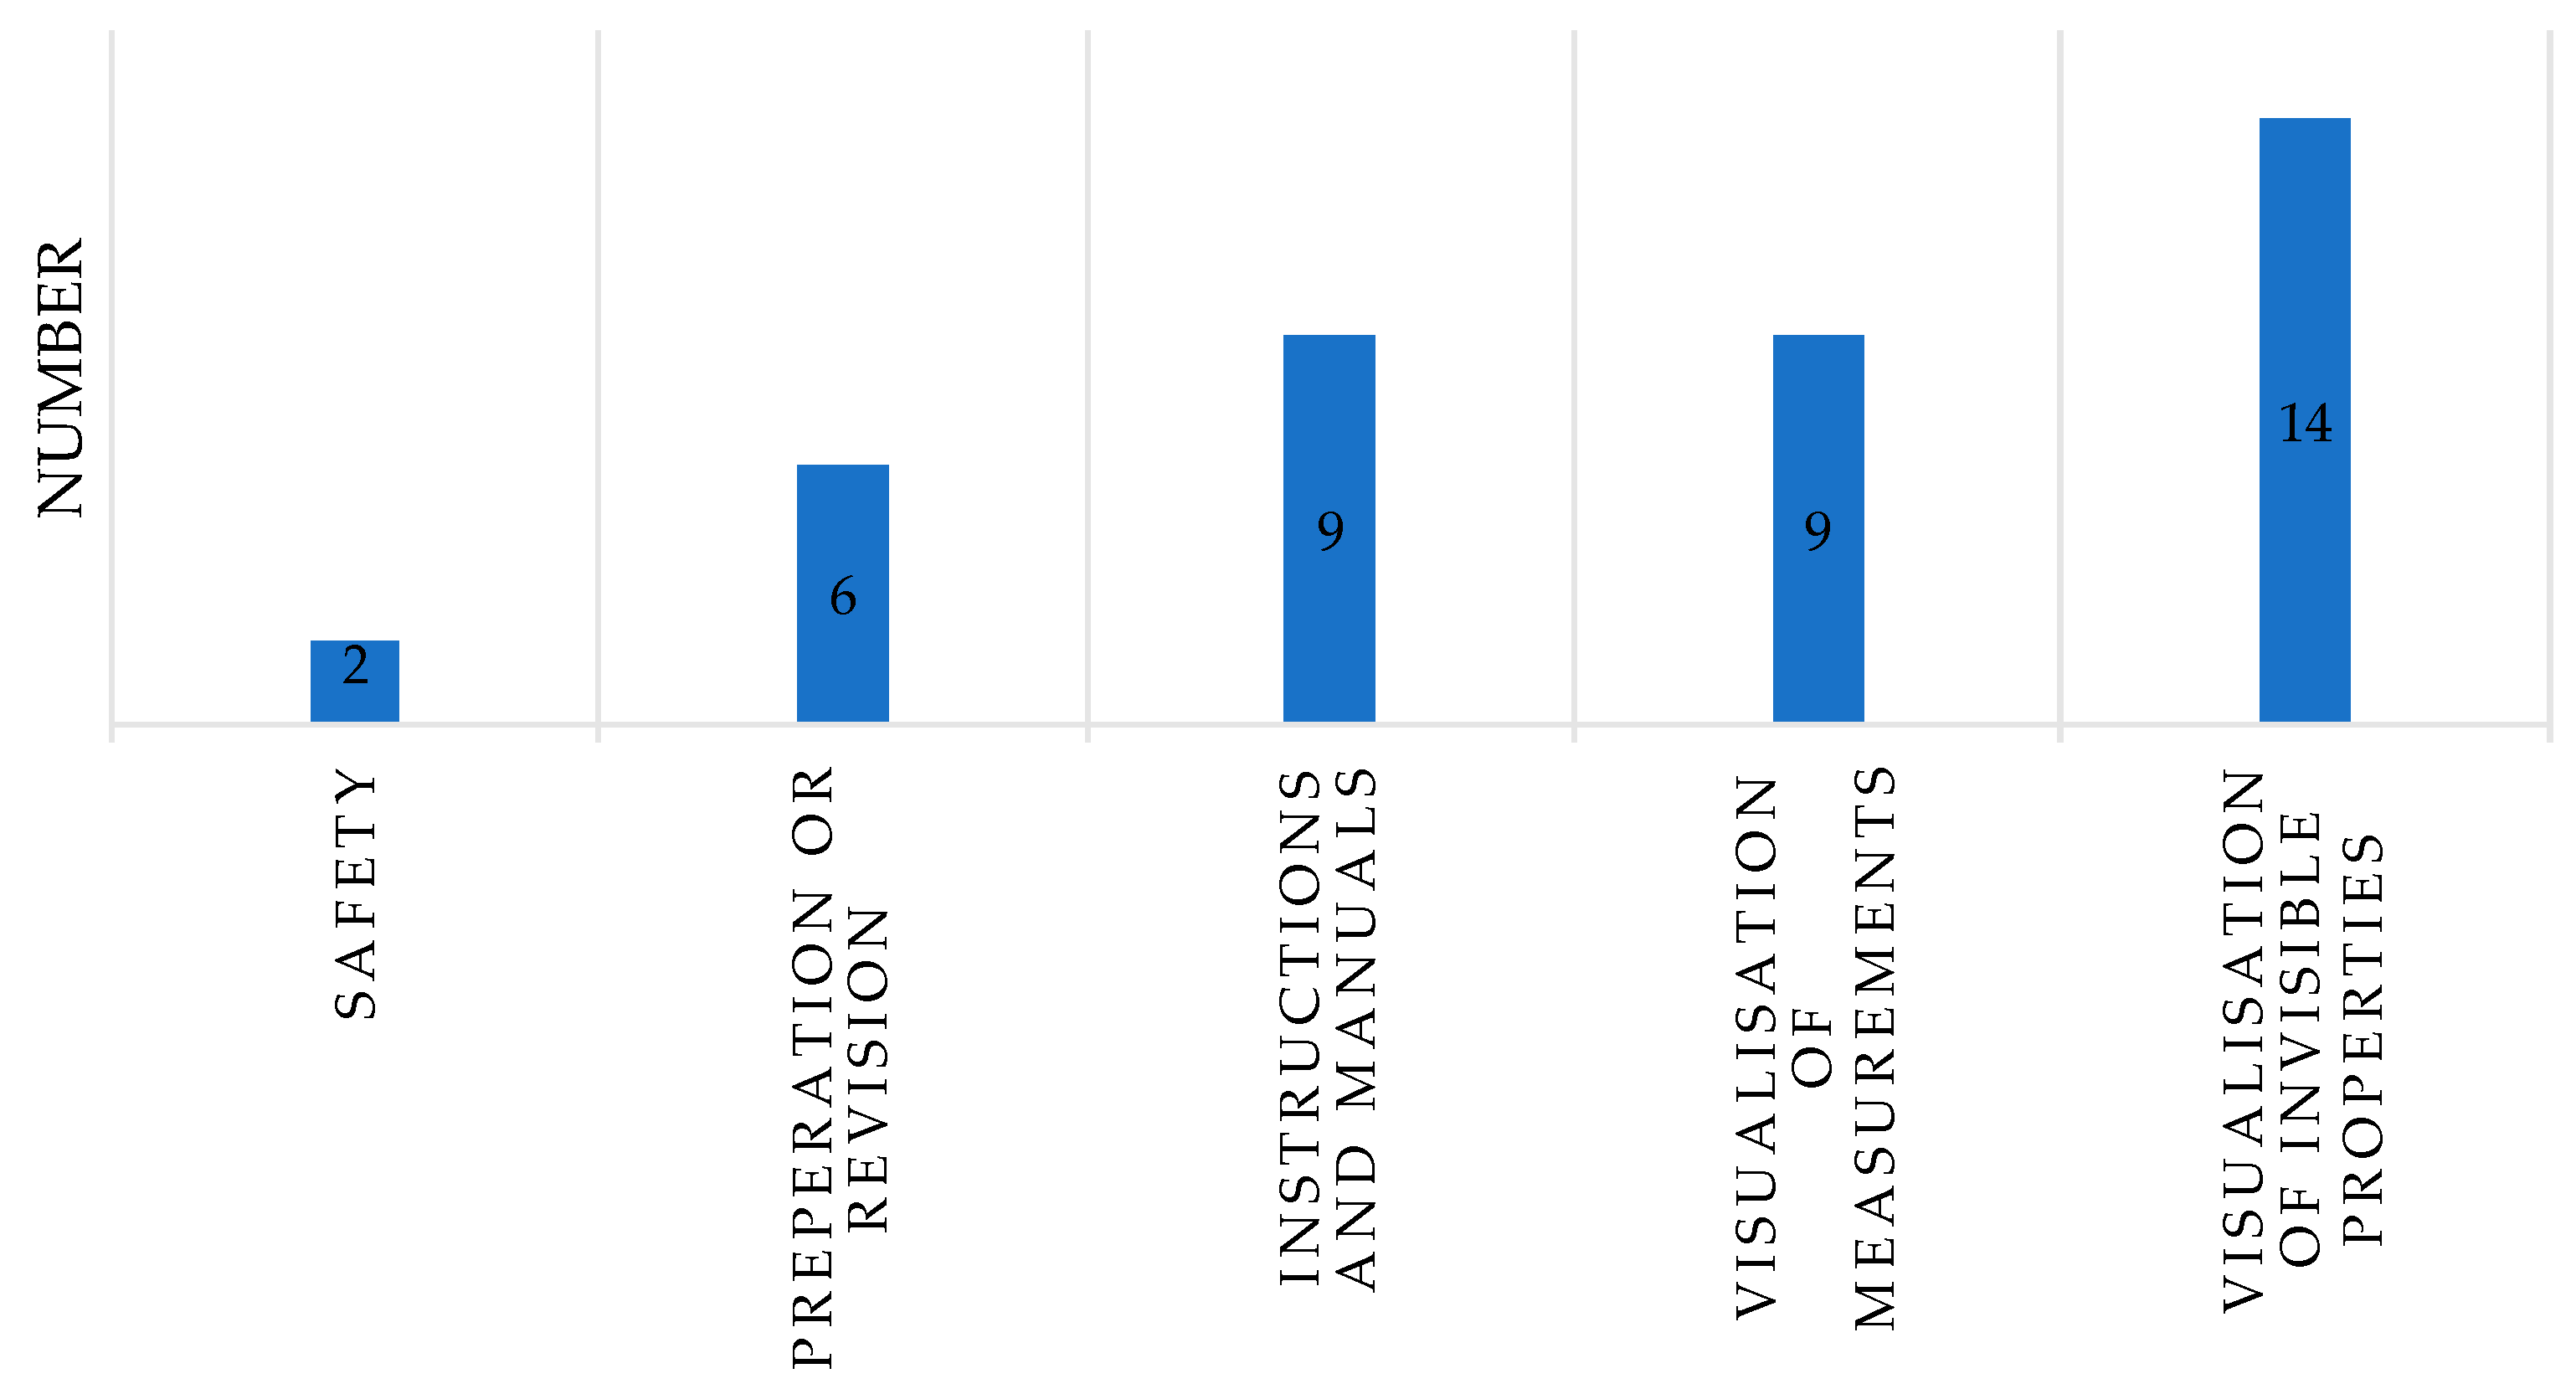
4.1. RQ1: Which Experiments in Science Education Become Enhanced through AR? How Does AR Become Implemented in Experiments in Science Education?

The 40 selected papers presented 29 different AR applications used for STE(A)M experiments (refer to Table S7) [1,16,17,19,22,34,35,36,37,38,39,53,54,55,56,57,58,59,60,61,62,63,64,65,66,67,68,69,70,71,72,73,74,75,76,77,78,79,80,81,82,83,84,85]. One tool (number 18) was reworked significantly between the publications, so it was differentiated in two parts (a and b). Most of the 28 applications were used in physics (17) or chemistry (7), while five tools were not designated to a specific science subject as shown in Figure 3. The topics for the corresponding applications were electricity (6), thermodynamics (5), mechanics (4), magnetism (3), radiation (2), redox-reactions (2), safety (2), general operation and handling of instruments and chemicals (1), biochemistry (1), titrations (1), packed bed column (1), and the attributes of water for primary school (1), as depicted in Figure 4. Most of the applications were aimed at high school or secondary school students (11), followed by undergraduates in university (10), or for high school students as well as undergraduates (2). Only two applications considered primary school or lower secondary school students. The remaining applications were not specifically designated for a particular age group.
The AR applications were mainly used during the experiment to support the experimentation process. The remaining applications were used before the experiment for preparation purposes, and afterwards for revision purposes, or as optional tools when assistance was required. The majority of the devices used for the AR applications were mobile devices, such as smartphones or tablets, sixteen devices in total. However, one specific application required a modified iPad with an additional sensor. For HoloLens or other head mounted devices, eight AR applications were developed. Additionally, a completely new device called A-Cube, equipped with a projector and camera, was developed for one case. The primary software development kit (SDK) used for the development of these applications was Vuforia. The Unity Game Engine was also frequently utilized. The remaining applications were developed using various other programs or programming platforms. In six instances, the programs used to develop the applications were not explicitly specified.
The intended purposes for the AR application differentiated significantly among the studies examined (refer to Figure 5). Out of the total number of applications, nine were designed to provide instructions or manuals to assist with the execution of the experiment. These included tools such as action-mapping tools, AR-enhanced manuals, instruction videos, and schematic-circuit overlays. Additionally, six applications were developed to provide information for preparation or revision, establishing connections between the experiment and the theoretical background. Two applications focused on enhancing safety precautions. The first of these tools served as an alert system to notify users of potentially occurring accidents, while the other served as a safety-training assistant to educate students prior to conducting the experiment. Furthermore, nine applications were developed to visualize measurements or parameters. Most of the applications were utilized for the visualizing properties that are otherwise invisible, contributing to a better understanding of general concepts (fourteen applications). While the majority of applications only fulfilled a single purpose described above, there were ten that could be used for multiple purposes.

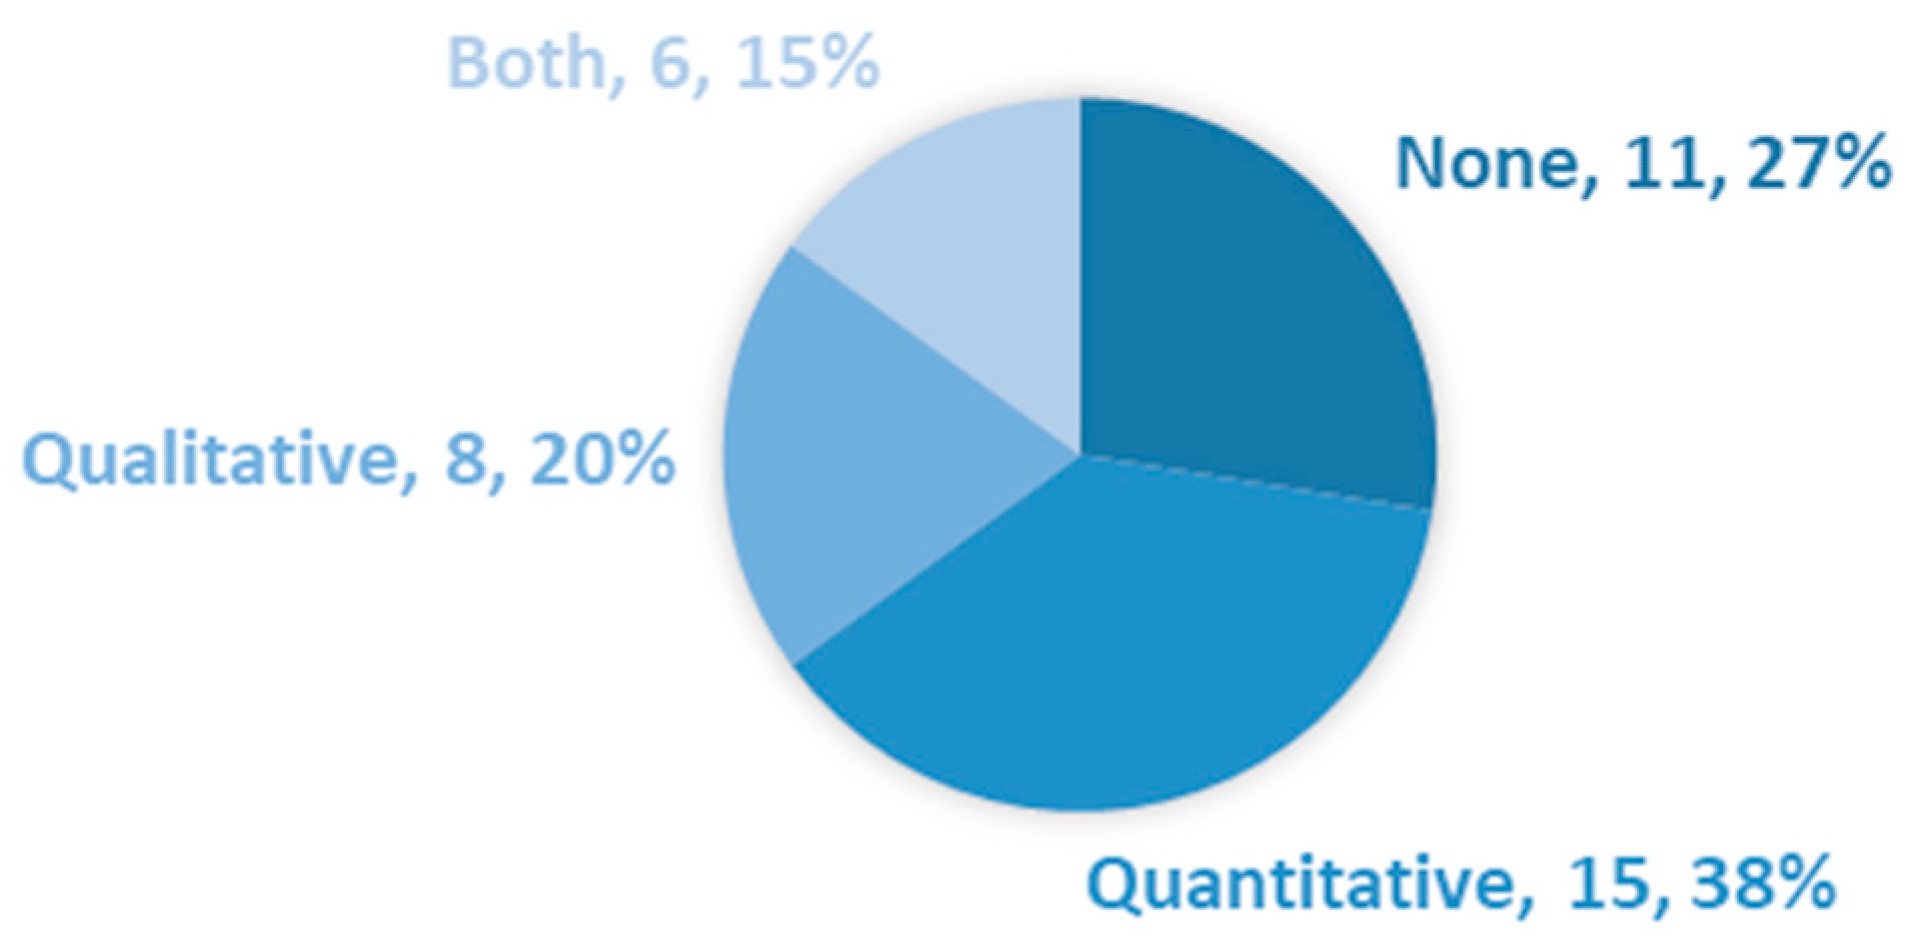
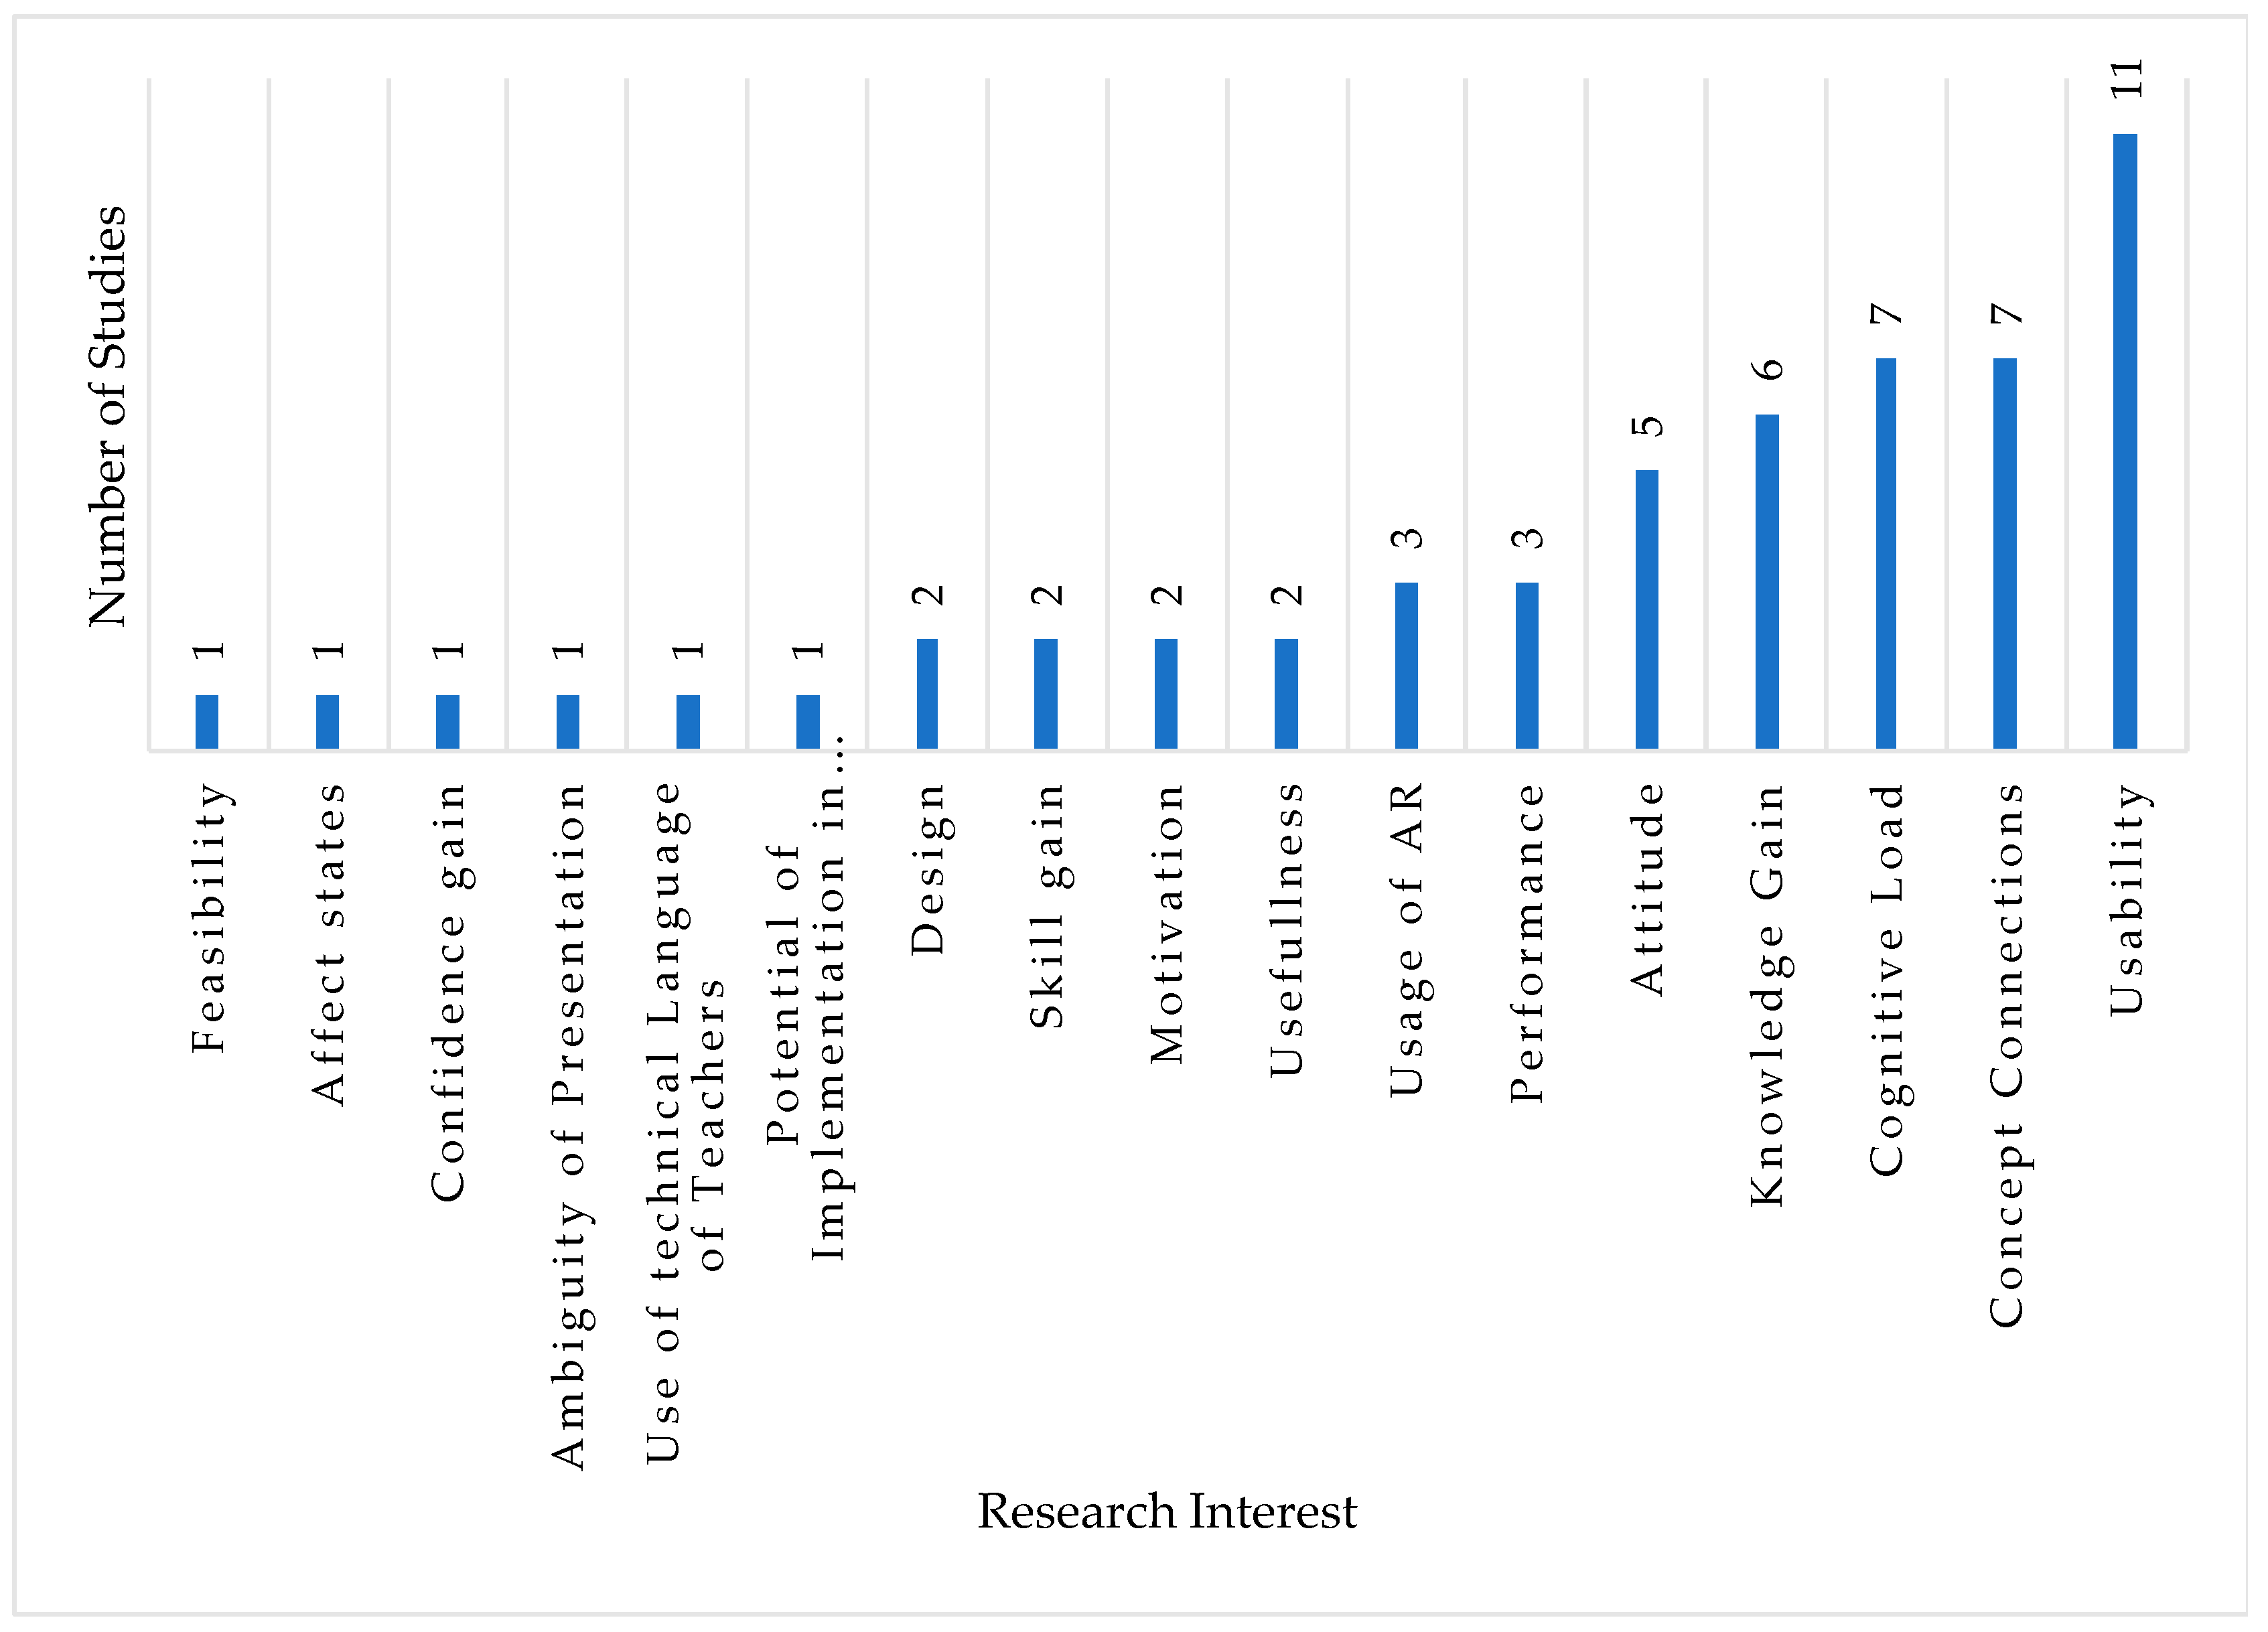
4.2. RQ2: How Does the Empirical Research Examine the AR Enhanced Laboratories in an Educational Context?

From the selected 40 papers, six performed qualitative and quantitative research, eight only performed qualitive research and 15 focused on quantitative research. However, eleven articles did not conduct any empirical research at all (refer to Figure 6). The sample size of the qualitive studies ranged from 3 to 42 students and the quantitative studies from 8 to 280 students. The sample sizes ranged from 12 to 110 in the studies that used both qualitative and quantitative research methods (see in detail Table S8).
The main focus of the studies was usability of the application, concept connection, cognitive load, attitude, usage of AR, performance, and knowledge gain. Also, design, skill gain, motivation, usefulness, and others were examined. The frequency of each research focus within the analyzed articles is shown in Figure 7.
The results of different research interests are given in Table 1. Most of the research conducted with regard to concept connections or knowledge gain showed an increase in the corresponding aspects. For cognitive load there was either no difference detected between AR- and control-Group or the AR-Group had a lower cognitive load. The attitude to the experiments enhanced through AR was always found to be positive.

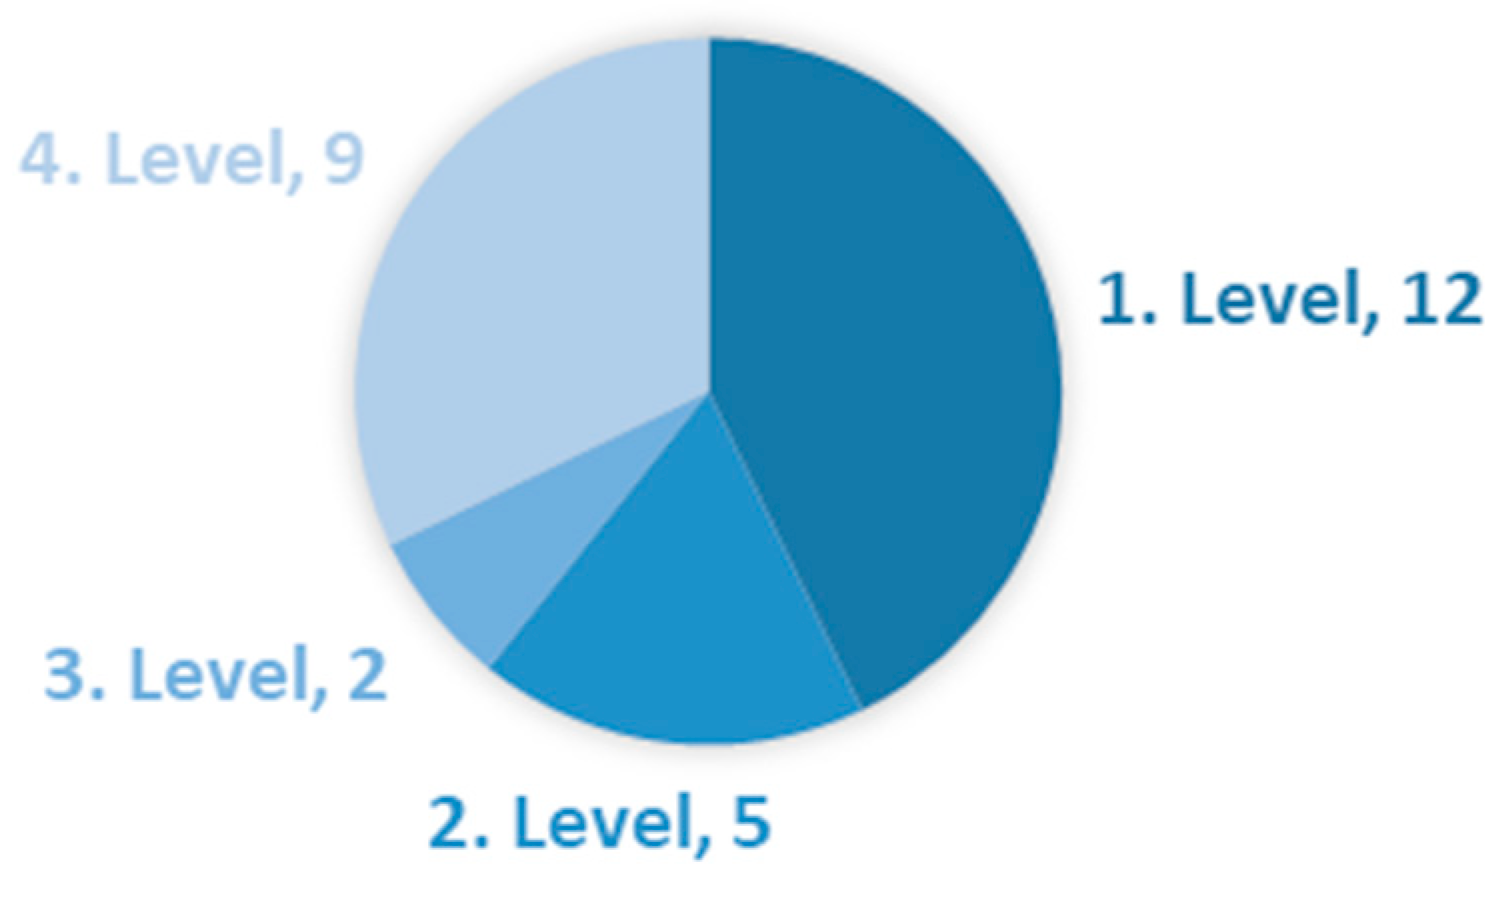
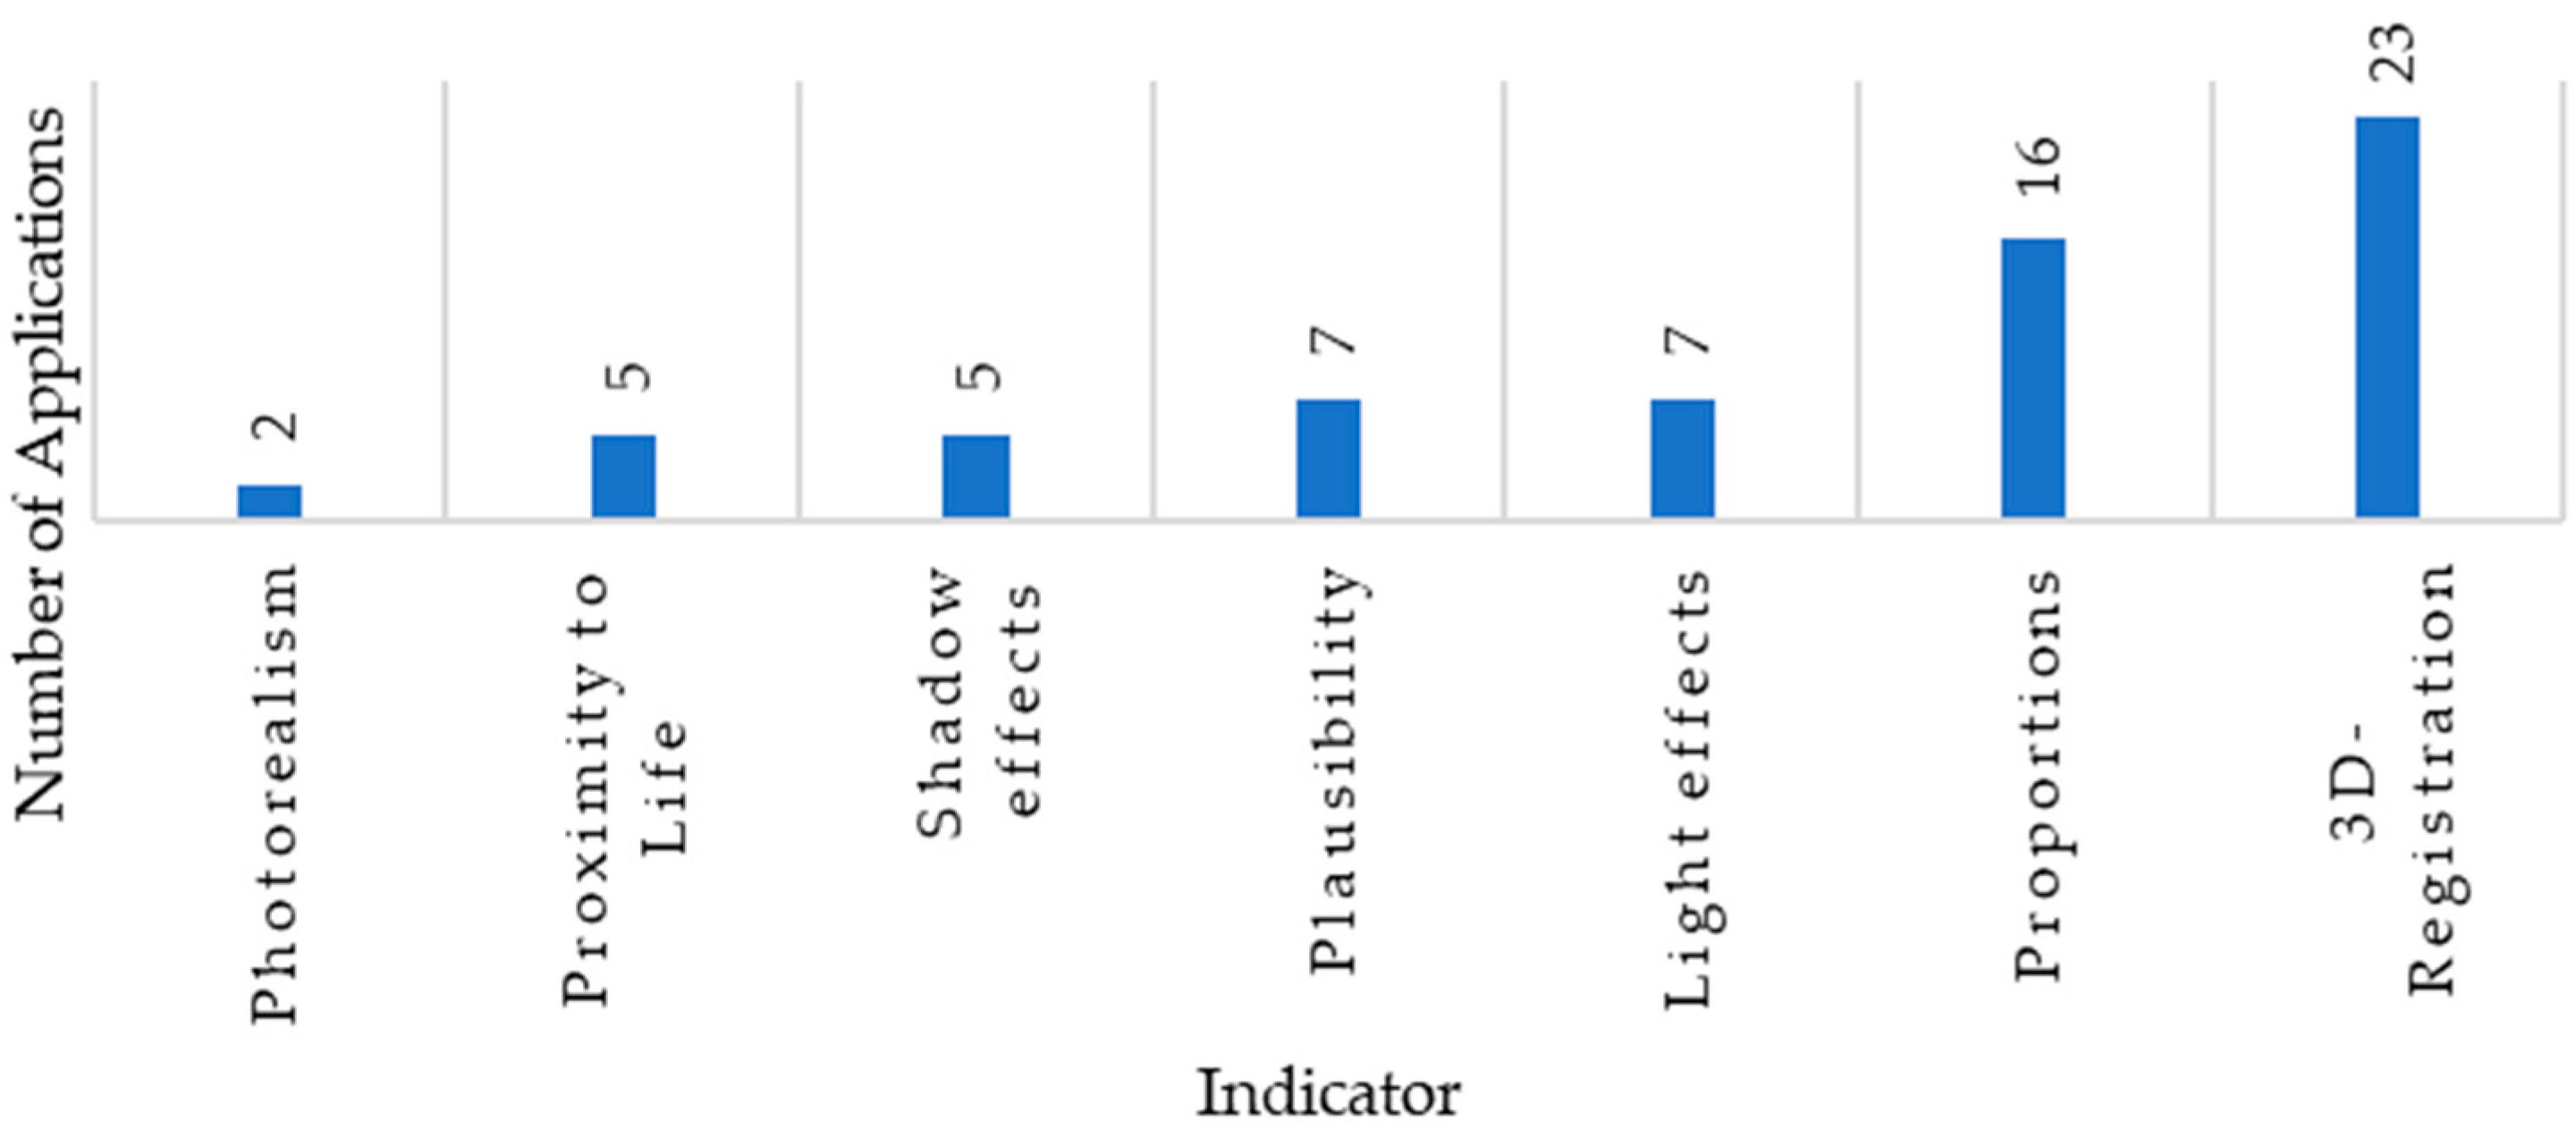
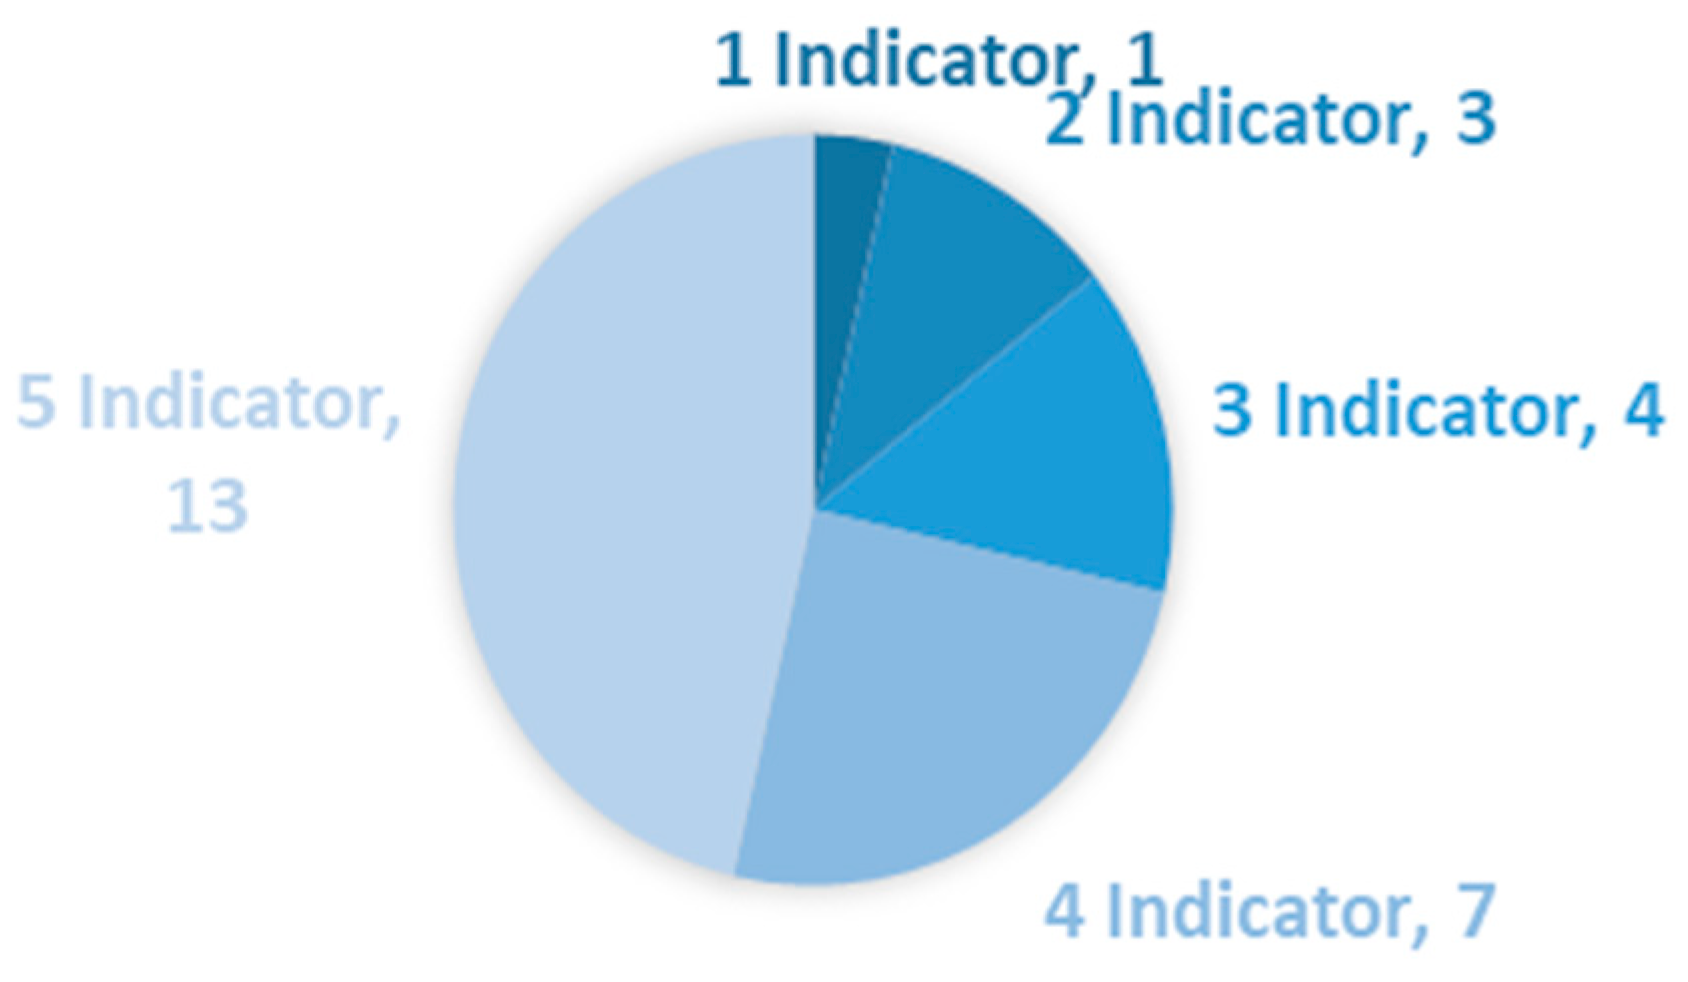
4.3. RQ3: How Are the Designated Design Parameters for AR in Educational Experiments Implemented?

Almost every AR application stimulated only the visual senses, for an immersion score of 1. Only three also had auditive immersion, as shown in Figure 8, and were specific to literature, Table S9 in the Supplementary Material.
The measuring of different physical or chemistry parameters results in high interactivity, which resulted in some applications earning a high interactivity level. Nine applications reached the fourth level on this design parameter, and two the third level. Five applications had an Interactivity level of 2, because the user could switch between different representations or similar interactions. The rest had an interactivity level of 1 (refer to Figure 9 and Table S9).
Nearly all applications showed hits on the indicators “3D-Registration” and “Proportions” within the “Congruence with Reality” parameter. The frequency of these indicators is presented in Figure 10. However, only two applications displayed the “Photorealism” indicator, such as using videos. Additionally, only seven applications demonstrated the “Plausibility” indicator, also seven had “Light effects”, five presented “Proximity to Life”, and another five displayed “Shadow effects”. The distribution of indicator numbers is depicted in Figure 11. Most applications exhibited two indicators (9).
In thirteen applications all five of the “Content Proximity to Reality” indicators were detected. Seven applications only had four indicators. Just a few applications had fewer indicators (refer to Figure 12). All the tracking methods were found to be appropriate and just eight of the tracking depictions did not match the theme of the AR subject. Temporal, causal, and local plausibility was observed in all, but five to seven applications, as shown in Figure 13.
The level of “Adaptivity” was mostly very low. Twenty applications had the first level, while three were classified in the second, and four in the third level. Only one application exhibited a high level (4) of adaptivity (refer to Figure 14).
Mainly, the analyzed applications showed a low level of “Gamification”. The maximum number of game elements found was three, and this was only the case for two applications (Hanafi’s Safety-Assistant with a Quiz-Character and Bakri’s learning App to Heat-Experiments with different functions and control-mechanism). Three applications had two game elements, while two had three elements. Eight applications had only one. Most applications (15) did not have any game elements at all (refer to Figure 15).
The main game element found in the investigated applications was the “Control” indicator (12). Two tools offered right and wrong answers and so the “Rules/Goals” indicator was assigned in those cases. The flexible environment indicator was assigned if the app could be used at any location. If the marker could be printed and moved to any place, the conditions for the indicator were satisfied. When other instruments or modifications of the mobile device were needed, the requirements for the indicator were not met. With these conditions only six applications showed the “Environment” element, as shown in Figure 16.
The “Complexity” level of the applications ranged through all levels, but most had a low level of complexity. The distribution of the levels is shown in Figure 17. Four applications reached level 4, and just one level 5, which thereby had a high level of complexity.

5. Discussion

5.1. RQ1 AR-Enhanced Science Experiments and Implementation Approaches

Most of the articles were focused on physics, particularly the topics of electricity, magnetism, or thermodynamics. AR for experiments in physics are most effective in visualizing invisible processes like magnetic field lines and can be easily implemented for a static system/setup. It might be more difficult to develop an AR tool which helps to visualize the invisible processes in a vessel in which a chemical reaction occurs. No AR application was introduced especially for the subject of biology. AR tools could be used here, for example, to show three-dimensional models of microscopy experiments. An interesting application of AR is the replacement of real chemicals, substances, or liquids to reduce safety-risks, costs, and other resources [35,39]. In general, the topic of laboratory risks and accident prevention is a potential that has been enabled by new technologies such as AR. Applications could be used in the future to detect accidents before they happen [37,38] or to reduce risks by using better preparations. A lot of groups have developed AR applications to prepare for experiments via enhanced instructions or manuals, which could help reduce anxiety and increase confidence in handling chemicals or laboratory instruments [66]. Also, applications were used to show measurements, rather than using additional instruments which may be unfamiliar to students. The most frequently used devices were smartphones or tablets, which would make the AR Applications widely available for a lot of teachers and students, as no new or dedicated equipment is needed. Special devices like the HoloLens are expensive and not every school or institution has access to this technology. The A-Cube requires specially programmed software, cameras, and a projector. This means that it requires a complex and expensive set-up. However, with future development and perhaps in combination with devices that are cheap and widely available, it could help teachers to conduct more experiments at school with students. By ensuring the safety of students, the fear can be taken away. Most of the AR tools in these studies had only one specific function and purpose, but with further development, AR applications for science education could become more complex and help with different goals.

5.2. RQ2 Empirical Evaluations of AR-Enhanced Laboratory Environments

Eleven AR applications presented in articles were still prototypes and were not verified yet. The research was more quantitative than qualitative. Some articles only had small sample sizes. It was questionable how significant the results of a study were if the sample included only eight individuals, for example. Also, not all the studies conducted a test with a control-group. In these cases, the results cannot be entirely attributed to the AR application itself. In these cases, further studies need to be conducted. The focus of most of the empirical research was on the usability of the applications. This makes sense because if the usability is low, it could affect the results of a variety of other research interests. Overall, the positive effects of AR applications in fostering concept connections, minimizing cognitive load and increasing knowledge were shown in different studies. Also, it was shown that students perceive experiments enhanced with AR in a positive way. This could be interpreted as potential proof of the value of AR for science experiments. An interesting research focus is the pattern in which AR applications are used and which information and functions are favored by the user. This research would allow future applications to focus on these functions of AR tools.

5.3. RQ3 Implementation of Design Parameters for AR in Educational Experiments

The level of immersion is very low in all the applications. Increasing the number of involved senses can help with the learning process [86]. However, it can be debated whether greater immersion is needed, because the other senses are addressed by the experiment itself. The students receive haptic feedback while handling different objects, instruments, and other equipment. The olfactory sense might be used as well, especially for chemistry experiments. A potential for the applications could be auditory immersion with regards to inclusion of impaired students.
The interactivity in the examined applications was mostly low. Interactivity by itself does not guarantee a productive learning environment [87], but it can support the learning process by leading the user and framing the thinking of the student [88].
The indicators of the parameter “Congruence with Reality” were found only partially in the different applications. Here, especially the 3D-Registration and appropriate proportions were considered. On the other hand, the indicators for a realistic inclusion such as light and shadow effects, or a lifelike depiction, were almost only found in videos portrayed with AR. This is not a surprise, as those graphic designs would need a lot more time, resources, and skills. Here, it could be debated how much the output justifies an overly complex and expensive development process. Maybe the same advantages for science education or experiments could be achieved with a less complicated and cheaper tool, which is also easier to produce.
The “Content proximity to Life” was specified as high for most of the AR applications. The tracking methods were all found to be reasonable, and the various types of plausibility were considered. Without this parameter, a successful tool for science education would not be possible. The understanding of concepts and the gain in knowledge could benefit from a high level of this design parameter.
Most of the applications were not adaptive. Neither the user nor the program itself could be adapted to new situations or needs. It could be helpful to change the difficulty or presentations.
For students with impairments, it would offer the possibility to use the application in another way. Also, it would provide the usefulness of the tool to a wider range of students, such as different grades or educational institutions.
In contrast to the previously mentioned parameter, the number of game elements were found to be very low in the studies reviewed. Most of the AR tools had no gamification at all. This could be a particularly interesting and fruitful area for further research, because studies showed a positive effect of game elements on student engagement and motivation [89,90].
Most of the AR applications only depicted one fact or invisible process. Potentially, future AR tools could become more complex and depict more facts, connections, and different representation. On one hand, the value of the application for the learning process could therefore increase. On the other hand, such applications could become confusing, difficult to operate, or overwhelming.

6. Limitations

Restriction to the Web of Science database resulted in the exclusion of articles not published there, potentially excluding valuable research. This bias towards including only high-quality and published research works may limit the comprehensiveness of this study. Furthermore, the parameters selected for this review’s literature analysis could be evaluated for potential subjective biases. Some of the analyzed articles lacked sufficiently detailed descriptions of AR tools, making it challenging to evaluate them objectively without interpretation. Data coding was not subjected to double coding; instead, articles were discussed and assigned by two researchers through dialogue. This approach could introduce subjectivity into the data assignment process. Due to inadequate descriptions in some papers, there may have been instances where AR applications were misclassified. For example, papers may have been categorized as involving VR or lacking experimentation when they featured AR. If we had the opportunity to test all AR applications ourselves, we could have presented fewer interpretative data. The study did not consider the specific year within which papers were submitted, as it was not feasible to integrate this information into the analysis within the given timeframe. This limitation may affect the temporal context of the findings.

7. Conclusions

This review has revealed an abundance of developed and partially empirically validated AR applications. Various application domains were explored, highlighting gaps in the distribution of subjects and topics. Most of these applications were centered around physics, with a specific focus on physics education topics like electricity. However, there is an opportunity to develop more AR applications for science subjects to enrich experiments.
In general, this review demonstrated that numerous research groups are actively creating innovative programs aimed at enhancing science experiments in education. Further empirical research of these applications is warranted, as many of them are still in prototype stages and have not yet been validated. In addition, existing applications could benefit from enhancements, including the addition of new features and improved visual representations.
A wide range of potential new applications remain unexplored, offering opportunities to depict various invisible properties, states of matter, and chemical reactions, or to serve as a cost-effective alternative to traditional materials. If these new applications are developed with a focus on widely available and commonly used devices and platforms, they could serve as catalysts for the advancement of AR-enhanced education.
Moreover, the development of subject-specific and interdisciplinary AR applications are crucial to facilitate their individual use in schools and universities. Furthermore, it is recommended to simplify the availability of AR applications through downloads, in order to promote their acceptance and enable the use of existing AR applications.
The empirical validation of these applications should also be given more attention. Due to the small sample size, only initial insights into the value and effectiveness of AR tools were possible. Larger sample studies and an expansion of the research landscape comparing different design parameters in AR extensions for the same experiment would be desirable. Moreover, the underlying design parameters of these AR applications were often overlooked or insufficiently researched, especially regarding the parameters of “Interactivity”, “Adaptivity”, and “Game Elements”, which were scarcely found in most AR applications. Given the importance of adaptivity in achieving individualized learning outcomes, future developments should consider these parameters and prioritize the validation of AR applications. Emphasizing these parameters in AR design could lead to higher engagement among science students. Additionally, increased immersion and a higher degree of “Interactivity” and “Adaptivity” could offer inclusive learning opportunities for students with disabilities.
Further developments of a variety of suitable AR-supported experiments in science subjects that cover a wide range of learning objectives is therefore necessary. Moreover, these should be made publicly accessible to educators, for instance, through platforms or teacher training programs.

Supplementary Materials

The following supporting information can be downloaded at: https://www.mdpi.com/article/10.3390/educsci14070760/s1, Table S1: Levels of the parameter “Adaptivity”; Table S2: Levels of the parameter “Interactivity”; Table S3: Indicators of the parameter “Congruence with Reality”; Table S4: Indicators of the parameter “Content proximity to Reality”; Table S5: Indicators of the parameter “Game Elements”; Table S6: Levels of the parameter “Complexity”; Table S7: Comparison of AR applications for experiments; Table S8: Empirical research analyzation; Table S9: Analyzing Design parameters (x = indicator present; - = indicator missing).

Author Contributions

Conceptualization, S.S.; methodology, S.S.; validation, S.S. and S.W.; formal analysis, S.S. and S.W.; investigation, S.S. and S.W.; resources, J.H.; data curation, S.S.; writing—original draft preparation, S.S. and S.W.; writing—review and editing, J.H.; visualization, S.S. and S.W.; project administration, S.S.; funding acquisition, J.H. All authors have read and agreed to the published version of the manuscript.

Funding

The APC was funded by the University of Konstanz.

Data Availability Statement

No new data were created or analyzed in this study.

Conflicts of Interest

The authors declare no conflicts of interest.

References

  1. An, J.; Poly, L.-P.; Holme, T.A. Usability Testing and the Development of an Augmented Reality Application for Laboratory Learning. J. Chem. Educ. 2020, 97, 97–105. [Google Scholar] [CrossRef]
  2. Bates, G.C. The Role of the Laboratory in Secondary School Science Programs. In What Research Says to the Science Teacher; Rowe, M.B., Ed.; National Institute of Education (DHEW): Washington, DC, USA, 1978; Volume I, pp. 55–82. [Google Scholar]
  3. Hofstein, A.; Lunetta, V.N. The Role of the Laboratory in Science Teaching: Neglected Aspects of Research. Rev. Educ. Res. 1982, 52, 201–217. [Google Scholar] [CrossRef]
  4. Hofstein, A.; Lunetta, V.N. The Laboratory in Science Education: Foundations for the Twenty-First Century. Sci. Educ. 2004, 88, 28–54. [Google Scholar] [CrossRef]
  5. Hawkes, S.J. Chemistry Is Not a Laboratory Science. J. Chem. Educ. 2004, 81, 1257. [Google Scholar] [CrossRef]
  6. Carnduff, J.; Reid, N. Enhancing Undergraduate Chemistry Laboratories; Royal Society of Chemistry: London, UK, 2003; ISBN 978-0-85404-378-1. [Google Scholar]
  7. Johnstone, A.H. Teaching of Chemistry- Logical or Psychological? Chem. Educ. Res. Pract. 2000, 1, 9–15. [Google Scholar] [CrossRef]
  8. Toczkowski, T.; Ralle, B. The Complexity of “Simple” Experiment Learning and Understanding in Chemistry Class [Die Komplexität “einfacher” Experimente-Lernen Und Verstehen Im Chemieunterricht]. In Authentizität und Lernen—Das Fach in der Fachdidaktik. Gesellschaft für Didaktik der Chemie und Physik Jahrestagung in Berlin 2015; Maurer, C., Ed.; Universität Regensburg: Regensburg, Germany, 2015; pp. 68–70. [Google Scholar]
  9. Sorby, S.A. Educational Research in Developing 3-D Spatial Skills for Engineering Students. Int. J. Sci. Educ. 2009, 31, 459–480. [Google Scholar] [CrossRef]
  10. Kuhn, J.; Müller, A. Context-Based Science Education by Newspaper Story Problems: A Study on Motivation and Learning Effects. Perspect. Sci. 2014, 2, 5–21. [Google Scholar] [CrossRef]
  11. Probst, C. How Digitalisation Enriches Self-Regulation, Self-Efficacy Expectations, and Motivation in Chemistry Education—A Review. Chem. Sch. 2021, 36, 18–22. (In German) [Google Scholar]
  12. Cai, S.; Chiang, F.-K.; Sun, Y.; Lin, C.; Lee, J.J. Applications of Augmented Reality-Based Natural Interactive Learning in Magnetic Field Instruction. Interact. Learn. Environ. 2017, 25, 778–791. [Google Scholar] [CrossRef]
  13. Cai, S.; Liu, C.; Wang, T.; Liu, E.; Liang, J.-C. Effects of Learning Physics Using Augmented Reality on Students’ Self-Efficacy and Conceptions of Learning. Br. J. Educ. Technol. 2021, 52, 235–251. [Google Scholar] [CrossRef]
  14. Radu, I.; Schneider, B.; Machinery, A.C. What Can We Learn from Augmented Reality (AR)? Benefits and Drawbacks of AR for Inquiry-Based Learning of Physics. In Proceedings of the 2019 CHI Conference on Human Factors in Computing Systems, Glasgow, Scotland, 4–9 May 2019. [Google Scholar]
  15. Huwer, J.; Barth, C.; Siol, A.; Eilks, I. Combining reflections on education for sustainability and digitalization—Learning with and about the sustainable use of tablets along an augmented reality learning environment (in German). CHEMKON 2021, 28, 235–240. [Google Scholar] [CrossRef]
  16. Ovens, M.; Ellyard, M.; Hawkins, J.; Spagnoli, D. Developing an Augmented Reality Application in an Undergraduate DNA Precipitation Experiment to Link Macroscopic and Submicroscopic Levels of Chemistry. J. Chem. Educ. 2020, 97, 3882–3886. [Google Scholar] [CrossRef]
  17. Altmeyer, K.; Kapp, S.; Thees, M.; Malone, S.; Kuhn, J.; Bruenken, R. The Use of Augmented Reality to Foster Conceptual Knowledge Acquisition in STEM Laboratory Courses-Theoretical Background and Empirical Results. Br. J. Educ. Technol. 2020, 51, 611–628. [Google Scholar] [CrossRef]
  18. Huwer, J.; Lauer, L.; Seibert, J.; Thyssen, C.; Dörrenbächer-Ulrich, L.; Perels, F. Re-Experiencing Chemistry with Augmented Reality: New Possibilities for Individual Support. World J. Chem. Educ. 2018, 6, 212–217. [Google Scholar] [CrossRef]
  19. Liu, Q.; Yu, S.; Chen, W.; Wang, Q.; Xu, S. The Effects of an Augmented Reality Based Magnetic Experimental Tool on Students’ Knowledge Improvement and Cognitive Load. J. Comput. Assist. Learn. 2021, 37, 645–656. [Google Scholar] [CrossRef]
  20. Aji, S.D.; Setyowati, T.; Jumina, S.; Hudha, M.N. Augmented Reality: Physics on Wave and Vibration. J. Phys. 2021, 1869, 012090. [Google Scholar] [CrossRef]
  21. Akçayır, M.; Akçayır, G. Advantages and Challenges Associated with Augmented Reality for Education: A Systematic Review of the Literature. Educ. Res. Rev. 2017, 20, 1–11. [Google Scholar] [CrossRef]
  22. Albuquerque, G.; Sonntag, D.; Bodensiek, O.; Behlen, M.; Wendorff, N.; Magnor, M. A Framework for Data-Driven Augmented Reality. In Augmented Reality, Virtual Reality, and Computer Graphics: 6th International Conference, AVR 2019, Santa Maria al Bagno, Italy, 24–27 June 2019; Springer: Berlin/Heidelberg, Germany, 2019; Volume 11614, ISBN 0302-9743. [Google Scholar]
  23. Cai, S.; Chiang, F.-K.; Wang, X. Using the Augmented Reality 3D Technique for a Convex Imaging Experiment in a Physics Course. Int. J. Eng. Educ. 2013, 29, 856–865. [Google Scholar]
  24. Osman, S. The Effect of Augmented Reality Application toward Student’s Learning Performance in PC Assembly. IJATCSE 2020, 9, 401–407. [Google Scholar] [CrossRef]
  25. Salmi, H.; Thuneberg, H.; Vainikainen, M.-P. Making the Invisible Observable by Augmented Reality in Informal Science Education Context. Int. J. Sci. Educ. Part B 2017, 7, 253–268. [Google Scholar] [CrossRef]
  26. Mazzuco, A.; Krassmann, A.L.; Reategui, E.; Gomes, R.S. A Systematic Review of Augmented Reality in Chemistry Education. Rev. Educ. 2022, 10, e3325. [Google Scholar] [CrossRef]
  27. Page, M.J.; Moher, D.; Bossuyt, P.M.; Boutron, I.; Hoffmann, T.C.; Mulrow, C.D.; Shamseer, L.; Tetzlaff, J.M.; Akl, E.A.; Brennan, S.E.; et al. PRISMA 2020 Explanation and Elaboration: Updated Guidance and Exemplars for Reporting Systematic Reviews. BMJ 2021, 372, n160. [Google Scholar] [CrossRef] [PubMed]
  28. Shah, I. Making University Laboratory Work in Chemistry More Effective. Ph.D. Thesis, University of Glasgow, Glasgow, Scotland, 2004. [Google Scholar]
  29. Acosta, J.L.B.; Navarro, S.M.B.; Gesa, R.F.; Kinshuk, K. Framework for Designing Motivational Augmented Reality Applications in Vocational Education and Training. Australas. J. Educ. Technol. 2019, 35, 102–117. [Google Scholar] [CrossRef]
  30. Reid, N.; Shah, I. The Role of Laboratory Work in University Chemistry. Chem. Educ. Res. Pract. 2007, 8, 172–185. [Google Scholar] [CrossRef]
  31. Wojciechowski, R.; Cellary, W. Evaluation of Learners’ Attitude toward Learning in ARIES Augmented Reality Environments. Comput. Educ. 2013, 68, 570–585. [Google Scholar] [CrossRef]
  32. Fatemah, A.; Rasool, S.; Habib, U. Interactive 3D Visualization of Chemical Structure Diagrams Embedded in Text to Aid Spatial Learning Process of Students. J. Chem. Educ. 2020, 97, 992–1000. [Google Scholar] [CrossRef]
  33. Núñez, M.; Quirós, R.; Núñez, I.; Carda, J.B.; Camahort, E. Collaborative Augmented Reality for Inorganic Chemistry Education. In Proceedings of the 5th WSEAS/IASME International Conference on Engineering Education, Heraklion, Greece, 22–24 July 2008; World Scientific and Engineering Academy and Society (WSEAS): Stevens Point, WI, USA, 2008; pp. 271–277. [Google Scholar]
  34. An, J.; Holme, T.A. Evaluation of Augmented Reality Application Usage and Measuring Students’ Attitudes toward Instrumentation. J. Chem. Educ. 2021, 98, 1458–1464. [Google Scholar] [CrossRef]
  35. Gan, H.S.; Tee, N.Y.K.; Mamtaz, M.R.B.; Xiao, K.; Cheong, B.H.-P.; Liew, O.W.; Ng, T.W. Augmented Reality Experimentation on Oxygen Gas Generation from Hydrogen Peroxide and Bleach Reaction. Biochem. Mol. Biol. Educ. 2018, 46, 245–252. [Google Scholar] [CrossRef]
  36. Hanafi, A.; Elaachak, L.; Bouhorma, M.; Bennis, E.K. Safe Laboratory Practices & Procedures Introduced to the Students Through an Augmented Reality Application. In Proceedings of the 4th International Conference on Smart City Applications, Casablanca, Morocco, 2–4 October 2019. [Google Scholar]
  37. Sokan, A.; Inagawa, N.; Nishijo, K.; Shinagawa, N.; Egi, H.; Fujinami, K. Alerting Accidents with Ambiguity: A Tangible Tabletop Application for Safe and Independent Chemistry Experiments. In Ubiquitous Intelligence and Computing, Proceedins of the 7th International Conference, UIC 2010, Xi’an, China, 26–29 October 2010; Springer: Berlin/Heidelberg, Germany, 2010; Volume 6406, ISBN 0302-9743. [Google Scholar]
  38. Sokan, A.; Hou, M.W.; Shinagawa, N.; Egi, H.; Fujinami, K. A Tangible Experiment Support System with Presentation Ambiguity for Safe and Independent Chemistry Experiments. J. Ambient Intell. Humaniz. Comput. 2012, 3, 125–139. [Google Scholar] [CrossRef]
  39. Tee, N.Y.K.; Gan, H.S.; Li, J.; Cheong, B.H.-P.; Tan, H.Y.; Liew, O.W.; Ng, T.W. Developing and Demonstrating an Augmented Reality Colorimetric Titration Tool. J. Chem. Educ. 2018, 95, 393–399. [Google Scholar] [CrossRef]
  40. Ajit, G.; Lucas, T.; Kanyan, R. A Systematic Review of Augmented Reality in STEM Education. Stud. Appl. Econ. 2021, 39. [Google Scholar] [CrossRef]
  41. Milgram, P.; Takemura, H.; Utsumi, A.; Kishino, F. Augmented Reality: A Class of Displays on the Reality-Virtuality Continuum. In Proceedings of the Telemanipulator and Telepresence Technologies, Philadelphia, PA, USA, 25–26 October 1995; Society of Photo-Optical Instrumentation Engineers (SPIE): Bellingham, WA, USA, 1995; Volume 2351, pp. 282–292. [Google Scholar]
  42. Azuma, R.T. A Survey of Augmented Reality. Presence Teleoperators Virtual Environ. 1997, 6, 355–385. [Google Scholar] [CrossRef]
  43. Krug, M.; Czok, V.; Müller, S.; Weitzel, H.; Huwer, J.; Kruse, S.; Müller, W. AR in Science Education—An AR Based Teaching-learning Scenario in the Field of Teacher Education. CHEMKON 2022, 29, 312–318. [Google Scholar] [CrossRef]
  44. Krug, M.; Czok, V.; Huwer, J.; Weitzel, H.; Müller, W. Challenges for the Design of Augmented Reality Applications for Science Teacher Education. In Proceedings of the 15th International Technology, Education and Development Conference, Online, 8–9 March 2021; pp. 2484–2491. [Google Scholar] [CrossRef]
  45. Paramythis, A.; Loidl-Reisinger, S. Adaptive Learning Environments and E-Learning Standards. Electron. J. E-Learn. 2004, 2, 181–194. [Google Scholar]
  46. Söldner, G. Semantic Adaptation of Components (in German). Ph.D. Thesis, Friedrich-Alexander-Universität Erlangen-Nürnberg, Erlangen, Germany, 2012. Available online: https://open.fau.de/items/91d9e981-3539-4258-a7a7-53589a675e07 (accessed on 1 May 2024).
  47. Schulmeister, R. Taxonomy of Interactivity in Multimedia—A Contribution to the Acutal Metadata Discussion (in German). Inf. Technol. 2002, 44, 193–199. [Google Scholar] [CrossRef]
  48. Slater, M.; Wilber, S. A Framework for Immersive Virtual Environments (FIVE): Speculations on the Role of Presence in Virtual Environments. Presence Teleoperators Virtual Environ. 1997, 6, 603–616. [Google Scholar] [CrossRef]
  49. McMahan, A. Immersion, Engagement, and Presence—A Method for Analyzing 3-D Video Games. In The Video Game, Theory Reader; Wolf, M.J., Perron, B., Eds.; Routledge: New York, NY, USA, 2013; pp. 67–87. ISBN 10: 0415965799. [Google Scholar]
  50. Nah, F.F.-H.; Zeng, Q.; Telaprolu, V.R.; Ayyappa, A.P.; Eschenbrenner, B. Gamification of Education: A Review of Literature. HCI Bus. 2014, 8527, 401–409. [Google Scholar]
  51. Walpuski, M.; Kauertz, A.; Fischer, H.; Kampa, N.; Mayer, J.; Sumfleth, E.; Wellnitz, N. ESNaS-Evaluation of the Standards for Science in Lower Secondary Education. In Bildungsstandards Und Kompetenzmodelle: Beiträge Zu Einer Aktuellen Diskussion Über Schule, Lehrerbildung Und Unterricht; Gehrmann, A., Hericks, U., Lüders, M., Eds.; Klinkhardt: Bad Heilbrunn, Germany, 2010. (In German) [Google Scholar]
  52. Harzing, A.W. Software: Publish or Perish 2007 (Version 23.4.0). Available online: https://harzing.com/ (accessed on 1 May 2024).
  53. Martinez, G.d.l.C.; Bocanegra, J.R.R.; Cervantes, A.L.E.; Zamorano, C.R.M.A. Exploring “Experimentelly” the pH Value of Products Using Augmented Reality with Tangible Objects. In Proceedings of the Edulearn18: 10th International Conference on Education and New Learning Technologies, Palma, Spain, 2–4 July 2018; ISBN 2340-1117. [Google Scholar]
  54. Garzón, J.; Kinshuk; Baldiris, S.; Gutiérrez, J.; Pavón, J. How Do Pedagogical Approaches Affect the Impact of Augmented Reality on Education? A Meta-Analysis and Research Synthesis. Educ. Res. Rev. 2020, 31, 100334. [Google Scholar] [CrossRef]
  55. Sırakaya, M.; Sırakaya, D.A. Augmented Reality in STEM Education: A Systematic Review. Interact. Learn. Environ. 2020, 30, 1556–1569. [Google Scholar] [CrossRef]
  56. Ewais, A.; Troyer, O.D. A Usability and Acceptance Evaluation of the Use of Augmented Reality for Learning Atoms and Molecules Reaction by Primary School Female Students in Palestine. J. Educ. Comput. Res. 2019, 57, 1643–1670. [Google Scholar] [CrossRef]
  57. Akcayir, M.; Akcayir, G.; Pektas, H.M.; Ocak, M.A. Augmented Reality in Science Laboratories: The Effects of Augmented Reality on University Students’ Laboratory Skills and Attitudes toward Science Laboratories. Comput. Hum. Behav. 2016, 57, 334–342. [Google Scholar] [CrossRef]
  58. Kapp, S.; Thees, M.; Beil, F.; Weatherby, T.; Burde, J.-P.; Wilhelm, T.; Kuhn, J. The Effects of Augmented Reality: A Comparative Study in an Undergraduate Physics Laboratory Course. In Proceedings of the 12th International Conference on Computer Supported Education, Prague, Czech Republic, 2–4 May 2020; SCITEPRESS—Science and Technology Publications: Prague, Czech Republic, 2020; pp. 197–206. [Google Scholar]
  59. Kapp, S.; Thees, M.; Beil, F.; Weatherby, T.; Burde, J.-P.; Wilhelm, T.; Kuhn, J. Using Augmented Reality in an Inquiry-Based Physics Laboratory Course. In Proceedings of the Computer Supported Education; Lane, H.C., Zvacek, S., Uhomoibhi, J., Eds.; Springer International Publishing: Cham, Switzerland, 2021; pp. 177–198. [Google Scholar]
  60. Kapp, S.; Lauer, F.; Beil, F.; Rheinländer, C.C.; Wehn, N.; Kuhn, J. Smart Sensors for Augmented Electrical Experiments. Sensors 2022, 22, 256. [Google Scholar] [CrossRef] [PubMed]
  61. Thees, M.; Altmeyer, K.; Kapp, S.; Rexigel, E.; Beil, F.; Klein, P.; Malone, S.; Brünken, R.; Kuhn, J. Augmented Reality for Presenting Real-Time Data During Students’ Laboratory Work: Comparing a Head-Mounted Display With a Separate Display. Front. Psychol. 2022, 13, 804742. [Google Scholar] [CrossRef] [PubMed]
  62. Amiraslanov, O.; Javaheri, H.; Bian, S.; Lukowicz, P. Preparation for Future Learning: Augmented-Reality Enhanced Interactive Science Labs. In Proceedings of the 2018 ACM International Joint Conference and 2018 International Symposium on Pervasive and Ubiquitous Computing and Wearable Computers, Singapore, 8–12 October 2018. [Google Scholar]
  63. Bakri, F.; Pratiwi, S.; Muliyati, D. Video-Enriched Worksheet Based on Augmented Reality Technology: The Heat Experiment Is Easier. In Proceedings of the 8th National Physics Seminar 2019, Jakarta, Indonesia, 29–30 June 2019; ISBN 0094-243X. [Google Scholar]
  64. Caputo, E.; Lo Moriello, R.S.; De Pandi, F.; Liccardo, A.; Gallicchio, V.; Quarto, M. Exploiting Augmented Reality and Internet of Things for Gamma Ray Experiments in Educational Field. In Proceedings of the 2021 IEEE International Instrumentation and Measurement Technology Conference (I2MTC), Glasgow, UK, 17–20 May 2021; IEEE: Glasgow, UK, 2021; pp. 1–6. [Google Scholar]
  65. Lo Schiano Moriello, R.; Liccardo, A.; Bonavolonta, F.; Caputo, E.; Gloria, A.; Alteriis, G. On the Suitability of Augmented Reality for Safe Experiments on Radioactive Materials in Physics Educational Applications. IEEE Access 2022, 10, 54185–54196. [Google Scholar] [CrossRef]
  66. Chen, M.; Li, Y.; Shrestha, H.; Rakotondravony, N.; Teixeira, A.; Harrison, L.; Dempski, R.E. FlowAR: A Mixed Reality Program to Introduce Continuous Flow Concepts. J. Chem. Educ. 2024, 101, 1865–1874. [Google Scholar] [CrossRef]
  67. Giancaspro, J.W.; Arboleda, D.; Kim, N.J.; Chin, S.J.; Britton, J.C.; Secada, W.G. An Active Learning Approach to Teach Distributed Forces Using Augmented Reality with Guided Inquiry. Comput. Appl. Eng. Educ. 2024, 32, e22703. [Google Scholar] [CrossRef]
  68. Jiang, S.; Tatar, C.; Huang, X.; Sung, S.H.; Xie, C. Augmented Reality in Science Laboratories: Investigating High School Students’ Navigation Patterns and Their Effects on Learning Performance. J. Educ. Comput. Res. 2021, 60, 777–803. [Google Scholar] [CrossRef]
  69. Keller, O.; Schmeling, S.; Mueller, A.; Benoit, M. iPadPix—A Novel Educational Tool to Visualise Radioactivity Measured by a Hybrid Pixel Detector. J. Instrum. 2016, 11, C11032. [Google Scholar] [CrossRef]
  70. Knierim, P.; Kiss, F.; Schmidt, A. Look Inside: Understanding Thermal Flux Through Augmented Reality. In Proceedings of the 2018 IEEE International Symposium on Mixed and Augmented Reality Adjunct, Munich, Germany, 16–20 October 2018. [Google Scholar]
  71. Kreienbühl, T.; Wetzel, R.; Burgess, N.; Maria Schmid, A.; Brovelli, D. AR Circuit Constructor: Combining Electricity Building Blocks and Augmented Reality for Analogy-Driven Learning and Experimentation. In Proceedings of the 2020 IEEE International Symposium on Mixed and Augmented Reality Adjunct (ISMAR-Adjunct), Recife, Brazil, 9–13 November 2020; pp. 13–18. [Google Scholar]
  72. Kuhn, J.; Nussbaumer, A.; Pirker, J.; Karatzas, D.; Pagani, A.; Conlan, O.; Memmel, M.; Steiner, C.M.; Guetl, C.; Albert, D.; et al. Advancing Physics Learning Through Traversing a Multi-Modal Experimentation Space. In Proceedings of the Workshop proceedings of the 11th International Conference on Intelligent Environments, Prague, Czech Republic, 1 July 2015; ISBN 1875-4163. [Google Scholar]
  73. Lauer, L.; Peschel, M.; Malone, S.; Altmeyer, K.; Brunken, R.; Javaheri, H.; Amiraslanov, O.; Gruenerbl, A.; Lukowicz, P. Real-Time Visualization of Electrical Circuit Schematics: An Augmented Reality Experiment Setup to Foster Representational Knowledge in Introductory Physics Education. Phys. Teach. 2020, 58, 518–519. [Google Scholar] [CrossRef]
  74. Liu, Q.; Xu, S.; Yu, S.; Yang, Y.; Wu, L.; Ba, S. Design and Implementation of an AR-Based Inquiry Courseware-Magnetic Field. In Proceedings of the 2019 International Symposium on Educational Technology (ISET), Hradec Kralove, Czech Republic, 2–4 July 2019. [Google Scholar]
  75. Shufan, Y.; Qingtang, L.; Jingjing, M.; Huixiao, L.; Shen, B. Applying Augmented Reality to Enhance Physics Laboratory Experience: Does Learning Anxiety Matter? Interact. Learn. Environ. 2023, 31, 6952–6967. [Google Scholar] [CrossRef]
  76. Midak, L.Y.; Kravets, I.V.; Kuzyshyn, O.V.; Pahomov, J.D.; Lutsyshyn, V.M.; Uchitel, A.D. Augmented Reality Technology within Studying Natural Subjects in Primary School. In Proceedings of the 2nd International Workshop (AREdu 2019), Kryvyi Rih, Ukraine, 22 March 2019; ISBN 1613-0073. [Google Scholar]
  77. Minaskan, N.; Rambach, J.; Pagani, A.; Stricker, D. Augmented Reality in Physics Education: Motion Understanding Using an Augmented Airtable. In Proceedings of the Virtual Reality and Augmented Reality; Bourdot, P., Interrante, V., Nedel, L., Magnenat-Thalmann, N., Zachmann, G., Eds.; Springer International Publishing: Cham, Switzerland, 2019; pp. 116–125. [Google Scholar]
  78. Murillo, A.R.; Marin-Hurtado, J.I. Improving Kinematic Lab Practices by Image Processing. In Proceedings of the 2014 XIX Symposium on Image, Signal Processing and Artificial Vision, Armenia, Colombia, 17–19 September 2014; ISBN 2329-6259. [Google Scholar]
  79. Ripsam, M.; Nerdel, C. Augmented Reality for Chemistry Education to Promote the Use of Chemical Terminology in Teacher Trainings. Front. Psychol. 2022, 13, 1037400. [Google Scholar] [CrossRef] [PubMed]
  80. Strzys, M.P.; Kapp, S.; Thees, M.; Klein, P.; Lukowicz, P.; Knierim, P.; Schmidt, A.; Kuhn, J. Physics Holo. Lab Learning Experience: Using Smartglasses for Augmented Reality Labwork to Foster the Concepts of Heat Conduction. Eur. J. Phys. 2018, 39, 035703. [Google Scholar] [CrossRef]
  81. Strzys, M.P.; Thees, M.; Kapp, S.; Kuhn, J. Smartglasses in STEM Laboratory Courses-the Augmented Thermal Flux Experiment. In Proceedings of the Physics Education Research Conference, Provo, UT, USA, 24–25 July 2019; ISBN 2377-2379. [Google Scholar]
  82. Thees, M.; Kapp, S.; Strzys, M.P.; Beil, F.; Lukowicz, P.; Kuhn, J. Effects of Augmented Reality on Learning and Cognitive Load in University Physics Laboratory Courses. Comput. Hum. Behav. 2020, 108, 106316. [Google Scholar] [CrossRef]
  83. Sun, J.C.Y.; Ye, S.L.; Yu, S.J.; Chiu, T.K.F. Effects of Wearable Hybrid AR/VR Learning Material on High School Students’ Situational Interest, Engagement, and Learning Performance: The Case of a Physics Laboratory Learning Environment. J. Sci. Educ. Technol. 2022, 32, 1–12. [Google Scholar] [CrossRef]
  84. Wozniak, M.P.; Lewczuk, A.; Adamkiewicz, K.; Joziewicz, J.; Malaya, M.; Ladonski, P.; Machinery, A.C. ARchemist: Aiding Experimental Chemistry Education Using Augmented Reality Technology. In Proceedings of the Extended Abstracts of the 2020 CHI Conference on Human Factors in Computing Systems, Honolulu, HI, USA, 25–30 April 2020. [Google Scholar]
  85. Wozniak, M.; Lewczuk, A.; Adamkiewicz, K.; Joziewicz, J.; Jaworski, T.; Rowinska, Z. ARchemist: Towards In-Situ Experimental Guidance Using Augmented Reality Technology. In Proceedings of the 18th International Conference on Advances in Mobile Computing & Multimedia, Chiang Mai, Thailand, 30 November–2 December 2020. [Google Scholar]
  86. Mayer, R.E. Cognitive Theory of Multimedia Learning. In The Cambridge Handbook of Multimedia Learning; Cambridge University Press: New York, NY, USA, 2005; pp. 31–48. ISBN 978-0-521-54751-2. [Google Scholar]
  87. Kennewell, S.; Tanner, H.; Jones, S.; Beauchamp, G. Analysing the Use of Interactive Technology to Implement Interactive Teaching. J. Comput. Assist. Learn. 2008, 24, 61–73. [Google Scholar] [CrossRef]
  88. Oliver, R. Interactions in Multimedia Learning Materials: The Things That Matter. In Proceedings of the 3rd International, Interactive Multimedia Symposium, Perth, Australia, 21–25 January 1996; pp. 21–25. [Google Scholar]
  89. Kim, S.; Song, K.; Lockee, B.; Burton, J. Advances in Game-Based Learning. In Gamification in Learning and Education: Enjoy Learning Like Gaming; Springer International Publishing: New York, NY, USA, 2018; ISBN 978-3-319-47282-9. [Google Scholar]
  90. Richter, G.; Raban, D.R.; Rafaeli, S. Studying Gamification: The Effect of Rewards and Incentives on Motivation. In Gamification in Education and Business; Reiners, T., Wood, L.C., Eds.; Springer International Publishing: Cham, Switzerland, 2015; pp. 21–46. ISBN 978-3-319-10207-8. [Google Scholar]
Figure 1. Identification of relevant papers via the database.
Education 14 00760 g001
Figure 2. Number of publications per year.
Education 14 00760 g002
Figure 3. Subject distribution of the AR applications.
Education 14 00760 g003
Figure 4. Topic distribution of experiments.
Education 14 00760 g004
Figure 5. Purpose of the AR application.
Education 14 00760 g005
Figure 6. Distribution of empirical research from selected literature.
Education 14 00760 g006
Figure 7. Research interests from selected literature.
Education 14 00760 g007
Figure 8. Distribution of indicators for “Immersions”.
Education 14 00760 g008
Figure 9. Distribution of “Interactivity” level.
Education 14 00760 g009
Figure 10. Quantity of “Congruence with Reality” indicators.
Education 14 00760 g010
Figure 11. Distribution of indicators for “Congruence with Reality”.
Education 14 00760 g011
Figure 12. Distribution of indicators for “Content proximity to Life”.
Education 14 00760 g012
Figure 13. Quantity of “Content proximity to Life” indicators.
Education 14 00760 g013
Figure 14. Distribution of “Adaptivity” level.
Education 14 00760 g014
Figure 15. Distribution of indicators for “Game Elements”.
Education 14 00760 g015
Figure 16. Quantity of “Game Elements” indicators.
Education 14 00760 g016
Figure 17. Distribution of “Complexity” level.
Education 14 00760 g017
Table 1. Results of different research interests.
InterestResultNumber of Studies
Concept ConnectionsHigher5
No difference2
Cognitive LoadNo difference5
Lower2
Knowledge GainHigher4
No difference1
AttitudePositive5
PerformanceHigher2
No difference1
Disclaimer/Publisher’s Note: The statements, opinions and data contained in all publications are solely those of the individual author(s) and contributor(s) and not of MDPI and/or the editor(s). MDPI and/or the editor(s) disclaim responsibility for any injury to people or property resulting from any ideas, methods, instructions or products referred to in the content.

