Abstract
A Bayesian additive regression tree (BART) is a recent statistical method that blends ensemble learning with nonparametric regression. BART is constructed using a Bayesian approach, which provides the benefit of model-based prediction uncertainty, enhancing the reliability of predictions. This study proposes the development of a BART model with a binomial likelihood to predict the percentage of students retained in tutorial classes using attendance data sourced from a South African university database. The data consist of tutorial dates and encoded (anonymized) student numbers, which play a crucial role in deriving retention variables such as cohort age, active students, and retention rates. The proposed model is evaluated and benchmarked against the random forest regressor (RFR). The proposed BART model reported an average of 20% higher predictive performance compared to RFR across six error metrics, achieving an R-squared score of 0.9414. Furthermore, the study demonstrates the utility of the highest density interval (HDI) provided by the BART model, which can help in determining the best- and worst-case scenarios for student retention rate estimates. The significance of this study extends to multiple stakeholders within the educational sector. Educational institutions, administrators, and policymakers can benefit from this study by gaining insights into how future tutorship programme student retention rates can be predicted using predictive models. Furthermore, the foresight provided by the predicted student retention rates can aid in strategic resource allocation, facilitating more informed planning and budgeting for tutorship programmes.
1. Introduction
In today’s higher education landscape, retaining students has emerged as a significant challenge. Statistics reveal that nearly 40% of students are not retained within their academic institutions or classes over time, indicating the urgency of addressing this issue [1]. Consequently, educators and researchers have undertaken numerous studies to explore innovative approaches to student retention. One approach that has gained significant attention is data analytics. Educational institutions have begun recognizing the potential of data analytic solutions in ensuring student success and retention [2]. Student retention, in this context, is defined as the percentage of students who re-enrol from one academic year to the next [1]. The term data analytics refers to the systematic examination of raw data within a specific context to uncover meaningful patterns, correlations, and trends that can be translated into actionable insights [3]. The application of data analytics in the education domain is commonly referred to as educational data analytics [3].
Recent studies demonstrate that higher education institutions that develop predictive and diagnostic analytical solutions to address student retention can benefit from enhanced reputation, better ranking, and financial stability [3,4,5]. Low retention rates negatively impact an institution’s financial and institutional stability [4,6], demonstrating the need for educational institutions to develop and implement effective data analytic strategies to improve student retention rates.
While existing work in educational data analytics has primarily focused on the development of predictive models, such as logistic regression, support vector machines, random forest, and decision trees, for the purpose of predicting student retention, a notable gap exists in the consideration of student retention as a multifaceted problem [1,5,7,8]. Student retention encompasses more than just predicting whether a student can be retained from one year to the next; it also extends to various programmes offered by institutions, including tutorship programmes (TPs).
TPs have become an essential part of higher educational institutions, as they provide a supportive environment for students to improve their academic performance [9]. TPs offer personalized attention, access to resources, and mentorship opportunities, which can enhance students’ understanding of complex concepts and development of study skills [9]. Moreover, TPs can increase students’ confidence in their abilities, leading to improved academic and personal outcomes [9]. However, to ensure the effectiveness of tutorship programmes, it is crucial to ensure retention in tutorial classes. This study defines student retention in tutorial classes as the percentage of students retained in tutorial classes over a specified period. High retention rates in TPs not only ensure that students continue to benefit from personalized instruction and support, but also help to improve graduation rates [10]. In this way, TPs play a critical role in improving student success and supporting their academic and personal development [10].
Despite the progress made in using educational data analytics to tackle student retention, gaps in literature persist. One significant gap pertains to the absence of predictive models in education that can offer reliable predictions using uncertainty quantification approaches [11]. The current predictive models used in studies lack probabilistic information, which leads to overly confident or incomplete decision making. Uncertainty quantification provides a framework for estimating and integrating probabilistic information into predictive models [12,13]. By disregarding uncertainty, these studies fail to assess the confidence associated with predictions. Uncertainty information is crucial for decision making and risk assessment. Ignoring uncertainty can result in incomplete or deceptive decision-making [12,14]. Decision makers in education need not only point predictions but also a measure of certainty in those predictions. Neglecting uncertainty may result in underestimating risks, overestimating benefits, or making suboptimal choices [14].
To address these gaps, this study proposes the adoption of a Bayesian approach to model and predict attendance-based retention in tutorial classes. Bayesian models, grounded in probability theory, provide a statistical framework for making predictions and decisions. Notably, Bayesian models offer several benefits over traditional predictive models such as logistic regression, support vector machines, random forest, and decision trees. These benefits include the ability to incorporate prior information, quantify uncertainty, and handle limited data [12,14].
The rest of this paper is organized as follows. Section 2 presents the literature review, covering types of data analytics in higher education, including academic analytics, educational data mining, and learning analytics. Bayesian modelling and the use of predictive analytics in modelling student retention are also discussed. Section 3 describes the materials and methods, focusing on the Knowledge Discovery in Databases (KDD) framework, which includes data collection and understanding, data preprocessing and transformation, modelling using random forest regressor and Bayesian additive regression trees, and evaluation. Section 4 presents the results, including descriptive analysis, model evaluation, and the highest density interval estimates for the BART model. Finally, Section 5 provides the conclusion.
2. Literature Review
2.1. Types of Data Analytics in Higher Education
The expansion of data analytics in higher education is being driven by the necessity to create innovative solutions based on data to address the challenges faced in education [2,12]. This trend is further fuelled by the growing amount and diversity of data collected from both online and traditional university offerings, opening up new possibilities for using data analytics to enhance the quality of higher education [2]. Consequently, different terms that are closely related, such as academic analytics (AA), educational data mining (EDM), and learning analytics (LA), have emerged to represent distinct types of data analytics employed in higher education [2]. These terms indicate various approaches to data analytics used in the field. Furthermore, the outcomes of one type of data analytics can serve as input for another, resulting in a complex and interconnected landscape of data analytics approaches in higher education. This section will explore each type of data analytics in education and determine which ones will be used in this study.
2.1.1. Academic Analytics
Academic analytics is a term that is defined as “the application of data analytic techniques and tools for purposes of supporting institutional operations and decision making” [3]. The primary focus of academic analytics is to enhance institutional operations and decision-making processes. This process involves the use of data analytic techniques and tools at five distinct levels, namely, faculty, institutional, regional, national, and international levels [3]. It is worthy to note that academic analytics offers potential benefits to a diverse range of individuals and groups, including students, faculty, and executive officers.
The utilization of academic analytics can bring significant advantages to faculty members. Through the examination of educational data, academic analytics has the capability to provide important factors that contribute to student success, offer valuable insights into effective methods, and enhance knowledge about teaching and learning [15,16,17]. Student success holds a prominent position as a key performance indicator (KPI) in higher education; therefore, most faculty members are highly interested in predicting and monitoring student success. Studies have shown that student engagement indicators, such as attendance, clicks, and time spent on learning management systems (LMSs), are crucial predictors of student success [12]. Using academic analytics, faculty members can gain access to this information and use it to inform their teaching practices.
Academic analytics offers valuable support to executive officers in higher education by providing useful information on KPIs to support decision-making procedures [16]. For instance, the Director of Learning and Teaching may leverage academic analytics to obtain information on the student retention rate of tutorship programmes and the proportion of at-risk students. Armed with this information, the Director may choose to review the quality of the institution’s tutorship programmes and learning and teaching strategy. Academic analytics can also help executive officers to optimize the use of resources and funds. By analysing educational data, academic analytics can identify areas where resources and funds can be allocated more effectively, leading to improved institutional performance [16].
2.1.2. Educational Data Mining
Educational data mining is defined as “the development and evaluation of data analytics methods for exploring educational data and using those methods to better understand learners and the learning environment” [3]. The primary objects of interest within the field of EDM are the methods and techniques employed for the purpose of analysing data at various levels within the educational system, namely, departmental, faculty, and institutional levels [3]. The various methods and techniques applied in EDM have been categorized into five general groups. These groups are clustering, relationship mining, prediction, discovery with models, and distillation of data for human judgement [18,19]. Prediction methods are used to forecast future outcomes, while clustering methods are applied to identify groups with similar attributes [3]. Relationship mining explores correlations between different variables, and discovery with models aims to uncover hidden patterns in the data [3]. The final group, distillation of data for human judgement, involves summarizing complex data into easily interpretable formats that can aid decision making [3].
2.1.3. Learning Analytics
Learning analytics refers to “the application of data analytic techniques and tools for purposes of understanding and enhancing learning and teaching” [3]. The primary focus of learning analytics is the learners and the learning settings, which are subject to data analysis at the levels of individual students, courses, and departments [3].
As per the Society for Learning Analytics Research (SOLAR), learning analytics can be categorized into four distinct areas, which include descriptive, diagnostic, predictive, and prescriptive analytics [20]. Descriptive analytics provides insights into past events, and they can be achieved through the examination of student feedback from surveys, as well as data that describe the student’s lifecycle, such as study support, enrolments, and exams [20]. Diagnostic analytics, on the other hand, aim to identify underlying patterns in the data. This type of analytics is achieved by analysing educational data to find key performance indicators and metrics that can be used to enhance student engagement [20]. Predictive analytics focuses on understanding the future by identifying patterns in historical data and utilizing statistical models and algorithms to capture relationships and forecast future outcomes. Examples of predictive analytics in learning analytics include predicting at-risk students, student drop-out rates, and retention rates [1]. Lastly, prescriptive analytics aims to offer advice on potential outcomes and recommend choices using machine learning and business rules [20]. Through this type of analytics, institutions can make informed decisions on the best course of action to take, given the available data.
The various forms of data analytics in higher education vary in terms of their focus and the level of the education system they target. It has been noted before that the results obtained from one type of educational data analytics can be used as input for another. In this study, the primary approach to data analytics employed is a combination of academic analytics, which focuses on institutional operations and decision making at the institutional level, and educational data mining, which involves predicting student retention in tutorial classes, also at the institutional level.
2.2. Bayesian Modelling
Bayesian modelling, grounded in the principles of probability theory, provides a sophisticated and principled approach to dealing with uncertainty and incomplete information [14,21]. This section delves into the concept of modelling and the underpinnings of Bayesian modelling. Mathematical formulas are used to elucidate these concepts.
2.2.1. Bayesian Models
In the space of research and practice, models are simplified descriptions of a system or process. Models are designed to deliberately encompass the most significant or relevant variables of a system [21].
Computationally or otherwise, Bayesian models have two defining characteristics:
- Probability distributions: Probability distributions are used to represent unknown quantities, known as parameters.
- Bayes theorem: Bayes theorem is employed as a mechanism to update the parameter values based on the available data.
At a high level, constructing Bayesian models involves three main steps:
- Creating a model by combining and transforming random variables, based on assumptions about how the data were generated, using available data.
- Using Bayes theorem to condition the model to the available data. This process is called inference, resulting in the posterior distribution. While this step is expected to reduce uncertainty in possible parameter values, it is not guaranteed.
- Critiquing the model by evaluating whether it aligns with different criteria, such as the available data and domain-knowledge expertise. This step is necessary due to the uncertainties that practitioners or researchers may have about the model, sometimes requiring comparison with other models.
2.2.2. Bayesian Inference
Stated simply, inference involves drawing conclusions using evidence and reasoning [21]. Bayesian inference is a particular form of statistical inference where probability distributions are combined to derive updated distributions [21]. The process relies on the Bayes theorem to estimate the value of a parameter based on observed data .
The concept of likelihood involves incorporating data into the model, while the prior distribution represents knowledge about the parameters prior to observing the data . The posterior distribution , which combines the likelihood and prior distribution, captures all the relevant information about the problem. The marginal likelihood , which represents the probability of observing the data across all possible parameter values, is often not computed. As a result, Bayes theorem is typically expressed as a proportionality [21]:
In Bayesian inference, a useful quantity to compute is the posterior predictive distribution [21]:
The posterior predictive distribution refers to the distribution of future data,, that is expected based on the posterior , which is derived from the model (comprised of the prior and likelihood) and observed data. Essentially, this represents the data that the model predicts will be seen after analyzing the dataset. The equation for the posterior predictive distribution involves integrating over the posterior distribution of parameters, which means that predictions are made while taking into account the uncertainty associated with model estimates.
2.3. The Use of Predictive Analytics in Modelling Student Retention
This section focuses on the application of predictive analytics in enhancing student retention based on previous research. It discusses the predictive models employed and important factors considered when modelling student retention within the context of higher education.
The potential of data mining methods for developing predictive models to manage student retention in higher education was proposed by [22]. The primary aim was to identify students who require help from the student retention programme. The researchers implemented three decision tree classification models: ID3, C4.5, and ADT. Their findings indicated that the inclusion of all social, personal, environmental, and psychological variables is vital for effective prediction of student retention rates. The variables used in the models included gender, student category, secondary school grades, secondary school math grade, graduation stream, graduation grade, medium of teaching, college location, admission type, and retention.
The effectiveness of predictive deep learning techniques in analysing student learning data and predicting student retention was demonstrated by [2]. The researchers utilized the bidirectional long short-term model (BLSTM) and condition random field (CRF) deep learning techniques, which accurately predicted student retention. The researchers benchmarked these deep learning techniques against several other models, including neural network, decision tree, random forest, naïve Bayes, support vector machines, and logistic regression. Evaluation metrics such as recall, accuracy, precision, and F-score were employed to assess the models’ performance. The predictive variables used to forecast retention included preparatory grade-point average (GPA), mathematics, physics, English, quizzes, assignments, statistics grade, high school, and overall GPA. The study concluded that predictive models can be valuable tools for universities to determine students at risk of discontinuing their studies.
The use of support vector machines and neural network models to predict student retention was explored by [4] with impacts and implications. The study used degree, gender, age, first generation, high school GPA, college GPA, plans to work, and ACT composite as input variables for the models. Interestingly, the authors found that high school rank, first math course grade, SAT math score, and precollege intervention programmes were useful in predicting retention. This suggests that nonacademic factors, such as preparation programmes, may have an impact on student retention.
The use of logistic regression was adopted to investigate whether national exam scores or secondary GPAs are better predictors of first-year retention in higher education [8]. High-stakes exams are entrance exams for higher education and are equivalent to national benchmark tests in South Africa. The study concluded by stating that school GPA predicts retention better in higher education compared to high-stakes national exams.
In another study, the authors assessed the performance of one deep learning algorithm and twenty supervised machine learning algorithms in predicting student retention [7]. All twenty-one algorithms were trained using the following variables: school accreditation, type of school, interest, average grades, gender, parent age, residence, parent salary, house area, parent’s university attendance, and in-university retention. Random forest classifier, logistic regression CV, decision tree classifier, Nu support vector classifier (NuSVC), and linear support vector machine were amongst the twenty-one models used. Out of the twenty-one models used, the NuSVC algorithm emerged as the most effective machine learning method in predicting whether students would persist in their university enrolment or not.
Based on the literature reviewed, random forest and support vector machines were found to be the commonly used predictive models, mainly for classification tasks such as predicting whether a student will be retained (1) or not (0) in university. The most frequently used variables in predictive models for student retention mainly fell under two categories of student data: student demographics and academic performance. It is worth noting that all the models used predicted student retention on an individual student level rather than an institutional level. As a result, the types of educational data analytics used are limited to learning analytics.
3. Materials and Methods
In this study, the Knowledge Discovery in Databases (KDD) framework is adopted. The application of the KDD framework is widespread in the field of educational data mining and academic analytics research [6,19]. The KDD framework provides a structured approach, comprising various steps, to convert raw data into actionable insights [21]. At an abstract level, KDD is concerned with developing methods for making sense of data [23]. The primary challenge addressed by the KDD framework is the transformation of low-level data into other forms that may be more compact, more abstract (such as a model of the data generation process), or more useful (for instance, a predictive model for estimating the value of future cases).
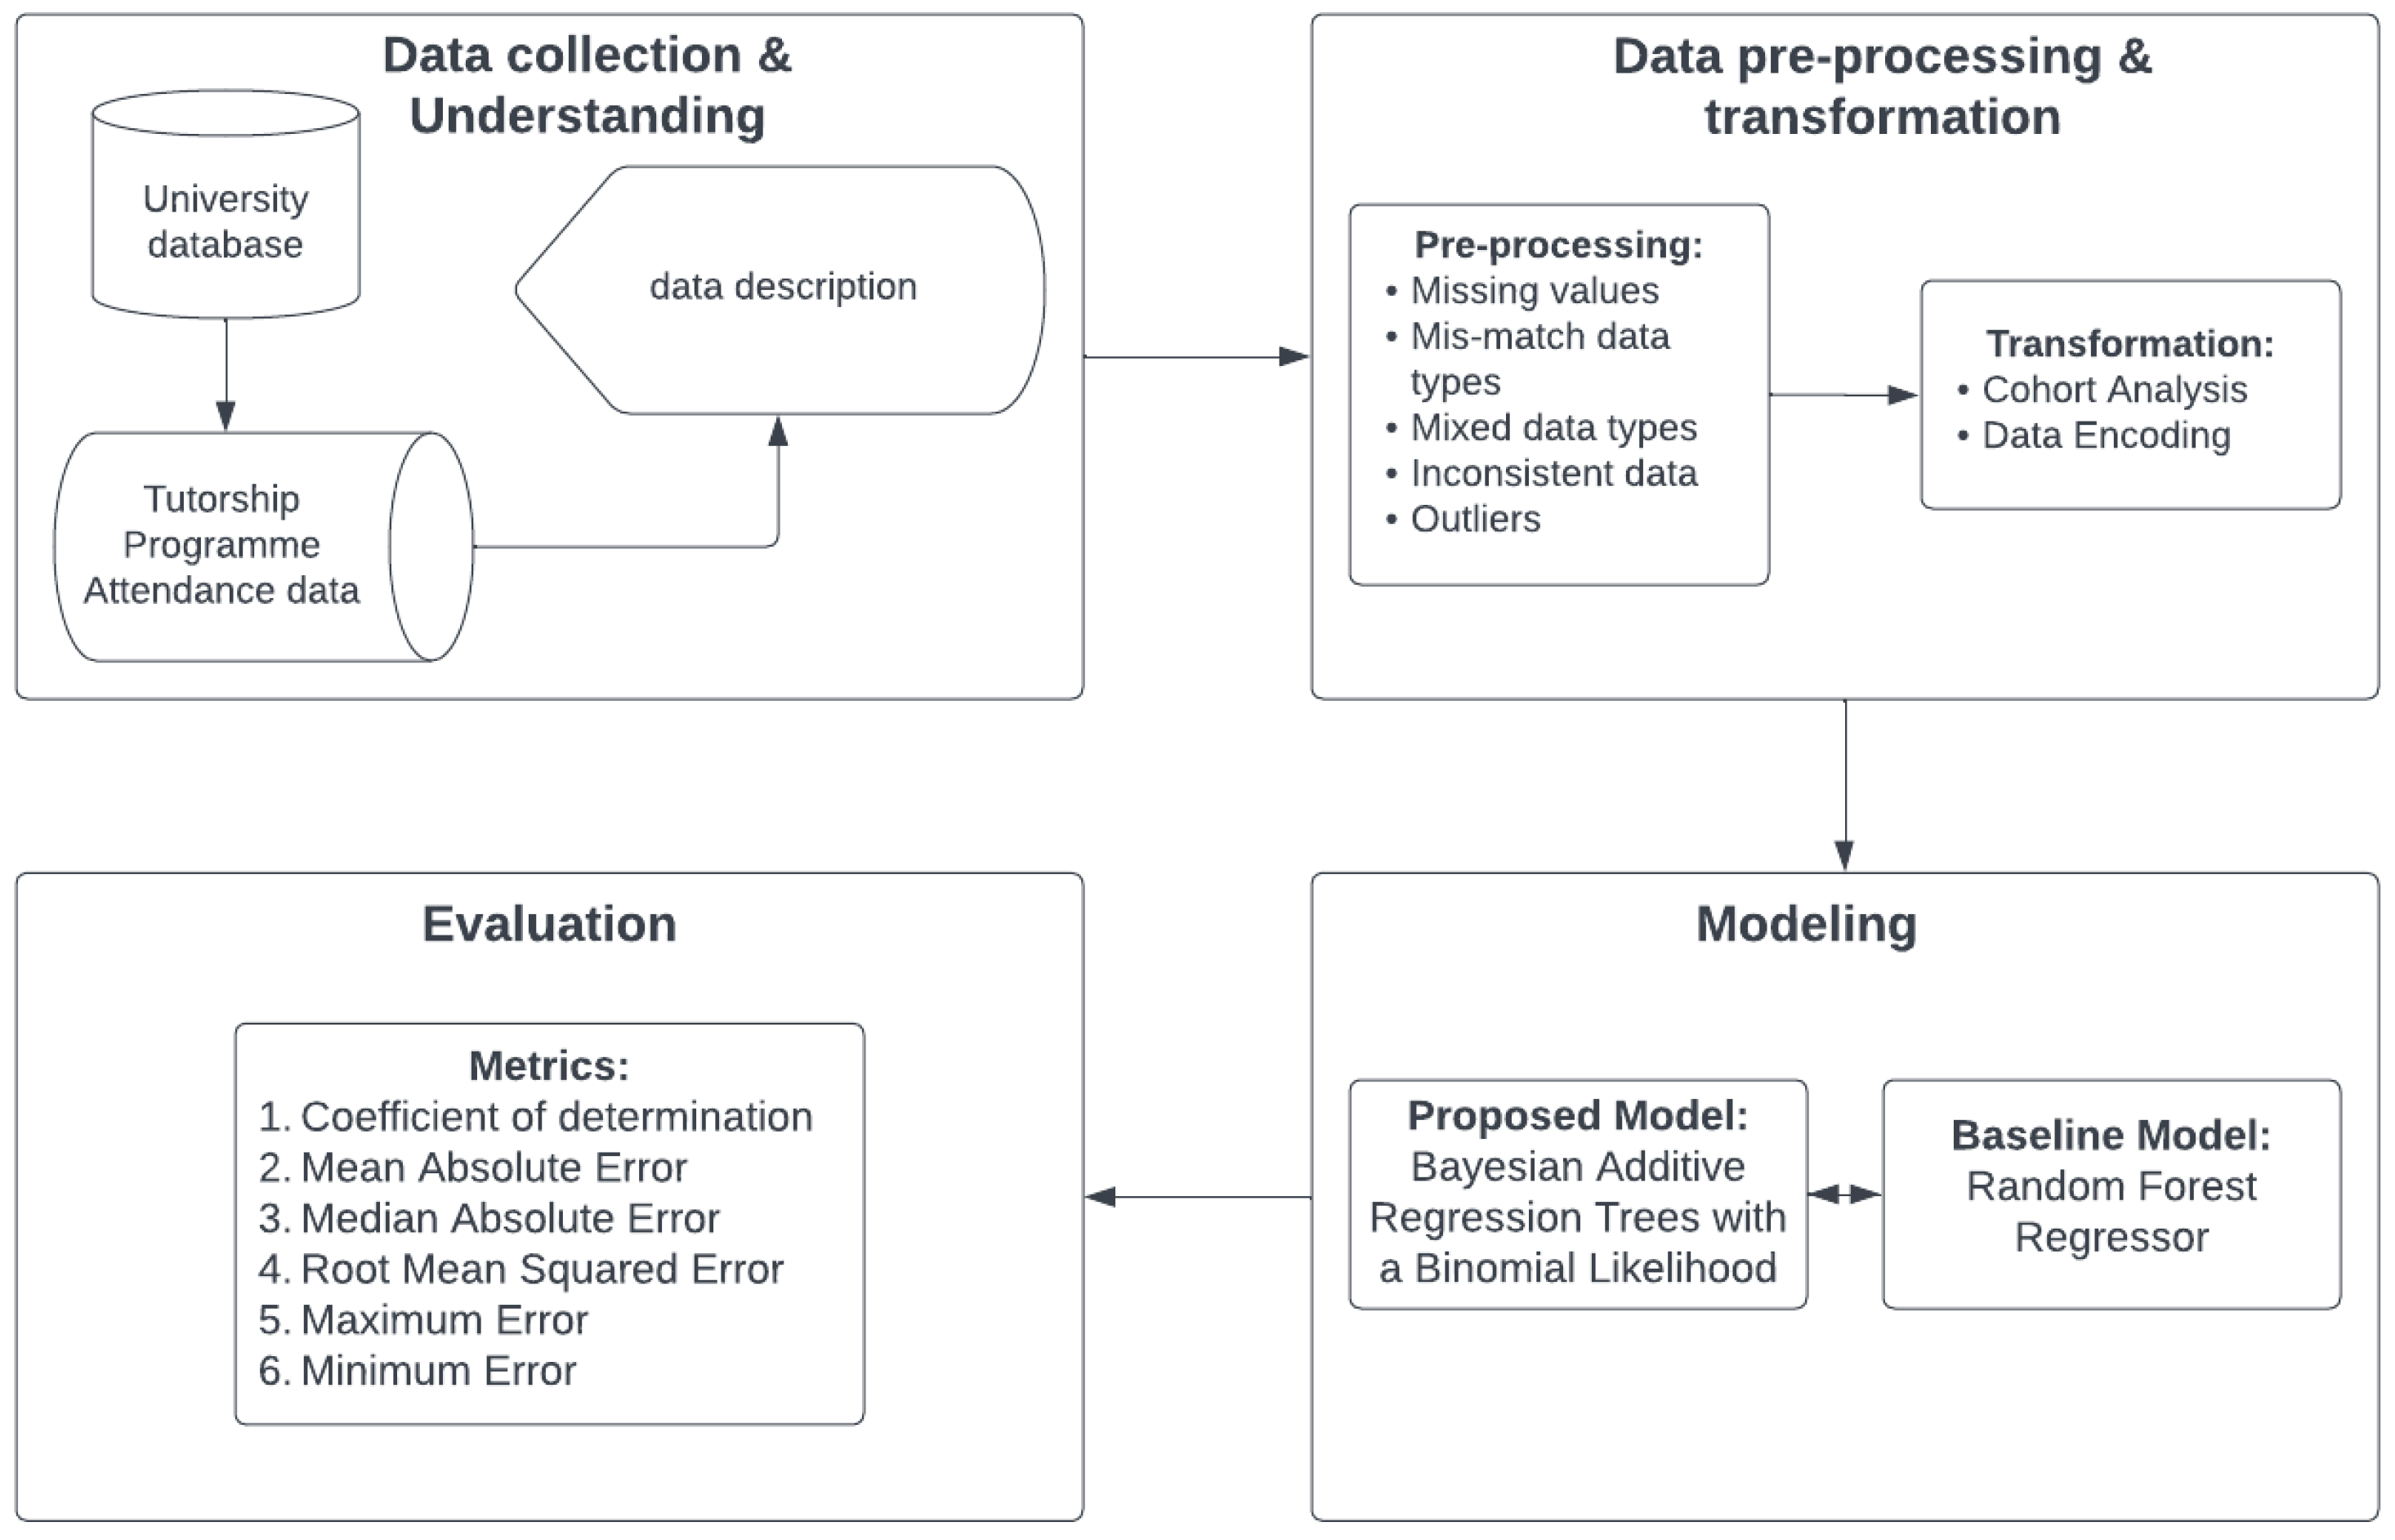
This structured pathway facilitates the extraction of valuable patterns, trends, and knowledge from datasets, empowering informed decision making. The KDD framework encompasses a series of essential steps: (1) data collection and understanding, (2) data preprocessing and transformation, (3) modelling, and (4) evaluation (as illustrated in Figure 1).
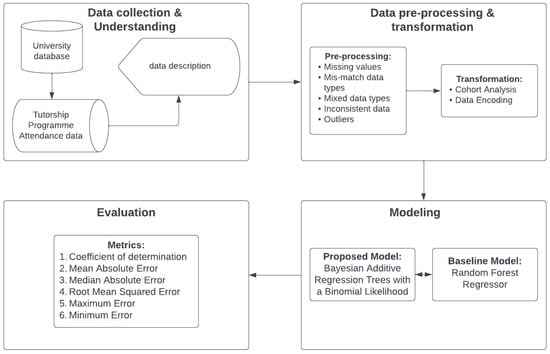
Figure 1.
Knowledge Discovery in Database (KDD) framework.
3.1. Data Collection and Understanding
The tutorship programme attendance data, sourced from a South African university database, consisted of two central variables: tutorial date and encoded (anonymized) student numbers. These two variables played a crucial role in deriving other variables used to predict attendance-based retention in tutorial classes. The tutorial date variable captured the dates on which students attended tutorial classes, thereby enabling the establishment of attendance patterns and trends. Conversely, the encoded student number variable provided encoded identifiers for each student, ensuring the anonymity and privacy of students represented in the attendance data. These encoded student numbers were instrumental in tracking student retention over the course of the tutorship programme (Table 1).

Table 1.
Tutorship programme attendance data.
3.2. Data Preprocessing and Transformation
Data preprocessing and transformation is a key step that converts raw data into data that are more easily and effectively processed in models for more accurate and reliable results [6]. Firstly, data preprocessing was conducted to identify and handle missing data, mismatched data types, mixed data values, inconsistent data, and outliers. Secondly, data transformation was carried out through cohort analysis and data encoding. Cohort analysis is an analytical method that divides data into related groups called cohorts. These cohorts share a common characteristic within a defined timespan. In this study, cohorts were defined by the month in which students first started attending tutorial classes. The cohort analysis transformed tutorship attendance data to retention data. The transformed tutorship attendance data after cohort analysis consisted of 53 observations. Table 2 shows the description of variables derived from tutorial date, and encoded student numbers after cohort analysis.
Table 2.
Descriptions of variables of interest.
Lastly, data encoding was applied to cohort and period as they were in date formats. The data encoding process involved transforming cohort and period into numeric formats that can be used as input in the modelling step.
3.3. Modelling
In this study, two models were implemented: the random forest regressor (RFR) and Bayesian addictive regression trees (BART). These models were implemented using historical tutorial attendance data to predict attendance-based retention in tutorial classes. The random forest regressor was selected as the benchmark model to enable a robust performance comparison against the Bayesian additive regression trees.
3.3.1. Random Forest Regressor
The RFR is a robust ensemble regression technique that leverages the combined power of multiple decision trees and employs a technique called bootstrapping and aggregation to improve predictive accuracy [24]. This technique provides several advantages, making it a valuable tool in modelling. From a computational perspective, the RFR offers several key strengths. It is known for its efficiency, as it is relatively fast both during the training phase and when making predictions. This speed is a result of its parallelizable nature, which allows for efficient implementation across high-dimensional datasets. The RFR depends on only one or two tuning parameters, which simplifies the modelling process. Additionally, it incorporates a built-in estimate of generalization error, aiding in the assessment of model performance and the prevention of overfitting [25].
The core principle of the RFR is to ensemble decision trees, combining their individual predictions to produce a more accurate and robust final output [26]. This is achieved through a process known as bootstrapping. When constructing the ensemble, the RFR algorithm repeatedly selects random samples with replacement from the original dataset. For each of these bootstrap samples, decision trees are trained to predict the response variables based on the corresponding features. Specifically, for each iteration (where ranges from 1 to , the number of bootstrapped samples), a random sample is drawn with replacement from the dataset , yielding . A decision tree regression model denoted as is then trained on this sample. After completing the training phase for all decision trees, the RFR is ready to make predictions. When presented with a new data point , the ensemble regression model aggregates the predictions from all individual decision trees to arrive at the final prediction. This aggregation is performed by calculating the average of the predictions made by each tree, represented as .
The RFR’s strength lies in its ability to reduce overfitting, improve model robustness, and enhance predictive accuracy through the combination of multiple decision trees [24,26]. The RFR model was constructed using the default RFR model parameters as specified by Sklearn.
3.3.2. Bayesian Additive Regression Trees
BART is a recent statistical approach that merges the principles of ensemble learning with nonparametric regression [27,28,29]. What distinguishes BART is its construction within a Bayesian approach, enabling the quantification of prediction uncertainty through a model-based approach [27,28,29,30]. BART’s novelty lies in its capacity to adapt to complex relationships in the data while providing a robust and probabilistically grounded means of assessing predictive uncertainty, which sets it apart from traditional regression methods [29]. Mathematically, the BART model can be represented as follows:
where represents the model covariates (independent variables), each is a tree of the form , where represents the structure of a binary tree, i.e., the set of internal nodes and their associated decision rules and a set of terminal nodes. represents the values at the terminal nodes, represents an arbitrary probability distribution that will be used as the likelihood in the model, and represents other parameters not modelled as a sum of trees [21]. In this study, the BART model was specified as follows:
where represents the likelihood probability distribution for the number of active students. This likelihood was used to indicate that the number of active students follows a binomial distribution. The selection of a binomial likelihood in the BART model was motivated by its suitability for count data, reflecting the act of counting active students within a group of students. Here, represents the retention rate. In the BART model, the logit function given by was used as a transformation function to map retention rate in the range so that the range is not constrained to . The logit transformation allowed for a flexible and nonlinear estimation of log-odds of success, accounting for the complex interactions between cohort age and month. To interpret the results in terms of retention rate , the inverse logit function, , was used, where represents the log-odds value. This transformation allowed the conversion of the model’s log-odds back into the range, enabling the estimation of a retention rate at a given time point.
3.3.3. Evaluation
The retention variable in tutorial classes was modelled as a continuous variable that ranges between 0 and 1, where 0 means that 0 percent of the students are retained in tutorial classes, while 1 means that 100 percent of the students are retained in tutorial classes. The retention prediction error was evaluated using six metrices that are commonly used for continuous variables, namely, minimum error, maximum error, mean absolute error (MAE), median absolute error (MedAE), root mean squared error (RMSE), and coefficient of determination. Each evaluation metric captures different aspects of model performance. By using all six of these metrics, a more comprehensive assessment of model performance was provided. This allowed the analysis of various facets such as the range of errors (minimum and maximum), average errors (MAE), robustness to outliers (MedAE), precision (RMSE), and the proportion of variance explained (coefficient of determination). In the error metric calculations, represents the predicted value of the -th sample and is the corresponding true value.
4. Results
4.1. Descriptive Analysis
After applying the methods for data preprocessing and transformation described in Section 3, six variables were derived: “Cohort”, “Period”, “Cohort Age”, “Students”, “Active Students”, and “Retention”. Table 3 presents a comprehensive overview of key descriptive statistics for the six variables of interest. The “Cohort” and “Period” variables, representing the start and end dates of student attendance, do not have meaningful measures like means, medians, or standard deviations due to their date nature; however, they provide a range, with “Cohort” spanning from 1 January 2022 to 1 October 2022, and “Period” ranging from 1 March 2022 to 1 December 2022. “Cohort Age” has a mean of 141.62 days, indicating that, on average, students attended tutorials for this duration. The median of 122 days shows the typical duration, while a standard deviation of 85.69 days reflects some variation. On average, 183.60 “Students” are present in tutorial classes on any given day, with considerable variability (standard deviation of 155.08) between cohorts, ranging from a minimum of 10 to a maximum of 421 students. “Active Students” has an average of 50.87 and a median of 32, indicating the typical number of students actively participating, with significant variability (standard deviation of 65.17). “Retention” showcases an average retention rate of 33.34%, a typical rate of 24.23%, and a standard deviation of 28.54%, reflecting the diversity in how well students are retained, with rates ranging from a minimum of 0.45% to a maximum of 94.92%. These statistics provide valuable insights into the dynamics of student participation and retention in this study.
Table 3.
Descriptive statistics of variables of interest.
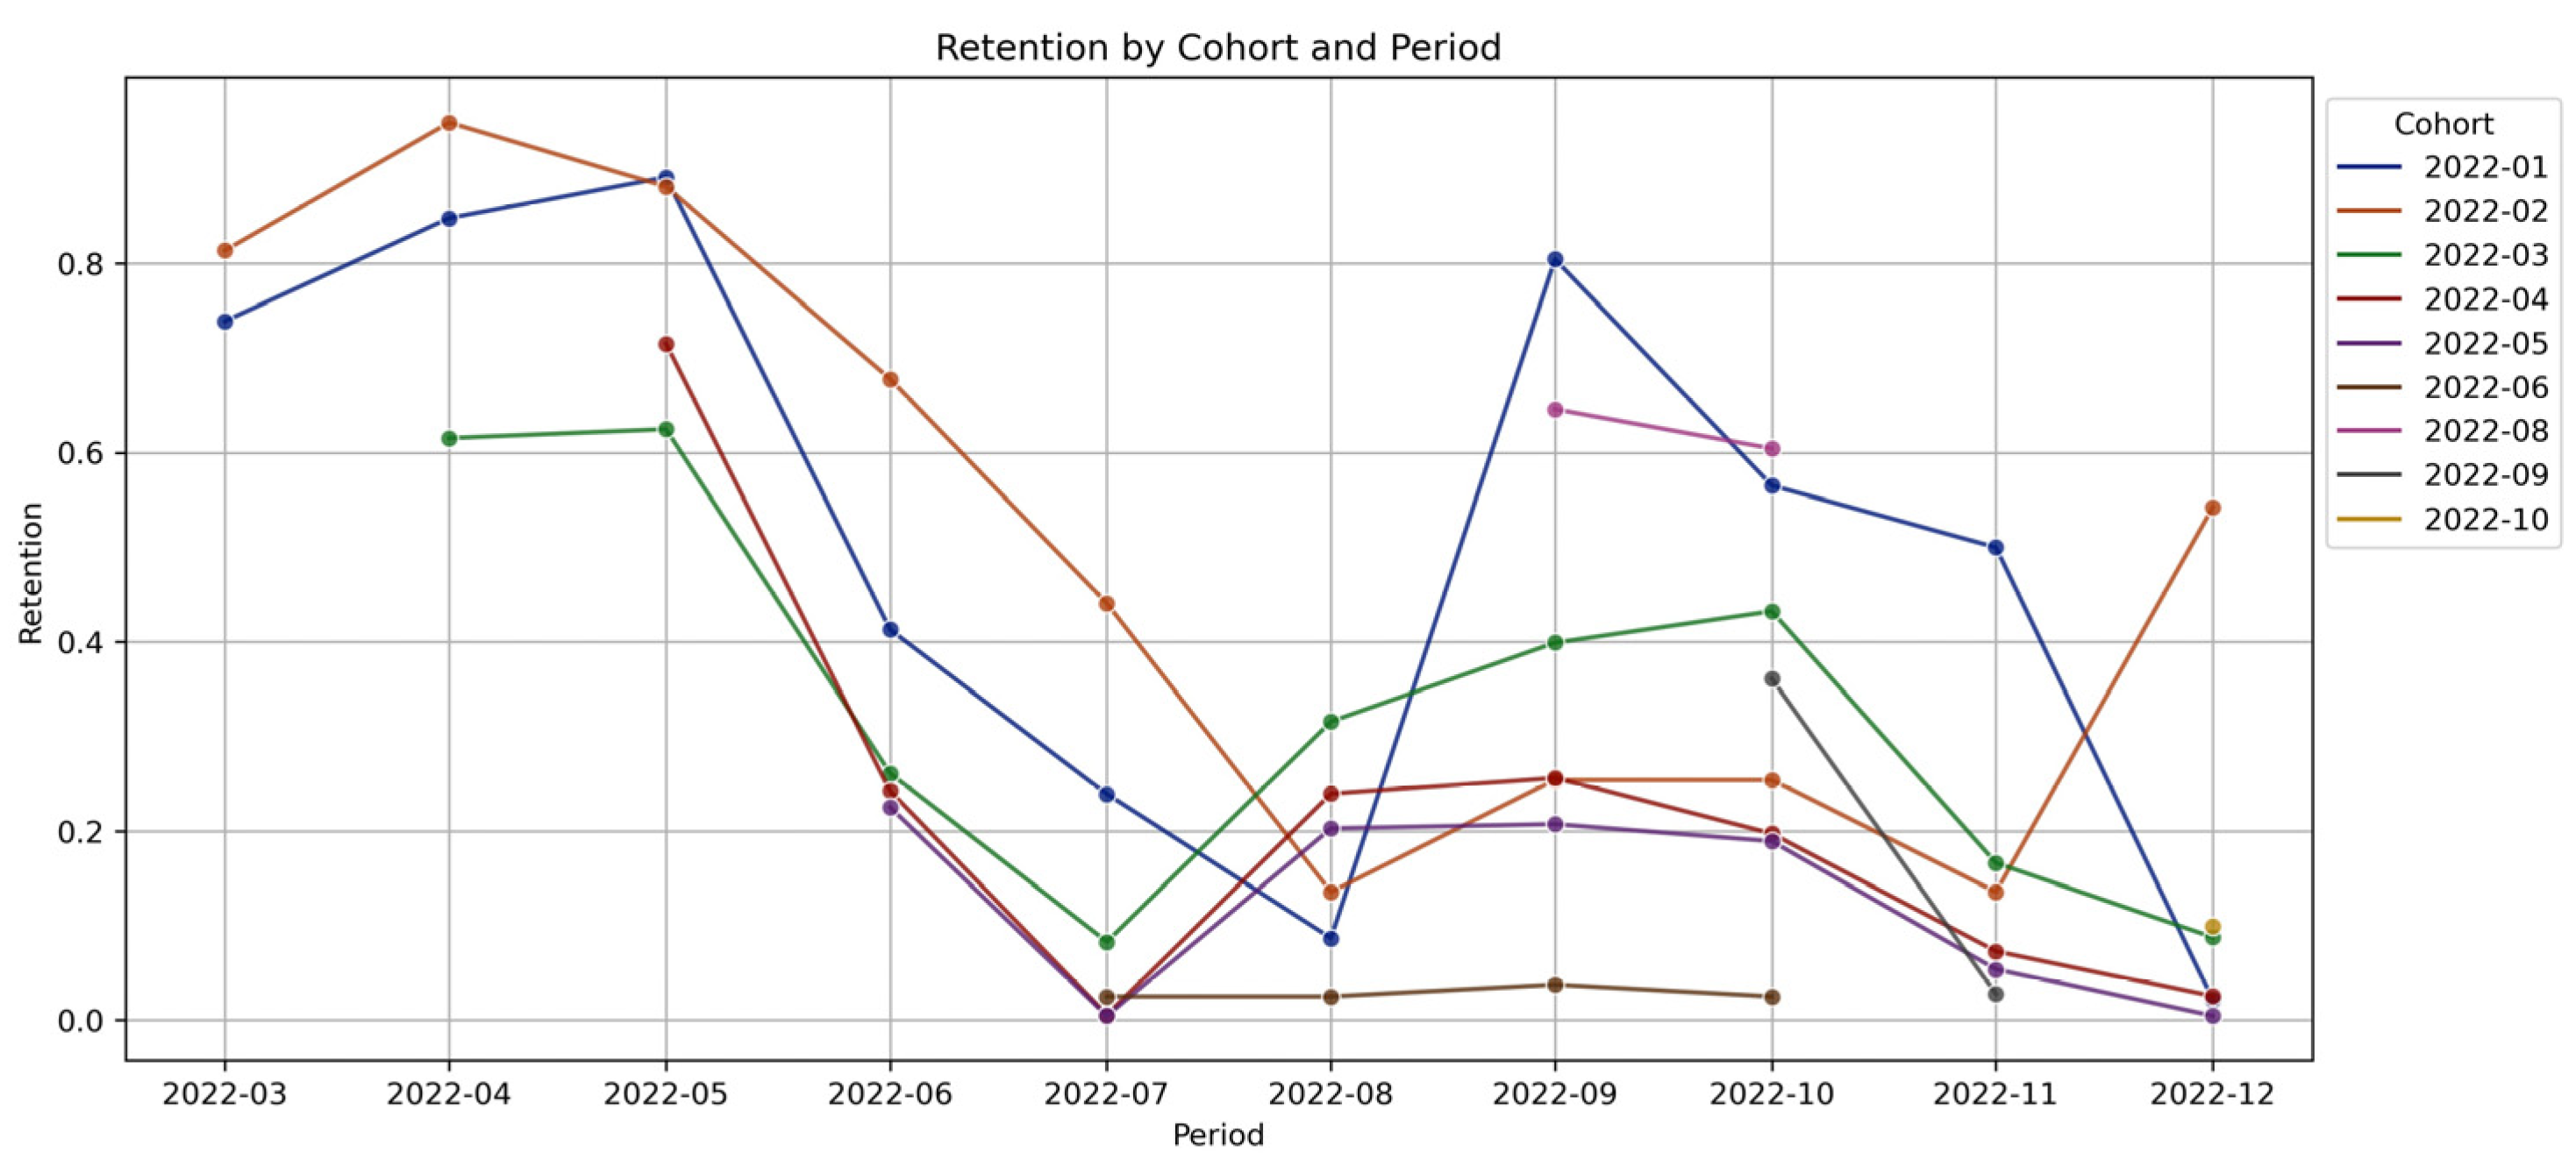
Figure 2 displays the variation in retention rates over time across nine different cohorts. Each cohort indicates the starting date of students attending tutorial classes. The retention rate is at its highest when students commence their tutorial classes and gradually decreases until June (2022-06) and July (2022-07), after which it increases again and then decreases towards November (2022-11) and December (2022-12). Notably, the June, July, November, and December period coincides with mid-year and end-year exams and the semester break, during which the retention rate is at its lowest, suggesting that students discontinue attending tutorial classes to focus on exam preparation, with a holiday break happening after. This illustrates a clear seasonality component in the retention, as depicted in Figure 2, where seasonality peaks decrease over time for each cohort of students.
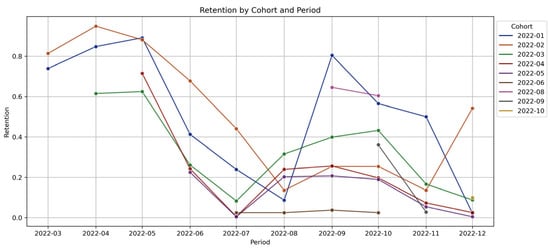
Figure 2.
Retention by cohort and period.
4.2. Model Evaluation
The BART model with a binomial likelihood is assessed in comparison to the RFR using six key metrics: R-squared, MAE, RMSE, MedAE, Max Error, and Min Error. Student retention, ranging from 0% to 100%, serves as a critical indicator, representing the percentage of students retained in tutorial classes.
Table 4 displays the model evaluation results for BART with a binomial likelihood and the RFR model. BART demonstrates strong predictive capabilities, outperforming RFR across all key evaluation metrics, with a significantly higher R2 score of 0.9414 compared to RFR’s 0.9150. This indicates that BART effectively captures a greater proportion of the variance in student retention. Additionally, BART yields a lower MAE of 4.75% as opposed to RFR’s 6.66%, indicating more accurate predictions on average. The RMSE for BART (6.85%) is also lower than that of RFR (8.25%), signifying that its predictions are generally more precise. The MedAE of 3% for BART reflects its consistency in providing predictions close to the actual retention, while RFR shows an MedAE of 6%. Furthermore, BART achieves a slightly lower maximum error (19%) compared to RFR (20%). Both models exhibit a minimum error of 0%, indicating accurate predictions in some instances.
Table 4.
BART and RFR model evaluation.
The BART model demonstrates stronger predictive capabilities in predicting student retention in tutorial classes as compared to RFR; this would make BART the preferred choice for educational institutions in need of robust predictive capabilities.
4.3. BART Model Highest Density Interval (HDI) Estimates
Figure 3 and Figure 4 show the 94% HDI uncertainty estimates for a set of individual cohorts. The HDI is a range of values that captures a certain percentage of a model’s parameters [21]. It provides a measure of the uncertainty in the parameter’s value and can be used to make inferences about the parameter [21]. The 94% HDI in Figure 3 and Figure 4 is a range that captures 94% of the posterior distribution of BART parameters. This means that there is a 94% probability that the true retention rate falls within this interval. A wide HDI interval is an indication of great uncertainty, while a narrow HDI interval is an indication of great certainty. Narrower HDIs indicate more reliable predictions as they suggest that the model has effectively minimized uncertainty. This precision leads to a higher level of confidence in the prediction, offering a more trustworthy basis for decision making. Precision in the context of HDIs refers to the narrowness of the interval that captures the range of plausible values for a prediction [12].
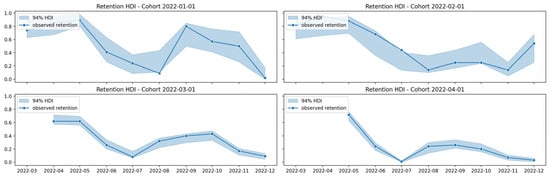
Figure 3.
BART 94% HDI for 2022-01 to 2022-04 cohorts.
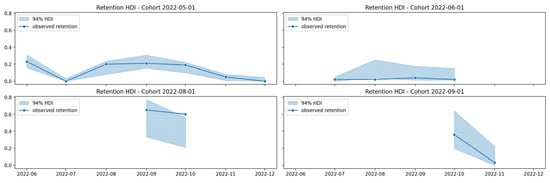
Figure 4.
BART 94% HDI for 2022-05 to 2022-09 cohorts.
In Figure 3 and Figure 4, the 94% HDI interval is wide for cohorts 2022-01, 2022-02, 2022-06, 2022-08, and 2022-09, indicating great uncertainty in the BART model’s predictions for student retention in these cohorts. Conversely, the 94% interval is narrow for cohorts 2022-03, 2022-04, and 2022-05, indicating a great level of certainty and reliability in the BART model’s predictions for student retention in these cohorts.
The high degree of certainty observed in cohorts 2022-03 to 2022-05, as evident by the 94% HDI closely aligning with the observed retention rate, underscores the BART model’s accuracy in predicting student retentions from the onset of tutorials to just before the start of exams. For situations requiring a single prediction, the average or median of the predicted retention values within the 94% HDI can be used as a point estimate.
In practice, the BART model’s computational demands ae notable due to its complex Bayesian framework and the intensive simulations required for tree-based modelling. This is particularly evident when handling large, high-dimensional datasets, where training times can be significantly longer [29]. While the model’s strong predictive performance and ability to quantify uncertainty are valuable assets, these computational challenges must be considered. However, by employing strategies such as parallel processing and optimized algorithms, it is possible to mitigate these issues and enhance the model’s feasibility for practical applications.
5. Conclusions
This paper introduces a BART model with a binomial likelihood for predicting student retention in tutorial classes within tutorship programmes. When compared to the random forest regressor (RFR), the BART model demonstrated an average improvement of 20% in predictive performance and achieved an R-squared score of 0.9414. This enhanced performance underscores BART’s ability to adapt to nonlinear patterns in student data and its proficiency in quantifying prediction uncertainty, thereby supporting more informed decision making.
Tutorship support is one of many student support programmes within educational institutions. Future research could build on this study by exploring various machine learning and statistical models for predicting student retention across different support programmes, facilitating timely interventions. Incorporating a broader range of student data variables and applying interpretable machine learning techniques could also provide deeper insights into the factors influencing student retention in these programmes.
While the Bayesian approach is well established for quantifying uncertainty in model parameters and predictions, conformal prediction (CP) offers a complementary framework. CP is particularly effective at generating prediction regions that capture the inherent variability of point predictions, adding an essential layer of reliability to predictive modelling [31]. Integrating CP with student retention models could further enhance the precision and reliability of predictions.
This study’s findings hold significant relevance for various stakeholders in the educational ecosystem. Educational institutions, administrators, and policymakers can gain valuable insights into predicting student retention rates in tutorship programmes. This information can aid in developing tailored intervention strategies to improve student retention. For instance, tutorship programme coordinators can utilize these predictive models to identify periods of low or high retention and implement timely interventions to foster student engagement. Furthermore, the foresight provided by expected student retention rates can assist in strategic resource allocation, leading to more informed planning and budgeting for support programmes.
Author Contributions
Conceptualization, E.N. and M.M.; methodology, E.N.; software, E.N.; validation, M.M.; formal analysis, E.N.; investigation, E.N. and M.M.; resources, E.N. and M.M.; data curation, E.N.; writing—original draft preparation, E.N.; writing—review and editing, E.N.; visualization, E.N.; supervision, M.M.; project administration, M.M. All authors have read and agreed to the published version of the manuscript.
Funding
This research received no external funding.
Institutional Review Board Statement
Not applicable for studies not involving humans or animals.
Informed Consent Statement
Not applicable.
Data Availability Statement
The data presented in this study are available on request from the corresponding author.
Conflicts of Interest
The authors declare no conflicts of interest.
References
- Shafiq, D.A.; Marjani, M.; Habeeb, R.A.A.; Asirvatham, D. Student Retention Using Educational Data Mining and Predictive Analytics: A Systematic Literature Review. IEEE Access 2022, 10, 72480–72503. [Google Scholar] [CrossRef]
- Uliyan, D.; Aljaloud, A.S.; Alkhalil, A.; Amer, H.S.A.; Mohamed, M.A.E.A.; Alogali, A.F.M. Deep Learning Model to Predict Student Retention Using BLSTM and CRF. IEEE Access 2021, 9, 135550–135558. [Google Scholar] [CrossRef]
- Nguyen, A.; Gardner, L.; Sheridan, D. Data Analytics in Higher Education: An Integrated View. J. Inf. Syst. Educ. 2020, 31, 61–71. [Google Scholar]
- Trivedi, S. Improving Students’ Retention Using Machine Learning: Impacts and Implications. Sci. Prepr. 2022. [Google Scholar] [CrossRef]
- Cardona, T.A.; Cudney, E.A. Predicting Student Retention Using Support Vector Machines. Procedia Manuf. 2019, 39, 1827–1833. [Google Scholar] [CrossRef]
- Palacios, C.A.; Reyes-Suárez, J.A.; Bearzotti, L.A.; Leiva, V.; Marchant, C. Knowledge Discovery for Higher Education Student Retention Based on Data Mining: Machine Learning Algorithms and Case Study in Chile. Entropy 2021, 23, 485. [Google Scholar] [CrossRef] [PubMed]
- Arqawi, S.M.; Zitawi, E.A.; Rabaya, A.H.; Abunasser, B.S.; Abu-Naser, S.S. Predicting University Student Retention Using Artificial Intelligence. Int. J. Adv. Comput. Sci. Appl. 2022, 13, 315–324. [Google Scholar] [CrossRef]
- Meeter, M. Predicting Retention in Higher Education from High-Stakes Exams or School GPA. Educ. Assess. 2022, 28, 1–10. [Google Scholar] [CrossRef]
- Wakelin, E. Personal Tutoring in Higher Education: An Action Research Project on How to Improve Personal Tutoring for Both Staff and Students. Educ. Action Res. 2021, 31, 998–1013. [Google Scholar] [CrossRef]
- Caballero, B.F. Higher Education: Factors and Strategies for Student Retention. HETS Online J. 2020, 10, 82–105. [Google Scholar] [CrossRef]
- Bertolini, R.; Finch, S.J.; Nehm, R.H. An Application of Bayesian Inference to Examine Student Retention and Attrition in the STEM Classroom. Front. Educ. 2023, 8, 1073829. [Google Scholar] [CrossRef]
- Nimy, E.; Mosia, M.; Chibaya, C. Identifying At-Risk Students for Early Intervention—A Probabilistic Machine Learning Approach. Appl. Sci. 2023, 13, 3869. [Google Scholar] [CrossRef]
- Nimy, E.; Mosia, M. Web-Based Clustering Application for Determining and Understanding Student Engagement Levels in Virtual Learning Environments. Psychol. Rev. 2023, 33, 863–882. [Google Scholar] [CrossRef]
- Murphy, K.P. Probabilistic Machine Learning: An Introduction; MIT Press: London, UK, 2021; pp. 1–2. [Google Scholar]
- Susnjak, T.; Ramaswami, G.S.; Mathrani, A. Learning Analytics Dashboard: A Tool for Providing Actionable Insights to Learners. Int. J. Educ. Technol. High. Educ. 2022, 19, 12. [Google Scholar] [CrossRef] [PubMed]
- Campbell, J.P.; DeBlois, P.B.; Oblinger, D.G. Academic Analytics: A New Tool for a New Era. EDUCAUSE Rev. 2007, 42, 40–57. [Google Scholar]
- Mosia, M.S. Periodisation of Mathematics Teacher Knowledge for Teaching: A Construction of Bricolage. S. Afr. Rev. Educ. Prod. 2016, 22, 134–151. [Google Scholar]
- Baker, R.S.J.D. Data Mining for Education. Int. Encycl. Educ. 2010, 7, 112–118. [Google Scholar]
- Mohamad, S.K.; Tasir, Z. Educational Data Mining: A Review. Procedia Soc. Behav. Sci. 2013, 97, 320–324. [Google Scholar] [CrossRef]
- Society for Learning Analytics Research (SoLAR). What Is Learning Analytics? 2019. Available online: https://www.solaresearch.org/about/what-is-learning-analytics/ (accessed on 10 April 2023).
- Martin, O.A.; Kumar, R.; Lao, J. Bayesian Modeling and Computation in Python; CRC Press: Boca Raton, FL, USA, 2021. [Google Scholar]
- Yadav, S.K.; Bharadwaj, B.; Pal, S. Mining Education Data to Predict Student’s Retention: A Comparative Study. arXiv 2012, arXiv:1203.2987. [Google Scholar]
- Fayyad, U.; Piatetsky-Shapiro, G.; Smyth, P. From Data Mining to Knowledge Discovery in Databases. AI Mag. 1996, 17, 37. [Google Scholar]
- Breiman, L. Random Forests. Mach. Learn. 2001, 45, 5–32. [Google Scholar] [CrossRef]
- Cutler, A.; Cutler, D.R.; Stevens, J.R. Random Forests. In Ensemble Machine Learning; Zhang, C., Ma, Y., Eds.; Springer: New York, NY, USA, 2012; pp. 157–176. [Google Scholar] [CrossRef]
- Segal, M.R. Machine Learning Benchmarks and Random Forest Regression. UCSF: Center for Bioinformatics and Molecular Biostatistics. 2004. Available online: https://escholarship.org/uc/item/35x3v9t4 (accessed on 26 July 2023).
- Chipman, H.A.; George, E.I.; McCulloch, R.E. BART: Bayesian Additive Regression Trees. Ann. Appl. Stat. 2010, 4, 266–298. [Google Scholar] [CrossRef]
- Hill, J.; Linero, A.; Murray, J. Bayesian Additive Regression Trees: A Review and Look Forward. Annu. Rev. Stat. Its Appl. 2020, 7, 251–278. [Google Scholar] [CrossRef]
- Zhang, T.; Geng, G.; Liu, Y.; Chang, H.H. Application of Bayesian Additive Regression Trees for Estimating Daily Concentrations of PM2.5 Components. Atmosphere 2020, 11, 1233. [Google Scholar] [CrossRef] [PubMed]
- Um, S. Bayesian Additive Regression Trees for Multivariate Responses. Ph.D. Thesis, The Florida State University, Tallahassee, FL, USA, 2021. Available online: https://purl.lib.fsu.edu/diginole/2021_Summer_Um_fsu_0071E_16667 (accessed on 20 July 2023).
- Angelopoulos, A.N.; Bates, S. A Gentle Introduction to Conformal Prediction and Distribution-Free Uncertainty Quantification. arXiv 2021, arXiv:2107.07511. [Google Scholar]


Disclaimer/Publisher’s Note: The statements, opinions and data contained in all publications are solely those of the individual author(s) and contributor(s) and not of MDPI and/or the editor(s). MDPI and/or the editor(s) disclaim responsibility for any injury to people or property resulting from any ideas, methods, instructions or products referred to in the content. |
© 2024 by the authors. Licensee MDPI, Basel, Switzerland. This article is an open access article distributed under the terms and conditions of the Creative Commons Attribution (CC BY) license (https://creativecommons.org/licenses/by/4.0/).