Article

“What’s Math Got to Do with It?” Emphasizing Math as an Impediment to STEM Excellence for Black Students

by
Kirk D. Rogers, Jr.
Dean of Social Sciences, Human Development, Kinesiology, and Health, San Bernardino Valley College, San Bernardino, CA 92410, USA
Educ. Sci. 2024, 14(8), 855; https://doi.org/10.3390/educsci14080855
Submission received: 31 May 2024 / Revised: 25 July 2024 / Accepted: 26 July 2024 / Published: 7 August 2024
(This article belongs to the Special Issue STEM Education for All: Breaking Barriers and Building Bridges)

Abstract

:
Drawing on Martin’s Multilevel Framework for Analyzing Mathematics Socialization and Identity Among African Americans this study explores the mechanisms that influence Black students’ decision-making processes related to math course taking in high school. Three years of student transcript data for 1561 Black seniors in a Southern California school district were analyzed using descriptive statistics and logistic regression analyses in STATA. The findings reveal factors that impact students’ ability and desire to complete a fourth year of math in high school, interconnected with institutional, structural, identity, and parental factors. One such finding is that accelerated 8th-grade math placement significantly increases the likelihood that a student would enroll in upper-level math coursework, such as “Beyond IM3” courses in high school. The researcher also investigated the influence of the concentration of Black math teachers in a school on the likelihood of a Black student enrolling in a Beyond IM3 math course. The results of this study contribute to an understanding of the limited racial diversity in STEM fields, highlighting the role of math as a major deterrent for Black students’ interest and persistence in STEM. The findings suggest the need for policy and curriculum changes to promote equitable access to advanced math coursework for Black students, especially in the 8th grade. This study also emphasizes the need to address the structural and institutional factors that influence Black students’ decision-making processes related to math course taking in high school.

1. Introduction

In the United States context, math and literacy competencies remain at the forefront of school accountability practices. However, the COVID-19 pandemic illuminated and exacerbated existing systemic issues related to math [1]. As of 2024, overall math scores have not rebounded to pre-COVID-19 numbers. Math scores and math engagement appear to be at their lowest point in years [1,2,3,4,5,6]. For Black students in particular, math continues to be a place of dissonance and contention, particularly due to the racial and structural factors that have created an ever-widening resource and opportunity gap between Black and white students [7], especially given the COVID-19 pandemic and its impact on schools [8]. In this paper, I argue that the racial disparities and limited diversity within STEM fields can be attributed to larger institutional and structural barriers in math education that impede access to rigorous and engaging STEM coursework for Black students. Ladson-Billings [7] centers on how, historically, the United States has time and time again failed Black, Indigenous, or other People of Color communities on multiple levels (I draw from Perez Huber et al.’s [9] definition of Person of Color (POC), which is defined as a person from a non-white racial group that includes, but is not limited to, people of Black or African American heritage, people who identify as Latina/o/x, people who identify as Native or Indigenous, and people who identify as Asian or Southeast Asian. I also utilize the term BIPOC throughout this article. BIPOC is a newer term that re-centers the Black and Indigenous experience, an experience that is often erased or co-opted when using the blanket term Person of Color [10]. Ladson-Billings [7] specifically calls for researchers to shift from thinking in terms of academic achievement gaps towards discussions that detail the systemic elements that have accumulated into an educational debt owed to Communities of Color. Any discussion surrounding “gaps” in the academic achievement of BIPOC students must be placed within this sociohistorical context. The current study is an attempt to highlight how race and racism explicitly impede Black students’ progress in math [11,12,13,14]. It specifically highlights the pivotal role of a fourth year of secondary math in high school for Black students. The fourth year of secondary math is often an overlooked area in students’ course taking that allows students to be seen as much more competitive for admission to elite colleges and universities [15]. By utilizing the quantitative methods and findings from a broader mixed-methods research project, this paper applies Martin’s Multilevel Framework [16] to analyze how various factors influence Black students’ decisions to pursue or discontinue advanced math courses through their senior year of high school. Logistic regression models are employed to identify the key mechanisms that shape these course-taking patterns, focusing on the critical transition to the fourth year of secondary math. The following research question guides this quantitative study:
  • RQ: What informs Black students’ decision-making processes as they choose to take, or not take, a fourth year of math in high school?

Rationale—Math and the STEM Pipeline

Mathematics is fundamental to the STEM pathway—a crucial sequence for accessing advanced STEM careers and opportunities, influencing future academic success and career opportunities [17,18]. Duncan et al. [19] identify math knowledge as a critical predictor of academic achievement, highlighting its role in the P-20 STEM educational pathway. Furthermore, high math achievement is often correlated with greater income, career success, and higher well-being [20,21,22,23]. There is significant demand for math proficiency in the growing STEM job market [24,25]. The racial disparities and lack of ethnic and gender diversity within STEM careers are of particular concern to Black communities due to the economic benefits associated with STEM careers [24,25,26]. These disparities highlight the need for high-quality math education from kindergarten through high school to better prepare students for higher education and beyond [18,27,28,29,30]. However, enrollment in advanced secondary math courses (beyond Algebra II or Integrated Math 3) remains disproportionately low for Black students [31,32]. These courses are crucial as they prepare students for college and positively impact their long-term educational outcomes [33,34,35,36,37].
Studies show that additional secondary math credits increase baccalaureate completion rates and reduce the need for remedial college math [38,39,40,41]. For example, California high schools require three years of math for graduation, but four years of math significantly boosts post-secondary success [42,43]. Advanced math courses, particularly beyond Algebra II or Integrated Math 3 (IM3), increase the likelihood of completing a bachelor’s degree and raise student interest in STEM careers [33,44,45]. Moreover, secondary math education, especially continuous, advanced coursework, is linked to higher income and job satisfaction, with Levine and Zimmerman [20] and Rose and Betts [23] noting substantial economic benefits from taking more advanced math classes.
The literature also indicates that eighth-grade math is a critical turning point in many students’ mathematical futures [38,41,46,47,48,49]. Specifically, Algebra I serves as a pivotal “gatekeeper” course, essential for advancing in math education. However, despite 80% of students being eligible to take Algebra I in eighth grade, only a quarter do so, with even fewer Black students participating in the course [18,28,29]. The literature indicates that early exposure to rigorous math coursework is vital for college preparation and successful degree completion, with Gao and Johnson [46] highlighting the significant impacts of non-academic factors like school placement policies and course counseling on student enrollment patterns.
In summary, secondary math education not only prepares students academically but also plays a crucial role in shaping their career trajectories and socioeconomic outcomes. Furthermore, eighth grade math is of specific importance for student trajectories in higher-level math courses Beyond IM3. I define a course as “Beyond IM3” if the prerequisite for enrollment in the course is Integrated Math III (IM3) or Algebra 2. These courses include pre-calculus, statistics, calculus, and several other courses as described by the math course sequence guidelines from the district. See Table 1 for a full list of the courses included in this classification.
The next section will discuss the theoretical framework guiding this study and explore factors influencing Black students’ math socialization and course-taking patterns.

2. Theoretical Framework

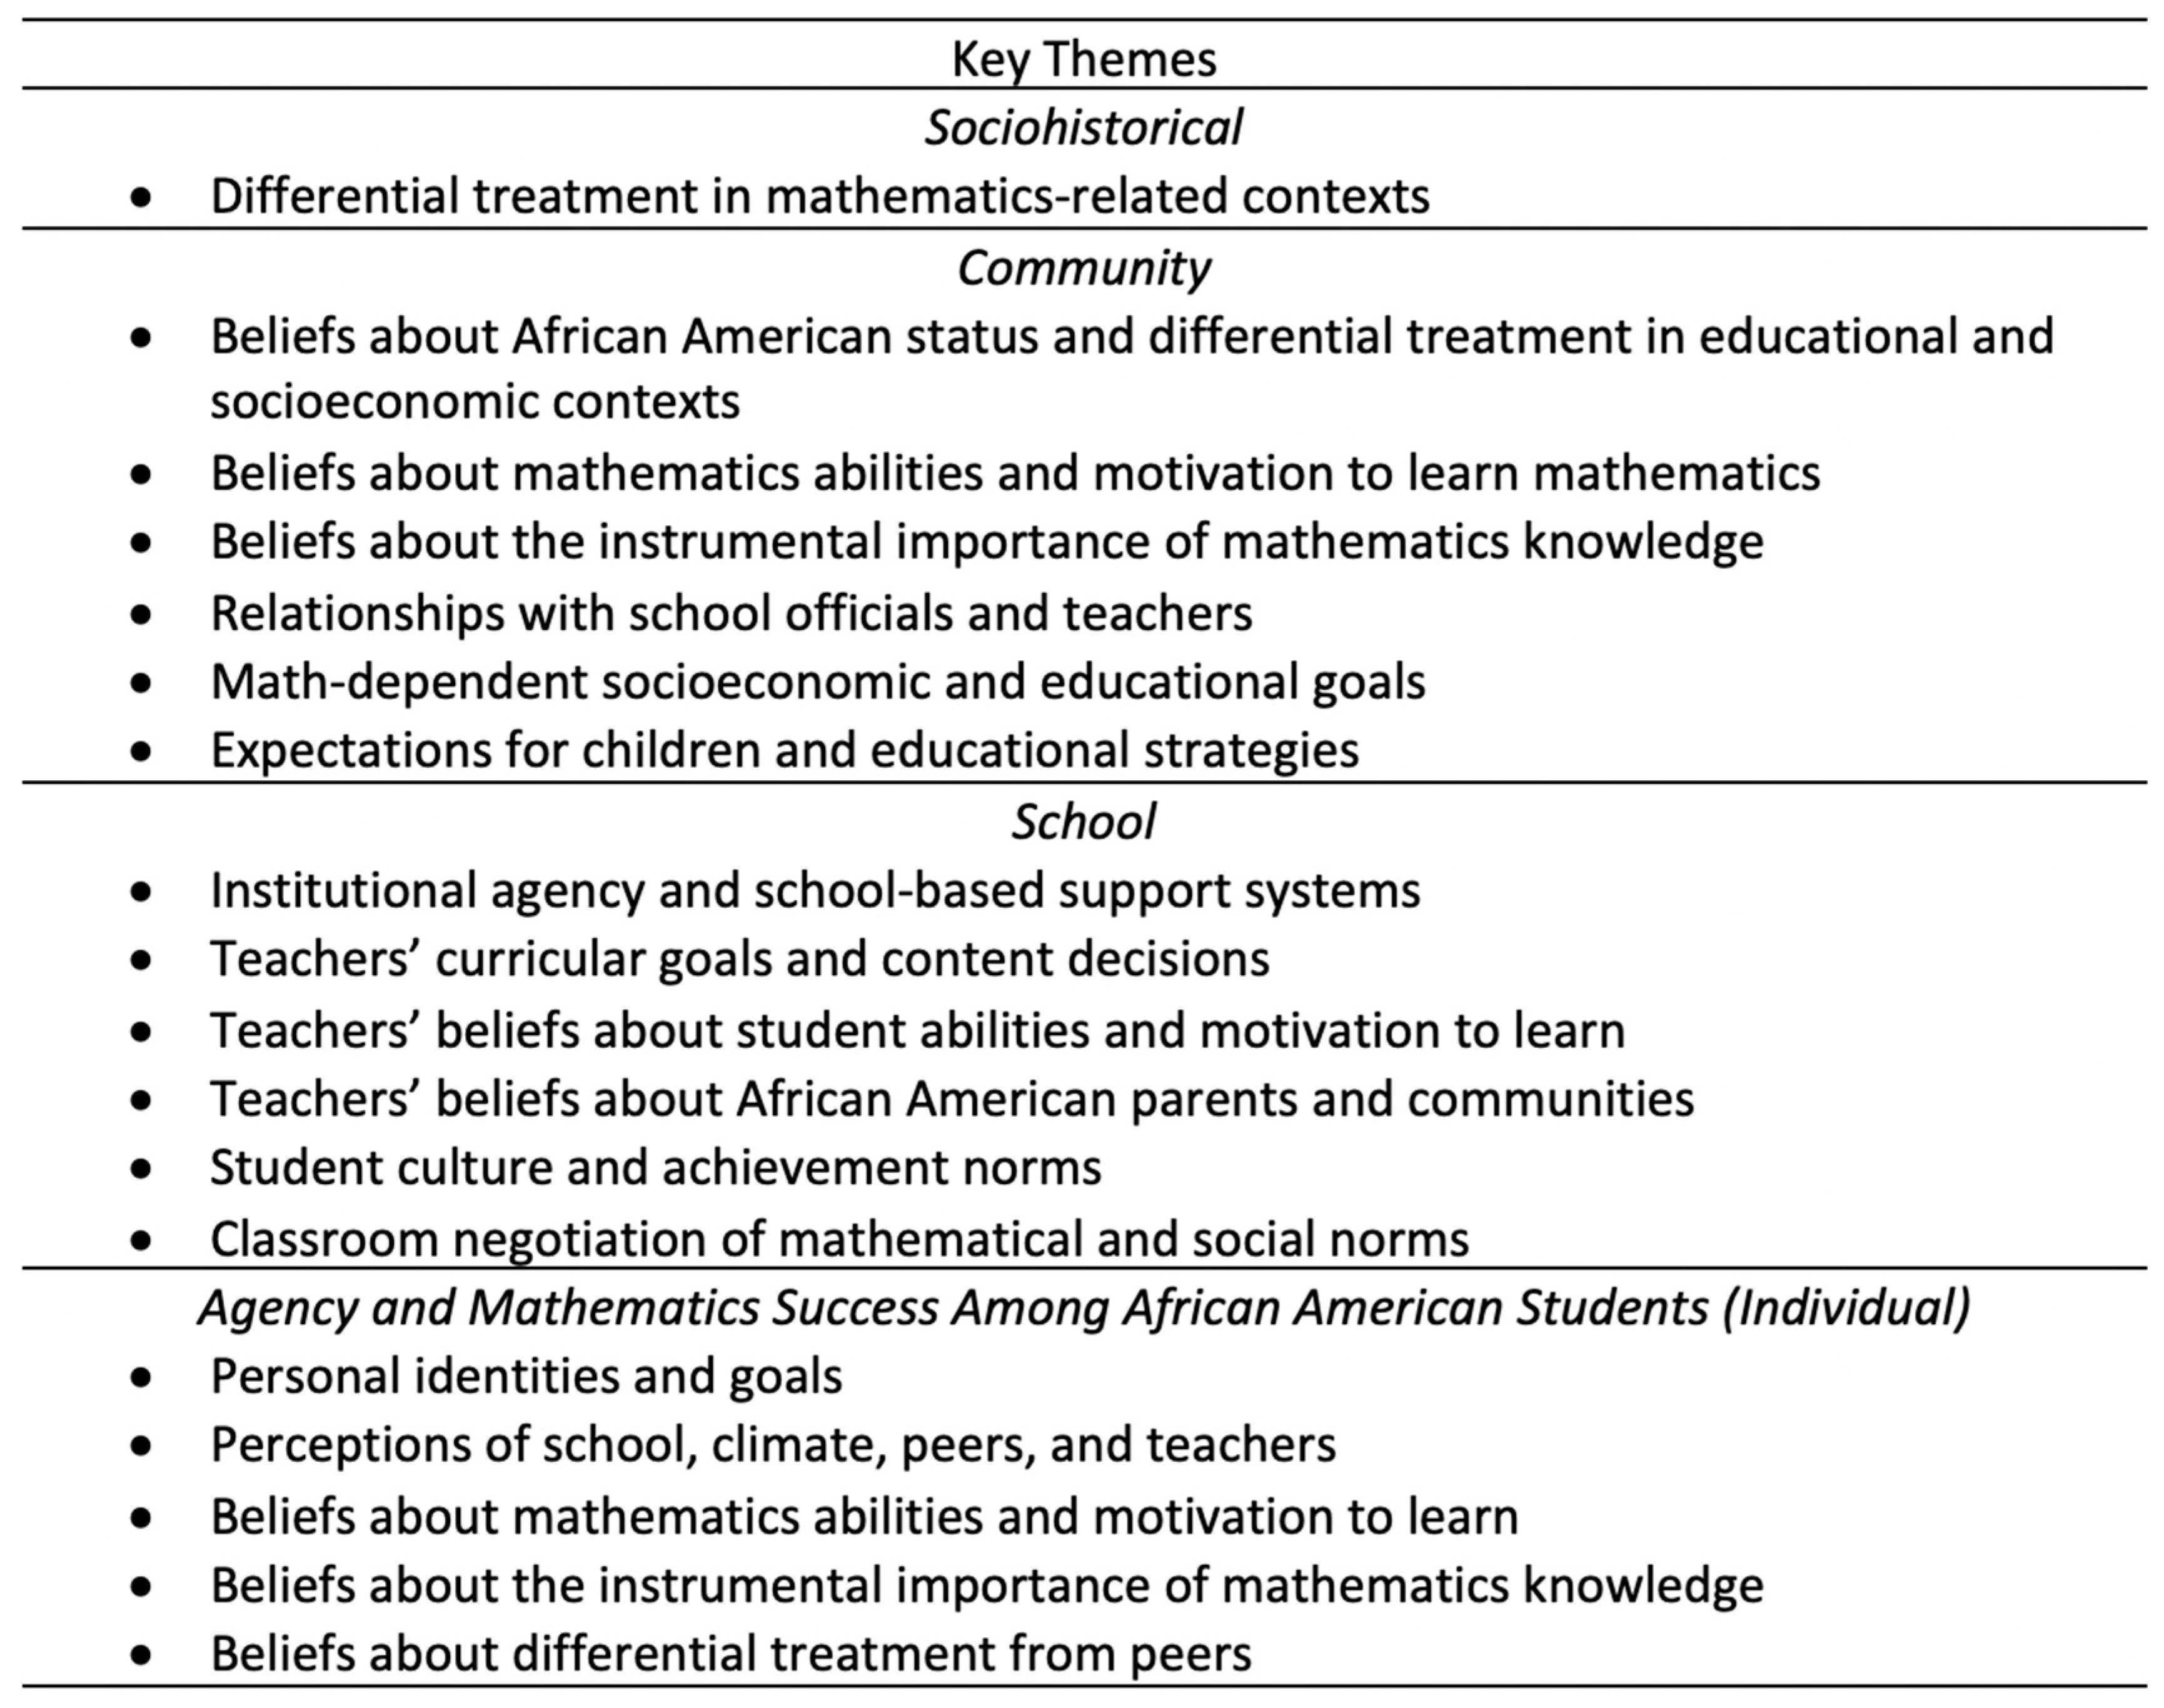
2.1. Multilevel Framework for Analyzing Mathematics Socialization and Identity among African Americans

This study utilizes Martin’s Multilevel Framework for Analyzing Mathematics Socialization and Identity Among African Americans, as depicted in Figure 1 [16]. Martin [16] charges that the mathematics identities and socialization of Black students are affected by the sociohistorical, community, school, and individual factors that work together to shape Black students’ math achievement outcomes, math course-taking patterns, and ultimately, their dispositions towards math. Martin [16] defines the term mathematics socialization as the “experiences that individuals and groups have within a variety of contexts such as school, family, peer groups, and the workplace that legitimize or inhibit meaningful participation in mathematics” (p. 19). Mathematics identities refer to students’ “beliefs about (a) their ability to perform in mathematical contexts, (b) the instrumental importance of mathematical knowledge, (c) constraints and opportunities in mathematical contexts, and (d) the resulting motivations and strategies used to obtain mathematics knowledge” [16]. The mathematics socialization and mathematical identities of Black students are often disrupted at an early age due to multiple factors, as described by Martin’s Multilevel Framework for Analyzing Mathematics Socialization and Identity Among African Americans [16].
The underlying premise of this study is that race and racism are embedded inside and outside of the mathematics classroom. The purpose of this study is to determine how these sociohistorical, school, community, and individual factors inform Black student enrollment in Beyond IM3 coursework. Ultimately, as this paper will show, Black students’ math course-taking decisions are disrupted by a multitude of factors. Martin [16] emphasizes the sociohistorical, community, school, and intrapersonal themes that impact Black students’ mathematics socialization, dispositions towards math, and their mathematics identities. Each level of Martin’s framework overlaps with the next to interrupt the mathematical socialization and mathematical identity development of Black students. Whether it be at the school level, through the lack of culturally relevant curriculum and instruction or the racialized nature of course placement and advising, or at the community or sociohistorical levels, Black students’ mathematical lives are inherently impacted by the processes of racialization and the perpetuation of racial inequities [40,50,51].
Martin’s Multilevel Framework for Analyzing Mathematics Socialization and Identity Among African Americans situates students’ “mathematics achievement and persistence outcomes in broader sociohistorical, cultural and community contexts” [16]. This framework is a valuable tool for investigating the factors that influence Black students’ mathematics identities, mathematics socialization, and ultimately, their math course-taking patterns. Martin’s Multilevel Framework for Analyzing Mathematics Socialization and Identity Among African Americans was chosen for this study because it allows for an analysis that centers race and racism as components that influence Black students’ math trajectories while taking into consideration the multilevel factors that impact the formulation of students’ math identities. Central to Martin’s framework is the belief that Black students experience the math classroom in radically different ways than their peers, and these experiences ultimately play a role in how Black students see themselves in math-related contexts. In the paragraphs that follow, I will explain each component of the framework in detail to demonstrate the importance of this framework and how it was utilized in this study.

2.2. Sociohistorical Factors

The first level of Martin’s Multilevel Framework for Analyzing Mathematics Socialization and Identity Among African Americans (henceforth abbreviated as the FAMSI) is the sociohistorical level. Martin [16] defines the sociohistorical context within the FAMSI as the “historically based discriminatory policies and practices that have prevented African Americans from becoming equal participants in mathematics and other areas of society” (p. 29). This level highlights African Americans’ problematic history in the U.S. and the social and historical mechanisms that have served as barriers to their socioeconomic and educational advancement. The sociohistorical level emphasizes the ways in which structural and institutional factors have disrupted the math pathways of Black students and influenced their differential treatment in mathematics-related contexts.
Institutional and structural factors like state and local laws operate unjustly and under a sociohistorical context. False narratives of equal opportunity, race neutrality, meritocracy, objectivity, and colorblindness are the sociohistorical tools that have developed into the structural and institutional barriers that inhibit academic and economic growth for BIPOC communities [52,53,54,55,56]. This study further explores and challenges how these institutional and structural factors influence Black students’ relationships with math and acts as the symptoms of larger sociohistorical elements. Specifically, the findings in this study speak to the role of academic tracking as an additional sociohistorical tool that continues to inhibit Black students’ access to higher-level STEM coursework. Academic tracking limits the math trajectories of Black students because their later high school choices, for example, Beyond IM3 coursework, are limited due to their previous math placements in elementary and middle school [32,57]. Moreover, the practice of academic tracking reiterates the racial hierarchy of mathematical ability [13] because the students more likely to be enrolled in higher level coursework are often white or Asian [32,57,58]. For students enrolled in the lower academic tracks, tracking impedes academic progress, fosters low self-esteem, and encourages disengagement from school [16,59,60].
As it relates to K12 education, the sociohistorical level includes structural factors, such as the laws and policies at the federal, state, and district levels that impact school level processes, programs, and resources. These factors include statewide high school graduation requirements that contribute to the perpetuation of structural racism through institutional factors, such as available courses and quality teachers and counselors. As it stands, the high school graduation requirement of two to three years of math coursework for California, and most other states, is an example of a structural factor that discourages Black students’ enrollment into Beyond IM3 coursework. Graduation requirements are varied across states, with only about one quarter of states requiring four years of math to graduate from high school [61,62] (See Table 2).
In California and other states with lower requirements, the math pathway is considered controversial given the number of required years of math and the current lack of cultural relevance in the current curriculum [63,64]. Even though the California high school graduation requirements are in alignment with the UC/CSU admissions standards, the competitive nature of college admissions indicates that a student should have enrolled in at least four years of secondary math coursework to be a competitive applicant into most colleges and universities [15,65]. Research also indicates that students are more likely to have future success in postsecondary education if enrolled in four (or more) years of secondary math before graduation from high school [27,42,43].

2.3. Community Level Factors

The second level of the FAMSI is related to challenges and systems of support in geographical and socially constructed communities. According to Martin [16], community forces include the individual and collective life histories, experiences, beliefs, and attitudes of Black parents and community members about mathematics. Martin situates the community within the context of the sociohistorical level by defining community in terms of the shared, collective experiences of African American parents and Black people within larger sociohistorical and educational contexts. Specifically, Martin focuses on how parents think about the sociohistorical differential treatment of Black people in math-related contexts. The community level centers parents and their beliefs about math abilities, the importance of math, and their expectations for their students in math-related contexts. Parents play a major role at the community level, and many scholars have shown that parental influence is a major factor in academic achievement for all students, but especially for Black students [66,67]. Martin’s conceptualization of community forces helps to “explain how [Black parents’] deep, psychological orientations toward education can develop as a result of experiences in societal and socioeconomic contexts… [which] in turn can shape [Black students’] behaviors in school contexts” [16], (p. 23). Martin [16] suggests that these external realities and narratives that Black students face within their schools, communities, and society writ large may shape Black students’ inclinations towards math and could quite possibly impact whether or not they decide to enroll in Beyond IM3 coursework.

2.4. School-Level Factors

The third level of the FAMSI involves school-level factors that contribute to or prohibit Black students’ success along K-12 math pathways. Institutional factors are school-level factors, also known as school-based support systems, that influence the academic trajectories of Black students. These factors occur within the institution itself. An example of an institutional factor that may inhibit Black students’ enrollment into Beyond IM3 coursework are the course placement policies and practices at each school. For some Black students, math placement is easy and seamless when teachers, counselors, and school systems help facilitate the process. For others, institutional factors such as high student-to-counselor ratios make the process difficult. The school level also connects to the demographic composition of the school and its teachers, which has been shown to impact course enrollment. Specifically, Kelly [68] found a connection between school racial composition and math course-taking differences between Black and white students. One of the regression models specifically compared Black students in predominantly Black schools to Black students in non-Black and integrated school settings. An important finding was that Black students were more likely to be enrolled in upper-level math courses in predominantly Black schools. Meanwhile, Black students were most likely to be placed into lower-level math classes in predominantly white school settings. According to Kelly [68], the course-taking disadvantage for Black students “gradually disappears as the school becomes more integrated and eventually predominantly Black” (p. 58). Diette [69] saw similar results, finding that the likelihood of a Black student being enrolled in Algebra 1 decreased as the number of white students enrolled at a school increased. Specifically, Diette [69] found that the likelihood that a Black student enrolled in Algebra 1 in the eighth grade was significantly lower in a more integrated school than in a more segregated school. These findings offer a unique take on academic tracking, math placement, and the racial composition of schools. The school level of Martin’s framework also situates teachers as a major factor in the identity development and math socialization of Black students. The school level of the FAMSI is of particular importance because implicit and explicit biases in teachers’ placements of Black students into rigorous math and science coursework, especially in and around middle school, can severely limit students’ math trajectories [28,29,70,71] and interest in STEM careers [72,73,74,75].

2.5. Individual Factors

The fourth and final level of the FAMSI highlights individual factors that contribute to Black students’ success in math despite the contextual factors that impede their academic progress. This level includes students’ identities and goals, their perceptions of the school climate, their peers, and their teachers, their beliefs about their mathematical abilities, and their opinions about the importance of mathematics knowledge [16]. This level of the framework is a necessary addition that shifts the narrative from what has not worked for Black students in math towards a discussion of the agency of students who have successfully traversed the mathematics academic pathway. Many scholars have noted the incredible persistence of Black students in STEM [14,55,76,77,78,79,80].
Gender and Intersectionality. Intersectionality [81] can be defined as the ways in which various components of one’s being interact with institutional, structural, and representational factors to shape the individual experience, typically with increased persecution and discrimination based upon multiple levels of marginalization. The extent to which individuals’ identities interact with systems of power or privilege, given their context, informs their experiences and access to opportunity. For example, in the STEM context, Women of Color continue to be highly underrepresented in STEM careers, even more so than Men of Color [26]. According to an analysis of longitudinal student data by Saw et al. [82], girls from all racial/ethnic and SES groups consistently had significantly lower persistence rates in math and science coursework and lower rates of interest in STEM careers.
STEM spaces are often hostile and uninviting for Black students, particularly girls [83,84]. In STEM classrooms, Black girls are often rendered as invisible as dually marginalized women in the STEM field [85,86,87,88]. In addition to being underrepresented due to their gender, Black girls must also contend with the anti-Black nature of STEM, often being tracked out of upper-level STEM coursework [89], experiencing under-identification in gifted education [90,91], attending underfunded schools with inequitable access to rigorous upper-level STEM coursework [90,92], experiencing anti-Blackness in STEM classrooms [77,89,93], and experiencing exclusionary discipline in schools [94,95,96]. Black boys face similar patterns of anti-Blackness and experience the math classroom in racialized and gendered ways as well [11,97]. This study’s findings speak to the nuanced nature of intersectionality as it pertains to Black students in STEM. The concept of intersectionality compels educators to contend with the marginalization in STEM based on gender and racial–ethnic identities and the types of struggles that Black girls and boys face throughout the STEM pipeline because of their intersectional identities [83,98].
Taken together, the literature illuminates the ways in which structural, institutional, sociohistorical, school, community, and individual factors work in tandem to shape the math outcomes of Black students. However, there appears to be limited studies in the literature that recognize the interrelationship among these factors. By infusing the FAMSI into my methodology, I hope to address these gaps.

3. Methods

This study investigates what informs Black students’ enrollment in “Beyond IM3” math coursework before graduating from high school. As mentioned earlier, I define a course as “Beyond IM3” if the prerequisite for enrollment in the course was Integrated Math III (IM3) or Algebra 2 (see Table 1).

Positionality Statement

My interest in increasing Black student representation in STEM emerged from my role as a middle school STEM teacher for six years. I witnessed, first-hand, the disproportionate placement of Black students into remedial STEM coursework in middle school. Those experiences illuminated the impacts of teacher bias on student placement and the role that schools play in fostering Black students’ STEM interest, identities, and persistence. Yet, my lived experiences have not only been informed by barriers, but also by unique opportunities. As an African American from the Metro-Atlanta area, I was fortunate to have been raised around a critical mass of Black people at various levels of personal, academic, and financial success. These variations allowed me to see the Black community’s full spectrum of potential at an early age, which I believe was significant in my development into the person I am today. Through this intricate balance, I have often contemplated the factors that fostered my academic persistence through college yet stifled my development in STEM. My research focus on the educational trajectories of Black youth in STEM is a result of those reflections.

4. Setting and Context

The data for this study were gathered from a large school district in Southern California (I will refer to this location as “The District” for the remainder of this paper) that enrolls over 120,000 pre-K to 12th-grade students. According to The District’s website, “the student population is extremely diverse, representing more than 15 ethnic groups and more than 60 languages and dialects.” Despite this diversity within the student body, approximately 63% of teachers are white [99]. white students make up 25% of the total district population, Latinx students make up 51% of the total district population, and Asian/Pacific Islander students make up 15% of the total district population. The percentage of Black students is higher in The District (9%) than in the county (4%) and the state overall (5%), making it a good location for examining the impacts of race and racism on Black students’ secondary math course-taking patterns because of the relatively large numbers of Black students within The District. All high schools in The District provide students with similar math options and trajectories. As presented in Figure 1, students must enroll in Integrated Math I, II, and III prior to moving to Beyond IM3 coursework. Students who enroll in these courses earlier also have the option to take Beyond IM3 courses sooner.

5. Data Collection

Each component of this study aligns with one or more aspects of the FAMSI [16]. The variables within the student transcript data and publicly available datasets were created with each level of the FAMSI in mind. For example, variables related to gender, ELL status, homelessness, foster youth status, and acceleration in eighth-grade math were used to represent the individual level of the FAMSI. At the school level, I created variables related to student body demographics, overall student achievement, and teacher demographics and courses taught. At the community level, I used the Free and Reduced-Priced Meal (FRPM) variable as a proxy for socioeconomic status. At the sociohistorical level, to indicate a sociohistorical relationship, I looked at the overarching trends in the data during the analysis phase.

5.1. Data

Ultimately, this project sought to determine the variables that contributed to a greater likelihood that a Black student would enroll in a Beyond IM3 course by their senior year of high school. To accomplish this goal, I ran logistic regression analyses using STATA. The following research sub-questions were the primary focus of this study:
  • A:To what extent do institutional and structural factors influence the likelihood that a Black student will enroll in a Beyond IM3 math course by their senior year of high school?
  • B: How does the concentration of Black math teachers in a school impact the likelihood that a Black student will enroll in a Beyond IM3 math course by their senior year of high school?
I used a combined dataset of student transcript data and school-specific publicly available California Department of Education (CDE) data to highlight statistical patterns across school contexts. Essentially, each student in the student transcript dataset was linked to their school and its variables (student enrollment, number of teachers, demographics of teachers, etc.). I carried this out by merging the two distinct datasets for analysis (using the “merge” function in STATA) and connecting each student to the school they attended in their senior year of HS. This was carried out by adding the County–District–School (CDS) code for each high school in The District as an identifier variable in the student transcript dataset. I then used that number to link each student to a school and its publicly available data. According to the CDE, “this 14-digit [CDS] code is the official, unique identification of a school within California. The first two digits identify the county, the next five digits identify the school district, and the last seven digits identify the school.” The two original datasets and their components are described in detail below.
Student Transcript Data. The transcript data utilized for this project include the math transcript data from 1561 Black seniors in The District between 2017 and 2020. This dataset includes the math transcripts for the students from their 6th-grade year (if available) until their senior year of high school. The student transcript dataset also provides contextual information about each student, such as their demographics, course enrollment, and math achievement.
Publicly Available School-Specific Dataset. In addition to the student transcript data, I compiled a second dataset consisting of publicly available CDE data from the 2017–2018 academic school year. The dataset includes student enrollment, teacher demographics, adjusted cohort graduation rates, and an indicator of overall socioeconomic status for each of the 30 secondary schools that also appeared in the student transcript dataset. The components of this dataset represent one or more aspect(s) from Martin’s [16] FAMSI and provide useful multilevel contextual information about each school. Specifically, this dataset includes information about teacher demographics and experience, student body demographics, and the socioeconomic status of each school in The District.

5.2. Variables

Dependent Variable—Beyond IM3. The long-term gains attributed to taking four years of math (including a Beyond IM3 course) in high school are too explicit to ignore. As mentioned in the literature review, enrolling in a secondary Beyond IM3 course has been linked to overall student success at the undergraduate level, including decreasing students’ time to degree completion [33,34,36,38]. Therefore, my focal dependent variable is a binary variable created to indicate whether a student took a Beyond IM3 course by the time they completed high school.
Independent Variables—Individual Student-Level Categorical Variables. From the student transcript dataset, the first set of variables were binary categorical variables connected to individual student-level demographics or achievement characteristics. Dummy variables were created for each of these variables (0 = no; 1 = yes). Table 3 displays descriptive statistics for my individual-level categorical variables.
Gender. The Gender variable was a binary variable indicating the gender of each student, as specified by their school transcript. The transcript data define gender as male and female, so this study used aligned descriptors. Students categorized as female on their school record were coded as 1 on the dummy variable named “Female.” Otherwise, the dummy variable was set to 0 to indicate male. Gender is a relevant variable due to the interesting statistics at the intersection of race and gender in the STEM pathway and within STEM careers. Specifically, in comparison to Black males, Black women tend to excel in academic settings despite the anti-Black nature of education spaces [89,100]. However, in STEM spaces, high-achieving Black boys are more likely to be guided towards and to choose a STEM major or STEM career [4,26] compared to Black girls who are less represented in the STEM field due to gender bias and exclusion [4,26,55,90]. Thus, the intersectional nature of race, gender, and STEM provided nuanced implications for this study.
English Language Learner Status. The English Language Learner (ELL)/Multilingual Student variable began as a categorical variable with six categories: English Only, English Learner, Initially Fluent English Proficient (I-FEP), Redesignated Fluent English Proficient, To Be Determined, and Not Assessed/Special Education. Students who were classified as “English Only” on their student transcript were coded as a 0 on a dummy variable named “English Language Learner/Multilingual Student.” Otherwise, the dummy variable was set to 1. This variable was important given the large ELL/Multilingual student population in Sunset HS as well as in the California context overall. This variable was also relevant given the intersection of race and ELL status. To be classified as a Black multilingual student means there is a possibility this student comes from an immigrant background or identifies as multi-racial. Therefore, ELL status is a way to potentially differentiate between African American students who have historical and familial ties to the Transatlantic Slave Trade in the U.S. context and those who do not and are recent immigrants to the U.S. The distinction between monolingual and multilingual Black students is important to parse out, especially given recent scholarship that indicates that Black students from immigrant backgrounds are faring better in the STEM pipeline than African American students [101,102,103,104,105].
Student Experiencing Homelessness. The Student Experiencing Homelessness variable was a binary variable that indicated whether a student was experiencing homelessness in their senior year of high school. Students whose transcript indicated they were experiencing homelessness during their senior year of high school were coded as 1 on a dummy variable named “Student Experiencing Homelessness.” Otherwise, the dummy variable was set to 0. The Experiencing Homelessness variable was important to this analysis because of the large number of students experiencing homelessness at Sunset HS as well as the overwhelmingly large population of adults experiencing homelessness within the larger California context. This variable was also important given the recent scholarship related to homelessness and student academic outcomes [106,107,108,109,110,111]. Finally, since homelessness is often connected to poverty, this variable provided an additional socioeconomic context for students in this study who were experiencing homelessness. By using this variable, I hoped to highlight the ways that sociohistorical elements such as poverty and homelessness impact Black students’ math trajectories and Beyond IM3 course taking.
Foster Youth. The Foster Youth variable was a binary variable that indicates whether a student was living in a foster home in their senior year of high school. Students whose transcripts identified them as foster youths during their senior year of high school were coded as 1 on the dummy variable named “Foster Youth.” Otherwise, the dummy variable was set to 0. This variable was included because it speaks to the unique experiences that some students may bring to their schools. This variable was included in the quantitative data request from The District and provided unique familial and community-level context for the students included in the sample. Research indicates that students in foster care are often disadvantaged in academic settings, specifically in California [112,113]. By using this variable, I intended to explore the impact of foster care on Beyond IM3 course taking.
Student Took an Accelerated Math Course in 8th Grade. The Student Took an Accelerated Math Course in 8th Grade variable began as a categorical variable with several math course options for eighth grade math, including Algebra I, Geometry, Integrated Math I, Integrated Math II, Math 8, Math 7, Algebra Readiness, or Step-Up Math 8. Students who took any class considered above grade level, or “accelerated”, were coded as 1 on a dummy variable named “Accelerated Math Course in 8th Grade.” Otherwise, the dummy variable was set to 0. Algebra I, Geometry, Integrated Math I, and Integrated Math II are considered “accelerated” math courses. Acceleration in math is an interesting concept with mixed results, but overall, studies have shown that middle school acceleration increases the likelihood of a student enrolling in upper-level Beyond IM3 courses before graduating from high school [40,114,115,116,117,118]. Walston and McCarroll [119] found that Black students who took accelerated Algebra in the eighth grade fared better in math overall, enjoyed math more, and held higher academic expectations of themselves. Therefore, this variable was an important addition to my model.
Student Earned an “A” in an Accelerated Math Course in 8th Grade. Similarly, the Student Earned an “A” in an Accelerated Math Course in 8th Grade variable was coded to represent any student whose transcript indicated that they had both taken an accelerated math course in 8th grade (as defined above) and earned an “A” in that course. Students who met these qualifications were coded as 1 on the dummy variable named “Earned an ‘A’ in an Accelerated Math Course in 8th Grade.” Otherwise, the dummy variable was set to 0. As the literature details, performing well in eighth grade has implications for future math success [39,48,114,120,121,122,123,124]. In addition, studies have shown that students who performed well in middle school math were more likely to enroll in upper-level math coursework in high school [40,119]. Therefore, this variable was an important addition to my model.
Independent Variables—School-Level Continuous Variables. The school-level variables in my analysis were created by pulling school-specific publicly available data from the CDE website and merging the school-level data to the individual student transcript dataset. See Table 4 for descriptive statistics of all school-level continuous variables. Please note that the data in Table 4 were reported at the student level. If we use the Total Student Enrollment variable as an example, a mean of 1437.46 means that the average Black student in the sample went to a school with about 1437 total students enrolled.
Student Enrollment. The first of these variables represents the total enrollment for all students regardless of race/ethnicity or gender at the high school attended by the reference student. This variable originated from the California Department of Education (CDE). The second of these variables represents only the total number of Black students at each school. The student enrollment variable was important to include given the scholarship that indicates that Black students who attend schools with a critical mass of same-race peers develop an increased sense of belonging [125,126], which contributes to better academic achievement outcomes [127,128,129,130,131,132]. Research also indicates negative relationships between academic achievement and attending larger schools [133,134] and with larger class sizes [134]. Moreover, scholars have noted differences in course placement patterns based on the racial composition of a school, indicating a positive relationship between Black student enrollment and placement into upper-level math coursework [68,69]. This student enrollment variable thus serves as a means for measuring the impact of attending a school with large enrollment and the impact of attending a school with a critical mass of Black students on the Beyond IM3 course-taking patterns of Black students.
Number of Students Receiving Free and/or Reduced-Price Meals. The data for this variable were compiled using a dataset from the CDE that provided the unduplicated counts and percentages of students at each school who were eligible to receive Free or Reduced-Price Meals (FRPMs) under the National School Lunch Program (NSLP). This variable acted as a community-level variable to provide pertinent socioeconomic context for each school. Scholarship has showcased the academic impacts of attending poorly resourced, underfunded schools [135,136,137]. By using this variable, I hoped to highlight the ways that sociohistorical elements, such as poverty, limited school resources, and how funding might impact Black students’ math trajectories and Beyond IM3 course taking.
Overall Student Achievement. This set of variables included the number of students who dropped out and the number of students who met each school’s UC/CSU requirements. According to the CDE, the number of dropouts variable indicates the total number of cohort students who did not graduate with a regular high school diploma, did not complete high school, and were not still enrolled as a “fifth-year senior” by the end of the academic school year.
Meanwhile, according to the CDE, the number of students who met the UC/CSU requirements variable indicates the total number of cohort graduates who met all a-g requirements for admission into a University of California (UC) or California State University (CSU) school. This set of student achievement variables was important to this study because the two variables give pertinent school-level student achievement context for all students who attended a specific school. This context also provided a point of comparison between the individual students in the student transcript data and a more global school-specific context. This variable not only gave context about how the students are faring overall but also how well their school(s) were educating them. In addition, this set of variables speak to the community-level factors that may influence Black students’ persistence in math. Peers significantly impact academic achievement in classrooms [40,138,139,140]. For Black students, peers play a major role in their mathematics persistence and academic resilience, especially in upper-level math coursework [141,142,143,144]. This variable acts as a proxy for peer achievement to assess the relationship between peer achievement and Beyond IM3 course enrollment. In theory, this variable was meant to act as a proxy for investigating the academic culture of the school itself. Using the overall student achievement variable allowed for an analysis of how well the school was educating its pupils. If the school had a high number of dropouts and a low number of students who met the UC/CSU requirements, then it is possible that there were school-related factors that might have inhibited Black students’ Beyond IM3 course-taking patterns.
Teacher Demographics and Courses Taught. This set of variables was a combination of several de-identified datasets from the CDE. I combined the staff demographics (which included teacher gender, age, race/ethnicity, education level, and years of experience) with the staff credential dataset (which included the credential type and subject area for each teacher) and the staff assignment dataset (which included the assigned school(s) and course(s) taught for each teacher). Once combined, this dataset was reduced to only include secondary teachers in The District. This set of variables provided demographic information on the secondary teachers at each school during the 2017–2018 school year. This dataset specifically helped me identify the total number of teachers, male and female teachers, Black teachers, math teachers, and Black math teachers at each school—variables that are used in my logistic regression analysis. Each of these variables provided specific context about the demographics of the practitioners at each secondary school and the courses they taught. The number of Black teachers is especially pertinent given what we know about the impact of Black teachers on Black students’ academic trajectories [145,146,147]; this variable was included to provide further quantitative proof of Black teachers’ impact on Black students’ math course-taking patterns.
Average Teacher Age and Years of Teaching Experience. Using the aforementioned dataset, I calculated both the average age and the average years of teaching experience of the teachers at each school. The average teacher age variable represented the mean age of the teachers at the school attended by the reference student. Similarly, the average years of teaching experience variable indicated the mean number of years the teachers at the school have been teaching in the district. These variables were crucial because research has shown that less teaching experience is often correlated with teacher ineffectiveness [148].
Independent Variables—Control Variables. The two control variables for my analysis were dummy variables that differentiate between each of the three graduating classes included in this study. For example, the class of 2018 was represented in the 2017–2018 student transcript dataset, the class of 2019 was represented in the 2018–2019 student transcript dataset, and the class of 2020 was represented in the 2019–2020 student transcript dataset. The final student-level dataset (n = 1561) was a combination of the transcripts from each of the three graduating classes. The 2017–2018 school year was intentionally left out to create a reference category to compare against, thus controlling for “time” in the regression analysis. This was an important method to control for whether changes in student outcomes were due to the passage of time or other factors. By accounting for time, the analysis could more accurately isolate the effects of the variables of interest, ensuring that any observed differences in student performance were not merely artifacts of temporal trends but were instead attributable to the specific factors being studied.

6. Data Analysis

The data were analyzed using a theoretical lens that considered race and racism as central to the experiences of Black students in math classrooms. Using the FAMSI as a theoretical guide provided additional tools for unpacking the multilevel factors that allow for and prohibit Black students’ successful progression along the math pathway. The purpose of this study was to explore the multilevel factors that increase or decrease the odds that a Black student in The District would take a Beyond IM3 course before graduation. Therefore, I built a logistic regression model that included school and individual student-level variables to determine the odds that a student would have taken a Beyond IM3 course by the end of high school. Logistic regression was appropriate for this study because the dependent variable for this study was a binary variable that indicated whether a student took a Beyond IM3 course by the time they completed high school.
In the logistic regression models presented in the next section, standard errors are cluster robust, where unique clusters were defined as the school attended by the student. In other words, two individuals are considered members of the same cluster if and only if they each attended the same school, and therefore, there may be a cross-observation correlation in the error term. This method acknowledges that the students in my dataset do not represent independent observations, and that students in the same school might influence one another.

7. Results

The Multilevel Factors That Increase the Odds of Black Student Enrollment in Beyond IM3 Coursework

Each logistic regression model described in the sections below was derived by combining variables that mirrored components of the FAMSI. Model 1 and Model 2 include variables related to individual student demographic and achievement variables. Model 3 and Model 4 include school-level and teacher demographic variables. Model 5 includes all variables, which allowed me to compare the statistical significance between and across all models.
  • Model 1—Logistic Regression Analysis of Individual-Level Demographic Characteristics
The results of the logistic regression analysis for individual student-level demographic characteristics are presented in Model 1 in Table 5. For each model in Table 5, the results are measured in terms of the odds ratio of the event occurring, contingent on a variety of factors. Coefficients with values greater than one indicate that the given factor increases the odds of a student taking a Beyond IM3 course; coefficients less than one indicate that the given factor decreases the odds of a student taking a Beyond IM3 course.
Of the four non-control variables used within this first model, all four of them had a statistically significant relationship to the Beyond IM3 dependent variable. Gender was the first variable used in this model by way of the Female dummy variable. The coefficient for this variable was 1.670, which indicated that Black female students were significantly more likely to have taken a Beyond IM3 course at some point in high school compared to Black male students (p < 0.001). Moreover, the coefficient of 1.670 tells us that the odds of a Black female student taking a Beyond IM3 course in high school are 67% higher than the odds of a Black male student taking a Beyond IM3 course in high school. The ELL status of a student was another variable that contributed to the likelihood that a student would take a Beyond IM3 course in high school. Black students who were classified as an English Language Learner/Multilingual Student were more likely than Non-ELL/Monolingual Black students to take a Beyond IM3 course in high school. The coefficient of 1.879 suggests that this factor was slightly more impactful than gender on math course taking. The odds of a Black ELL/Multilingual student taking a Beyond IM3 course were 87.9% higher than the odds of a Black Non-ELL/Monolingual student taking a Beyond IM3 course (p < 0.001). Homelessness also impacted the odds of a Black student enrolling in a Beyond IM3 course in high school. For students who were classified as experiencing homelessness on their transcript, the odds of taking a Beyond IM3 course were significantly lower than those for students who were classified as not experiencing homelessness on their high school transcript (p < 0.001). The coefficient of 0.388 suggests that homelessness had a negative effect on math course taking. Essentially, for Black students experiencing homelessness, the odds of taking a Beyond IM3 course decreased by 61.2%. Similarly, for students who were classified as foster youth, the coefficient of 0.174 indicates a statistically significant negative relationship between being a Black foster youth and taking a Beyond IM3 course in high school (p < 0.001). Specifically, the odds that a Black student who was classified as a foster youth would take a Beyond IM3 course was 82.6% less than a Black student who was not a foster youth.
  • Model 2—Logistic Regression Analysis of Individual-Level Middle School Achievement
The results of the logistic regression analysis for individual student-level middle school achievement are presented in Model 2 in Table 5. Both variables included in this model were statistically significant (p < 0.001) and unusually large in magnitude, suggesting that middle school math achievement is an especially important predictor of students’ subsequent likelihood of taking a Beyond IM3 course in high school. The first variable highlighted the type of math taken by an individual student in eighth grade. Black students who took an “accelerated” math course in eighth grade were more likely to enroll in a Beyond IM3 math course by the end of high school, as indicated by a coefficient of 2.892. This means that the odds that a Black student took a Beyond IM3 course in high school increased by 189.2% if they took an accelerated math course in eighth grade. This means that the odds of taking a Beyond IM3 course almost doubled if a student took an accelerated math course in the eighth grade. As mentioned earlier, for the purposes of this study, an accelerated math course is a course that would be considered of a higher rigor than eighth-grade math and/or required eighth grade math as a prerequisite. Moreover, Black students who earned an “A” in their accelerated eighth-grade math courses were even more likely to take a Beyond IM3 course in high school. The coefficient of 6.108 indicates the odds of a student taking a Beyond IM3 course increases by an additional 510.8% if they took an accelerated math course in eighth grade and received an A in the course. This means that the odds of taking a Beyond IM3 course was five times as likely if a student took an accelerated math course in the eighth grade and received an A in the course.
  • Model 3—Logistic Regression Analysis of School-Level Student Body Characteristics
The results of the logistic regression analysis for school-level student body characteristics are presented in Model 3 in Table 5. Student enrollment was statistically significant with a coefficient of 0.997 (p < 0.001). The coefficient of 0.997 indicates a negative relationship between the number of students enrolled in a school and the odds that a Black student would take a Beyond IM3 course in high school. Schools with larger overall enrollment typically had lower Black student enrollment in “Beyond IM3” courses. Alternatively, Black student enrollment was statistically significant (p < 0.001) with a coefficient above one (1.004). This coefficient indicates a positive relationship between Black student enrollment and the odds that a Black student enrolled in a Beyond IM3 course in high school. This data point suggests that for students who attended a school with a relatively high number of Black students enrolled—controlling for the overall enrollment of that school—the odds that they were enrolled in a Beyond IM3 course in high school increased. Interestingly, the number of students receiving Free and/or Reduced-Price Meals (FRPMs) had a slightly positive impact on the odds that a student would take a Beyond IM3 course. For this variable, the coefficient was 1.002 and was statistically significant (p < 0.001). In this model, the number of student dropouts and the number of students who met UC and/or CSU standards acted as expected in relation to the Beyond IM3 dependent variable and were also both statistically significant (p < 0.001). A coefficient of 0.946 means that Black students who attended a school with a relatively high number of student dropouts were less likely to have enrolled in a Beyond IM3 course in high school. Meanwhile, Black students who attended a school with a relatively high number of students who met the UC/CSU a-g requirements were more likely to have enrolled in a Beyond IM3 math course in high school.
  • Model 4—Logistic Regression Analysis of School-Level Teacher Characteristics
Of the seven independent variables included in this model, only one of them, the average years of teaching experience, was statistically significant. The coefficient of 0.771 for the average years of teaching experience of the teachers at a given school indicates lower odds of students having enrolled in Beyond IM3 courses compared to if teachers have more years of teaching experience on average. This result indicates a possible connection to the amount of classroom experience of the teachers in a school and the math trajectories of their Black students. In other words, the more years of experience teachers had at a school on average, the less likely students were to take a Beyond IM3 course. This finding is in contradiction to much of the literature about the importance of teaching experience and student achievement [148]. In addition, because I controlled for average teacher age in this model, I was able to showcase that this finding is not merely related to teacher age, but this finding specifically centers years of teaching experience as significant for Black students’ Beyond IM3 course taking.
  • Model 5—Logistic Regression Analysis of School-Level and Individual Student-Level Characteristics
The full model held similar findings as many of the previously discussed findings, meaning that the results of the other models were robust, and not simply artifacts of other variables that were omitted. Basically, the results of each model were independent of one another. In this model (unlike in Model 4), the number of male teachers was statistically significant at the 0.05 level. The coefficient of 1.05 indicates that having more male teachers in a school played a role in increasing the odds of Black student enrollment in Beyond IM3 courses. Additionally, there were two variables that were no longer statistically significant within this final model once effects from all models were included. First, this model no longer indicated a statistically significant relationship between Beyond IM3 course taking and the number of students receiving FRPMs at a given school. Second, there was no longer a statistically significant relationship between the number of Black students enrolled in each school and the odds that a Black student would have enrolled in a Beyond IM3 course in high school.

8. Discussion

The analyses described above suggest that Black students’ Beyond IM3 course-taking patterns are impacted by a multitude of systemic factors. As informed by Martin’s FAMSI, analyses were conducted to consider how sociohistorical, community, school, and individual factors impacted Beyond IM3 course taking for Black students. The articulated results help to demonstrate that several factors, including enrollment in accelerated math courses in eighth grade, racial–ethnic and gender identities, ethno-racial context, and teacher characteristics, also held significance in the course-taking patterns of Black students. At the individual student level, every student characteristic variable and achievement variable included in the logistic regressions were statistically significant. While the relationships among variables may vary, they all matter for students’ experiences with math and their decisions to (dis)continue their Beyond IM3 math trajectories. Ultimately, the findings can be broken into two major categories: barriers to students taking Beyond IM3 courses and systems of support for students taking Beyond IM3 coursework.

8.1. Barriers to Students Taking Beyond IM3 Courses

Academic Tracking. The findings in this study point to academic tracking as a primary factor that negatively impacts Black students’ Beyond IM3 course taking. Academic tracking is sociohistorical in nature because it is not merely based on institutional placement policies, but also structural issues such as inequitable access to upper-level math coursework. Specifically, the findings showcase the importance of being enrolled in Algebra 1 or Integrated Math 1 by at least the eighth grade. The findings reinforce the literature that waiting until high school to take Algebra 1 is too late [32,57,114,122] because students who are enrolled in Algebra 1 by the eighth grade are more likely to enroll in Beyond IM3 coursework. The findings also indicate that some course sequences are more valuable than others and highlight eighth grade as a critical point at which many Black students are being funneled out of Beyond IM3 coursework. Due to the sequential nature of math as well as the structural and institutional barriers that inform math classrooms, Black students are often inhibited from reaching levels of Beyond IM3 math coursework [7,47,55,60,83]. In many cases, this prevents Black students from meeting college requirements, which can limit their access to certain higher education institutions. For those who are granted entry into college, many are forced to take remedial math coursework, which can negatively alter their time to degree completion and create additional financial barriers [36,38]. Thus, the findings from this study present many important points connecting Black students’ math trajectories and the institutional and structural barriers that block their math pathways.
Homelessness, Foster Youth Status, and Indicators of Poverty. The Students Experiencing Homelessness variable, the Foster Youth variable, and the Number of Students Receiving Free and Reduced-Priced Meals variable were all statistically significant in my logistic regression analyses. The inverse relationship between these variables and positive student outcomes shows that homelessness, foster youth status, and socioeconomic status negatively impact student achievement outcomes. Poverty is a component of the sociohistorical level and can be attributed to structural and systemically racist policies and practices, such as colonialism, slavery, redlining, and mass-incarceration, which have strategically disadvantaged descendants of enslaved people, further contributing to generational poverty within the Black community [7,149,150,151,152]. Poverty works at the sociohistorical level, and it underscores most inequitable school outcomes occurring at the structural and institutional levels. Schools in higher socioeconomic communities often have more resources, newer textbooks, better technology, more teachers, smaller class sizes, and more rigorous course offerings. Given the relationship between economic capital and quality schools in majority Black communities, the resounding education benefits for economically secure families and affluent communities contribute to resource gaps [7] and exacerbate racial inequities for historically marginalized groups, particularly those who are living in urban areas with high indicators of poverty [153]. In this study, I found that several indicators of poverty held statistically significant results related to Beyond IM3 course taking for Black students.
Homelessness. Homelessness is an ever-present and unfortunate condition for many families in the United States who struggle with poverty. Tragically, children comprise nearly one-fourth of the homeless population in the United States [154]. The Student Experiencing Homelessness variable was pertinent to this study specifically because of the overwhelmingly large population of people experiencing homelessness within the larger California context and urban areas such as the district where I collected the data. As mentioned in the findings, students who were classified as Black and experiencing homelessness on their high school transcripts had significantly lower odds of enrolling in a Beyond IM3 course. Thus, the results indicate that homelessness plays a factor in Beyond IM3 course taking for Black students. This finding tracks with recent scholarship related to the negative relationship between homelessness and student academic outcomes [106,107,108,109,110,111].
Foster Youth. For students who were classified as both Black and foster youth, there was a statistically significant negative relationship between being a Black foster youth and taking a Beyond IM3 course in high school (p < 0.001). This finding is echoed in research about students in foster care being disadvantaged in academic settings, specifically in California [112,113]. Whitman [155] states, “In 2013, there were an estimated 402,000 youth in foster care. Black/African Americans are overrepresented among the foster youth population. As of 2013, 24% of children in foster care were Black/African American, yet this racial/ethnic group only accounts for 13.3% of the U.S. population” [155] (p. 49).
The relationship between Black student outcomes and foster care helps to explain how structural, institutional, community, and individual factors like being raised in foster care, for example, can have a tangible impact on Black student achievement in math.
Free and Reduced-Priced Meals. Scholarship has showcased the academic impacts of attending poorly resourced, underfunded schools [135,136,137]. By using the students receiving Free and/or Reduced-Price Meals (FRPMs) variable, I hoped to highlight the ways that sociohistorical elements such as poverty might impact Black students’ math trajectories and Beyond IM3 course taking. However, in the realm of quantitative data, more nuanced data and tools of analysis beyond this study are needed to unpack the complex interactions between FRPM and Black students’ experiences. Interestingly, in Model 3, the number of students receiving Free and/or Reduced-Price Meals (FRPMs) had a slightly positive impact on the odds that a student would take a “Beyond IM3” course. In Model 5, the relationship between Beyond IM3 course taking and the number of students receiving FRPMs at a given school was no longer statistically significant. These findings speak to the need to incorporate additional variables for addressing the relationships between poverty and school-level factors in quantitative research. Taken together, however, the findings on homeless individuals, foster youths, and FRPMs indicate that poverty negatively impacts Black students’ Beyond IM3 course-taking patterns at statistically significant levels.
Student Enrollment. My logistic regression analyses indicated a negative relationship between the number of students enrolled in a school and the odds that a Black student would take a Beyond IM3 course in high school. In other words, schools with larger overall enrollment rates typically had lower Black student enrollment in Beyond IM3 courses. This finding tracks with research that also indicates negative relationships between academic achievement and attending larger schools [133] and having larger class sizes [134]. This finding may relate to the resource gap. The negative relationship between larger student enrollment rates and Beyond IM3 course taking possibly connects to limited resources and less counselors available to students who attend schools with large enrollment rates.
Black Student Enrollment. Alternatively, my logistic regression analyses indicated a complicated relationship between Black student enrollment and the Beyond IM3 course-taking patterns of Black students. In Model 3, Black student enrollment was statistically significant (p < 0.001) with a coefficient above one (1.004). This coefficient indicates a positive relationship between high numbers of Black student enrollment and the possibility that a Black student enrolled in a Beyond IM3 course in high school. However, in Model 5, there was no longer a statistically significant relationship between the number of Black students enrolled in each school and the possibility that a Black student would have enrolled in a Beyond IM3 course in high school. These findings complicate scholarship that indicates that Black students who attend schools with a critical mass of same-race peers develop an increased sense of belonging that contributes to better academic achievement outcomes [125,126,127,128,129,130,131,132]. Rather, these findings nod to other indicators of quality school experiences and the impacts of school, community, and individual factors on Black students’ decision-making processes.

8.2. Systems of Support for Students Taking beyond IM3 Courses

Beyond IM3 Course Taking and Eighth-Grade Math. As mentioned in the previous sections, the literature suggests a positive relationship between eighth-grade math and future levels of math attainment [48,117,118,119,122,124,156]. The importance of eighth-grade math is underscored by the results in my logistic regression models. Black students who took an accelerated math course in the eighth grade (as mentioned earlier, an accelerated eighth-grade math course is a course that is above grade level and typically taken in high school, such as Algebra 1, Geometry, Integrate Math 1, or Integrate Math 2) were significantly more likely to be enrolled in a Beyond IM3 course in high school. This is important to consider because according to the U.S. Department of Education [18], only 24% of eighth graders take accelerated math courses, and Black students are even less likely than their peers to be enrolled in these courses [18,28,29].
In addition, if a student took an accelerated math class in eighth grade and received an A in that class, the odds that they would take a Beyond IM3 course increased by an additional 510 percent. So, as the literature suggests [83], early math experiences are significant for high school math trajectories. Based on my findings, eighth-grade math is a crucial turning point for many Black students. These findings suggest that for many Black students, taking Beyond IM3 coursework in high school might be nearly impossible without acceleration in the eighth grade. These findings illuminate how placement policies act as institutional barriers to Beyond IM3 courses. Hence, the secondary math trajectories of the Black students were diminished before even reaching high school.
Clearly, not taking an accelerated math course by the eighth grade has unfortunate effects on the academic trajectories of Black students, which appears to limit their ability to reach Beyond IM3 courses by their senior year of high school [32,57]. Thus, in order for Black students to increase their likelihood of making it to a Beyond IM3 course by senior year, they must be enrolled in the highest math tracks by the eighth grade, if not before.
Intersections of Racial–Ethnic Identities, Gender, and Multilingualism. Gender and ELL status were statistically significant in all of my models. However, the results point to being Black and female as significant factors in upper math placements Beyond IM3. Black female students had 67% higher odds than Black male students of taking a Beyond IM3 course in high school. The findings about Black males echo the literature about their limited enrollment in upper-level math coursework for various institutional and structural reasons that are steeped in systemic racism, such as tracking, exclusionary discipline practices, and lowered expectations of teachers [30,47,60,96,157].
Gender. Alternatively, the findings demonstrated that Black girls were overrepresented in Beyond IM3 coursework. Scholars have long studied the invisibility of Black girls in STEM classrooms [86,87,88,132]. This finding does not mean that Black girls are having better experiences than Black boys, necessarily. As previous scholarship has indicated, Black girls are grossly underrepresented in STEM degrees and careers [4,86,90] and often have negative experiences in STEM spaces that are multiplied due to the intersections of their race and their gender [100]. Black girls are being enrolled in these courses at much higher rates than Black boys, which poses a host of interesting questions about where and how Black girls are becoming lost or being removed from STEM pipelines. However, Model 1 highlights the underrepresentation of Black boys in Beyond IM3 coursework. Black boys are also experiencing the math classroom in racialized and gendered ways [11,97], and their underrepresentation speaks to the overarching structural and institutional barriers that impact Black boys’ math course taking.
Black Multilingual Students. As it relates to multilingualism, students who were Black and multilingual had 87.9% higher odds of taking a Beyond IM3 course than Black monolingual students. This finding challenges how research has historically depicted multilingual/ELL students and their mathematical ability levels in comparison to their monolingual/non-ELL peers [158,159,160,161]. One underlying factor could be the differences in the experiences of African American and Black immigrant populations in the U.S. context, and their cultural orientations to schools and schooling [101,103,105] (Mwangi & Fries-Britt, 2015). Further research is needed to understand the underlying factors contributing to this result.
Beyond IM3 Course Taking and Teachers. Teacher characteristic variables allowed for an analysis of the impacts of teacher characteristics on Beyond IM3 course-taking patterns. Race/ethnicity, gender, teachers’ average age, teachers’ average years of teaching experience, and the average level of education of teachers at each school in The District were all variables that I included in my analyses before finalizing my logistic regression model. The teacher characteristics that remained in my final logistic regression analysis were variables for gender (the number of male teachers), race (the number of Black teachers), subject area (the number of math teachers and the number of Black math teachers), average teacher age, and average years of teaching experience. Teacher race, gender, and years of teaching experience will be discussed further as potential solutions for increasing Black students’ Beyond IM3 course taking.
Black Teachers. In my logistic regression analysis, I specifically wanted to understand the implications of my fourth research question which centers teachers, specifically Black teachers, as a potential solution for increasing Black students’ Beyond IM3 course enrollment. In fact, having more Black teachers and more Black math teachers were each very close to being statistically significant (p = 0.09 and p = 0.10 in the final model, respectively). With a larger sample (and therefore more statistical power), the models may have demonstrated statistically significant results. My findings about the relationship between Black teachers and student enrollment support a push for recruiting and retaining more Black teachers in districts with larger percentages of Black students. As mentioned previously, teacher match scholarship explicitly links Black teachers to better academic outcomes for Black students [145,146,147].
Male Teachers. The results suggest that having more male teachers was significant for increasing the odds of more Black students enrolling in Beyond IM3 coursework. In Model 5 (unlike in Model 4), the number of male teachers was statistically significant at the 0.05 level. Using male teachers as a reference category, I created a binary variable for teachers’ gender. This information was relevant based on my findings related to Black boys’ underrepresentation in Beyond IM3 coursework. The literature on teacher match holds conflicting opinions regarding the impact of same-race, same-gender teacher–student pairings [146,162]. In this study, the significance of having a same-sex, same-race student–teacher match was indiscernible, having a minimal effect on the course-taking decisions of Black students. Thus, according to Klopfenstein’s [146] findings, having more male math teachers, specifically Black male math teachers, might bode well for increasing Black girls’ enrollment in Beyond IM3 coursework. Taken together, the implication regarding male teachers leaves room for thinking about the role of teacher gender on Black students’ math course-taking patterns and their academic outcomes.
Newer Teachers as Possible Game Changers. Another factor illuminated by the results was the statistical significance of average teacher years of experience on the Beyond IM3 course taking of Black students at a given school. This result is interesting given previous research demonstrating how less teaching experience is significantly associated with teacher ineffectiveness [148]. Additional data, perhaps both quantitative and qualitative in nature, would be needed to understand why the findings indicate statistical significance regarding teachers’ years of experience. One potential explanation might be that as teachers spend more time in a school system, they may be more likely to work in alignment with potential gatekeeping mechanisms functioning at their school sites. Perhaps as teachers earn more years of teaching experience, they ultimately begin to ascribe to the anti-Black foundations of the public education system and begin to assimilate into the deficit-oriented lenses of many educational institutions, often reifying the structures that make it difficult for Black students to succeed in math classrooms. Moreover, though subject area and pedagogical expertise might grow over time, it is possible that socializing structures make teachers less likely to consider equity-oriented approaches and asset-based framing of student outcomes.
While the reasons behind these statistical outcomes related to race, gender, and average years of teaching experience are unclear, taken together, the results reiterate the role of teachers as crucial to Black students’ progression through the math pipeline to “Beyond IM3” courses.

9. The Limitations of This Study

The use of publicly available quantitative data has its drawbacks, especially regarding Black students. For example, because of the small population of Black students and educators throughout The District, much of the publicly available data were redacted for privacy purposes. This resulted in missing data for students and educators throughout the publicly available dataset, therefore limiting the results. In addition, the publicly available dataset includes only students who identify exclusively as Black but does not include students from mixed racial/ethnic backgrounds. While publicly available datasets have their benefits concerning convenience, they provide limited opportunities for how data are collected and how variables are defined that inevitably impacted this study.

10. Significance and Potential Contributions

One contribution to the field is that this study can serve as an extension of the conversation about the multiple factors that influence Black students’ mathematics socialization and identity as related to Martin’s FAMSI. I noticed unique challenges related to exploring the multitude of factors that Martin [16] must have experienced while developing his framework. Specifically, I recognize the overlapping nature of Martin’s sociohistorical level and Critical Race Theory (CRT). Indeed, several authors, including Martin, have paired the FAMSI with Critical Race Theory [163]. Additionally, Martin’s framework has become foundational scholarship for current studies that parse out the sociohistorical level to explicitly center race and racism in the mathematical experiences of Black students [164].
Ultimately, my hope is that this study will help researchers begin to disrupt the limited racial diversity in STEM fields while also situating math as one of the major deterrents of Black students’ interest and persistence in STEM. While this study points out the challenges with access to Beyond IM3 coursework, this research could be impactful for developing systems of multilevel support for Black students in STEM classrooms and could serve as an impetus for changes in the math curriculum, policy, and teaching practices.
Furthermore, centering the “M” in STEM is becoming increasingly important. In the era of “fake news,” it is imperative that students are becoming mathematically literate and able to think critically about numbers and statistics represented in the news and social media so that they might be able understand the world better and be fully engaged in a democratic society. Specifically, for over 20 years, scholars have called for math literacy to be seen as a civil right [165,166]. With recent developments regarding the COVID-19 pandemic, ongoing police violence against Black people, and the rise in the Black maternal death rate, mathematical literacy and statistical fluency is crucial for the viability of the Black community as a whole. While I understand that my work is merely at the precipice of these ideas, math and education research must continue to push towards justice and equity.

11. Implications and Recommendations

In this section, I will discuss the implications of this study as they pertain to (1) teachers, teaching, and teacher pedagogy and (2) math classrooms and the math curriculum.

11.1. Teachers, Teaching, and Teacher Pedagogy

It is important for teacher preparation programs, schools, and districts to strengthen the pipelines into the teaching profession by recruiting teachers who are both highly qualified and racially diverse. The current teacher pool comprises mostly white women [167,168]. The findings support a need for a shift in the demographics of the teaching profession to better align with scholarship about the importance of teacher match [145,146,169]. Schools and districts intent on enhancing the math classroom experience for Black students should focus their recruitment efforts on hiring and retaining highly qualified Black math teachers. Shifting the demographics of math teachers could prove beneficial to the successful progression of Black students through the mathematics pipeline from K12, through college, and beyond.
Simply altering the racial–ethnic diversity of teachers is not enough. With recent budget cuts and the ongoing pandemic, it is unlikely that schools will be able to recruit sufficient numbers of highly qualified Black teaching candidates. Therefore, schools and districts should also encourage current math teachers to tap into the cultural funds of knowledge that Black students already possess [170,171,172,173,174]. In addition to recruiting and retaining more Black math teachers, developing supportive and encouraging non-Black math teachers should be an additional solution for helping Black students see themselves as holders of STEM expertise. Specifically, teacher education programs should begin to incorporate examples of culturally relevant pedagogies and instructional strategies that meet the needs of diverse learners. Programs should leverage these approaches by teaching math topics in culturally responsive, culturally relevant, and culturally sustaining ways [172,173,175,176,177,178]. Math teachers should use the curriculum to make connections to students’ lives outside of school to develop math curricula that are more meaningful, relevant, and aligned with the needs and experiences of their beautifully brilliant Black students.
In addition, teacher education programs and school districts could realign their focus towards altering the mindsets of current and aspiring math teachers. Gutierrez [179] posits that in addition to learning pedagogy and instructional strategies, math teachers must learn to manifest and grow their “political conocimiento,” or political knowledge. Teacher education programs should be structured around building the political knowledge of math teachers by developing their ability to “deconstruct the images of mathematics, public education, teaching, and learning that circulate in mainstream society” (p. 16). Similarly, Martin [180] suggests that highly qualified math teachers should develop a deep understanding of Black students’ lived realities. Both processes would help to negate the impacts of implicit and explicit biases in math classrooms noted in and beyond this current study. The deconstruction of the racialized narrative of Black students’ mathematical ability via political conocimiento and the development of deep understandings of their students’ lives should be humanizing experiences for teachers. Teachers would then have no choice but to begin to unpack their own biases, thus creating a process that could disrupt the racial hierarchy of mathematical ability that persists today [13].

11.2. Math Classrooms and the Math Curriculum

Even though early access to higher levels of the math sequence is crucial for future success in math, for Black students, access to such coursework may be insufficient to address structural inequities [7]. Ultimately, the research about secondary math and Black students indicates the need for robust change. Daro and Asturias [181] call for a redesign of math curricular pathways to better serve students from historically marginalized groups. They suggest that in lieu of academic tracking and ability grouping, schools should offer pathway options for students to choose the math course that fits their future educational and career goals. More research is needed on this concept to make any claims about its effectiveness, but it offers one potential way to better address students’ needs with a varied math curriculum. The findings from their study warrant a more in-depth look at how the math curriculum’s structural components impact Black students’ secondary math trajectories. Future research should further explore the effects of Daro and Asturias’ [181] plan to alter math pathways for Black students to ensure that tracking would not persist in some other manner, such as through different career pursuits. Moreover, future research should investigate the effects of various alterations to the math curriculum and their impacts on students’ math experiences in math classrooms across the nation. The goal should be to further explore current strategies that have worked and innovative ideas that could prove impactful to discover how to combat the structural components within the math pathway that continue to shape the math experiences of Black students.
Furthermore, scholars have suggested that math educators should begin to use math classrooms as spaces for liberation, social justice, and criticality [54,177,182,183,184,185,186]. One scholar, Gutstein [183], believes that the teaching and learning of mathematics should focus on real-world activities that center the concerns of the communities served by the math teacher. Gutstein [183] also suggests moving beyond using STEM for economic gains to instead pursue making a difference in service of humanity and nature. The math classroom does not have to be sterile and fraught with racialized notions of who should and should not be “good” at math [187,188]. Educators must continue to foster the innate abilities of Black students, allowing them to see themselves as scientists, mathematicians, and engineers not only as a more dependable source of income, but as a pathway to social justice contributions to society.
In the realm of mathematics education research, there are calls for altering mathematics pedagogy to achieve liberatory and social justice outcomes for Black students [12,187,189,190,191,192]. The proponents for this shift in math pedagogy argue for critical and culturally relevant education that speaks to all students’ full development. Martin [180] suggests that math teachers should re-imagine the mathematics curriculum such that it could be used to empower Black students, creating change agents in their communities. Math classrooms could indeed become spaces where students learn to think critically about data and debate the facts, figures, and statistics presented in the news. What could it mean for classes of future Black mathematicians, economists, data scientists, and statisticians if they were exposed to rigorous high-quality coursework that was also meaningful, relevant, and engaging? This alteration to the more extensive conversation about math pedagogy would require a reimagining of how the math classroom should and could operate.

12. Conclusions

Beyond IM3 Course Taking: Is It Really a Choice?

This study aimed to determine what informs Black students’ decision-making processes as they choose to take, or not take, a fourth year of math in high school. The use of logistic regression models within the FAMSI has illuminated the multifaceted nature of decision making for Black students, revealing that both individual characteristics and broader systemic issues significantly impact their educational pathways. Crucially, the research underscores that the choice to pursue a fourth year of math, while ostensibly a matter of student preference, is heavily conditioned by early access to accelerated courses and the presence of systemic supports and barriers.
The findings of this study call for a critical examination of educational policies and practices that limit access to advanced coursework for Black students. It highlights the importance of proactive interventions that ensure Black students are not only prepared but also have the opportunity to engage in advanced math classes from an early age. These interventions must address the sociohistorical and institutional constraints that disproportionately affect Black students, such as academic tracking and inequitable resource distribution, to truly make advanced math course taking a choice rather than a privilege. By fostering an educational environment that supports Black students equitably, particularly in math education, we can make strides toward closing the lingering opportunity and resource gaps while ensuring the diversification of STEM fields.

Funding

This research was funded in part by a 2021 Ford Foundation Dissertation Fellowship. This research was also sponsored in part by the Yankelovich Center at the University of California, San Diego.

Institutional Review Board Statement

This study was conducted in accordance with the Declaration of Helsinki and approved by the University of California, San Diego Human Research Protections Program (Project Number 190014; Approval Date: 24 September 2021).

Informed Consent Statement

Informed consent was obtained from all subjects involved in this study.

Data Availability Statement

The original contributions presented in this study are included in the article, and further inquiries can be directed to the corresponding author.

Conflicts of Interest

The author declares no conflicts of interest.

References

  1. National Science Foundation. Elementary and Secondary STEM Education; National Science Foundation: Alexandria, VA, USA, 2023.
  2. Binkley, C. Education in US and around the World Suffered Historic Setbacks Due to COVID Pandemic. USA Today, 5 December 2023. Available online: https://www.usatoday.com/story/news/education/2023/12/05/pisa-scores-show-student-declines-math-reading-science/71809186007/ (accessed on 31 May 2024).
  3. Hough, H.J.; Chavez, B. California Test Scores Show Little Improvement after Pandemic. PACE. January 2024. Available online: https://edpolicyinca.org/publications/california-test-scores-show-little-improvement-after-pandemic#:~:text=In%202023%2C%20more%20students%20met,exceeded%20the%20standards%20for%20math (accessed on 31 May 2024).
  4. National Center for Education Statistics. Reading and Mathematics Scores Decline during COVID-19 Pandemic. 2022. Available online: https://www.nationsreportcard.gov/highlights/ltt/2022/ (accessed on 31 May 2024).
  5. Polikoff, M.; Clay, I.; Silver, D. Beyond Test Scores: Broader Academic Consequences of the COVID-19 Pandemic on American Students. CRPE. 2023. Available online: https://crpe.org/new-report-how-the-pandemic-battered-student-engagement-attendance/ (accessed on 31 May 2024).
  6. Sawchuck, S.; Sparks, S.D. Kids Are behind in Math Because of COVID-19. Here’s What Research Says Could Help. Education Week, 2 December 2020. Available online: https://www.edweek.org/teaching-learning/kids-are-behind-in-math-because-of-covid-19-heres-what-research-says-could-help/2020/12#:~:text=Three%20studies%20based%20on%20NWEA,learn%20in%20a%20typical%20year (accessed on 31 May 2024).
  7. Ladson-Billings, G. From the achievement gap to the educational debt: Understanding achievement in U.S. schools. Educ. Res. 2006, 35, 3–12. [Google Scholar] [CrossRef]
  8. Bailey, D.H.; Duncan, G.J.; Murnane, R.J.; Au Yeung, N. Achievement Gaps in the Wake of COVID-19. Educ. Res. 2021, 50, 266–275. [Google Scholar] [CrossRef]
  9. Perez Huber, L.; Lopez, C.B.; Malagon, M.C.; Velez, V.; Solorzano, D.G. Getting beyond the ‘symptom,’ acknowledging the ‘disease’: Theorizing racist nativism. Contemp. Justice Rev. 2008, 11, 39–51. [Google Scholar] [CrossRef]
  10. Garcia, S.E. Where Did BIPOC Come from? The New York Times, June 2020. Available online: https://www.nytimes.com/article/what-is-bipoc.html (accessed on 31 May 2024).
  11. Jett, C.C.; Stinson, D.W.; Williams, B.A. Communities for and with Black male students: Four strategies can be effective in creating supportive learning environments. Math. Teach. 2015, 109, 284–289. [Google Scholar] [CrossRef]
  12. Larnell, G.V.; Bullock, E.C.; Jett, C.C. Rethinking teaching and learning mathematics for social justice from a critical race perspective. J. Educ. 2016, 196, 19–29. [Google Scholar] [CrossRef]
  13. Martin, D.B. Researching race in mathematics education. Teach. Coll. Rec. 2009, 111, 295–338. [Google Scholar] [CrossRef]
  14. Martin, D.B. Learning mathematics while Black. Educ. Found. 2012, 26, 47–66. [Google Scholar]
  15. Gallegos, E.; Willis, D.J. Most California High School Seniors Shut out of Even Applying to the State’s Universities. EdSource. February 2024. Available online: https://edsource.org/2024/most-california-high-school-seniors-shut-out-of-even-applying-to-the-states-universities/705635 (accessed on 31 May 2024).
  16. Martin, D.B. Mathematics Success and Failure among African American Youth: The Roles of Sociohistorical Context, Community Forces, School Influence, and Individual Agency; Lawrence Erlbaum Associates, Inc.: Mahwah, NJ, USA, 2000. [Google Scholar]
  17. National Council of Supervisors of Mathematics (NCSM); National Council of Teachers of Mathematics (NCTM). Building STEM Education on a Sound Mathematical Foundation: A Joint Position Statement on STEM from the National Council of Supervisors of Mathematics and the National Council of Teachers of Mathematics; Academies Press: Cambridge, MA, USA, 2018. [Google Scholar]
  18. U.S. Department of Education. A Leak in the STEM Pipeline: Taking Algebra Early. November 2018. Available online: https://www2.ed.gov/datastory/stem/Algebra/index.html#_ftn3 (accessed on 31 May 2024).
  19. Duncan, G.J.; Dowsett, C.L.; Claessens, A.; Magnuson, K.; Huston, A.C.; Klebanov, P.; Pagani, L.S.; Feinstein, L.; Engel, M.; Brooks-Gunn, J.; et al. School readiness and later achievement. Dev. Psychol. 2007, 43, 1428–1446. [Google Scholar] [CrossRef] [PubMed]
  20. Levine, P.B.; Zimmerman, D.J. The benefit of additional high-school math and science classes for young men and women. J. Bus. Econ. Stat. 1995, 13, 137–149. [Google Scholar] [CrossRef]
  21. Parsons, S.; Bynner, J. Does Numeracy Matter More? National Research and Development Centre for Adult Literacy and Numeracy: London, UK, 2005; Available online: https://discovery.ucl.ac.uk/id/eprint/1566245/1/parsons2006does.pdf (accessed on 31 May 2024).
  22. Rivera-Batiz, F. Quantitative literacy and the likelihood of employment among young adults in the United States. J. Hum. Resour. 1992, 27, 313. [Google Scholar] [CrossRef]
  23. Rose, H.; Betts, J.R. The effect of high school courses on earnings. Rev. Econ. Stat. 2004, 86, 497–513. [Google Scholar] [CrossRef]
  24. Langdon, D.; McKittrick, G.; Beede, D.; Khan, B.; Doms, M. STEM: Good Jobs Now and for the Future; Issue Brief #03-11; U.S. Department of Commerce, Economics and Statistics Administration: Washington, DC, USA, 2011.
  25. Noonan, R. STEM Jobs: 2017 Update; Office of the Chief Economist, Economics and Statistics Administration, U.S. Department of Commerce: Washington, DC, USA, 2017.
  26. National Science Foundation. Women, Minorities, and Persons with Disabilities in Science and Engineering: 2017; National Center for Science and Engineering Statistics: Arlington, VA, USA, 2017.
  27. Blanton, M.; Stroud, R.; Stephens, A.; Gardiner, A.M.; Stylianou, D.A.; Knuth, E.; Isler-Baykal, I.; Strachota, S. Does early algebra matter: The effectiveness of an early algebra intervention in grades 3 to 5. Am. Educ. Res. J. 2019, 56, 1930–1972. [Google Scholar] [CrossRef]
  28. Faulkner, V.N.; Stiff, L.V.; Marshall, P.L.; Nietfeld, J.; Crossland, C.L. Race and teacher evaluations as predictors of Algebra placement. J. Res. Math. Educ. 2014, 45, 288–311. [Google Scholar] [CrossRef]
  29. Francis, D.V. Sugar and spice and everything nice? Teacher perceptions of Black girls in the classroom. Rev. Black Political Econ. 2012, 39, 311–320. [Google Scholar] [CrossRef]
  30. Riegle-Crumb, C. The path through math: Course sequences and academic performance at the intersection of race ethnicity and gender. Am. J. Educ. 2006, 113, 101–122. [Google Scholar] [CrossRef] [PubMed]
  31. Education Trust-West. Black Minds Matter: Supporting the Educational Success of Black Children in California; Education Trust-West: Oakland, CA, USA, 2015. [Google Scholar]
  32. Ngo, F.J.; Velasquez, D. Inside the math trap: Chronic math tracking from high school to community college. Urban Educ. 2020, 58, 1629–1657. [Google Scholar] [CrossRef]
  33. Adelman, C. Answers in the Toolbox: Academic Intensity, Attendance Patterns, and Bachelor’s Degree Attainment; U.S. Department of Education: Washington, DC, USA, 1999.
  34. Adelman, C. The Toolbox Revisited: Paths to Degree Completion from High School through College; US Department of Education: Washington, DC, USA, 2006.
  35. Byun, S.Y.; Irvin, M.J.; Bell, B.A. Advanced math course taking: Effects on math achievement and college enrollment. J. Exp. Educ. 2015, 83, 439–468. [Google Scholar] [CrossRef] [PubMed]
  36. Hoyt, J.; Sorensen, C. High school preparation, placement testing, and college remediation. J. Dev. Educ. 2001, 25, 26–34. [Google Scholar]
  37. Kim, J.; Kim, J.; DesJardins, S.L.; McCall, B.P. Completing Algebra II in high school: Does it increase college access and success? J. High. Educ. 2015, 86, 628–662. [Google Scholar] [CrossRef]
  38. ACT. Rigor at Risk: Reaffirming Quality in the High School Core Curriculum; ACT: Iowa City, IA, USA, 2007; Available online: https://www.act.org/path/policy/pdf/rigor_report.pdf (accessed on 31 May 2024).
  39. College Board. 2011 College-Bound Seniors Total Group Profile Report; College Board: New York, NY, USA, 2011; Available online: https://www.collegeboard.com/profdownload/cbs2011_total_group_report.pdf (accessed on 31 May 2024).
  40. Rogers, K.D., Jr. Centering the “M” in STEM: A Review of Black Students’ Math Experiences. Negro Educ. Rev. 2020, 71, 7–52. [Google Scholar]
  41. Zelkowski, J. Defining the intensity of high school mathematics: Distinguishing the difference between college-ready and college-eligible students. Am. Second. Educ. 2011, 39, 27–54. [Google Scholar]
  42. Schiller, K.S.; Muller, C. Raising the bar and equity? Effects of state high school graduation requirements and accountability policies on students’ mathematics course taking. Educ. Eval. Policy Anal. 2003, 25, 299–318. [Google Scholar] [CrossRef]
  43. Teitelbaum, P. The influence of high school graduation requirement policies in mathematics and science on student course-taking patterns and achievement. Educ. Eval. Policy Anal. 2003, 25, 31–57. [Google Scholar] [CrossRef]
  44. Sadler, P.M.; Sonnert, G.; Hazari, Z.; Tai, R. The role of advanced high school coursework in increasing stem career interest. Sci. Educ. 2014, 23, 1–13. [Google Scholar]
  45. Warne, R.T.; Sonnert, G.; Sadler, P.M. The relationship between Advanced Placement mathematics courses and students’ STEM career interest. In Educational Researcher; American Educational Research Association (AERA): Washington, DC, USA, 2019; Volume 48, pp. 101–111. [Google Scholar] [CrossRef]
  46. Gao, N.; Johnson, H. Improving College Pathways in California; Public Policy Institute of California: San Francisco, CA, USA, 2017. [Google Scholar]
  47. Oakes, J. Multiplying Inequalities: The Effects of Race, Social Class, and Tracking on Opportunities to Learn Mathematics and Science; RAND Corporation: Santa Monica, CA, USA, 1990. [Google Scholar]
  48. Paul, F.G. Grouping Within Algebra I: A structural sieve with powerful effects for low-income, minority, and immigrant students. Educ. Policy 2005, 19, 262–282. [Google Scholar] [CrossRef]
  49. Trusty, J.; Niles, S.G. High-school math courses and completion of the bachelor’s degree. Prof. Sch. Couns. 2003, 7, 99–107. [Google Scholar]
  50. Francis, D.V.; Darity, W.A. Separate and Unequal Under One Roof: How the Legacy of Racialized Tracking Perpetuates Within-School Segregation. Russell Sage Found. J. Soc. Sci. 2021, 7, 187–202. [Google Scholar] [CrossRef]
  51. Moody, V.R. Sociocultural Orientations and the Mathematical Success of African American Students. J. Educ. Res. 2004, 97, 135–146. [Google Scholar] [CrossRef]
  52. Baber, L.D. Colorblind liberalism in postsecondary STEM education. In Diversifying STEM: Multidisciplinary Perspectives of Race and Gender; McGee, E., Robinson, W.H., Eds.; Rutgers University Press: New Brunswick, NJ, USA, 2020; pp. 19–35. [Google Scholar]
  53. Bullock, E.C. Only STEM can save us? Examining race, place, and STEM education as property. Educ. Stud. 2017, 53, 628–641. [Google Scholar] [CrossRef]
  54. Martin, D.B. Liberating the Production of Knowledge about African American; Routledge: London, UK, 2009. [Google Scholar]
  55. McGee, E.O. Black, Brown, Bruised: How Racialized STEM Education Stifles Innovation; Harvard Education Press: Cambridge, MA, USA, 2020. [Google Scholar]
  56. Ray, V. A Theory of Racialized Organizations. Am. Sociol. Rev. 2019, 84, 26–53. [Google Scholar] [CrossRef]
  57. Wells, C.L. Understanding issues associated with tracking students in mathematics education. J. Math. Educ. 2018, 11, 68–84. [Google Scholar]
  58. Ballón, E.G. Racial Differences in High School Math Track Assignment. J. Latinos Educ. 2008, 7, 272–287. [Google Scholar] [CrossRef]
  59. Davis, J. The mathematical experiences of Black males in a predominantly Black urban middle school and community. Int. J. Educ. Math. Sci. Technol. 2014, 2, 206–222. [Google Scholar] [CrossRef]
  60. Oakes, J. Keeping Track: How Schools Structure Inequality, 2nd ed.; Yale University Press: New Haven, CT, USA, 2005. [Google Scholar]
  61. Bland, S.; Burdman, P.; Baker, M. State-by State Graduation Requirements in Math. Just Equations. 2024. Available online: https://justequations.org/resource/beyond-algebra-high-school-math-for-a-new-generation?utm_source=Just+Equations&utm_campaign=8fca1a63d3-EMAIL_CAMPAIGN_2019_01_03_08_59_COPY_01&utm_medium=email&utm_term=0_472770b236-8fca1a63d3-560880748&mc_cid=8fca1a63d3&mc_eid=869a48455d (accessed on 31 May 2024).
  62. Macdonald, H.; Zinth, J.D.; Pompelia, S. 50 State Comparison: High School Graduation Requirements; The Education Commission of the States: Denver, CO, USA, 2019; Available online: https://www.ecs.org/high-school-graduation-requirements (accessed on 31 May 2024).
  63. Fortin, J. California Tries to Close the Gap in Math but Sets Off a Backlash. The New York Times, 4 November 2021. Available online: https://www.nytimes.com/2021/11/04/us/california-math-curriculum-guidelines.html (accessed on 31 May 2024).
  64. Hong, J. Understanding the Debate behind California’s New Math Framework. Cal Matters. 19 November 2021. Available online: https://calmatters.org/education/k-12-education/2021/11/california-math/ (accessed on 31 May 2024).
  65. Anderson, V.; Burman, P. A New Calculus for College Admissions: How Policy, Practice, and Perceptions of High School Math Education Limit Equitable Access to College. Just Equations. 2022. Available online: https://justequations.org/resource/a-new-calculus-for-college-admissions-how-policy-practice-and-perceptions-of-high-school-math-education-limit-equitable-access-to-college (accessed on 31 May 2024).
  66. Berry, R.Q., III. Voices of success: Descriptive portraits of two successful African American middle school mathematics students. J. Afr. Am. Stud. 2005, 8, 46–62. [Google Scholar] [CrossRef]
  67. Carter Andrews, D.J. They shall not be moved: Black students’ persistence as engineering majors. In Diversifying STEM: Multidisciplinary Perspectives of Race and Gender; McGee, E., Robinson, W.H., Eds.; Rutgers University Press: New Brunswick, NJ, USA, 2020; pp. 19–35. [Google Scholar]
  68. Kelly, S. The Black-White gap in mathematics course taking. Sociol. Educ. 2009, 82, 47–69. [Google Scholar] [CrossRef]
  69. Diette, T.M. The Whiter the better? Racial composition and access to school resources for Black students. Rev. Black Political Econ. 2011, 39, 321–334. [Google Scholar] [CrossRef]
  70. Campbell, S.L. For Colored girls? Factors that influence teacher recommendations into advanced courses for Black girls. Rev. Black Political Econ. 2012, 39, 389–402. [Google Scholar] [CrossRef]
  71. Griffin, K.A. Addressing STEM Culture and Climate to Increase Diversity in STEM Disciplines. Higher Education Today, 23 April 2018. Available online: https://www.higheredtoday.org/2018/04/23/addressing-stem-culture-climate-increase-diversity-stem-disciplines/ (accessed on 31 May 2024).
  72. Alexander, J.E.; Johnson, K.E.; Kelley, K. Longitudinal analysis of the relations between opportunities to learn about science and the development of interest related to science. Sci. Educ. 2012, 96, 763–786. [Google Scholar] [CrossRef]
  73. McClure, E. More than a foundation: Young children are capable STEM learners. J. Natl. Assoc. Educ. Young Child. 2017, 72, 83–89. [Google Scholar]
  74. Sarama, J.; Lange, A.A.; Clements, D.H.; Wolfe, C.B. The impacts of an early mathematics curriculum on oral language and literacy. Early Child. Res. Q. 2012, 27, 489–502. [Google Scholar] [CrossRef]
  75. Sawchuck, S. Unlocking STEM Pathways for All Students: Which Policies Open Doors for Students to STEM—And Which Slam Them Shut? Education Week, 22 May 2018. Available online: https://www.edweek.org/ew/articles/2018/05/23/unlocking-stem-pathways-for-all-students.html (accessed on 31 May 2024).
  76. Alexander, N.N. Statistical Models of Identity and Self-Efficacy in Mathematics on a National Sample of Black Adolescents from HSLS:09. Unpublished Dissertation; Columbia University: New York, NY, USA, 2015. [Google Scholar]
  77. Joseph, N.M.; Cobb, F. Anti-blackness is in the air: Problematizing Black students’ mathematics education pathways from curriculum to standardized assessments. In Critical Race Theory in Mathematics Education; Davis, J., Jett, C., Eds.; Routledge: New York, NY, USA, 2019; pp. 140–163. [Google Scholar]
  78. McGee, E.O.; Pearman, A. Understanding Black male mathematics high achievers from the inside out: Internal risk and protective factors in high school. Urban Rev. 2015, 47, 513–540. [Google Scholar] [CrossRef]
  79. Nasir, N.S.; McLaughlin, M.W.; Jones, A. What does it mean to be African? American? Constructions of race and academic identity in an urban public high school. Am. Educ. Res. J. 2009, 46, 73–114. [Google Scholar] [CrossRef]
  80. Spencer, J. Identity at the crossroads: Understanding the practices and forces that shape African American success and struggle in mathematics. In Mathematics Teaching, Learning, and Liberation in the Lives of Black Children; Martin, D.B., Ed.; Routledge: New York, NY, USA, 2009; pp. 200–230. [Google Scholar]
  81. Collins, P.H. Intersectionality as critical social theory. In Intersectionality as Critical Social Theory; Duke University Press: Durham, NC, USA, 2019. [Google Scholar]
  82. Saw, G.; Chang, C.; Chan, H. Cross-sectional and longitudinal disparities in STEM career aspirations at the intersection of gender, race/ethnicity, and socioeconomic status. Educ. Res. 2018, 47, 525–532. [Google Scholar] [CrossRef]
  83. Joseph, N.M.; Hailu, M.F.; Matthews, J.S. Normalizing Black Girls’ Humanity in Mathematics Classrooms. Harv. Educ. Rev. 2019, 89, 132–155. [Google Scholar] [CrossRef]
  84. Morris, E.W. “Ladies” or “Loudies”? In Youth & Society; SAGE Publications: Thousand Oaks, CA, USA, 2007; Volume 38, pp. 490–515. [Google Scholar]
  85. Chavous, T.; Cogburn, C.D. Superinvisible women: Black girls and women in education. Black Women Gend. Fam. 2007, 1, 24–51. [Google Scholar]
  86. Farinde, A.A.; Lewis, C.W. The underrepresentation of African American female students in STEM fields: Implications for classroom teachers. US-China Educ. Rev. 2012, 2, 421–430. [Google Scholar]
  87. Neal-Jackson, A. A meta-ethnographic review of the experiences of African American girls and young women in K–12 education. Rev. Educ. Res. 2018, 88, 508–546. [Google Scholar] [CrossRef]
  88. Ricks, S.A. Falling through the cracks: Black girls and education. Interdiscip. J. Teach. Learn. 2014, 4, 10–21. [Google Scholar]
  89. Joseph, N.M.; Hailu, M.; Boston, D. Black women’s and girls’ persistence in the P–20 mathematics pipeline: Two decades of children, youth, and adult education research. Rev. Res. Educ. 2017, 41, 203–227. [Google Scholar] [CrossRef]
  90. Collins, K.H.; Joseph, N.M.; Ford, D.Y. Missing in action: Gifted Black girls in science, technology, engineering, and mathematics. Gift. Child Today 2020, 43, 55–63. [Google Scholar] [CrossRef]
  91. Ford, D.Y. Segregation and the Underrepresentation of Blacks and Hispanics in Gifted Education: Social Inequality and Deficit Paradigms. Roeper Rev. 2014, 36, 143–154. [Google Scholar] [CrossRef]
  92. Morgan, I.; Amerikaner, A. Funding Gap 2018. EdTrust. 27 February 2018. Available online: https://edtrust.org/resource/funding-gaps-2018/ (accessed on 31 May 2024).
  93. Joseph, N.M.; Viesca, K.M.; Bianco, M. Black female adolescents and racism in schools: Experiences in a colorblind society. High Sch. J. 2016, 100, 4–25. [Google Scholar] [CrossRef]
  94. Annamma, S.A.; Anyon, Y.; Joseph, N.M.; Farrar, J.; Greer, E.; Downing, B.; Simmons, J. Black girls and school discipline: The complexities of being overrepresented and understudied. Urban Educ. 2016, 54, 211–242. [Google Scholar] [CrossRef]
  95. Morris, M. Pushout: The Criminalization of Black Girls in Schools; The New Press: New York, NY, USA, 2016. [Google Scholar]
  96. Wood, J.L.; Harris, F., III; Howard, T.C. Get Out! Black Male Suspensions in California Public Schools; Community College Equity Assessment Lab and the UCLA Black Male Institute: San Diego, CA, USA, 2018. [Google Scholar]
  97. Jett, C.C.; Davis, J. Black males’ STEM experiences: Factors that contribute to their success. In Diversifying STEM: Multidisciplinary Perspectives of Race and Gender; McGee, E., Robinson, W.H., Eds.; Rutgers University Press: New Brunswick, NJ, USA, 2020; pp. 19–35. [Google Scholar]
  98. Riegle-Crumb, C.; Moore, C.; Ramos-Wada, A. Who wants to have a career in science or math? Exploring adolescents’ future aspirations by gender and race/ethnicity. Sci. Educ. 2011, 95, 458–476. [Google Scholar] [CrossRef]
  99. Schroeder, L.; Taketa, K.; McDonald, J. Blacks, Other People of Color Under-Represented among San Diego Teachers. The San Diego Tribune, 27 June 2020. Available online: https://www.sandiegouniontribune.com/news/watchdog/story/2020-06-27/blacks-other-people-of-color-under-represented-among-state-and-local-educators (accessed on 31 May 2024).
  100. Ireland, D.T.; Freeman, K.E.; Winston-Proctor, C.E.; DeLaine, K.D.; McDonald Lowe, S.; Woodson, K.M. (Un) hidden figures: A synthesis of research examining the intersectional experiences of Black women and girls in STEM education. Rev. Res. Educ. 2018, 42, 226–254. [Google Scholar] [CrossRef]
  101. King-Miller, B.A. Navigating STEM: Afro Caribbean women overcoming barriers of gender and race. SAGE Open 2017, 7, 2158244017742689. [Google Scholar] [CrossRef]
  102. Leggett-Robinson, P.M. Native-Born and Foreign-Born Black Students in STEM: Addressing STEM Identity and Belonging Barriers and Their Effects on Stem Retention and Persistence at the Two Year College; American Society for Engineering Education: Washington, DC, USA, 2017. [Google Scholar]
  103. Mwangi, C.A.G.; Fries–Britt, S. Black within Black: The perceptions of Black immigrant collegians and their U.S. college experience. In About Campus: Enriching the Student Learning Experience; SAGE Publications: Thousand Oaks, CA, USA, 2015; Volume 20, pp. 16–23. [Google Scholar]
  104. Pinder, P.J. Academic performance of immigrants of African heritage in STEM: A look at two world continents. In Proceedings of the Untested Ideas Research Center 2nd International Conference, Rhodes, Greece, 27–29 June 2014. [Google Scholar]
  105. Sparks, D.M. Are you African or African-American? Exploring the identity experiences of female STEM students born in Africa now living in America. Int. J. Gend. Sci. Technol. 2018, 10, 330–338. [Google Scholar]
  106. Burns, D.; Espinoza, D.; Ondrasek, N.; Yang, M. Students Experiencing Homelessness: The Conditions and Outcomes of Homelessness among California Students; Learning Policy Institute: Palo Alto, CA, USA, 2021. [Google Scholar]
  107. da Costa Nunez, R.; Erb-Downward, J.; Kannegaard, J.; Atwal, N.; Bazerjian, L. Aftershocks: The Lasting Impact of Homelessness on Student Achievement; Institute for Children, Poverty, & Homelessness: New York, NY, USA, 2016. [Google Scholar]
  108. De Gregorio, S.; Dhaliwal, T.K.; Owens, A.; Painter, G. Growing up Homeless: Student Homelessness and Educational Outcomes in Los Angeles; EdWorkingPaper: 20-334; Annenberg Institute at Brown University: Providence, RI, USA, 2020. [Google Scholar] [CrossRef]
  109. De Gregorio, S.; Dhaliwal, T.K.; Owens, A.; Painter, G. Timing and duration of student homelessness and educational outcomes in Los Angeles. Educ. Res. 2022, 51, 376–386. [Google Scholar] [CrossRef]
  110. Fantuzzo, J.W.; LeBoeuf, W.A.; Chen, C.; Rouse, H.L.; Culhane, D.P. The unique and combined effects of homelessness and school mobility on the educational outcomes of young children. Educ. Res. 2012, 41, 393–402. [Google Scholar] [CrossRef]
  111. Rose, B.A.; Henneberger, A.K.; Mushonga, D.R.; Uretsky, M.C.; Preston, A.M. Distinguishing the Roles of Poverty and Homelessness in Long-Term Academic and Workforce Outcomes; Maryland Longitudinal Data System Center: Baltimore, MD, USA, 2021.
  112. Barrat, V.X.; Berliner, B. The Invisible Achievement Gap, Part 1: Education Outcomes of Students in Foster Care in California’s Public Schools; WestEd: San Francisco, CA, USA, 2013. [Google Scholar]
  113. Wiegmann, W.; Putnam-Hornstein, E.; Barrat, V.X.; Magruder, J.; Needell, B. The Invisible Achievement Gap Part 2: How the Foster Care Experiences of California Public School Students Are Associated with Their Education Outcomes; The Stuart Foundation: San Francisco, CA, USA, 2014. [Google Scholar]
  114. Allensworth, E.; Nomi, T.; Montgomery, N.; Lee, V.E. College preparatory curriculum for all: Academic consequences of requiring Algebra and English I for ninth graders in Chicago. Educ. Eval. Policy Anal. 2009, 31, 367–391. [Google Scholar] [CrossRef]
  115. Clotfelter, C.T.; Ladd, H.F.; Vigdor, J.L. Algebra for 8th Graders: Evidence on Its Effects from 10 North Carolina Districts; No. w18649; National Bureau of Economic Research: Cambridge, MA, USA, 2012. [Google Scholar]
  116. Finkelstein, N.; Fong, A.; Tiffany-Morales, J.; Shields, P.; Huang, M. College Bound in Middle School & High School? How Math Course Sequences Matter; The Center for the Future of Teaching and Learning at WestEd: San Francisco, CA, USA, 2012. [Google Scholar]
  117. Smith, J.B. Does an extra year make any difference? The impact of early access to Algebra on long-term gains in mathematics attainment. Educ. Eval. Policy Anal. 1996, 18, 141–153. [Google Scholar] [CrossRef]
  118. Spielhagen, F.R. Closing the achievement gap in math: The long-term effects of eighth-grade Algebra. J. Adv. Acad. 2006, 18, 34–59. [Google Scholar] [CrossRef]
  119. Walston, J.; McCarroll, J.C. Eighth-Grade Algebra: Findings from the Eighth Grade Round of the Early Childhood Longitudinal Study, Kindergarten Class of 1998–99; National Center for Education Statistics, U.S. Department of Education: Washington, DC, USA, 2010.
  120. Archbald, D.; Farley-Ripple, E. Predictors of placement in lower level versus higher level high school mathematics. High Sch. J. 2012, 96, 33–51. [Google Scholar] [CrossRef]
  121. Bozick, R.; Ingels, S.J. Mathematics Coursetaking and Achievement at the End of High School: Evidence from the Education Longitudinal Study of 2002; NCES 2008-319; U.S. Department of Education, National Center for Education Statistics: Washington, DC, USA, 2008.
  122. Brown, J.; Schiller, K.; Roey, S.; Perkins, R.; Schmidt, W.; Houang, R. Algebra and Geometry Curricula; NCES 2013-451; National Center for Education Statistics, Institute of Education Sciences, U.S. Department of Education: Washington, DC, USA, 2013.
  123. Ma, X. A longitudinal assessment of antecedent course work in mathematics and subsequent mathematical attainment. J. Educ. Res. 2000, 94, 16–28. [Google Scholar] [CrossRef]
  124. Wang, J.; Goldschmidt, P. Importance of middle school mathematics on high school students’ mathematics achievement. J. Educ. Res. 2003, 97, 3–17. [Google Scholar] [CrossRef]
  125. Garces, L.M.; Jayakumar, U.M. Dynamic diversity toward a contextual understanding of critical mass. Educ. Res. 2014, 43, 115–124. [Google Scholar] [CrossRef]
  126. Jayakumar, U.M. Why Are All the Black Students Still Sitting Together in the Proverbial College Cafeteria? A Look at Research Informing the Figurative Question Being Taken by the Supreme Court in Fisher; Higher Education Research Institute, UCLA: Los Angeles, CA, USA, 2015. [Google Scholar]
  127. Boston, C.S. The Effects of Belonging and Racial Identity on Urban African American High School Students’ Achievement. J. Urban Learn. Teach. Res. 2017, 13, 26–33. [Google Scholar]
  128. Faircloth, B.S.; Hamm, J.V. Sense of belonging among high school students representing 4 ethnic groups. J. Youth Adolesc. 2005, 34, 293–309. [Google Scholar] [CrossRef]
  129. Jayakumar, U.M.; Garces, L.M.; Park, J.J. Reclaiming diversity: Advancing the next generation of diversity research toward racial equity. In Higher Education: Handbook of Theory and Research; Paulsen, M.B., Ed.; Springer: Cham, Switzerland, 2018; pp. 11–79. [Google Scholar]
  130. Miller, L.S.; Ozturk, M.D.; Chaves, L. Increasing African American, Latino, and Native American Representation among High Achieving Undergraduates at Selective Colleges and Universities; Institute for the Study of Societal Issues, UC Berkeley: Berkeley, CA, USA, 2005; Available online: https://escholarship.org/uc/item/10s3p1xt (accessed on 31 May 2024).
  131. Murphy, M.C.; Zirkel, S. Race and belonging in school: How anticipated and experienced belonging affect choice, persistence, and performance. Teach. Coll. Rec. 2015, 117, 1–40. [Google Scholar] [CrossRef]
  132. Smalls, C.; White, R.; Chavous, T.; Sellers, R. Racial ideological beliefs and racial discrimination experiences as predictors of academic engagement among African American adolescents. J. Black Psychol. 2007, 33, 299–330. [Google Scholar] [CrossRef]
  133. Egalite, A.J.; Kisida, B. School size and student achievement: A longitudinal analysis. Sch. Eff. Sch. Improv. 2016, 27, 406–417. [Google Scholar] [CrossRef]
  134. Whitehurst, G.J.; Chingos, M.M. Class Size: What Research Says and What It Means for State Policy; Brown Center on Educational Policy at the Brookings Institution: Washington, DC, USA, 2011. [Google Scholar]
  135. Betts, J.; Reuben, K.; Danenberg, A. Equal Resources, Equal Outcomes? The Distribution of School Resources and Student Achievement in California; Public Policy Institute of California Monograph: San Francisco, CA, USA, 2000. [Google Scholar]
  136. Duncombe, C. Unequal Opportunities: Fewer Resources, Worse Outcomes for Students in Schools with Concentrated Poverty; The Commonwealth Institute: Richmond, VA, USA, 2017. [Google Scholar]
  137. Semuels, A. Good School, Rich School; Bad School, Poor School: The Inequality at the Heart of America’s Education System. The Atlantic, 25 August 2016. Available online: https://www.theatlantic.com/business/archive/2016/08/property-taxes-and-unequal-schools/497333/ (accessed on 31 May 2024).
  138. Darensbourg, A.M.; Blake, J.J. Examining the Academic Achievement of Black Adolescents. J. Black Psychol. 2014, 40, 191–212. [Google Scholar] [CrossRef]
  139. Kunjufu, J. To Be Popular or Smart: The Black Peer Group; African American Images: Chicago, IL, USA, 1988. [Google Scholar]
  140. Ryan, A.M. The peer group as a context for the development of young adolescent motivation and achievement. Child Dev. 2001, 72, 1135–1150. [Google Scholar] [CrossRef] [PubMed]
  141. Datnow, A.; Cooper, R. Peer networks of African American students in independent schools: Affirming academic success and racial identity. J. Negro Educ. 1997, 66, 56–72. [Google Scholar] [CrossRef]
  142. Thompson, L.R.; Davis, J. The meaning high-achieving African American males in an urban high school ascribe to mathematics. Urban Rev. 2013, 45, 490–517. [Google Scholar] [CrossRef]
  143. Walker, E.N. Urban high school students’ academic communities and their effects on mathematics success. Am. Educ. Res. J. 2006, 43, 43–73. [Google Scholar] [CrossRef]
  144. Yonezawa, S.; Wells, A.S.; Serna, I. Choosing tracks: “Freedom of choice” in detracking schools. Am. Educ. Res. J. 2002, 39, 37–67. [Google Scholar] [CrossRef]
  145. Gershenson, S.; Hart, C.M.D.; Lindsay, C.A.; Papageorge, N.W. The Long-Run Impacts of Same-Race Teachers; IZA Institute of Labor Economics: Bonn, Germany, 2017. [Google Scholar]
  146. Klopfenstein, K. Beyond test scores: The impact of Black teacher role models on rigorous math taking. Contemp. Econ. Policy 2005, 23, 416–428. [Google Scholar] [CrossRef]
  147. McGrady, P.B.; Reynolds, J.R. Racial mismatch in the classroom: Beyond Black-white differences. Sociol. Educ. 2012, 86, 3–17. [Google Scholar] [CrossRef]
  148. Rice, J.K. The Impact of Teacher Experience: Examining the Evidence and Policy Implications; National Center for Analysis of Longitudinal Data in Education Research: Arlington, VA, USA, 2010. [Google Scholar]
  149. Alexander, M. The New Jim Crow: Mass Incarceration in the Age of Colorblindness; The New Press: New York, NY, USA, 2010. [Google Scholar]
  150. Davis, A.J. Policing the Black Man: Arrest, Prosecution, and Imprisonment; Pantheon Books: New York, NY, USA, 2017. [Google Scholar]
  151. Kendi, I.X. Stamped from the Beginning: The Definitive History of Racist Ideas in America; Bold Type Books: New York, NY, USA, 2016. [Google Scholar]
  152. Rothstein, R. The Color of Law: A Forgotten History of How our Government Segregated America; Liveright Publishing Corporation: New York, NY, USA, 2017. [Google Scholar]
  153. Martin, D.B.; Larnell, G.V. Urban mathematics education. In Handbook of Urban Education; Routledge: London, UK, 2013; pp. 373–393. [Google Scholar]
  154. Henry, M.; Watt, R.; Rosenthal, L.; Shivji, A. The 2017 Annual Homeless Assessment Report (AHAR) to Congress; Issue December; The U.S. Department of Housing and Urban Development: Washington, DC, USA, 2017; pp. 1–94.
  155. Whitman, K.L. Students on the margins-margins: A critical examination of research on African American foster youth in higher education. Urban Educ. Res. Policy Annu. 2016, 4, 47–54. [Google Scholar]
  156. Kurlaender, M.; Reardon, S.F.; Jackson, J. Middle school predictors of high school achievement in three California school districts. In California Dropout Research Project; California Dropout Research Project, University of California: Santa Barbara, CA, USA, 2008. [Google Scholar]
  157. Berry, R.Q., III; McClain., O.L. Contrasting pedagogical styles and their impact on African American students. In Mathematics Teaching, Learning, and Liberation in the Lives of Black Children; Martin, D.B., Ed.; Routledge: New York, NY, USA, 2009; pp. 123–144. [Google Scholar]
  158. Fry, R. How Far behind in Math and Reading Are English Language Learners? Pew Hispanic Center: Miami Beach, FL, USA, 2007. [Google Scholar]
  159. Garcia, E.E.; Lawton, K.; Diniz de Figueiredo, E.H. The Education of English Language Learners in Arizona: A Legacy of Persisting Achievement Gaps in a Restrictive Language Policy Climate. In The Civil Rights Project; 2010. Available online: https://civilrightsproject.ucla.edu/research/k-12-education/language-minority-students/the-education-of-english-language-learners-in-arizona-a-legacy-of-persisting-achievement-gaps-in-a-restrictive-language-policy-climate/garcia-az-ell-gaps-2010.pdf (accessed on 31 May 2024).
  160. Goodrich, J.M.; Thayer, L.; Leiva, S. Evaluating Achievement Gaps Between Monolingual and Multilingual Students. In Educational Researcher; American Educational Research Association (AERA): Washington, DC, USA, 2021; Volume 50, pp. 429–441. [Google Scholar]
  161. Hemphill, F.C.; Vanneman, A.; Rahman, T. Achievement gaps: How Hispanic and White students in public schools perform in mathematics and reading on the National Assessment of Educational Progress. In National Assessment of Educational Progress; National Center for Education Statistics: Washington, DC, USA, 2011. Available online: https://nces.ed.gov/pubsearch/pubsinfo.asp?pubid=2011459 (accessed on 31 May 2024).
  162. Dee, T. The why chromosome: How a teacher’s gender affects boys and girls. Educ. Next 2006, 6, 68–75. [Google Scholar]
  163. Joseph, N.M.; Tyler, A.L.; Howard, N.R.; Akridge, S.L.; Rugo, K.R. The role of socialization in shaping Black girls’ mathematics identity: An analysis of the high school longitudinal study 2009. Teach. Coll. Rec. 2020, 122, 1–34. [Google Scholar] [CrossRef]
  164. Gholson, M.L.; Wilkes, C.E. (Mis)Taken Identities: Reclaiming Identities of the “Collective Black” in Mathematics Education Research through an Exercise in Black Specificity; American Educational Research Association (AERA): Washington, DC, USA, 2017. [Google Scholar]
  165. Edley, C. At Cal State, Algebra Is a Civil Rights Issue. EdSource. June 2017. Available online: https://edsource.org/2017/at-cal-state-Algebra-is-a-civil-rights-issue/582950 (accessed on 31 May 2024).
  166. Moses, R.P.; Cobb, C.E. Radical Equations: Civil Rights from Mississippi to the Algebra Project; Beacon Press: Boston, MA, USA, 2002. [Google Scholar]
  167. Meckler, L.; Rabinowitz, K. Most Teachers Are White, Even as Schools Are More Diverse than Ever. The Washington Post, 27 December 2019. Available online: https://www.washingtonpost.com/graphics/2019/local/education/teacher-diversity/ (accessed on 31 May 2024).
  168. Miller, C.C. Does Teacher Diversity Matter in Student Learning? The New York Times, March 2018. Available online: https://www.nytimes.com/2018/09/10/upshot/teacher-diversity-effect-students-learning.html?auth=login-facebook (accessed on 31 May 2024).
  169. Egalite, A.J.; Kisida, B.; Winters, M.A. Representation in the classroom: The effect of own-race teachers on student achievement. Econ. Educ. Rev. 2015, 45, 44–52. [Google Scholar] [CrossRef]
  170. Foote, M.Q. Stepping out of the classroom: Building teacher knowledge for developing classroom practice. Teach. Educ. Q. 2009, 36, 39–53. [Google Scholar]
  171. González, N.; Moll, L.C.; Amanti, C. (Eds.) Funds of Knowledge: Theorizing Practices in Households, Communities, and Classrooms; Lawrence Erlbaum Associates Publishers: Mahwah, NJ, USA, 2005. [Google Scholar]
  172. Ladson-Billings, G. But that’s just good teaching! The case for culturally relevant pedagogy. Theory Into Pract. 1995, 34, 159–165. [Google Scholar] [CrossRef]
  173. Tate, W.F. Returning to the root: A culturally relevant approach to mathematics pedagogy. Theory Into Pract. 1995, 34, 166–173. [Google Scholar] [CrossRef]
  174. Yosso, T.J. Whose culture has capital? A critical race theory discussion of community cultural wealth. Race Ethn. Educ. 2005, 1, 69–91. [Google Scholar] [CrossRef]
  175. Aguirre, J.M.; del Rosario Zavala, M. Making culturally responsive mathematics teaching explicit: A lesson analysis tool. Pedagog. Int. J. 2013, 8, 163–190. [Google Scholar] [CrossRef]
  176. Gay, G. Culturally Responsive Teaching: Theory, Research, and Practice; Teachers College Press: New York, NY, USA, 2000. [Google Scholar]
  177. Leonard, J.; Brooks, W.; Barnes-Johnson, J.; Berry, R.Q., III. The nuances and complexities of teaching mathematics for cultural relevance and social justice. J. Teach. Educ. 2010, 61, 261–270. [Google Scholar] [CrossRef]
  178. Paris, D. Culturally sustaining pedagogy, a needed change in stance, terminology, and practice. Educ. Res. 2012, 41, 93–97. [Google Scholar] [CrossRef]
  179. Gutierrez, R. Why (urban) mathematics teachers need political knowledge. J. Urban Math. Educ. 2013, 6, 7–19. [Google Scholar] [CrossRef]
  180. Martin, D.B. Beyond missionaries or cannibals: Who should teach mathematics to African American children? High Sch. J. 2007, 91, 6–28. [Google Scholar] [CrossRef]
  181. Daro, P.; Asturias, H. Branching Out: Designing High School Mathematics Pathways with Equity in Mind; Just Equations, Inc.: Oakland, CA, USA, 2019. [Google Scholar]
  182. Darling-Hammond, L.; French, J.; Garcia-Lopez, S.P. (Eds.) Learning to Teach for Social Justice; Teachers College Press: New York, NY, USA, 2002. [Google Scholar]
  183. Gutstein, E. Teaching and learning mathematics for social justice in an urban, Latino school. J. Res. Math. Educ. 2003, 34, 37–73. [Google Scholar] [CrossRef]
  184. Nasir, N.S.; Cobb, P. (Eds.) Improving Access to Mathematics: Diversity and Equity in the Classroom; Teachers College Press: New York, NY, USA, 2007. [Google Scholar]
  185. Tate, W.F. Race, retrenchment and the reform of school mathematics. In Rethinking Mathematics: Teaching Social Justice by the Numbers; Gutstein, E., Peterson, B., Eds.; Rethinking Schools, Ltd.: Madison, WI, USA, 2013; pp. 42–51. [Google Scholar]
  186. Turner, E.E.; Strawhun, B.T. “With math, it’s like you have more defense”: Students investigate overcrowding at their school. In Rethinking Mathematics: Teaching Social Justice by the Numbers; Gutstein, E., Peterson, B., Eds.; Re-thinking Schools: Milwaukee, WI, USA, 2005; pp. 81–87. [Google Scholar]
  187. Martin, D.B.; McGee, E. Mathematics literacy for liberation: Reframing mathematics education for African-American children. In Culturally Responsive Mathematics Education; Greer, B., Mukhophadhay, S., Nelson-Barber, S., Powell, A., Eds.; Routledge: New York, NY, USA, 2009; pp. 207–238. [Google Scholar]
  188. Nasir, N.S.; Shah, N. On defense: African American males making sense of racialized narratives in mathematics education. J. Afr. Am. Males Educ. 2011, 2, 24–45. [Google Scholar]
  189. Davis, J. Using critical race theory as a pedagogical, theoretical, methodological, and analytical tool in mathematics education for Black students in urban areas. In Critical Race Theory in Mathematics Education; Davis, J., Jett, C., Eds.; Paradigm Publishers: Boulder, CO, USA, 2019; pp. 183–205. [Google Scholar]
  190. Pitts Bannister, V.R.; Davis, J.; Mutegi, J.; Thompson, L.; Lewis, D. “Returning to the root” of the problem: Improving the social conditions of African Americans through science and mathematics education. Catal. Soc. Justice Forum 2017, 7, 5–14. [Google Scholar]
  191. Terry, C.L. Prisons, pipelines, and the president: Developing critical math literacy through participatory action research. J. Afr. Am. Males Educ. 2010, 1, 73–104. [Google Scholar]
  192. Terry, C.L. Mathematical counterstory and African American students: Urban mathematics education from a critical race theory perspective. J. Urban Math. Educ. Teach. Coll. 2011, 3, 73–85. [Google Scholar]
Figure 1. Martin’s Multilevel Framework for Analyzing Mathematics Socialization and Identity Among African Americans [16].
Education 14 00855 g001
Table 1. List of Beyond IM3 courses.
Courses that Count as a Beyond IM3 Course: Prerequisite = Integrated III/Algebra IICourses that Do Not Count as a Beyond IM3 Course:
Precalculus (including honors)Algebra I
Calculus (AP or not)Algebra II
Statistics (AP or not)Geometry
Topics in Discrete MathEdgenuity (EDG) Mathematics
Integrated I
Integrated II
Integrated III
Mathematical Studies
Table 2. High school math graduation requirements by state [61,62].
States that Require 4 (or More) Years of Secondary MathStates that Require 2 or 3 Years of Secondary MathStates that Allow School Districts to Decide
Alabama
Arizona
Arkansas
Delaware
The District of Columbia
Florida
Georgia
Indiana
Kentucky
Louisiana
Maryland
Michigan
Mississippi
New Mexico
North Carolina
Ohio
Rhode Island
South Carolina
Tennessee
West Virginia
Alaska
California
Hawaii
Idaho
Illinois
Iowa
Kansas
Maine
Minnesota
Missouri
Montana
Nebraska
Nevada
New Hampshire
New Jersey
New York
North Dakota
Oklahoma
Oregon
Pennsylvania
South Dakota
Texas
Utah
Virginia
Washington
Wisconsin
Wyoming
Colorado
Connecticut
Massachusetts
Vermont
Table 3. Frequency distribution of individual student-level categorical variables.
VariableValue%N
GenderMale52.40818
Female47.60743
Total 100.001561
English Language Learner (ELL)/Multilingual StudentEnglish Learner8.14127
English Only72.971139
Initially Fluent English Proficient (I-FEP)3.5956
Not Assessed/Special Education0.061
Redesignated Fluent English Proficient15.12236
To Be Determined0.132
Total 100.001561
Student Experiencing HomelessnessNo87.961373
Yes12.04188
Total 100.001561
Foster YouthNo98.211533
Yes1.7928
Total 100.001561
Student Took an Accelerated Math Course in 8th GradeNo74.251159
Yes25.75402
Total 100.001561
Student Earned an “A” in an Accelerated Math Course in 8th GradeNo91.221424
Yes8.78137
Total 100.001561
Table 4. Descriptive statistics—continuous school-level independent variables.
VariableObsMeanStd. Dev.MinMax
Student Enrollment
Total Student Enrollment15611437.46629.73332397
Black Student Enrollment1561168.60105.420322
Overall Student Achievement
Number of Dropouts155614.3012.63038
Number of Students who met UC and/or CSU Standards1556182.33101.329446
Socioeconomic Status
Students Receiving Free and/or Reduced-Price Meals1561932.34458.57141935
Teacher Demographics and Courses Taught
Total Number of Teachers156176.4327.2612117
Number of Math Teachers156111.694.59219
Number of Black Teachers15617.064.88014
Number of Male Teachers156136.0513.52466
Number of Black Math Teachers15610.971.0903
Average Teacher Age156144.912.1938.5750.50
Average Teacher Years of Teaching Experience156115.042.1310.1320.59
Table 5. A linear regression model of the factors that increase Black students’ odds of taking Beyond IM3 coursework.
Model 1Model 2Model 3Model 4Model 5
CoefSECoefSECoefSECoefSECoefSE
Controls
2018–2019 School Year0.8180.1331.629 *0.3920.8430.1470.8010.1351.4820.321
2019–2020 School Year0.7400.1341.627 **0.2620.7370.1380.7490.1361.4270.262
Individual Level—Demographic Characteristics
Gender
(Male)
Female1.660 ***0.179 1.615 ***0.162
English Language Learner Status
(Monolingual English Speaker)
English Language Learner/Multilingual Student1.879 ***0.242 1.564 **0.247
Experiencing Homelessness
(No)
Yes0.388 ***0.068 0.477 ***0.085
Foster Youth
(No)
Yes0.174 **0.108 0.204 *0.137
Individual Level—Middle School Achievement
Accelerated Math Course in 8th Grade
(No)
Yes 2.892 ***0.686 2.639 ***0.594
Earned an “A” in an Accelerated Math Couse in 8th Grade
(No)
Yes 6.108 ***2.023 5.720 ***1.948
School Level—Student Body Characteristics
Student Enrollment 0.997 ***0.001 0.996 **0.001
Black Student Enrollment 1.004 ***0.001 1.0010.003
Number of Students Receiving Free and/or Reduced Price Meals 1.002 ***0.000 1.0010.001
Number of Dropouts 0.946 ***0.009 0.900 ***0.021
Number of Students who met UC and/or CSU Requirements 1.015 ***0.003 1.011 **0.004
School Level—Teacher Characteristics
Number of Teachers 1.0080.0391.0240.038
Number of Male Teachers 1.0180.0481.050 *0.023
Number of Black Teachers 0.9490.0391.1030.068
Number of Math Teachers 0.9680.1381.0690.085
Number of Black Math Teachers 0.9250.1881.4100.285
Average Teacher Age 1.2070.1701.1460.112
Average Years of Teaching Experience 0.771 *0.0880.8920.082
Constant
0.669 **0.1030.370 ***0.0890.5910.2450.0060.0290.0020.006
N15611561155615611556
Note: Logistic Regression coefficients (presented as odds ratios). For categorical variables, reference category in parentheses
* p < 0.05; ** p < 0.01; *** p < 0.001.
Disclaimer/Publisher’s Note: The statements, opinions and data contained in all publications are solely those of the individual author(s) and contributor(s) and not of MDPI and/or the editor(s). MDPI and/or the editor(s) disclaim responsibility for any injury to people or property resulting from any ideas, methods, instructions or products referred to in the content.

