Article

Development and Validation of a Questionnaire on Students’ Mathematics Capital: A Tool to Explore Opportunities in the Mathematics Classroom

1
Department of Mathematics, University of Milan, 20133 Milan, Italy
2
Department of Social Science, University of Milan, 20122 Milan, Italy
*
Author to whom correspondence should be addressed.
Educ. Sci. 2025, 15(4), 510; https://doi.org/10.3390/educsci15040510
Submission received: 25 February 2025 / Revised: 10 April 2025 / Accepted: 16 April 2025 / Published: 18 April 2025

Abstract

:
Understanding students’ opportunities in mathematics education requires tools that capture the social and cultural dimensions shaping their engagement with the subject. One way to conceptualise these opportunities is through the notion of mathematics capital, which encompasses the resources and dispositions that students bring to their mathematical experiences. This study introduces and validates a questionnaire designed to measure secondary students’ mathematics capital, adapting the well-established science capital framework to the mathematical domain. Grounded in Bourdieu’s concept of capital, the questionnaire operationalises mathematics capital across mathematical forms of cultural capital, mathematics-related behaviours and practices, and mathematics-related forms of social capital. The questionnaire was administered to 119 students in an Italian secondary school as part of a broader study on mathematical memes. Statistical analyses, including correlation tests and Cronbach’s alpha, confirm the instrument’s reliability and internal coherence, highlighting the influence of both school and extracurricular environments. The questionnaire provides educators with a practical tool to better understand students’ engagement with mathematics and to inform strategies for fostering equity in mathematics education. By making mathematics capital a measurable construct, this research contributes to discussions on how cultural and social factors shape students’ trajectories in mathematics and beyond.

1. Introduction

1.1. Opportunities in the Mathematics Classroom: Mathematics Capital as a Framework for Equity

The concept of opportunities to learn has been central in educational research for decades. Initially defined in terms of instructional time (Carroll, 1963) and curricular exposure (Husen, 1967), it has evolved to include qualitative aspects such as teaching approaches (Boaler, 2002a) and classroom participation structures (Gresalfi, 2009). This broader perspective acknowledges that learning opportunities are not merely about access to instruction but are shaped by pedagogical practices, social positioning, and the ways students are recognised as capable learners within the classroom. However, disparities in these opportunities contribute to persistent inequalities in mathematics education. The growing concern about these inequalities (Boaler, 2002b; OECD, 2018; Terzi, 2008; Vithal et al., 2024) has driven researchers to examine the structural and social factors that influence students’ opportunities to engage in mathematics. Indeed, Bakker et al. (2021) identify equity, diversity, and inclusion as key future themes in mathematics education research. As Steve Lerman (as cited by Bakker et al., 2021) emphasises, addressing these inequalities requires a comprehensive understanding of how learning opportunities are distributed “in each and every classroom” (p. 12), which is essential for implementing changes.
In this context, Gutiérrez (2012) highlights the importance of students’ identity—shaped by cultural and social backgrounds—as a central axis for achieving equity. While traditional discussions of equity often focus on access and achievement, she argues that a deeper understanding must also consider how students perceive themselves in relation to mathematics and the opportunities available to them based on their cultural and social experiences. Building on this idea, by valuing the knowledge, skills, and dispositions that students develop through their personal and social experiences, educators can better understand the factors influencing engagement and create more inclusive learning environments.
Through a Bourdieusian lens (Bourdieu, 1986), the mathematical knowledge, skills, and dispositions developed by students through personal and social experiences can be conceptualised as mathematics capital (MC), the mathematical instantiation of Bourdieu’s capital. According to Bourdieu, capital exists in different forms and interacts with social structures to shape individuals’ opportunities. Cultural capital refers to knowledge, skills, and dispositions that are valued within specific social fields, which can provide individuals with advantages within society. However, its impact is not solely determined by what an individual possesses but also by how these assets are recognised and legitimised within institutional and societal contexts. Thus, cultural capital does not operate in isolation but is deeply intertwined with social capital—the networks and relationships that provide access to resources, opportunities, and support. The two forms of capital reinforce each other: individuals with high cultural capital often have access to social networks that further enhance their advantages, while strong social connections can facilitate the acquisition and legitimisation of cultural capital. Within fields (i.e., social contexts), relations of privilege or subordination in society are produced through the interaction between capital and habitus (the patterns of thought, behaviour, and perception that shape an individual’s actions).
Bourdieu initially conceptualised cultural capital within the domains of art and literature. Later, he acknowledged the existence of technical and scientific capital in his work (Bourdieu, 2004), but these concepts remained relatively undeveloped and were not fully integrated into his broader theorisation. Since then, scholars such as Archer et al. (2015) have expanded Bourdieu’s framework by introducing the concept of science capital, which integrates cultural and social capital to better capture how access to and engagement with science are shaped by both individual resources and social networks. Their work highlights that students’ opportunities in science education are not only influenced by the knowledge and dispositions they acquire but also by the relationships, role models, and institutional recognitions that legitimise and support their engagement with science. In the context of mathematics, MC reflects the interplay of cultural and social capital in shaping students’ engagement with the subject. Culturally, it includes mathematical knowledge, problem-solving skills, and attitudes, alongside access to resources such as textbooks and digital tools. Socially, it is influenced by networks and interactions, including parental support, teacher encouragement, and the broader cultural value assigned to mathematics. These factors not only shape access to mathematical resources but also influence students’ self-perception as “maths people” and their motivation to engage with the subject. Just as cultural and social capital shape individuals’ positioning in society, MC affects how students perceive mathematics, the opportunities they associate with it, and their educational and professional trajectories.
As noted by Skeggs (2004), the power of a particular form of capital does not stem from its intrinsic value but rather from the process of legitimation within a given field. This process of legitimation is evident in and beyond the classroom: beyond school, Jorgensen Zevenbergen (2011) shows how young retail workers develop numeracy practices well adapted to their work environment, yet these are often dismissed as illegitimate forms of mathematical capital in traditional academic and professional settings. In the classroom, a similar dynamic occurs: certain ways of engaging with mathematics—such as demonstrating fluency in formal procedures—tend to be recognised as valuable, while others—such as intuitive reasoning, creativity or visual approaches—may be overlooked or undervalued (Lockhart, 2009). These dynamics ultimately shape the opportunities students perceive to participate and see themselves as mathematically competent.

1.2. Mathematics Capital, Beliefs, and Subjective Relevance: A Theoretical Distinction

MC offers a perspective distinct from constructs centred on personal perceptions, such as beliefs (Op’t Eynde et al., 2002) or subjective relevance (Chronaki & Kollosche, 2019). On the one hand, beliefs refer to individuals’ convictions about mathematics, shaping their engagement with the subject and influencing their emotional responses to mathematical tasks (Op’t Eynde et al., 2002; Cobb, 1986; Kloosterman, 2002; Schoenfeld, 1989). Beliefs are formed through repeated experiences in educational settings and social interactions, leading to relatively stable dispositions towards mathematics. On the other hand, subjective relevance concerns the meaning students attribute to mathematics through their lived experiences, particularly in relation to their broader identity and perceived societal roles (Chronaki & Kollosche, 2019; Dobie et al., 2021; Kollosche, 2017). It reflects the extent to which mathematics is seen as personally significant or useful beyond the classroom, often mediated by discursive practices and power dynamics within educational institutions.
Beliefs and subjective relevance capture the outcomes of social interactions and educational discourse at an individual level, but they do not account for the underlying structural conditions that shape them. MC, instead, focuses on resources, social networks, and institutional contexts as the structural factors that influence students’ social and educational interactions with mathematics, ultimately shaping their opportunities for engagement with the subject.

1.3. State of the Art, Research Gap, and Research Question

Research agrees on the conceptualisation and relevance of MC, and a number of recent studies (Choudry et al., 2016; Williams & Choudry, 2016; Noyes, 2016; Black & Hernandez-Martinez, 2016; Jorgensen, 2018; Bills & Hunter, 2015) have investigated students’ MC as both a tool for understanding power distribution in educational spaces and a means to explore how mathematics engagement can challenge or reinforce social inequalities. Choudry et al. (2016) explore how peer relationships mediate access to MC in mathematics classrooms, emphasising the role of social networks in shaping students’ opportunities to acquire mathematical knowledge. Williams and Choudry (2016) argue that school mathematics functions as a mechanism for social reproduction, offering privileged access to MC for certain groups while perpetuating existing inequalities. Noyes (2016) critiques the relationship between the “use” and “exchange” value of mathematics education, suggesting that understanding these dynamics can reveal deeper social structures within the classroom. Black and Hernandez-Martinez (2016) focus on the interplay between MC and identity, showing how cultural background and social class influence students’ engagement with mathematics. They argue that students who view mathematics as a status tool may struggle to maintain engagement, whereas those who integrate it into their identity are more likely to persist and succeed. Jorgensen (2018) addresses the experiences of marginalised learners, particularly Indigenous students in Australia, highlighting the need to bridge linguistic and cultural gaps through bilingual education and strength-based pedagogies to foster meaningful engagement with mathematics. Finally, Bills and Hunter (2015) explore culturally responsive teaching for Pāsifika learners in New Zealand, underscoring how aligning classroom practices with students’ cultural contexts can improve both engagement and achievement.
In summary, scholars agree that understanding students’ MC offers valuable insights into how mathematical knowledge, practices, and dispositions gained through personal and social experiences are distributed and accessed in educational contexts. This is crucial for addressing the inequalities that limit some students’ opportunities to engage with mathematics in ways that align with traditional educational expectations. Thus, shedding light on students’ MC could enable educators to better understand how students’ cultural and social identities influence their experiences with mathematics and to identify areas where support is most needed.
However, despite the growing recognition of the importance of MC, the literature lacks a straightforward method to systematically capture and quantify it: to address this challenge, it is crucial to consider both the selection of an appropriate measurement method and the identification of a suitable target school population. As a measurement method, we propose the use of a structured questionnaire producing an MC index, which educators can easily administer to students and interpret. While we acknowledge that reducing a complex and rich concept like MC to a standardised measure inevitably omits some nuances, this trade-off is necessary to build a tool that can be readily implemented in the classrooms. Moreover, questionnaires, unlike other data collection methods such as interviews, can be administered remotely, such as at students’ homes. This enables students to respond in a familiar setting, free from social pressures and direct oversight by researchers or teachers. This methodological choice is not just practical but also aligns with a research paradigm that acknowledges, following Bachelard (1938/2002) and his influence on Bourdieu, that observation itself shapes the phenomenon under study.
Regarding the target population, we focus specifically on secondary students for several reasons. First, this choice aligns with similar studies in the literature (Archer et al., 2015), providing a basis for comparability. Second, students’ MC consolidates as habitus (in the Bourdieusian sense) takes shape, a process requiring time and exposure to cultural and educational experiences. Finally, answering a questionnaire on such a concept demands a level of self-reflection that younger students may not yet possess.
Therefore, the present study describes the process of developing and validating a structured questionnaire to measure secondary students’ MC index, guided by the following research question: how can mathematics capital (MC) be effectively measured in educational contexts?
The results of this research aim to provide a valuable tool for researchers, educators and policymakers who seek to better understand and address the role of MC in shaping educational outcomes. By developing and testing a tailored questionnaire to measure MC, this study contributes to the ongoing effort to create reliable tools that can capture the multifaceted nature of students’ mathematical knowledge, dispositions, and practices, offering a basis for promoting more equitable mathematics education.

2. The Development of the Mathematics Capital Questionnaire

The MC questionnaire presented in this study was developed from the existing questionnaire on science capital, conceived and validated by Archer et al. (2015). The decision to build on a tool already established in the literature grounds in both conceptual and practical considerations. Conceptually, mathematics is “a key part of ‘science’ in the broadest sense” (Black & Hernandez-Martinez, 2016, p. 13), and as such, adapting the general science capital framework to explore students’ MC seems appropriate. Indeed, Black and Hernandez-Martinez (2016) suggest that a shift from the general concept of science capital to a more focused approach on MC is not only acceptable but also necessary. This shift is driven by the need to better capture the role of mathematics, which not only constitutes a fundamental component of scientific knowledge but also acts as a gatekeeper to many STEM careers, shaping students’ opportunities from an early stage. Practically, we account for the constraints imposed by the 12-month project duration and the limited number of students involved (total = 119) in the MeMa study, which frames this research (described in detail in Section 3.1). Thus, building on an existing tool which had already been tested and validated with over 1000 students is the most suitable choice.
Nevertheless, even though we build on a pre-existing questionnaire, the development process is not merely a terminology change but requires a thorough reframing work. This reframing is conducted, ensuring both alignment with Bourdieu’s theoretical aspects of capital (1986), which was foundational to the original questionnaire in the source domain (science), and the linguistic, contextual, and epistemological specificities of the target domain (mathematics). Particular attention is paid to how mathematical identity, interests, and resources differ from those in the broader scientific context.
In the following subsections, we will present the original science capital questionnaire and the new MC questionnaire, outlining the reframing process.

2.1. The Original Science Capital Questionnaire

Archer et al. (2015) provide a conceptual, methodological, and empirical argument for theorising science capital, exploring its potential as both an analytical lens and a survey tool. Their work is grounded on the belief that measuring science capital at scale could provide valuable insights for the science education community, both conceptually and in practice. With this goal, they focused on refining their conceptualisation and developing a practical and generalisable measurement framework, advancing the idea of a science capital index that can complement qualitative research and support broader empirical investigations (Archer et al., 2015). To address this purpose, they conceptualised science capital as a combination of the following elements: scientific forms of cultural capital (such as scientific literacy, science dispositions, and symbolic knowledge about the transferability of science in the labour market), science-related behaviours and practices (e.g., engaging with science media or visiting informal science learning environments like museums), and science-related forms of social capital (e.g., parental scientific knowledge or discussing science with others). Their conceptualisation of science capital encompasses various subsets of cultural and social capital, framed within a Bourdieusian perspective. They view science capital as being mediated by the field and shaped through interactions with personal and family habitus and broader forms of capital, resulting in a set of science-related dispositions within the individual.
Framed within this perspective, Archer et al. developed a 47-item questionnaire (see Supplementary Information in Archer et al., 2015). Through principal components analysis and Cronbach’s alpha, they determined the unidimensionality and internal validity of the survey scales. They identified nine resolvable components: everyday science (media) engagement; future science job affinity (aspirations); “informal” science activities; parental attitudes and practices (including attitudes to science); science teachers and lessons; self-efficacy in science; utility of science in qualifications; valuing museums/museum experiences; and valuing science and scientists. The components emerging from the principal component analysis were weighted according to their theoretical centrality to the notion of science capital. Following statistical refinement, the questionnaire was reduced to 14 key items that best captured science capital. This refined version was later published by Moote et al. (2020) and served as the basis for our work.
The 14-item questionnaire is reported in Table 1, including the item, the science capital dimension, the theoretical aspect, and the response options and weighting.
Since its development, the science capital questionnaire by Archer et al. (2015) has been widely recognised in the research community as a robust instrument for investigating students’ engagement with science and has been referenced in multiple studies exploring science identity and participation (Cohen et al., 2021; DeWitt et al., 2016; Dou & Cian, 2022).
Building on this foundation, Archer, together with Moote et al., extended the framework beyond science education by adapting it to STEM more broadly (Moote et al., 2020). This adaptation of the original questionnaire to a different field acknowledges the applicability of the science capital framework to different disciplinary domains within STEM education. Given this precedent, our reframing of the questionnaire to MC aligns with an already recognised direction in the field, further supporting the validity of our approach.

2.2. The New Mathematics Capital Questionnaire

Following Archer et al. (2015), we conceptualise MC as a mathematics-specific reframing of science capital: MC encompasses mathematical forms of cultural capital (e.g., mathematical reasoning, dispositions towards mathematics, and the perceived transferability of mathematical knowledge in education and work), mathematics-related behaviours and practices (e.g., engagement with mathematics media, participation in extracurricular activities such as maths competitions), and mathematics-related forms of social capital (e.g., parental mathematical knowledge or discussing mathematics with others). As with science capital, MC is shaped by interactions between habitus and field, influencing students’ mathematical dispositions, engagement, and opportunities.
Embracing this conceptualisation, we developed the MC questionnaire by maintaining both the theoretical foundation and the structure of the science capital questionnaire presented in Table 1, while reframing its items to reflect the nature of mathematics. This reframing is structured around three key aspects—linguistic, epistemological, and contextual—with each adjustment carefully designed to preserve the integrity of the original construct while ensuring its relevance to mathematics education.
  • Linguistic adjustments consist of simple changes in terminology, replacing references to science with mathematics. Such terminology shifts ensure that the questionnaire becomes mathematics-specific without altering the nature of the items. Examples include items 1 to 4, item 6, items 10 and 11, and items 13 and 14.
  • Epistemological adjustments are made to better reflect the nature of mathematical reasoning within the items. These adjustments ensure that the focus shifts from empirical validation to logical deduction, which is a core characteristic of mathematical thinking. While the original questionnaire focuses on scientific evidence to produce argumentations (item 5) and the utility of science in daily life (item 12), the reframed version highlights mathematical reasoning, its role in constructing arguments, and its usefulness in everyday life.
  • Contextual adjustments are introduced to align the questionnaire with the educational environment and extracurricular activities relevant to mathematics (items 7 and 8) and to reflect peculiarities of the local school system (items 9 and 10). Specifically, for item 7, the original item focuses on places specifically dedicated to science, while the reframed item concentrates on events exclusively related to mathematics (such as mathematics workshops and conferences). In both cases, the focus is on opportunities that one participates in only if specifically interested in the subject. Concerning item 8, the original item focuses on places that provide a more leisure-oriented experience rather than direct educational interaction with science, like zoos and aquariums. The reframed item concentrates on science outreach events. In both cases, the focus is on experiences that participants engage in for reasons that may extend beyond a specific interest in the subject. For item 9, the original item refers to a type of after-school activity (science clubs) that is not common in the local school context. The reframed item focuses on popular extracurricular activities dedicated to mathematics, like mathematics competitions. This change reflects the reality of the local educational system to which the questionnaire is directed. Similarly, in item 10, a terminology adjustment, from science to mathematics, is combined with a contextual adjustment, from GCSEs to high schools, to align with the local school context.
By implementing these linguistic, epistemological, and contextual adjustments, the MC questionnaire effectively reframes the core ideas of science capital into a mathematics-specific framework. Table 2 outlines the reframing process, showing the original science item and related capital dimension, the corresponding reframed mathematics item and capital dimension, and the specific adjustments made in the reframing. Theoretical aspects, response options and weighting in the new MC questionnaire are identical to those of the original questionnaire as reported in Table 1, thereby yielding item scores that can be interpreted in the same way.

3. Materials and Methods: The Validation of the Mathematics Capital Questionnaire

In this section, we describe the validation process of the MC questionnaire. We first present the experimental setting in which the questionnaire was administered, followed by a description of the sample and the procedures adopted for data collection. We then detail the construction of the MC index and the statistical methods used to assess the validity and internal coherence of the questionnaire.
Building the MC questionnaire by reframing an already well-tested and validated instrument (Archer et al., 2015) has allowed us to bypass a significant part of the item refinement process and iterative piloting, which would have been incompatible with the time constraints of the MeMa project (details in Section 3.1). However, this does not eliminate the need for validation, as it remains crucial to determine whether the reframed questionnaire effectively measures what it is intended to capture. Specifically, the validation process concentrates on construct validity and internal consistency through statistical analyses such as correlation and Cronbach’s alpha.

3.1. Experimental Setting

The MC questionnaire was administered in the Italian version (Appendix A, Table A1) as part of the ongoing research project MeMa (https://mema.unimi.it/, accessed on 17 April 2025), a 12-month (July 2024–June 2025) mixed-method interdisciplinary study involving researchers in mathematics education (the first and second author) and sociology (the third author) at the University of Milan, Italy. The project investigates if and how the creation and discussion of mathematical memes (i.e., Internet memes that carry mathematical content) foster learning and cohesion among secondary school students. The research hypothesis is that mathematical memes present learning opportunities for students who are less engaged in mathematics and less open to learning the subject because they perceive its value to be limited. To identify these students, the concept of MC emerged together with the idea to develop a measuring tool.
The questionnaire was distributed online via LimeSurvey (https://www.limesurvey.org, accessed on 17 April 2025) and completed remotely at home in November 2024 by students participating in the project. It was structured so that each item appeared on a separate page, and while there were no time limits for completion, participants were unable to return to previous items once an answer had been submitted. This design choice aimed to minimise potential retrospective modifications and ensure more spontaneous responses. A small number of students submitted the questionnaire more than once; in such cases, only the response with the earliest timestamp was retained for analysis to ensure data consistency. This study adhered to strict ethical guidelines throughout the data collection process: before collecting data, each participant reviewed and accepted a formal consent form outlining the study’s purpose, their rights, and how their data would be used. Although the questionnaire requested participants’ identifying details (name, surname, class group, gender) needed to triangulate the MC index with observations collected during classroom activities, clear information reassured participants about data confidentiality, and all collected data were pseudonymised to ensure privacy during analyses.

3.2. Sample

The sample of students who answered the questionnaire is composed of 119 secondary school students, attending the same school institution (a mathematics- and science-oriented secondary school in the north of Italy) in five different classes, one belonging to the 9th grade, three to the 11th grade, and one to the 13th grade (Table 3). The sample size corresponds to the entire group of 119 students involved in the project activities. The grades to which the students belong are aligned with those considered by Archer, Moote, et al. in their studies on science capital (Archer et al., 2015; Moote et al., 2020). Students are divided into the five classes almost equally, and males represent the majority with respect to gender (Table 3).

3.3. Measures and Procedures

To process the data, we first calculated the MC index following the process proposed by Archer, Moote, et al. (Archer et al., 2015; Moote et al., 2020). Specifically, we summed the values of each response, obtaining a total ranging from −21 to 29.5. This total was then transformed into a 0–100 scale to enhance interpretability, resulting in the final MC index. Finally, we divided the 0–100 MC index into quartiles, each representing a different level of MC (Table 4). We opted for quartiles (low, medium-low, medium-high, and high) instead of thirds (low, medium, high) as in Archer et al. (2015). This choice was driven by the observation that, with thirds, most students clustered in the middle, reducing the interpretative power of the results. By introducing an additional subdivision, we aimed to better distinguish students with varying levels of MC and provide a more nuanced understanding of how these levels varied across the sample. Indeed, dividing the data into quartiles is a well-established practice in statistical analysis and educational research, as it allows for detailed representation of data distribution and facilitates meaningful comparisons (Langford, 2006). This adjustment to the original procedure aligns our methodology with widely recognised practices in the field, enhancing the robustness of our analysis.
Figure 1 illustrates the distribution of our sample across these MC quartiles. Notably, no students fall within the top quartile (high MC); however, this result aligns with previous findings by Archer et al. (2015), where few participants were observed in the highest levels of science capital. This pattern suggests that such distributions are not unusual in studies of this nature.
To analyse the validity of the MC questionnaire, firstly, the different variables composing the MC index will be described, then the correlations between the variables will be analysed, and lastly, a test of reliability will be conducted.
Specifically, variables will be described in terms of their mean, standard deviation, and range of results. First, the correlations between all the variables will be analysed, followed by the correlations between the variables and both the total MC index and the quartiles in which students are divided (low MC, medium-low MC, and medium-high MC). The aim is to verify that the items included in the index measure the same concept and are therefore positively associated with one another and with students’ MC index. For these steps, scores will be standardised so that they can be comparable. The means of each of the 14 variables composing the index will also be computed with respect to the quartile in which students are divided, to verify whether the variables are well distributed in the various quartiles, so that they can explain well the differences between students grouped differently. Finally, Cronbach’s alpha test of reliability will be computed. Cronbach’s alpha is the most widely used measure of an instrument’s reliability, the ability to measure consistently, as it only requires one test administration (Tavakol & Dennick, 2011), like in our case. Cronbach’s alpha describes the reliability of a sum (or average) of q measurements, where the q measurements represent, among others, questionnaire items (Bonett & Wright, 2015). In this case, Cronbach’s alpha is referred to as a measure of “internal consistency” reliability (Bonett & Wright, 2015), which describes the extent to which all the items measure the same concept or construct (Tavakol & Dennick, 2011). It can therefore be used to confirm whether or not a sample of items is actually unidimensional (Tavakol & Dennick, 2011). There are different reports regarding acceptable values of alpha, which is expressed as a number between 0 and 1, and is generally considered acceptable when ranging from 0.70 to 0.95 (Tavakol & Dennick, 2011).

4. Results

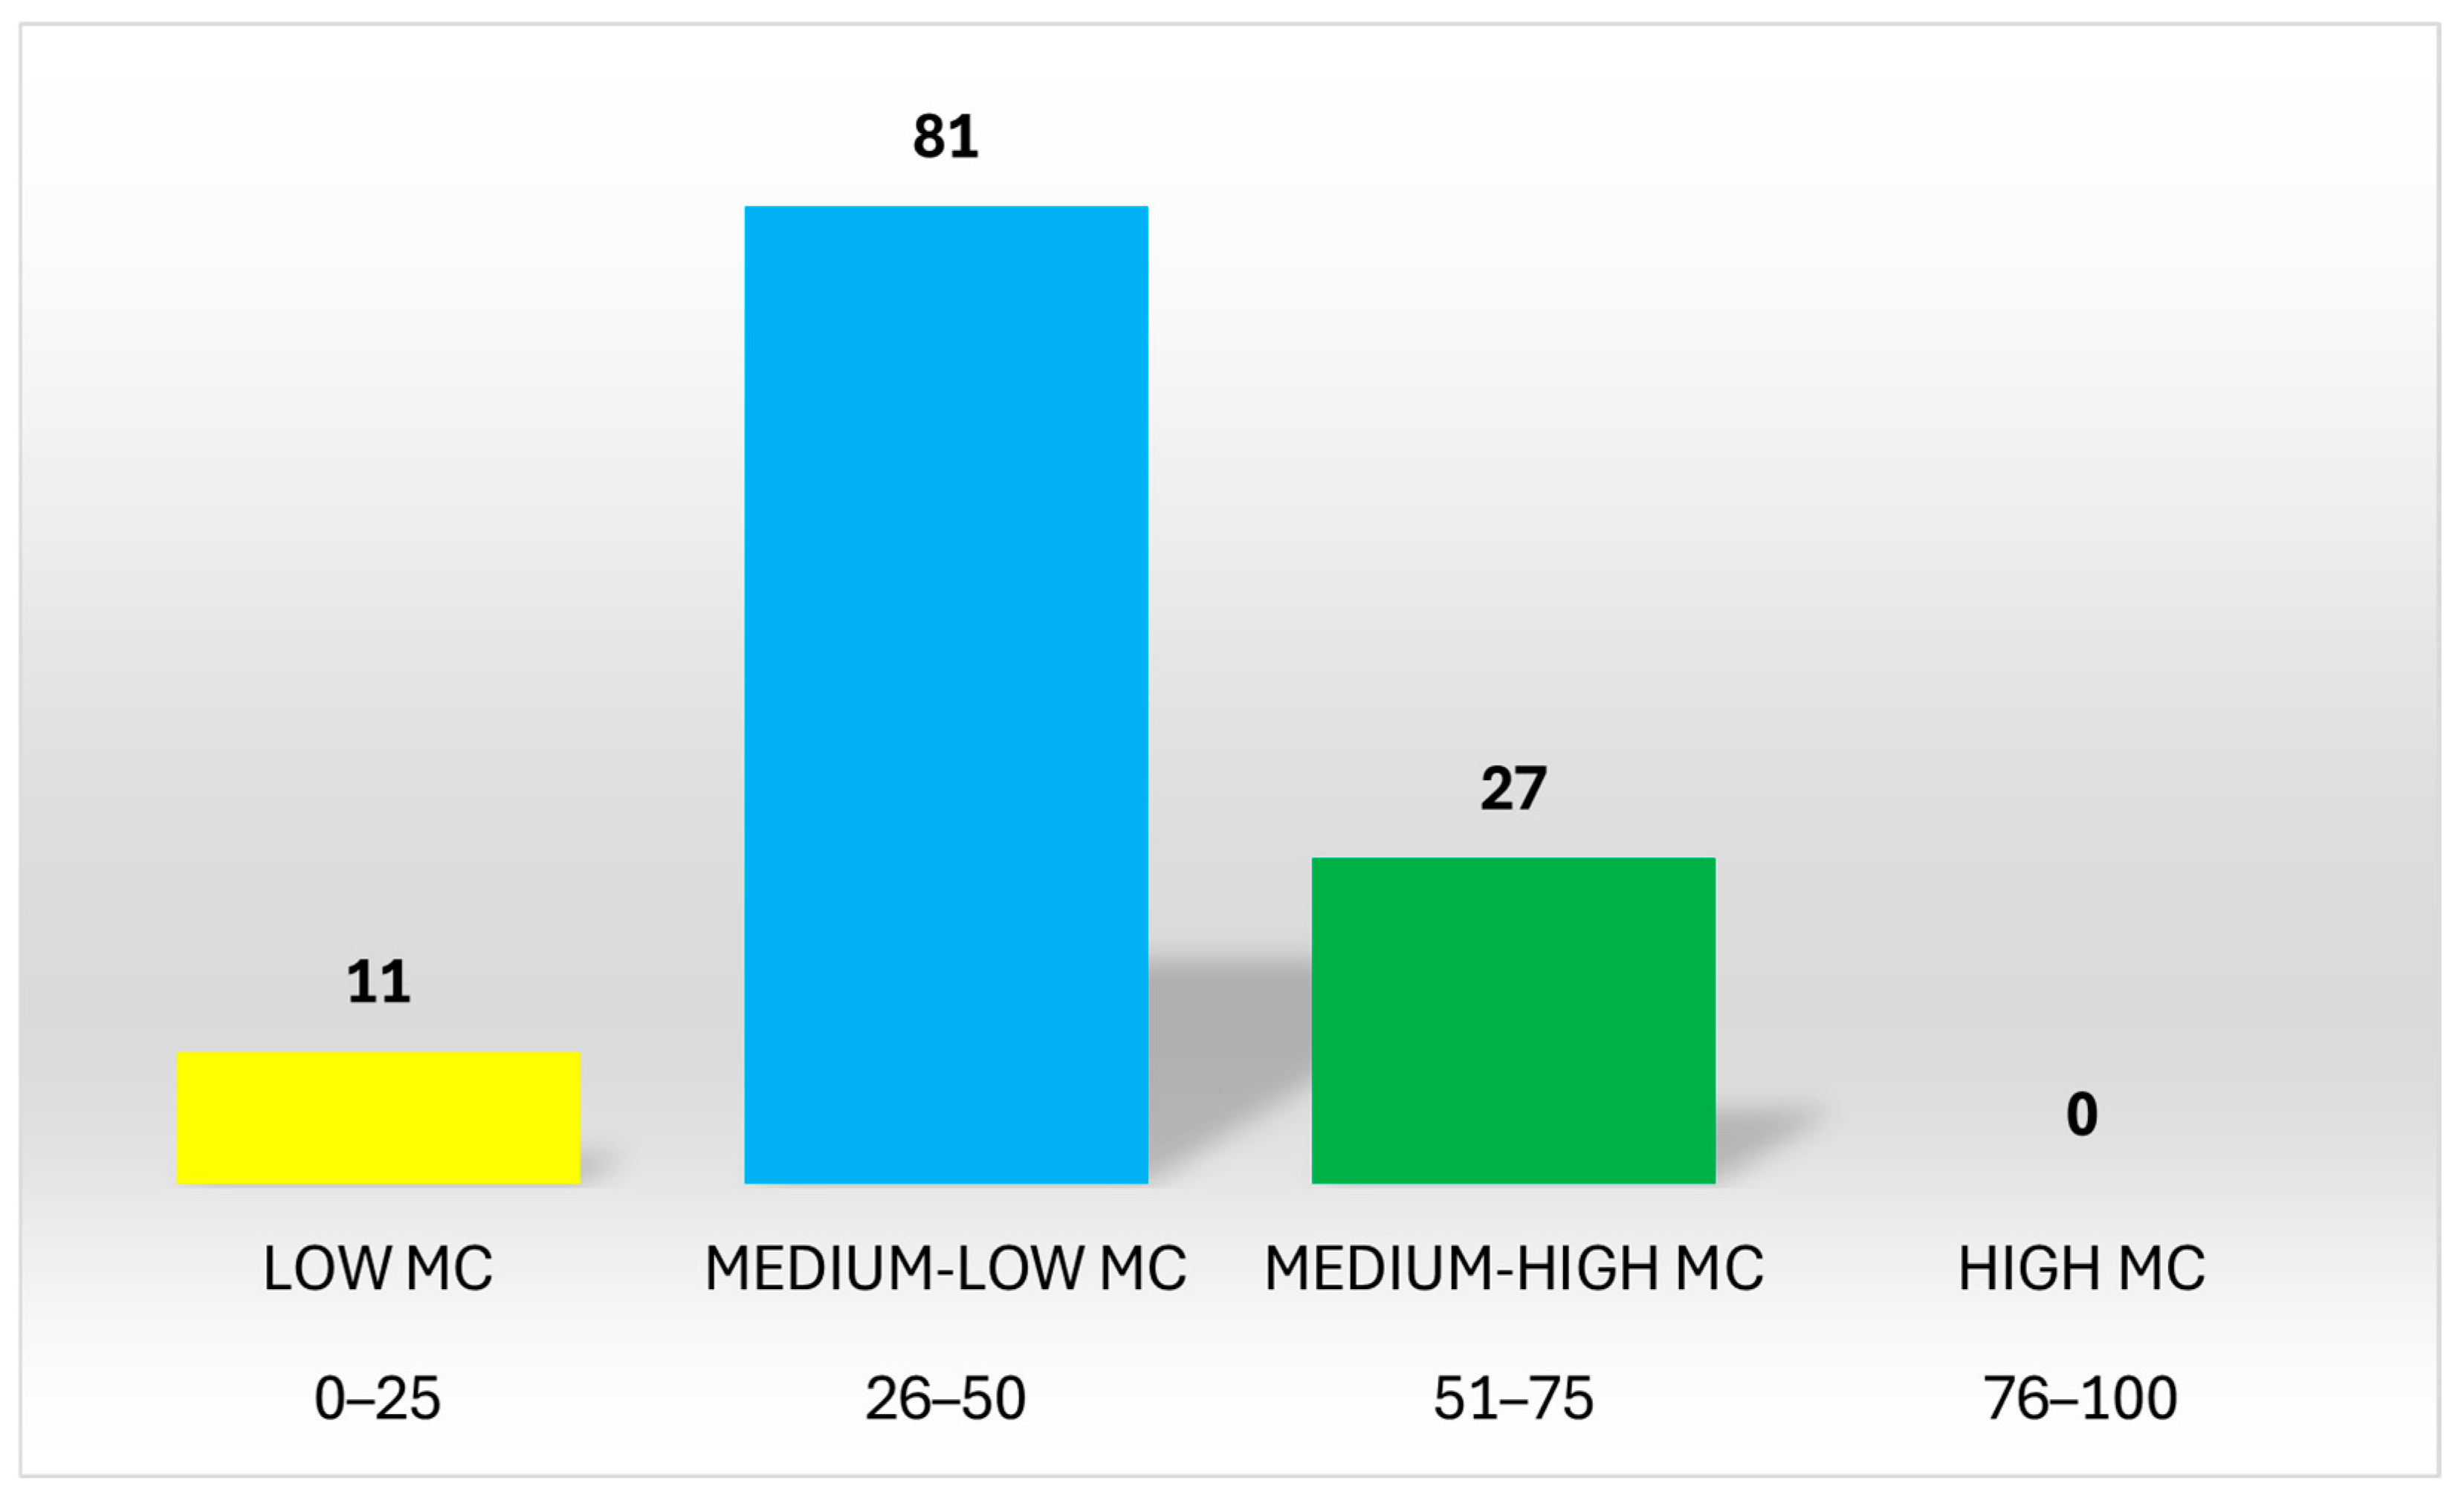
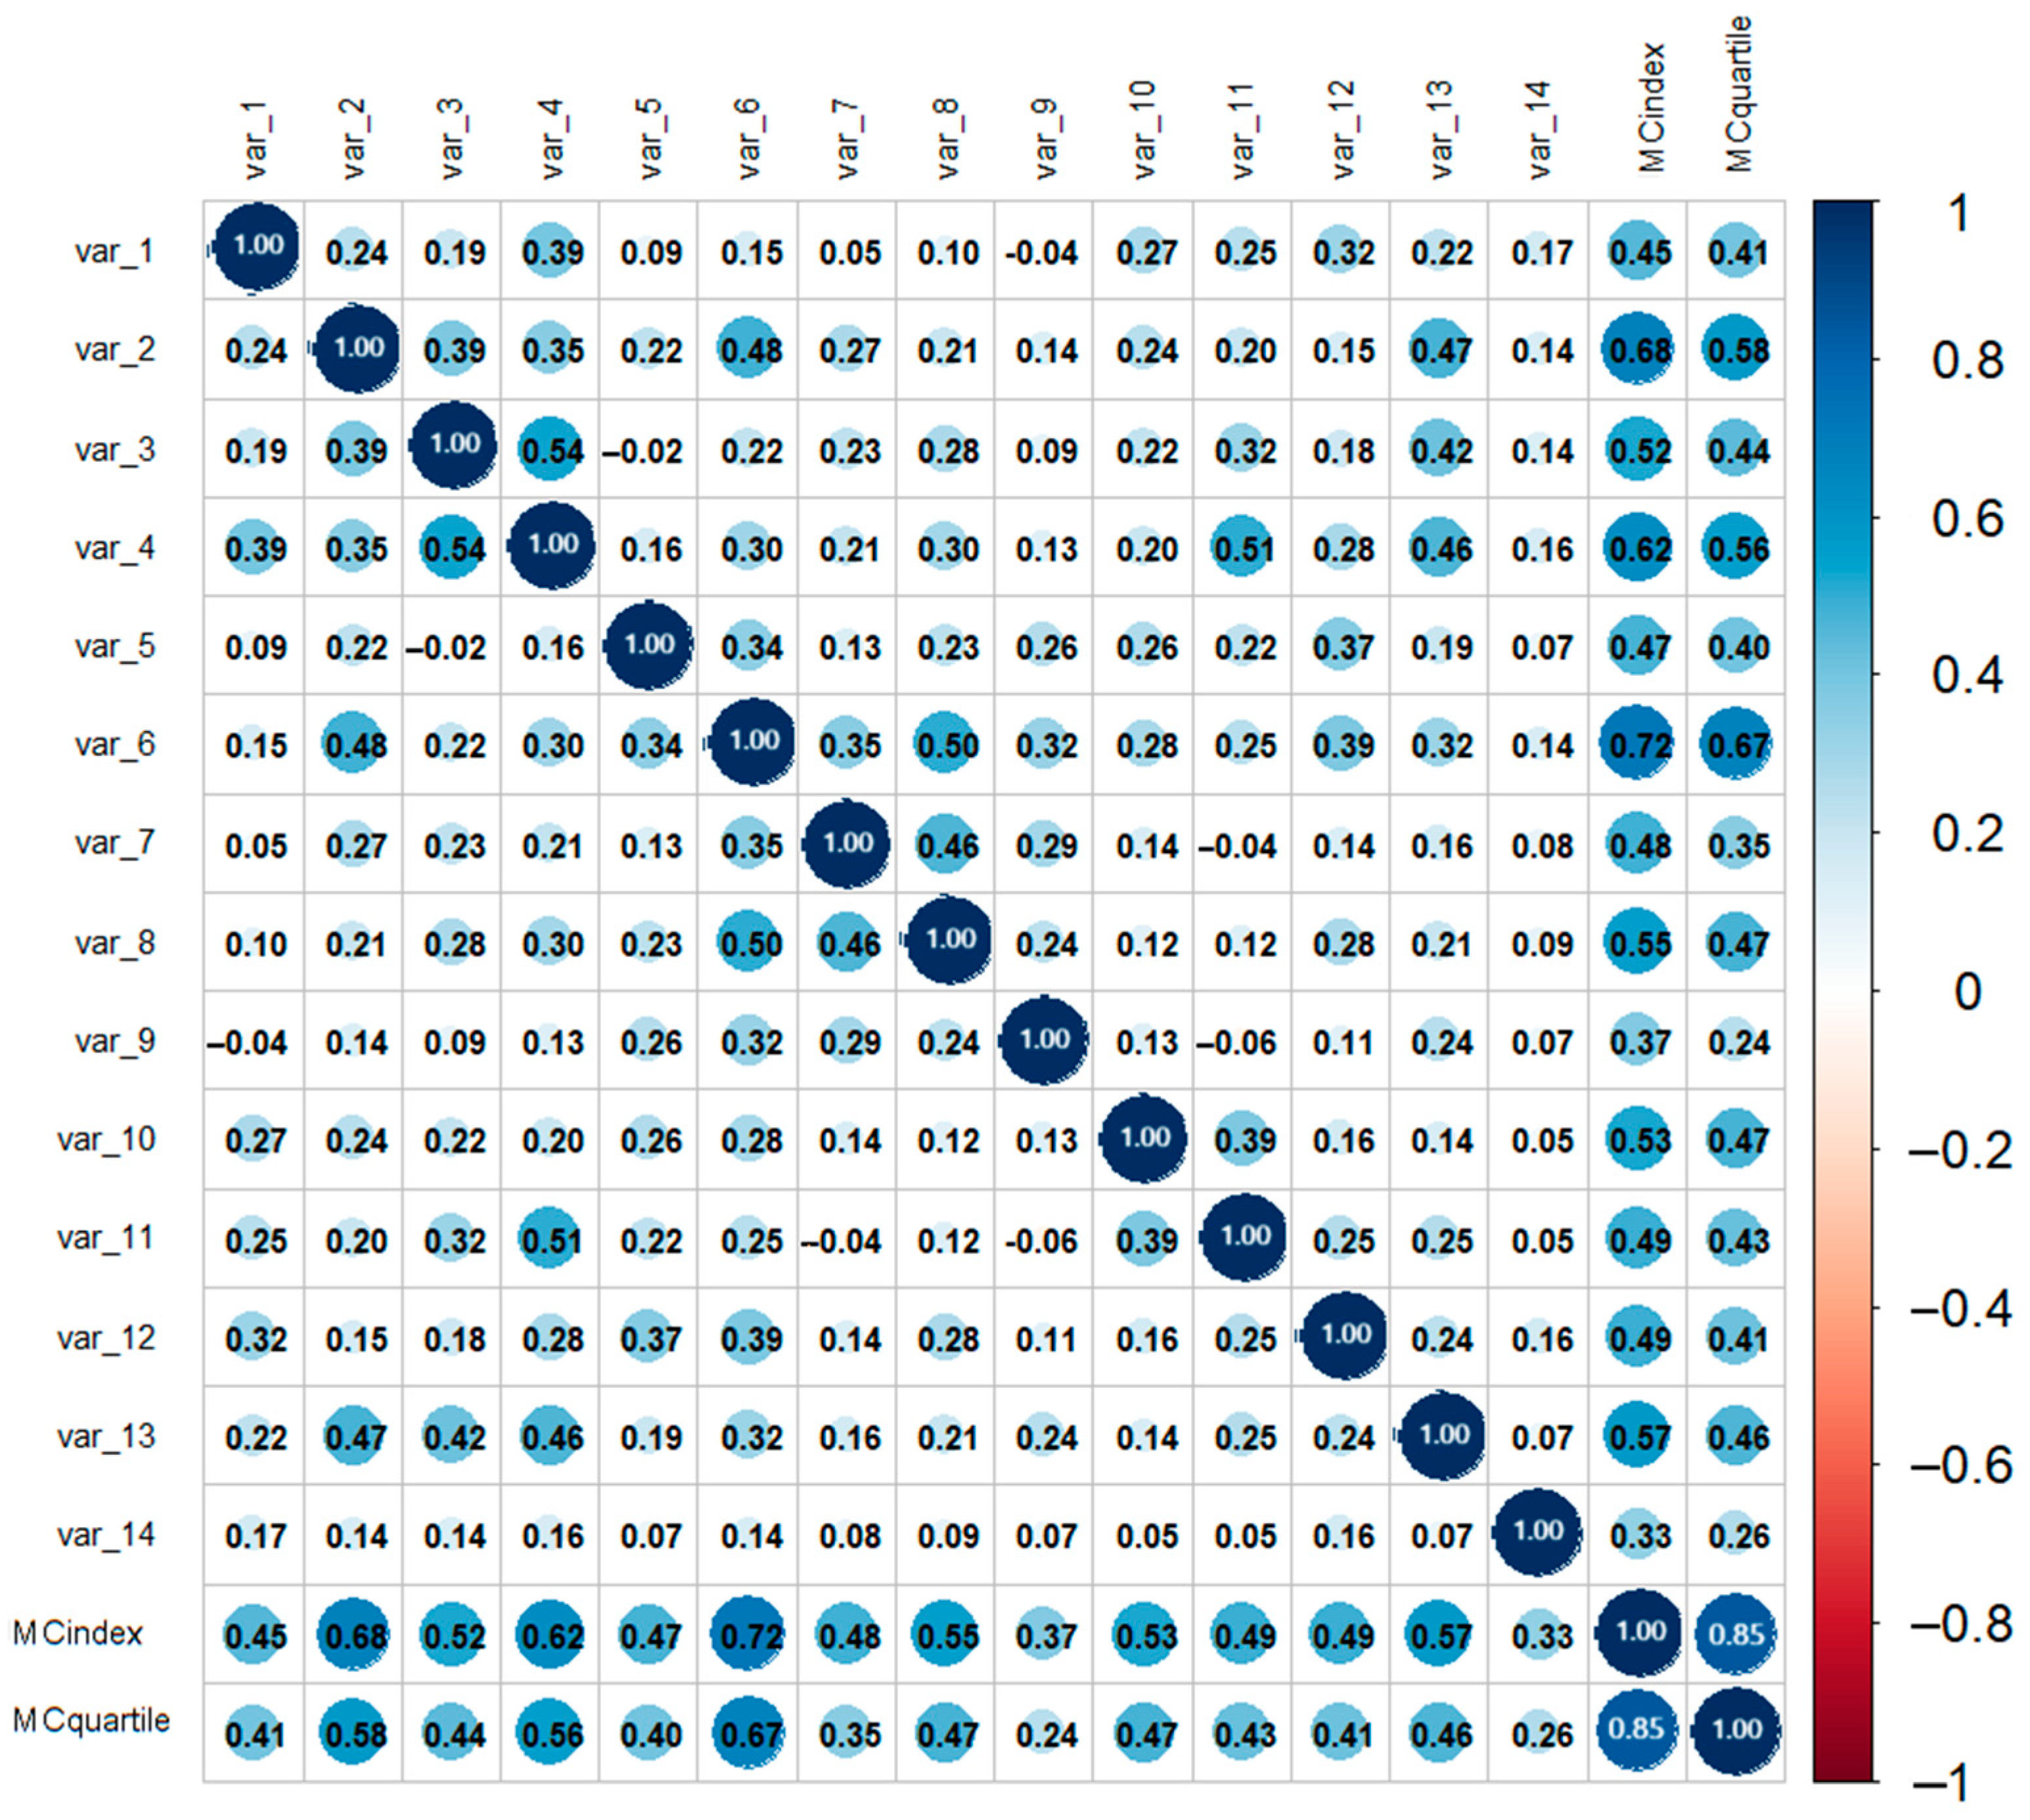
Distribution of the Mathematics Capital Index’s Items and Variables

The following Table 5 reports the distribution of the 14 variables, corresponding to the 14 items of the questionnaire, which contribute to the MC index. In the table, we can see the mean and the standard deviation of each variable, through which we can evaluate how students respond, on average, to the different items and how much their answers vary from each other. In this way, we can evaluate whether our sample’s answers are uniform or discordant. The range of the actual responses was reported to verify whether students’ answers were distributed according to the proposed distribution or, instead, if the extremes of some items were not considered by the sample.
From this distribution, several observations can be made: the high scores’ variability of some variables, the negative means of some of them, and the non-compliant range of scores of some others. Regarding the first observation, some of the variables present a quite high standard deviation, the highest being that of var_2, var_6, var_8, and var_10. It is relevant to remember that the range of the responses goes from −2 to +2 for every variable, a range of five points; thus, a standard deviation of 1.34 (var_2) is not enormous but still remarkable and worth discussing. These specific items relate to students’ behaviour and interests outside school (var_2, var_6, and var_8), and it seems reasonable to think that students’ activities in their free time can vary depending on specific attitudes or family and friends’ influence. Conversely, var_10 relates to teachers’ encouragement to continue studying mathematics, and this result can vary according to teachers’ style of relationship with their students (the sample is composed of students from five different classes) and students’ individual attitudes towards mathematics. In both cases, the great variability between scores does not appear problematic, as it can be attributed to natural differences in teachers’, students’, and families’ attitudes. Second, we note that some variables report a negative mean, specifically var_6, var_7, var_8, var_9, and var_10. Aside from var_10, these variables relate to extracurricular activities that students can choose to engage in during their free time, often encouraged by their families or driven by their interests. The negative means reflect the fact that, generally, students in the sample rarely read books or magazines about mathematics, attend events dedicated to mathematics, visit science events, or participate in extracurricular activities dedicated to mathematics. This fact could also explain the first observation, as the high variability of these items may result from the fact that the few students who engage in such activities represent outliers in the sample. Var_10, again, relates to teachers encouraging students to continue studying mathematics, and the negative mean signifies that students have rarely been encouraged in this sense by their teachers, so that the few that have been represent outliers. Lastly, we note that for some variables, the possible range of scores does not coincide with the actual range of responses. For var_5, the minimum score is −1, while the maximum is +2, meaning that no student has claimed that they absolutely do not know how to use mathematical reasoning to make an argument. Contrarily, no student reported very frequent participation in science events or extracurricular mathematical activities, as the maximum possible score is +2, while the maximum score found in the sample is +1. In this case, students in the sample show relatively consistent behaviour, and they do not report answers for both extremes of the score range. Another variable with a similar result is var_14: in this case, the range of scores goes from 0 to +4, but the mean of the answers is 0.94, with a standard deviation of 0.85, indicating that, generally speaking, students in the sample do not know many people working in the mathematics sector. From the distribution of the 14 variables, we can apprehend some peculiarities of our sample of students: some items’ questions were answered similarly, while for others, the variability is high, probably because of the presence of some outliers. Overall, students answering the questionnaire do not spontaneously attend extracurricular activities dedicated to mathematics, are not, on average, encouraged by their teachers to continue studying the subject and do not know a lot of people working in the sector.
To verify that the 14 items and variables are effectively correlated, providing evidence that they measure the same concept, a correlation matrix was constructed (Figure 2).
Firstly, we note that almost all the relationships between the variables are positive, and that the ones that are negative are basically null. This is the first confirmation that the variables composing the MC index concur in measuring the same concept, in this case, the students’ MC. At the same time, no relationships between variables reach levels that are too high, which would indicate that two variables are measuring the same exact topic and are therefore redundant. We also note that some variables report, on average, lower correlations with the others than the ones reported by others. Var_14, the item Do you know anyone who works in mathematics? Who are they? is the one that presents the lowest correlation with all the other variables, which, in some cases, is almost zero. Other variables that show a general low level of correlation with the others are var_1 (A mathematics qualification can help you get many different types of job) and var_9 (How often do you participate in extracurricular activities dedicated to mathematics? (e.g., maths competitions)). This means that it is possible that, on average, students who obtained high scores on the other variables, and therefore answered positively to the other items, also reported lower scores on these specific three variables, answering negatively or less positively than for the others.
We can gain new insights by adding to the correlation matrix the two variables regarding students’ MC indexes and corresponding MC quartiles (low MC, medium-low MC, medium-high MC; see Table 4, Figure 1). In this way, we can check whether all the variables, and in what amount, contribute to students’ partition into the different MC quartiles. We also considered the possibility of correlating these variables with a specific external variable, as performed by Archer et al. (2015). However, in our case, the only available external variable was students’ end-of-term mathematics grades, which we decided against using. Since these grades are assigned by different teachers and are strongly influenced by the specific class context, they do not represent a neutral or standardised measure, limiting their utility for objective comparison.
From Figure 3, we note that all 14 variables contribute to the computation of students’ MC index, which is a continuous measure. MC quartiles are derived from this index and therefore reflect the same contribution in a simplified form, as they reduce the sum of the scores of the different items into four ordinal groups. The two variables mentioned above, var_9 and var_14, which correlate less than the others with all the variables, are also the ones that correlate less with the index and the quartiles. At the same time, the correlations between them are still positive and far from zero: this means that all the variables, although almost non-correlating or slightly negatively correlated with each other, contribute to students’ MC index and, consequently, subdivision in MC quartiles. This is a confirmation that the instrument used is reliable and that all the items actually measure the same concept.
Before assessing this fact with the Cronbach’s alpha test, we can also look at the means of the 14 variables computed across quartiles in which students are divided to verify in another way whether the variables are well distributed in the various quartiles (Table 6); as no students were assigned to the high quartile based on their MC index, no means are shown for it.
We note that each variable’s mean is well distributed in the three quartiles in which students were divided, as the first quartile presents the lowest mean, the second quartile the intermediate one, and the third the highest. This means that each variable is reliable in measuring one component of students’ MC, as students are distributed in the various quartiles according to each item. This is also true for the variables that present only negative means, as the mean of the third quartile is the one that is nearest to 0, while the mean of the first quartile is the one that is farthest from it. The distances of the three means are more or less wide depending on the different items because the different variables, as shown in Table 5, present a different magnitude of amplitude. The sole variable for which the means per quartile are less diversified, but still in order of size, is, again, var_14, the one concerning whether students’ family members or acquaintances work in the mathematics sector. This item is the one that shows less significant correlations with all the other variables and a minor correlation with the variables representing students’ MC index and their designated MC quartile. At the same time, its mean distribution per quartile is still sequentially related to the expected order of the quartiles’ index ranges, so, as confirmed by the second correlation matrix, var_14, although with a low magnitude, still contributes to measuring students’ MC. With respect to the other variables, this last item does not affect students’ MC index and subdivision in MC quartiles as much as the others, so it contributes less to measuring students’ MC but still presents a contribution and brings another (nuanced) attribute of the concept under study.
Lastly, to effectively verify the reliability of the MC questionnaire, Cronbach’s alpha test was computed (Table 7). As for the correlation matrix, values were standardised.
The coefficient reported is higher than 0.7, which is generally considered the minimum value to evaluate the questionnaire under study as reliable (Tavakol & Dennick, 2011). This result is very similar to the one reported by Archer et al. (2015) in the original science capital paper, where the confidence interval of Cronbach’s alpha ranged from 0.729 to 0.854. We can therefore conclude that the 14 items of the MC questionnaire measure the same concept, providing further evidence of the reliability and internal coherence of the proposed questionnaire.
From this section and all the analyses presented, whether related to the correlations between the 14 items, their distribution, or the reliability test, we find support for the consistency and validity of the MC questionnaire. In particular, the items of the MC questionnaire correlate with each other, indicating that they tend to measure the same concept, namely, students’ MC. At the same time, they also correlate with students’ MC index and their distribution across the four MC quartiles, as shown in both the second correlation matrix (Figure 3) and Table 6. Lastly, Cronbach’s alpha test of reliability for questionnaires confirms the validity of the instrument. This test was presented only at the end of the Results Section as an additional confirmation of the previous analyses and interpretation, since the primary aim of this section was to examine the index items in depth, along with their distribution and correlations.

5. Discussion

Adopting a Bourdieusian lens (Bourdieu, 1986) to explore opportunities in the mathematics classroom, the present study addressed the research question of how mathematics capital (MC) can be effectively measured in educational contexts. The findings provide clear and meaningful answers to this question, confirming the validity and reliability of the MC questionnaire, developed through the reframing of the original science capital questionnaire (Archer et al., 2015), as a tool to capture students’ MC. Our findings align with prior research on MC as a framework for understanding inequalities in mathematics education (Choudry et al., 2016; Williams & Choudry, 2016; Noyes, 2016; Black & Hernandez-Martinez, 2016; Jorgensen, 2018; Bills & Hunter, 2015) and establish a robust methodological foundation for analysing the interplay between students’ mathematical knowledge, skills, and dispositions developed through personal and social experiences. Specifically, our results reinforce the idea that students’ MC is informed by social interactions and institutional structures, as suggested by Choudry et al. (2016) and Black and Hernandez-Martinez (2016). Moreover, our study expands on previous work by providing a systematic and scalable measurement tool, which enables researchers to quantify MC to complement qualitative analyses.
Beyond the overall validation of the questionnaire, a closer look at specific variables offers additional insights into the factors shaping students’ MC.
The low correlation of var_14 (Do you know anyone who works in mathematics?) may reflect different factors: the narrower scope of careers directly associated with mathematics, the relative rarity and lower visibility of mathematics-related professions, and the limited impact of mathematical role models in family environments. Unlike domains such as medicine, geology, or engineering, mathematics has fewer clearly defined career paths, making it less likely that students personally know someone in the domain. Moreover, careers in mathematics tend to be both less common and less visible in everyday life, which might explain why this variable is less associated with other MC indicators, such as personal interest in mathematics or support received from teachers and family. Finally, while exposure to mathematical role models in students’ family environments may provide valuable opportunities, it may not be sufficient on its own to foster deeper engagement with the subject. A particularly striking aspect of this finding is that all students are indeed familiar with at least one type of mathematics-related worker: their teachers. Yet, 68 out of 119 students (57.1%) responded “no” to this question. This suggests that many do not perceive their teachers as professionals working in the field of mathematics, reinforcing the idea that careers in mathematics often lack clear visibility, even within educational settings.
This invites a closer reflection on the role schools play in shaping students’ MC, especially through factors directly connected to the classroom environment. Several teacher-related variables in the questionnaire showed strong correlations with other MC indicators, such as var_10 (My teachers have specifically encouraged me to continue studying mathematics after high school) and var_11 (My teachers have explained to me that mathematics is useful for my future). These findings underscore how the explicit messages conveyed by the teachers and the broader culture of the mathematics classroom can profoundly impact students’ perceptions of mathematics. For instance, students who view mathematics as useful and relevant to their future, often as a result of encouragement from teachers, tend to respond affirmatively to other items in the questionnaire and, consequently, report higher levels of MC. By highlighting the connection between mathematics and students’ aspirations and showing its relevance across diverse future pathways, schools can strengthen students’ confidence, engagement, and overall MC, ultimately broadening their opportunities within the mathematics classroom.
The low correlation of var_6 (When not in school, how often do you read books or magazines about mathematics?) reflects not only the fact that students rarely engage with mathematical reading materials but also the scarcity of such resources and possibly the outdated nature of the examples provided (books or magazines), as the original science capital questionnaire was developed in 2015. In the current media landscape, ten years represent a significant shift: today, a wide range of informal digital resources—such as mathematics content on YouTube, TikTok, or other online platforms—is widely accessible and increasingly relevant to students’ mathematical engagement. In this study, we maintained close alignment with the original structure for validation purposes. However, future revisions of the questionnaire could incorporate these new forms of access to mathematics.
The limited availability of extracurricular opportunities contributes to explaining the negative means observed for several other items, reflecting the role of society in shaping the image of mathematics. This applies in particular to variables such as var_7 (When you are not in school, how often do you go to events dedicated exclusively to mathematics? (e.g., maths conferences, maths workshops)), var_8 (When you are not in school, how often do you visit science events that include mathematics? (e.g., science festivals)), and var_9 (How often do you participate in extracurricular activities dedicated to mathematics? (e.g., maths competitions)). Unlike science, which benefits from widespread popularisation through museums and public events, mathematics is rarely represented in approachable and engaging formats. For example, while many large cities host science museums, the scarcity of mathematics museums or equivalent initiatives is paramount. This lack of opportunities means that participation in extracurricular mathematics activities depends less on students’ personal interests and more on the availability of such offerings. This observation led the first and second authors, as researchers in mathematics education and mathematics graduates, to reflect on their own experiences, realising that they might not have responded differently to these items, regardless of their potential interest or engagement with the subject. The rarity of initiatives for popularising mathematics contrasts with the growing recognition of the importance of making the subject accessible and relatable to broader audiences. As discussed during the recent ICME15 congress in the Popularisation of Mathematics Study Group, efforts to promote mathematics as a positive and engaging discipline through public initiatives are essential for addressing stereotypes and increasing its visibility (Howson & Kahane, 1990; Ernest, 1996). Integrating such efforts into educational systems and public outreach could play a crucial role in addressing disparities in students’ MC by creating environments where mathematics is not only taught but also celebrated and experienced in diverse, meaningful ways.
Finally, a broader look at the overall questionnaire results (Figure 1) reveals that no students fall within the highest quartile of MC, a striking finding given that the sample comes from a science-oriented secondary school. This suggests that even in environments designed to support scientific aspirations, structural and cultural barriers may still limit students’ engagement with mathematics. At the same time, this absence suggests that future studies should include more diverse school contexts to better explore the upper end of the MC spectrum. In particular, it raises questions about how mathematical knowledge and dispositions are legitimised within the classroom. As previously discussed in the introduction, the significance of cultural capital depends on the process through which it is recognised as valuable (Skeggs, 2004). In the context of mathematics education, this suggests that certain forms of engagement—such as proficiency in school-sanctioned problem-solving techniques—may be privileged over others, potentially restricting students’ ability to mobilise their mathematical experiences as a form of MC. This highlights the need to critically examine how mathematics is presented and narrated in school and society, as it directly shapes students’ opportunities and aspirations in the subject.

6. Conclusions

Bourdieu’s theory provides tools to recognise that inequalities in mathematics are not solely the result of natural differences in cognitive abilities but are also rooted in disparities tied to students’ knowledge, skills, and dispositions, which are shaped by their social environment and opportunities. However, Bourdieu’s concept of capital has been criticised as deterministic and overly rigid, suggesting that students from disadvantaged backgrounds are predestined to underperform in academic contexts (Lareau, 2018). Such deterministic views risk reinforcing low expectations among teachers and perpetuating cycles of exclusion.
Embracing these critiques, we argue that it is crucial to view MC not as an innate or fixed characteristic that defines or limits a student. Rather, it should be understood as a dynamic construct that can evolve over time, shaped by experiences, interventions, and opportunities. As highlighted in the introduction, MC differs from other constructs such as beliefs about mathematics, which are generally considered stable cognitive constructs (Op’t Eynde et al., 2002). In contrast, MC (and therefore, the MC index) is dynamic, as it depends on access to resources, social support, and cultural practices related to mathematics, all of which can shift over time. This variability supports the rationale for developing a short questionnaire, allowing for efficient data collection and ensuring that the data can be easily processed and interpreted. By providing a clear and manageable tool to capture snapshots of students’ MC index, the questionnaire enables educators and researchers to monitor changes and adapt interventions effectively to support students. Advocating the dynamic and evolving nature of MC, this study underscores the potential for educational interventions to disrupt these exclusion cycles and foster equitable opportunities for all students. This perspective reinforces the value of future longitudinal studies, which could offer valuable insights into how individuals’ MC develops over time and how it may be influenced by specific educational interventions.
Lastly, while the primary focus of this work is on validating the MC questionnaire, observations conducted during the MeMa project allowed us to put into practice the potential of MC-related insights to explore students’ engagement in the mathematics classroom. Our first observations confirmed that students in the medium-high MC quartiles consistently displayed strong interest and engagement with mathematics, both in traditional problem-solving activities and in non-traditional ones involving mathematical memes. In contrast, students in the medium-low and low MC quartiles exhibited different participation patterns depending on the activity format: during classroom discussions on mathematical memes, they engaged creatively and personally, whereas in discussions centred on traditional mathematical problems, they tended to be remarkably less talkative.
These findings highlight the role of the MC index in identifying students who face greater challenges when engaging with mathematics in ways aligned with traditional educational expectations and who, consequently, have fewer opportunities in traditional learning environments. They also underscore how the social and personal dimensions of MC are related to students’ willingness to engage with mathematics and the critical role of activity design and classroom culture in shaping students’ opportunities to contribute meaningfully. Indeed, these observations support the research hypothesis of the MeMa project that mathematical memes can engage students with low MC, offering alternative entry points into mathematical discourse and expanding the ways in which they can participate in learning activities, ultimately functioning as non-standard educational resources (as in Bini, 2024). Together, the results emphasise the need to foster a positive and supportive school environment, as teachers’ expectations and students’ self-perceptions play a crucial role in shaping educational opportunities and reducing inequalities (Alesina et al., 2024; Schneider & Jackson, 2014).
Although this study demonstrates the robustness of the MC questionnaire, some limitations must be acknowledged. The questionnaire was developed within the specific context of the MeMa project, which had constraints related to time and sample size. Notably, no students in our sample scored in the highest quartile of MC. While this does not compromise the validation process—whose goal is to verify internal coherence and construct validity—it does limit the extent to which results can be generalised. Future studies involving more diverse student populations will be essential to confirm the questionnaire’s ability to capture the full spectrum of MC. Nonetheless, the solid methodological foundation provided by Archer et al. (2015) addressed much of the foundational work in validating the structure and components of the questionnaire. This allowed us to focus on ensuring that the instrument was aligned with the mathematical domain while remaining theoretically grounded and practically applicable.
Ultimately, the MC questionnaire developed and validated in this study offers a practical and reliable way to shed light on how opportunities to engage with mathematics are distributed across diverse student populations. By enabling educators to better understand and address these disparities, it provides a valuable tool for promoting equity in mathematics education and empowering all students to succeed.

Author Contributions

Conceptualization, G.B.; methodology, G.B., S.G.C. and G.Z.; software, G.Z.; validation, G.B., S.G.C. and G.Z.; formal analysis, G.Z.; investigation, G.B. and S.G.C.; resources, G.B. and G.Z.; data curation, G.B. and G.Z.; writing—original draft preparation, G.B., S.G.C. and G.Z; writing—review and editing, G.B., S.G.C. and G.Z.; visualization, G.B. and G.Z.; supervision, G.B.; project administration, G.B.; funding acquisition, G.B. All authors have read and agreed to the published version of the manuscript.

Funding

This research has been conducted within the MeMa research project, funded by the Italian Ministry of University and Research (MUR) under DM 737/2021 and by the “My First SEED Grant” from the University of Milan (Project No. 49851-PSRL324GBINI_01).

Institutional Review Board Statement

This study was conducted in accordance with the Declaration of Helsinki and approved by the Ethics Committee of the University of Milan, Italy (protocol code 98/24, date of approval 24/09/24).

Informed Consent Statement

Informed consent was obtained from all subjects involved in this study.

Data Availability Statement

This study is ongoing; we prefer to restrict the data.

Acknowledgments

The authors express their gratitude to Marta Crippa, scholarship holder in the MeMa project, for her invaluable support in facilitating the research, and to the teachers and students who generously gave their time to participate in the project.

Conflicts of Interest

The authors declare no conflicts of interest.

Abbreviation

The following abbreviation is used in this manuscript:
MCMathematics Capital

Appendix A

Table A1 presents the Italian version of the questionnaire as administered to students.
Table A1. MC questionnaire, Italian version.
ItemResponse Options and Weighting
  • Studiare matematica all’università può aiutarti a trovare diversi tipi di lavoro
-2 fortemente in disaccordo, -1 in disaccordo, 0 indifferente, 1 d’accordo, 2 fortemente d’accordo
2.
Quando NON sei a scuola, quanto spesso parli di matematica con altre persone?
-2 mai, -1 almeno una volta l’anno, 0 almeno 4 volte l’anno, 1 almeno una volta al mese, 2 almeno una volta a settimana
3.
Uno o entrambi i miei genitori pensano che la matematica sia molto interessante
-1 fortemente in disaccordo, -0.5 in disaccordo, 0 indifferente, 0.5 d’accordo, 1 fortemente d’accordo
4.
Uno o entrambi i miei genitori mi hanno spiegato che la matematica è utile per il mio futuro
-1 fortemente in disaccordo, -0.5 in disaccordo, 0 indifferente, 0.5 d’accordo, 1 fortemente d’accordo
5.
So come utilizzare il ragionamento matematico per sostenere un’argomentazione
-2 fortemente in disaccordo, -1 in disaccordo, 0 indifferente, 1 d’accordo, 2 fortemente d’accordo
6.
Quando NON sei a scuola, quanto spesso leggi libri o riviste che parlano di matematica?
-2 mai, -1 almeno una volta l’anno, 0 almeno 4 volte l’anno, 1 almeno una volta al mese, 2 almeno una volta a settimana
7.
Quando NON sei a scuola, quanto spesso partecipi ad eventi dedicati esclusivamente alla matematica? (Es: conferenze di matematica, laboratori matematici)
-2 mai, -1 almeno una volta l’anno, 0 almeno 4 volte l’anno, 1 almeno una volta al mese, almeno una volta a settimana
8.
Quando NON sei a scuola, quanto spesso visiti eventi di divulgazione scientifica che includono la matematica? (Es: festival della scienza)
-2 mai, -1 almeno una volta l’anno, 0 almeno 4 volte l’anno, 1 almeno una volta al mese, almeno una volta a settimana
9.
Quanto spesso partecipi ad attività extracurricolari dedicate alla matematica? (Es: gare matematiche)
-2 mai, -1 almeno una volta l’anno, 0 almeno 4 volte l’anno, 1 almeno una volta al mese, 2 almeno una volta a settimana
10.
I miei insegnanti mi hanno specificamente incoraggiato a continuare a studiare matematica dopo il liceo
-2 fortemente in disaccordo, -1 in disaccordo, 0 indifferente, 1 d’accordo, 2 fortemente d’accordo
11.
I miei insegnanti mi hanno spiegato che la matematica è utile per il mio futuro
-2 fortemente in disaccordo, -1 in disaccordo, 0 indifferente, 1 d’accordo, 2 fortemente d’accordo
12.
Sapere ragionare in modo matematico è utile nella vita quotidiana
-1 fortemente in disaccordo, -0.5 in disaccordo, 0 indifferente, 0.5 d’accordo, 1 fortemente d’accordo
13.
Chi sono le persone con cui parli di matematica?
0.5 genitori o tutori, 0.5 fratelli/sorelle, 0.5 altri famigliari, 0.5 amici, 0.5 scienziati, 0.5 insegnanti, 0.5 altri, 0 nessuno
14.
Conosci qualcuno che lavora nel campo della matematica? Chi è?
2 genitori o tutori, 1 fratelli/sorelle, 1 altri famigliari, 1 altri, 0 nessuno

References

  1. Alesina, A., Carlana, M., La Ferrara, E., & Pinotti, P. (2024). Revealing stereotypes: Evidence from immigrants in schools. American Economic Review, 114(7), 1916–1948. [Google Scholar] [CrossRef]
  2. Archer, L., Dawson, E., DeWitt, J., Seakins, A., & Wong, B. (2015). “Science capital”: A conceptual, methodological, and empirical argument for extending bourdieusian notions of capital beyond the arts. Journal of Research in Science Teaching, 52(7), 922–948. [Google Scholar] [CrossRef]
  3. Bachelard, G. (2002). The formation of the scientific mind: A contribution to a psychoanalysis of objective knowledge (M. McAllester Jones, Trans.). Clinamen Press. Available online: https://www.topoi.net/wp-content/uploads/2012/12/The-Formation-of-the-Scientific-Mind.pdf (accessed on 17 April 2025). (Original work published 1938).
  4. Bakker, A., Cai, J., & Zenger, L. (2021). Future themes of mathematics education research: An international survey before and during the pandemic. Educational Studies in Mathematics, 107(1), 1–24. [Google Scholar] [CrossRef]
  5. Bills, T., & Hunter, R. (2015). The role of cultural capital in creating equity for Pāsifika learners in mathematics. In M. Marshman, V. Geiger, & A. Bennison (Eds.), Mathematics education in the margins (pp. 109–116). MERGA. Available online: https://files.eric.ed.gov/fulltext/ED572423.pdf (accessed on 17 April 2025).
  6. Bini, G. (2024). From the web to the mathematics classroom: Investigating internet phenomena as educational resources in mathematics. In B. Pepin, G. Gueudet, & J. Choppin (Eds.), Handbook of digital resources in mathematics education (pp. 1–32). Springer International Handbooks of Education. Springer. [Google Scholar] [CrossRef]
  7. Black, L., & Hernandez-Martinez, P. (2016). Re-thinking science capital: The role of ‘capital’ and ‘identity’ in mediating students’ engagement with mathematically demanding programmes at university. Teaching Mathematics and Its Applications: An International Journal of the IMA, 35(3), 131–143. [Google Scholar] [CrossRef]
  8. Boaler, J. (2002a). Experiencing school mathematics: Traditional and reform approaches to teaching and their impact on student learning. Routledge. [Google Scholar] [CrossRef]
  9. Boaler, J. (2002b). Learning from teaching: Exploring the relationship between reform curriculum and equity. Journal for Research in Mathematics Education, 33(4), 239–258. [Google Scholar] [CrossRef]
  10. Bonett, D. G., & Wright, T. A. (2015). Cronbach’s alpha reliability. Journal of Organizational Behavior, 36(1), 3–15. [Google Scholar] [CrossRef]
  11. Bourdieu, P. (1986). The forms of capital. In J. Richardson (Ed.), Handbook of theory and research for the sociology of education (pp. 241–258). Greenwood. [Google Scholar]
  12. Bourdieu, P. (2004). Science of science and reflexivity (R. Nice, Trans.). University of Chicago Press and Polity Press. [Google Scholar]
  13. Carroll, J. (1963). A model of school learning. Teachers College Record, 64, 723–733. [Google Scholar] [CrossRef]
  14. Choudry, S., Williams, J., & Black, L. (2016). Peer relations and access to capital in the mathematics classroom: A Bourdieusian social network analysis. British Journal of Sociology of Education, 38(7), 1037–1053. [Google Scholar] [CrossRef]
  15. Chronaki, A., & Kollosche, D. (2019). Refusing mathematics: A discourse theory approach on the politics of identity work. ZDM Mathematics Education, 51(3), 457–468. [Google Scholar] [CrossRef]
  16. Cobb, P. (1986). Contexts, goals, beliefs, and learning mathematics. For the Learning of Mathematics, 6(2), 2–9. Available online: https://www.jstor.org/stable/40247805 (accessed on 17 April 2025).
  17. Cohen, S. M., Hazari, Z., Mahadeo, J., Sonnert, G., & Sadler, P. M. (2021). Examining the effect of early STEM experiences as a form of STEM capital and identity capital on STEM identity: A gender study. Science Education, 105(6), 1126–1150. [Google Scholar] [CrossRef]
  18. DeWitt, J., Archer, L., & Mau, A. (2016). Dimensions of science capital: Exploring its potential for understanding students’ science participation. International Journal of Science Education, 38(16), 2431–2449. [Google Scholar] [CrossRef]
  19. Dobie, T. E., Carlsruh, R., & Aina, D. K., Jr. (2021). Utility in context: A sociohistorical lens for examining students’ conceptions of the usefulness of mathematics. In D. Kollosche (Ed.), Proceedings of the eleventh international mathematics education and society conference (Vol. 2, pp. 414–422). Tredition. [Google Scholar] [CrossRef]
  20. Dou, R., & Cian, H. (2022). Constructing STEM identity: An expanded structural model for STEM identity research. Journal of Research in Science Teaching, 59(3), 458–490. [Google Scholar] [CrossRef]
  21. Ernest, P. (1996). Popularization: Myths, mass media, and modernism. In A. J. Bishop, K. Clements, C. Keitel, J. Kilpatrick, & C. Laborde (Eds.), International handbook of mathematics education (Vol. 4, pp. 785–817). Kluwer International Handbooks of Education. Springer. [Google Scholar] [CrossRef]
  22. Gresalfi, M. S. (2009). Taking up opportunities to learn: Constructing dispositions in mathematics classrooms. The Journal of the Learning Sciences, 18(3), 327–369. [Google Scholar] [CrossRef]
  23. Gutiérrez, R. (2012). Context matters: How should we conceptualize equity in mathematics education? In B. Herbel-Eisenmann, J. Choppin, D. Wagner, & D. Pimm (Eds.), Equity in discourse for mathematics education: Theories, practices, and policies (pp. 17–33). Springer. [Google Scholar] [CrossRef]
  24. Howson, A. G., & Kahane, J.-P. (Eds.). (1990). The popularization of mathematics (Vol. 5). Cambridge University Press. [Google Scholar]
  25. Husen, T. E. (1967). International study of achievement in mathematics: A comparison of twelve systems. John Wiley & Sons. [Google Scholar]
  26. Jorgensen, R. (2018). Building the mathematical capital of marginalised learners of mathematics. ZDM Mathematics Education, 50(6), 987–998. [Google Scholar] [CrossRef]
  27. Jorgensen Zevenbergen, R. (2011). Young workers and their dispositions towards mathematics: Tensions of a mathematical habitus in the retail industry. Educational Studies in Mathematics, 76(1), 87–100. [Google Scholar] [CrossRef]
  28. Kloosterman, P. (2002). Beliefs about mathematics and mathematics learning in the secondary school. In G. C. Leder, E. Pehkonen, & G. Törner (Eds.), Beliefs: A hidden variable in mathematics education? (pp. 247–269) Springer. [Google Scholar] [CrossRef]
  29. Kollosche, D. (2017). A socio-critical analysis of students’ perceptions of mathematics. In H. Straehler-Pohl, N. Bohlmann, & A. Pais (Eds.), The disorder of mathematics education (pp. 173–189). Springer. [Google Scholar] [CrossRef]
  30. Langford, E. (2006). Quartiles in elementary statistics. Journal of Statistics Education, 14(3). [Google Scholar] [CrossRef]
  31. Lareau, A. (2018). Unequal childhoods: Class, race, and family life. University of California Press. [Google Scholar]
  32. Lockhart, P. (2009). A mathematician’s lament: How school cheats us out of our most fascinating and imaginative art form. Bellevue Literary Press. [Google Scholar]
  33. Moote, J., Archer, L., DeWitt, J., & MacLeod, E. (2020). Science capital or STEM capital? Exploring relationships between science capital and technology, engineering, and maths aspirations and attitudes among young people aged 17/18. Journal of Research in Science Teaching, 57(8), 1228–1249. [Google Scholar] [CrossRef]
  34. Noyes, A. (2016). Bringing Bourdieu to mathematics education: A response to Williams and Choudry. Research in Mathematics Education, 18(1), 22–26. [Google Scholar] [CrossRef]
  35. OECD. (2018). Equity in education: Breaking down barriers to social mobility. PISA, OECD Publishing. [Google Scholar] [CrossRef]
  36. Op’t Eynde, P., De Corte, E., & Verschaffel, L. (2002). Framing students’ mathematics-related beliefs. In G. C. Leder, E. Pehkonen, & G. Törner (Eds.), Beliefs: A hidden variable in mathematics education? (Vol. 31, pp. 13–37) Springer. [Google Scholar] [CrossRef]
  37. Schneider, T., & Jackson, M. (Eds.). (2014). Determined to succeed? Performance versus choice in educational attainment. European Sociological Review, 30(3), 410–412. [Google Scholar] [CrossRef]
  38. Schoenfeld, A. H. (1989). Explorations of students’ mathematical beliefs and behavior. Journal for Research in Mathematics Education, 20(4), 338–355. [Google Scholar] [CrossRef]
  39. Skeggs, B. (2004). Class, self, culture. Routledge. [Google Scholar]
  40. Tavakol, M., & Dennick, R. (2011). Making sense of Cronbach’s alpha. International Journal of Medical Education, 2, 53–55. [Google Scholar] [CrossRef] [PubMed]
  41. Terzi, L. (2008). Justice and equality in education. Bloomsbury Publishing. [Google Scholar]
  42. Vithal, R., Brodie, K., & Subbaye, R. (2024). Equity in mathematics education. ZDM Mathematics Education, 56(1), 153–164. [Google Scholar] [CrossRef] [PubMed]
  43. Williams, J., & Choudry, S. (2016). Mathematics capital in the educational field: Bourdieu and beyond. Research in Mathematics Education, 18(1), 3–21. [Google Scholar] [CrossRef]
Figure 1. Distribution of the sample’s MC index across quartiles.
Education 15 00510 g001
Figure 2. Correlation matrix between the items and the corresponding variables of the MC index.
Education 15 00510 g002
Figure 3. Correlation matrix between the variables, the MC index, and the MC quartiles.
Education 15 00510 g003
Table 1. The original science capital questionnaire (Moote et al., 2020).
ItemScience Capital DimensionTheoretical AspectResponse Options and Weighting
  • A science qualification can help you get many different types of job
Knowledge about the transferability of scienceHabitus (disposition)−2 for strongly disagree, −1 for disagree, 0 for neither, 1 for agree, and 2 for strongly agree
2.
When you are NOT in school, how often do you talk about science with other people?
Talking about science in everyday lifeCapital
(social capital)
−2 for never, −1 at least once a year, 0 at least once a term, 1 at least once a month, and 2 at least once a week
3.
One or both of my parents think science is very interesting
Family science skills, knowledge and qualificationsHabitus (disposition)
Capital
(social capital)
−1 for strongly disagree, −0.5 for disagree, 0 for neither, 0.5 for agree, and 1 for strongly agree
4.
One or both of my parents have explained to me that science is useful for my future
Family science skills, knowledge and qualificationsHabitus (disposition)
Capital
(social capital)
−1 for strongly disagree, −0.5 for disagree, 0 for neither, 0.5 for agree, and 1 for strongly agree
5.
I know how to use scientific evidence to make an argument
Scientific literacyCapital
(cultural capital)
−2 for strongly disagree, −1 for disagree, 0 for neither, 1 for agree, and 2 for strongly agree
6.
When not in school, how often do you read books or magazines about science?
Science media consumptionCapital
(cultural capital)
−2 for never, −1 at least once a year, 0 at least once a term, 1 at least once a month, and 2 at least once a week
7.
When not in school, how often do you go to a science centre, science museum, or planetarium?
Participation in out-of-school science learning contextsCapital
(cultural capital)
−2 for never, −1 at least once a year, 0 at least once a term, 1 at least once a month, and 2 at least once a week
8.
When not in school, how often do you visit a zoo or aquarium?
Participation in out-of-school science learning contextsCapital
(cultural capital)
−2 for never, −1 at least once a year, 0 at least once a term, 1 at least once a month, and 2 at least once a week
9.
How often do you go to after school science club?
Participation in out-of-school science learning contextsCapital
(cultural capital)
−2 for never, −1 at least once a year, 0 at least once a term, 1 at least once a month, and 2 at least once a week
10.
My teachers have specifically encouraged me to continue with science after GCSEs.
Science-related attitudes, values and dispositionsHabitus (disposition)
Capital
(social capital)
−2 for strongly disagree, −1 for disagree, 0 for neither, 1 for agree, and 2 for strongly agree
11.
My teachers have explained to me science is useful for my future
Knowledge about the transferability of scienceHabitus (disposition)
Capital
(social capital)
−2 for strongly disagree, −1 for disagree, 0 for neither, 1 for agree, and 2 for strongly agree
12.
It is useful to know about science in my daily life
Science-related attitudes, values and dispositionsHabitus (disposition)−1 for strongly disagree, −0.5 for disagree, 0 for neither, 0.5 for agree, and 1 for strongly agree
13.
Who do you talk to about science? Who are they?
Talking about science in everyday lifeHabitus (disposition)
Capital
(social capital)
0.5 for parents or carers, 0.5 for extended family, 0.5 for friends, 0.5 for siblings, 0.5 for directly with scientists, 0.5 for teachers, 0.5 for other, and 0 for no one
14.
Do you know anyone who works in science? Who are they?
Knowing people in science-related rolesHabitus (disposition)
Capital
(social capital)
2 for parents or carers, 1 for siblings, 1 for extended family members,
and 1 for other
Table 2. Reframing of the science capital questionnaire into the mathematics capital questionnaire.
Science CapitalMathematics CapitalAdjustment
ItemDimensionItemDimension
  • A science qualification can help you get many different types of job
Knowledge about the transferability of science
  • A mathematics qualification can help you get many different types of job
Knowledge about the transferability of mathematicsLinguistic
2.
When you are NOT in school, how often do you talk about science with other people?
Talking about science in everyday life
2.
When you are NOT in school, how often do you talk about mathematics with other people?
Talking about mathematics in everyday lifeLinguistic
3.
One or both of my parents think science is very interesting
Family science skills, knowledge and qualifications
3.
One or both of my parents think mathematics is very interesting
Family mathematics skills, knowledge and qualificationsLinguistic
4.
One or both of my parents have explained to me that science is useful for my future
Family science skills, knowledge and qualifications
4.
One or both of my parents have explained to me that mathematics is useful for my future
Family mathematics skills, knowledge and qualificationsLinguistic
5.
I know how to use scientific evidence to make an argument
Scientific literacy
5.
I know how to use mathematical reasoning to make an argument
Mathematics literacyEpistemological
6.
When not in school, how often do you read books or magazines about science?
Science media consumption
6.
When not in school, how often do you read books or magazines about mathematics?
Mathematics media consumptionLinguistic
7.
When not in school, how often do you go to a science centre, science museum, or planetarium?
Participation in out-of-school science learning contexts
7.
When you are not in school, how often do you go to events dedicated exclusively to mathematics? (e.g., maths conferences, maths workshops)
Participation in out-of-school mathematics learning contextsContextual
8.
When not in school, how often do you visit a zoo or aquarium?
Participation in out-of-school science learning contexts
8.
When you are not in school, how often do you visit science events that include mathematics? (e.g., science festivals)
Participation in out-of-school mathematics learning contextsContextual
9.
How often do you go to after school science club?
Participation in out-of-school science learning contexts
9.
How often do you participate in extracurricular activities dedicated to mathematics? (e.g., maths competitions)
Participation in out-of-school mathematics learning contextsContextual
10.
My teachers have specifically encouraged me to continue with science after GCSEs.
Science-related attitudes, values and dispositions
10.
My teachers have encouraged me to continue studying mathematics after high school
Mathematics-related attitudes, values and dispositionsLinguistic
Contextual
11.
My teachers have explained to me science is useful for my future
Knowledge about the transferability of science
11.
My teachers have explained to me that mathematics is useful for my future
Knowledge about the transferability of mathematicsLinguistic
12.
It is useful to know about science in my daily life
Science-related attitudes, values and dispositions
12.
It is useful to know how to reason mathematically in my daily life
Mathematics-related attitudes, values and dispositionsEpistemological
13.
Who do you talk to about science? Who are they?
Talking about science in everyday life
13.
Who do you talk to about mathematics? Who are they?
Talking about mathematics in everyday lifeLinguistic
14.
Do you know anyone who works in science? Who are they?
Knowing people in science-related roles
14.
Do you know anyone who works in mathematics? Who are they?
Knowing people in mathematics-related rolesLinguistic
Table 3. Demographic features of the sample (total = 119 students).
VariableCategoriesFrequency
Class9th grade24
11th grade—class 126
11th grade—class 220
11th grade—class 323
13th grade26
GenderFemale49
Male69
Prefer not to say1
Table 4. MC index quartiles.
QuartileMC Index Range
Low0–25
Medium-Low25–50
Medium-High50–75
High75–100
Table 5. Distribution of the 14 MC index’s items and variables: mean, standard deviation, range of the actual responses.
ItemVariableMeanSt. DeviationMin.Max.
  • A mathematics qualification can help you get many different types of job
Var_10.680.75−2+2
2.
When you are NOT in school, how often do you talk about mathematics with other people?
Var_20.381.34−2+2
3.
One or both of my parents think mathematics is very interesting
Var_30.440.45−1+1
4.
One or both of my parents have explained to me that mathematics is useful for my future
Var_40.470.42−1+1
5.
I know how to use mathematical reasoning to make an argument
Var_50.520.67−1+2
6.
When not in school, how often do you read books or magazines about mathematics?
Var_6−1.220.99−2+2
7.
When you are not in school, how often do you go to events dedicated exclusively to mathematics? (e.g., maths conferences, maths workshops)
Var_7−1.570.78−2+2
8.
When you are not in school, how often do you visit science events that include mathematics? (e.g., science festivals)
Var_8−1.370.81−2+1
9.
How often do you participate in extracurricular activities dedicated to mathematics? (e.g., maths competitions)
Var_9−1.640.59−2+1
10.
My teachers have specifically encouraged me to continue studying mathematics after high school
Var_10−0.150.99−2+2
11.
My teachers have explained to me that mathematics is useful for my future
Var_110.840.77−2+2
12.
It is useful to know how to reason mathematically in my daily life
Var_120.470.44−1+1
13.
Who do you talk to about mathematics? Who are they?
Var_131.120.630+2.5
14.
Do you know anyone who works in mathematics? Who are they?
Var_140.960.850+4
Table 6. Mean of the MC index variables per quartile.
VariableMean
Low
Quartile
Mean
Medium-Low
Quartile
Mean
Medium-High
Quartile
Mean
High
Quartile
Var_10.270.720.91/
Var_2−1.540.201.41/
Var_300.400.66/
Var_4−0.180.440.73/
Var_5−0.090.440.81/
Var_6−2.00−1.66−0.02/
Var_7−2.00−1.70−1.14/
Var_8−1.90−1.58−0.73/
Var_9−2.00−1.70−1.42/
Var_10−1.36−0.270.47/
Var_11−0.270.701.26/
Var_120.180.390.75/
Var_130.501.061.47/
Var_140.270.310.48/
Table 7. Standardised Cronbach’s alpha for the items of the MC questionnaire.
AlphaConfidence Interval at 95%
0.80.743–0.840
Disclaimer/Publisher’s Note: The statements, opinions and data contained in all publications are solely those of the individual author(s) and contributor(s) and not of MDPI and/or the editor(s). MDPI and/or the editor(s) disclaim responsibility for any injury to people or property resulting from any ideas, methods, instructions or products referred to in the content.

