Article

Evaluating Competency Development and Academic Outcomes: Insights from Six Semesters of Data-Driven Analysis

1
Facultad de Informática, Universidad Politécnica de Madrid, Campus de Montegancedo, Boadilla del Monte, 28040 Madrid, Spain
2
Departamento de Ingeniería Informática y Electrónica, Facultad de Ciencias, Universidad de Cantabria, Santander, 39005 Cantabria, Spain
3
Tecnológico de Monterrey, Institute for the Future of Education, Monterrey 64700, Mexico
4
Tecnológico de Monterrey, School of Engineering and Sciences, Monterrey 06500, Mexico
*
Authors to whom correspondence should be addressed.
Educ. Sci. 2025, 15(4), 513; https://doi.org/10.3390/educsci15040513
Submission received: 13 February 2025 / Revised: 31 March 2025 / Accepted: 11 April 2025 / Published: 20 April 2025
(This article belongs to the Section Curriculum and Instruction)

Abstract

:
Competency-Based Education (CBE) has been widely studied since the 1970s, yet it remains innovative due to its challenges across disciplines and cultures. Tecnológico de Monterrey, a Mexican private institution, implements CBE through its Tec21 model, which emphasizes challenge-based learning to develop disciplinary and transversal skills. Since its launch in 2019, Tec21 has generated extensive data, offering an opportunity to assess its performance and ensure quality. This study analyzes data from six academic semesters in the School of Engineering and Sciences to address key quality assurance questions. First, we evaluate whether initially enrolling in a generic area before selecting a specific program improves long-term student outcomes. Second, we examine competency development, identifying challenges in achieving certain skills and their links to dropout rates and module difficulty. Third, we explore the relationship between final grades, module credit allocation, and Tec weeks to assess curriculum alignment with academic performance. Using data from over 550,000 evaluations of 4500+ students, our analysis provides robust quality metrics. Findings suggest that students who start in generic areas perform better long term and highlight the complex interplay between competencies, module characteristics, and academic success. These insights deepen the understanding of CBE implementation and offer recommendations to improve educational strategies and quality assurance within competency-based frameworks.

1. Introduction

Although Competency-Based Education (CBE) has been studied since the 1970s (Spady, 1977), it is still innovative due to the challenges CBE raises in terms of disciplines and cultures (Liu, 2023; Miço & Cungu, 2023; Sa’dijah et al., 2023). An early work published by Spady (1977) defines CBE as a “data-based, adaptive, performance-oriented set of integrated processes that facilitate, measure, record and certify within the context of flexible time parameters the demonstration of known, explicitly stated, and agreed upon learning outcomes that reflect successful functioning in life roles”. Spady identified six crucial components for creating CBE programs: outcomes, time, instruction, measurement, certification, and program adaptability. Implementing and integrating these components is not straightforward (Spady, 1977), and so most recent research is focused on the design, implementation, measurement, and certification of competencies for specific disciplines (Nursing (Liu, 2023), Maths (Sa’dijah et al., 2023), and Foreign Languages (Rustamov, 2023)), prompting universities with CBE programs to continuously evaluate their performance. Although there is plenty of research in CBE (Liu, 2023; Miço & Cungu, 2023; Olivares et al., 2021; Rustamov, 2023; Sa’dijah et al., 2023; Spady, 1977), little has been carried out for providing insights about competency evaluation from large numbers of data (Vargas et al., 2024).
Tecnológico de Monterrey is a Mexican private institution strongly engaged with the evolution of education and its social impact. It has implemented a new CBE pedagogical model for all its academic programs at the bachelor level. This model, called Tec21 (Olivares et al., 2021), makes use of challenge-based learning to have students acquire knowledge and develop skills in their studied discipline, as well as the soft transversal skills necessary for professional flourishing. Under Tec21, students have several different possibilities for developing competencies, which can be carried out at various levels of proficiency. Further, at the moment of enrollment, students may opt to register into a specific subject or into a generic one. For example, a student may enroll directly, say, in the BSc in Computer Science and Technology, or, instead, she could start in the area of Computer Science and Information Technologies, before choosing one of the specific subjects offered in such an area.
Tec21 was launched in August 2019. Since then, it has been a rich source of information. Tec21 has given rise to a huge data repository containing facts about students, instructors, courses, and their outcomes. This repository comes along with a data dictionary and a data teaser. It has been developed and maintained by both the Living Lab and the Data Hub Center at Tecnológico de Monterrey. Having collected millions of data on student competency assessment, these units have launched a request for research proposals, named “Fostering the Analysis of Competency-based Higher Education”1, calling on the scientific community for help in obtaining a general understanding and an in-depth insight about Tec21’s performance. In this paper, we report on the results of some exploratory research that we conducted as an answer to that call. It is based on data science tools.
The aim of this study is to analyze the outcome of the Tec21 model using part of the dataset made available through the call mentioned above. In particular, we use data collected over six academic semesters in the School of Engineering and Sciences. We aim to provide an insight into three fundamental issues: First, whether delaying the choice of enrolling in a long-term program (going through a generic area instead) is beneficial for students or not. Second, whether there exist sub-competencies that are harder to develop, and, if so, how they relate to dropout and the inherent difficulty of the modules where they are meant to be developed. And, lastly, whether there exists a relation among final grades, the number of credits allocated to a formation unit, and whether a unit is part of a specific shorter training period—called a Tec week—or not.
The remainder of this paper is organized as follows: Section 2 gives an overview of existing analyses of CBE. Next, Section 3 details the materials and methods used in our study, including a comprehensive description of the dataset and the feature engineering processes we carried out in previous data analysis. Then, Section 4 presents the study performed in order to validate our three starting hypotheses and discusses the results. Finally, Section 5 describes the conclusions drawn from our investigation and suggests directions for further research.

2. Related Work

Competency-Based Education has been researched for several decades in higher education (HE). CBE provides a useful model for both curriculum and assessment (Marcotte & Gruppen, 2022). However, critical issues still arise from its implementation and evaluation (Henri et al., 2017). Competency evaluation is one such issue at the core of CBE (Vargas et al., 2024).
The assessment of the competencies acquired by students requires a complex analysis that encompasses multiple factors. Such factors vary depending on the subject, competency, and knowledge area (Henri et al., 2017; Moonen-van Loon et al., 2022). Therefore, some authors have published analyses of students’ competency evaluations for particular competency types (Sánchez-Carracedo et al., 2021; Talamás-Carvajal et al., 2024; Thanachawengsakul & Wannapiroon, 2021) and knowledge areas (Moonen-van Loon et al., 2022; Vargas et al., 2024).
Research on competency evaluation usually involves samples of fewer than 1000 students due to the complexities of evaluating large samples and collecting and processing the results (Rasmussen et al., 2016). For example, Larre-Bolaños-Cacho et al. (2020) analyzed the results of training and evaluating the transversal competencies of 11 engineering students throughout a Data Analytics and Cloud Computing course. Similarly, Sangwan et al. (2022) surveyed 30 freshly graduated engineers about their competencies to propose a set of relevant competencies for 21st-century jobs. Also, the research work carried out by Thanachawengsakul and Wannapiroon (2021) presented a proposal that evaluated the competencies of 30 digital entrepreneurs using an online knowledge repository developed in the same work.
Some authors have proposed competency evaluation methodologies and have also reported results for relatively small datasets. A methodology proposed by Sánchez-Carracedo et al. (2021) evaluated the sustainability competencies of engineering students. The methodology assessed students’ self-perception through a questionnaire with 34 questions posed as statements with a four-point Likert scale representing possible responses. The authors collected 221 answers from Informatics Engineering students, finding differences between the students’ improvement perception among different sustainability competencies.
Navarro et al. (2023) analyzed some transversal competencies of 23 Master’s students in Civil Engineering Planning and Management through a sustainability-related case study. The authors proposed and used a methodology based on case studies to assess students’ competencies through the students’ judgments in the field of sustainable design.
Vargas et al. (2024) published a tool that implements a competency assessment framework, facilitating learning analysis and course monitoring. Such a framework implements formulas for evaluating students’ competencies. As a result, it aids professors in assigning traditional numeric and competency evaluations. However, it creates a correlation between the numerical and competency evaluations that need to be analyzed and corroborated with additional studies.
Two research works have analyzed large datasets about competency evaluations, but in a knowledge area different to engineering (Moonen-van Loon et al., 2022; Talamás-Carvajal et al., 2024). Moonen-van Loon et al. (2022) used text-mining techniques to analyze the narrative data of the competency-based portfolios of 1500 students on a Master’s program in Medicine. They implemented topic modeling and sentiment analysis algorithms. Also, Talamás-Carvajal et al. (2024) published a descriptive and correlational analysis of the complex thinking competencies of HE students. The authors used a dataset with 15,903 records corresponding to the evaluations of competencies and their components (sub-competencies). The authors found that critical thinking is crucial in developing complex thinking and some of its components such as scientific thinking and systemic thinking. This work isolated the competency evaluation from the traditional numeric evaluation.
Most of these research works separated the competency evaluation from the traditional numeric evaluation (Larre-Bolaños-Cacho et al., 2020; Navarro et al., 2023; Sangwan et al., 2022; Sánchez-Carracedo et al., 2021; Talamás-Carvajal et al., 2024; Thanachawengsakul & Wannapiroon, 2021). However, analyzing both the traditional numeric evaluation and its corresponding competency evaluation provided by the same professor bridges the gap between both evaluation approaches. Furthermore, having larger datasets with thousands of competency evaluations about multiple students, academic programs, and professors in various semesters and cohorts avoids biases and provides valuable insights about competency evaluation.

3. Materials and Methods

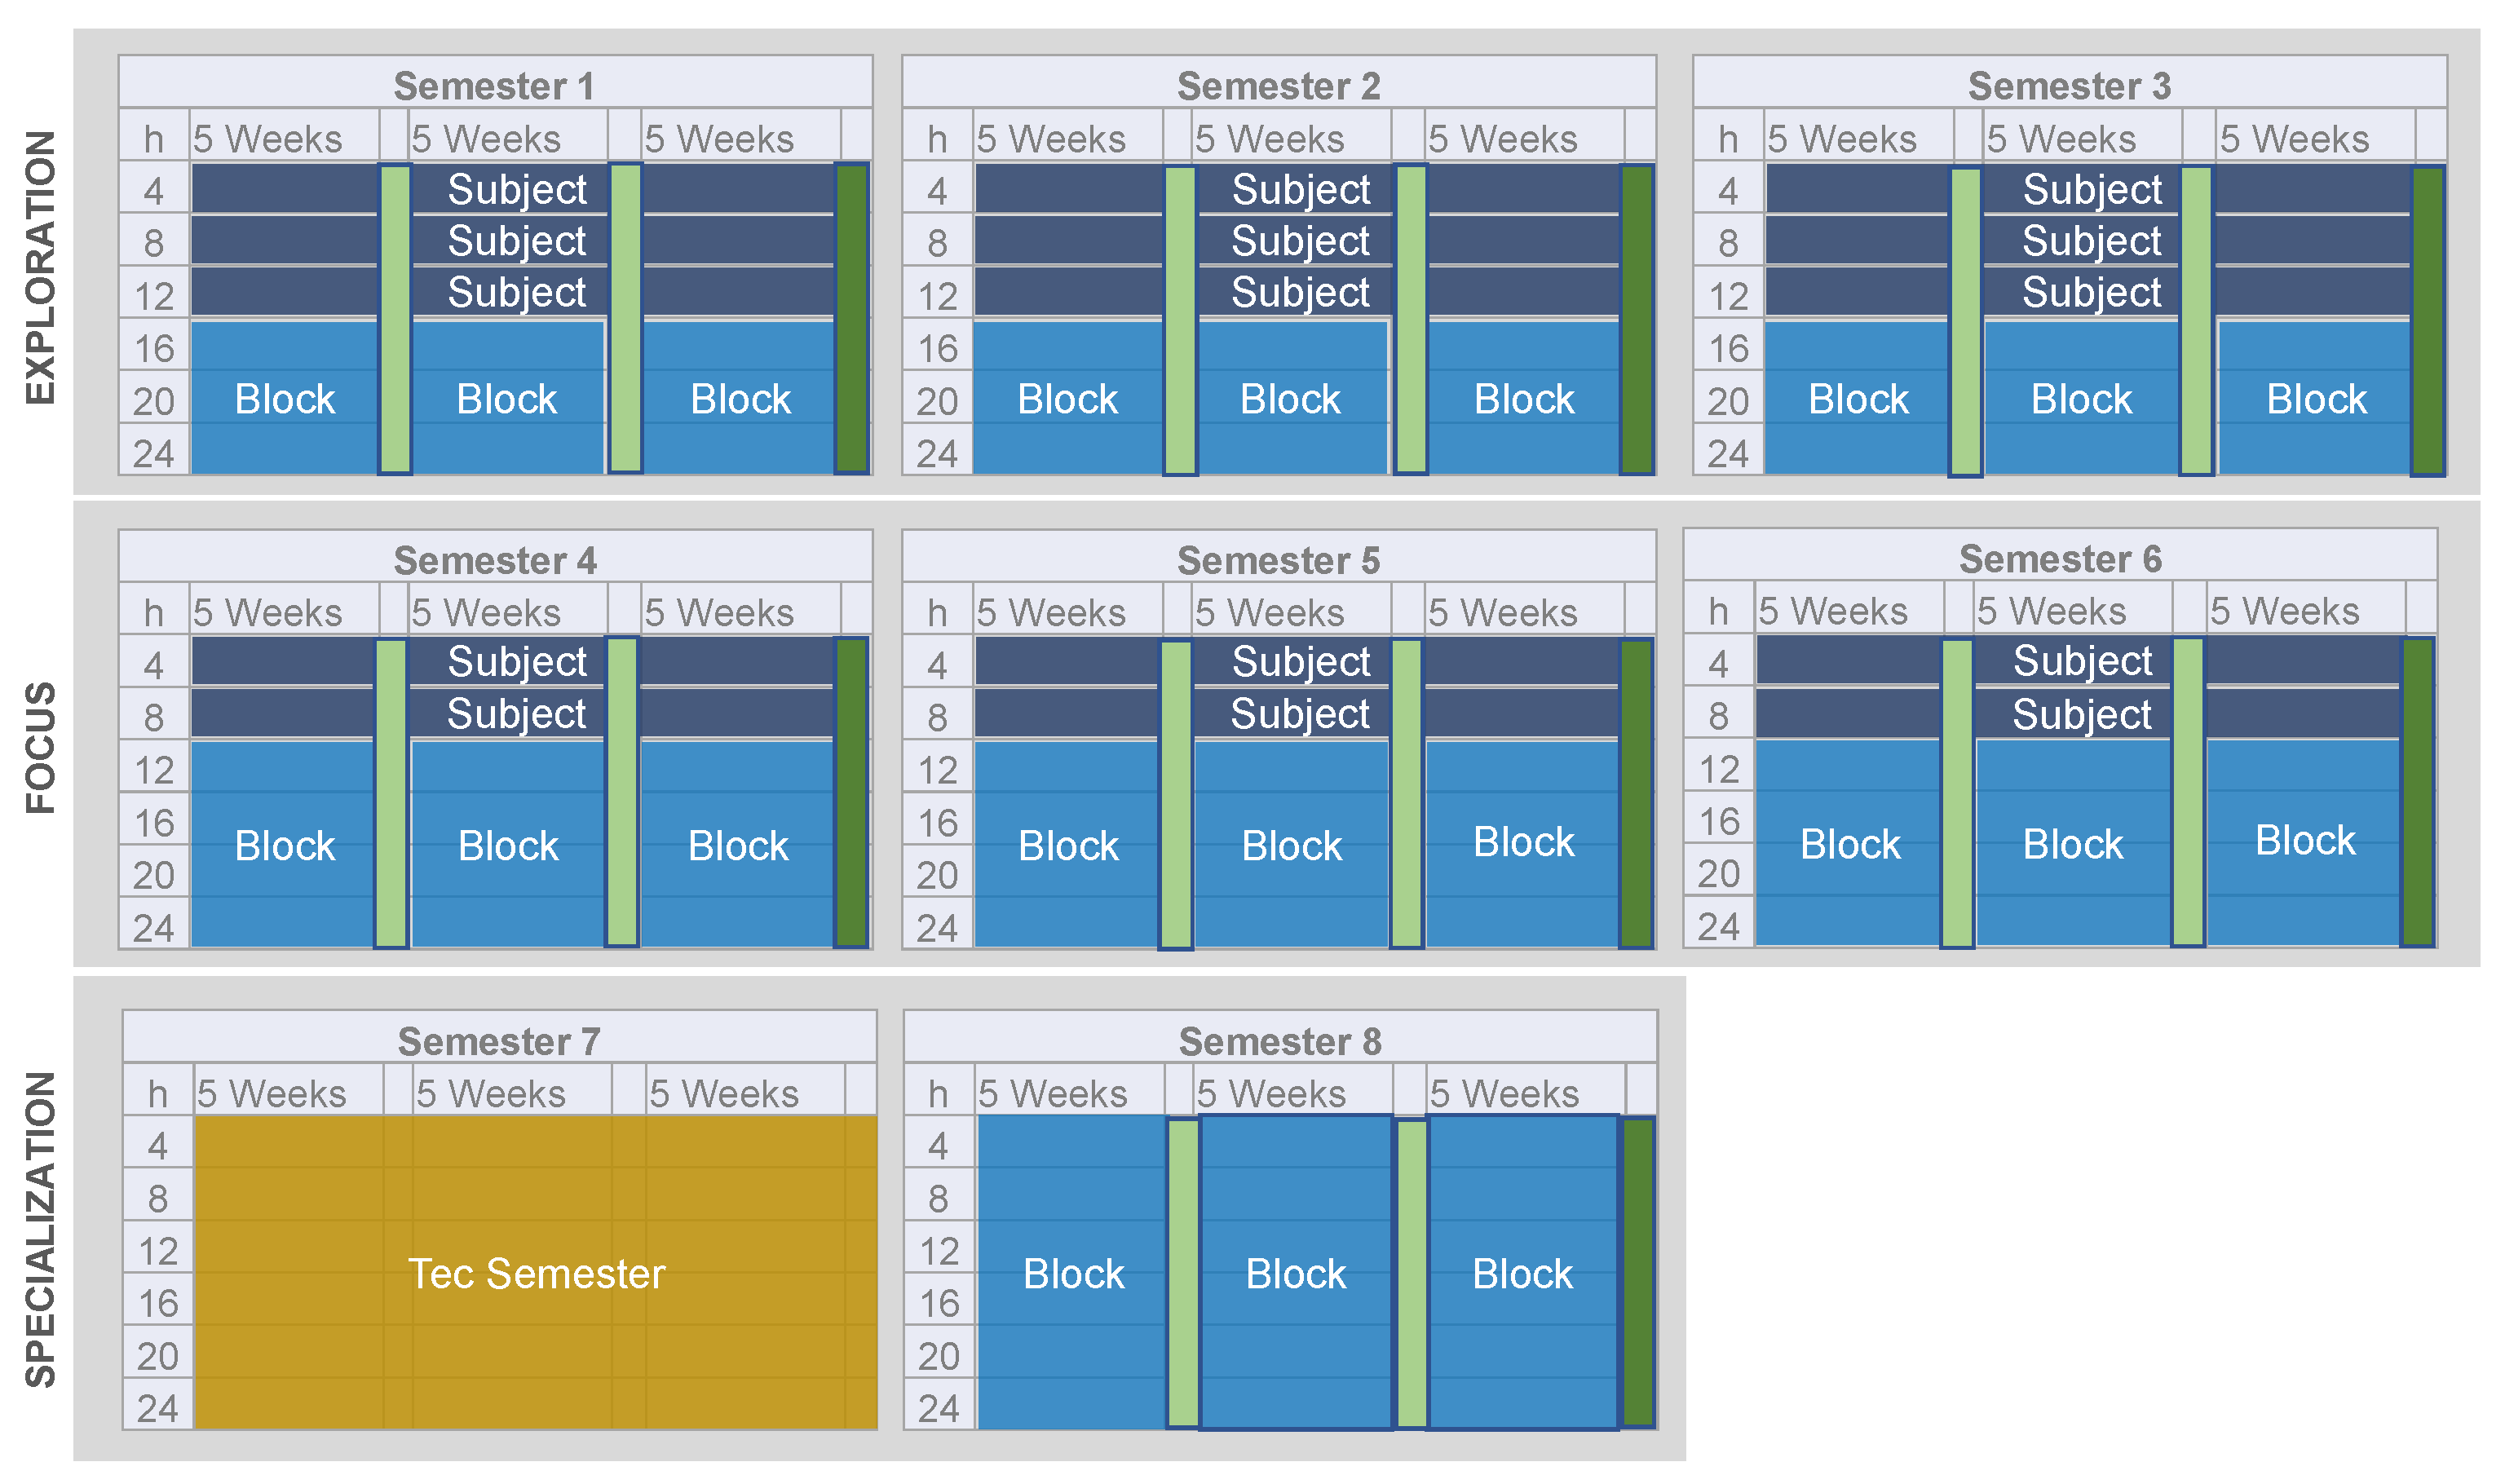
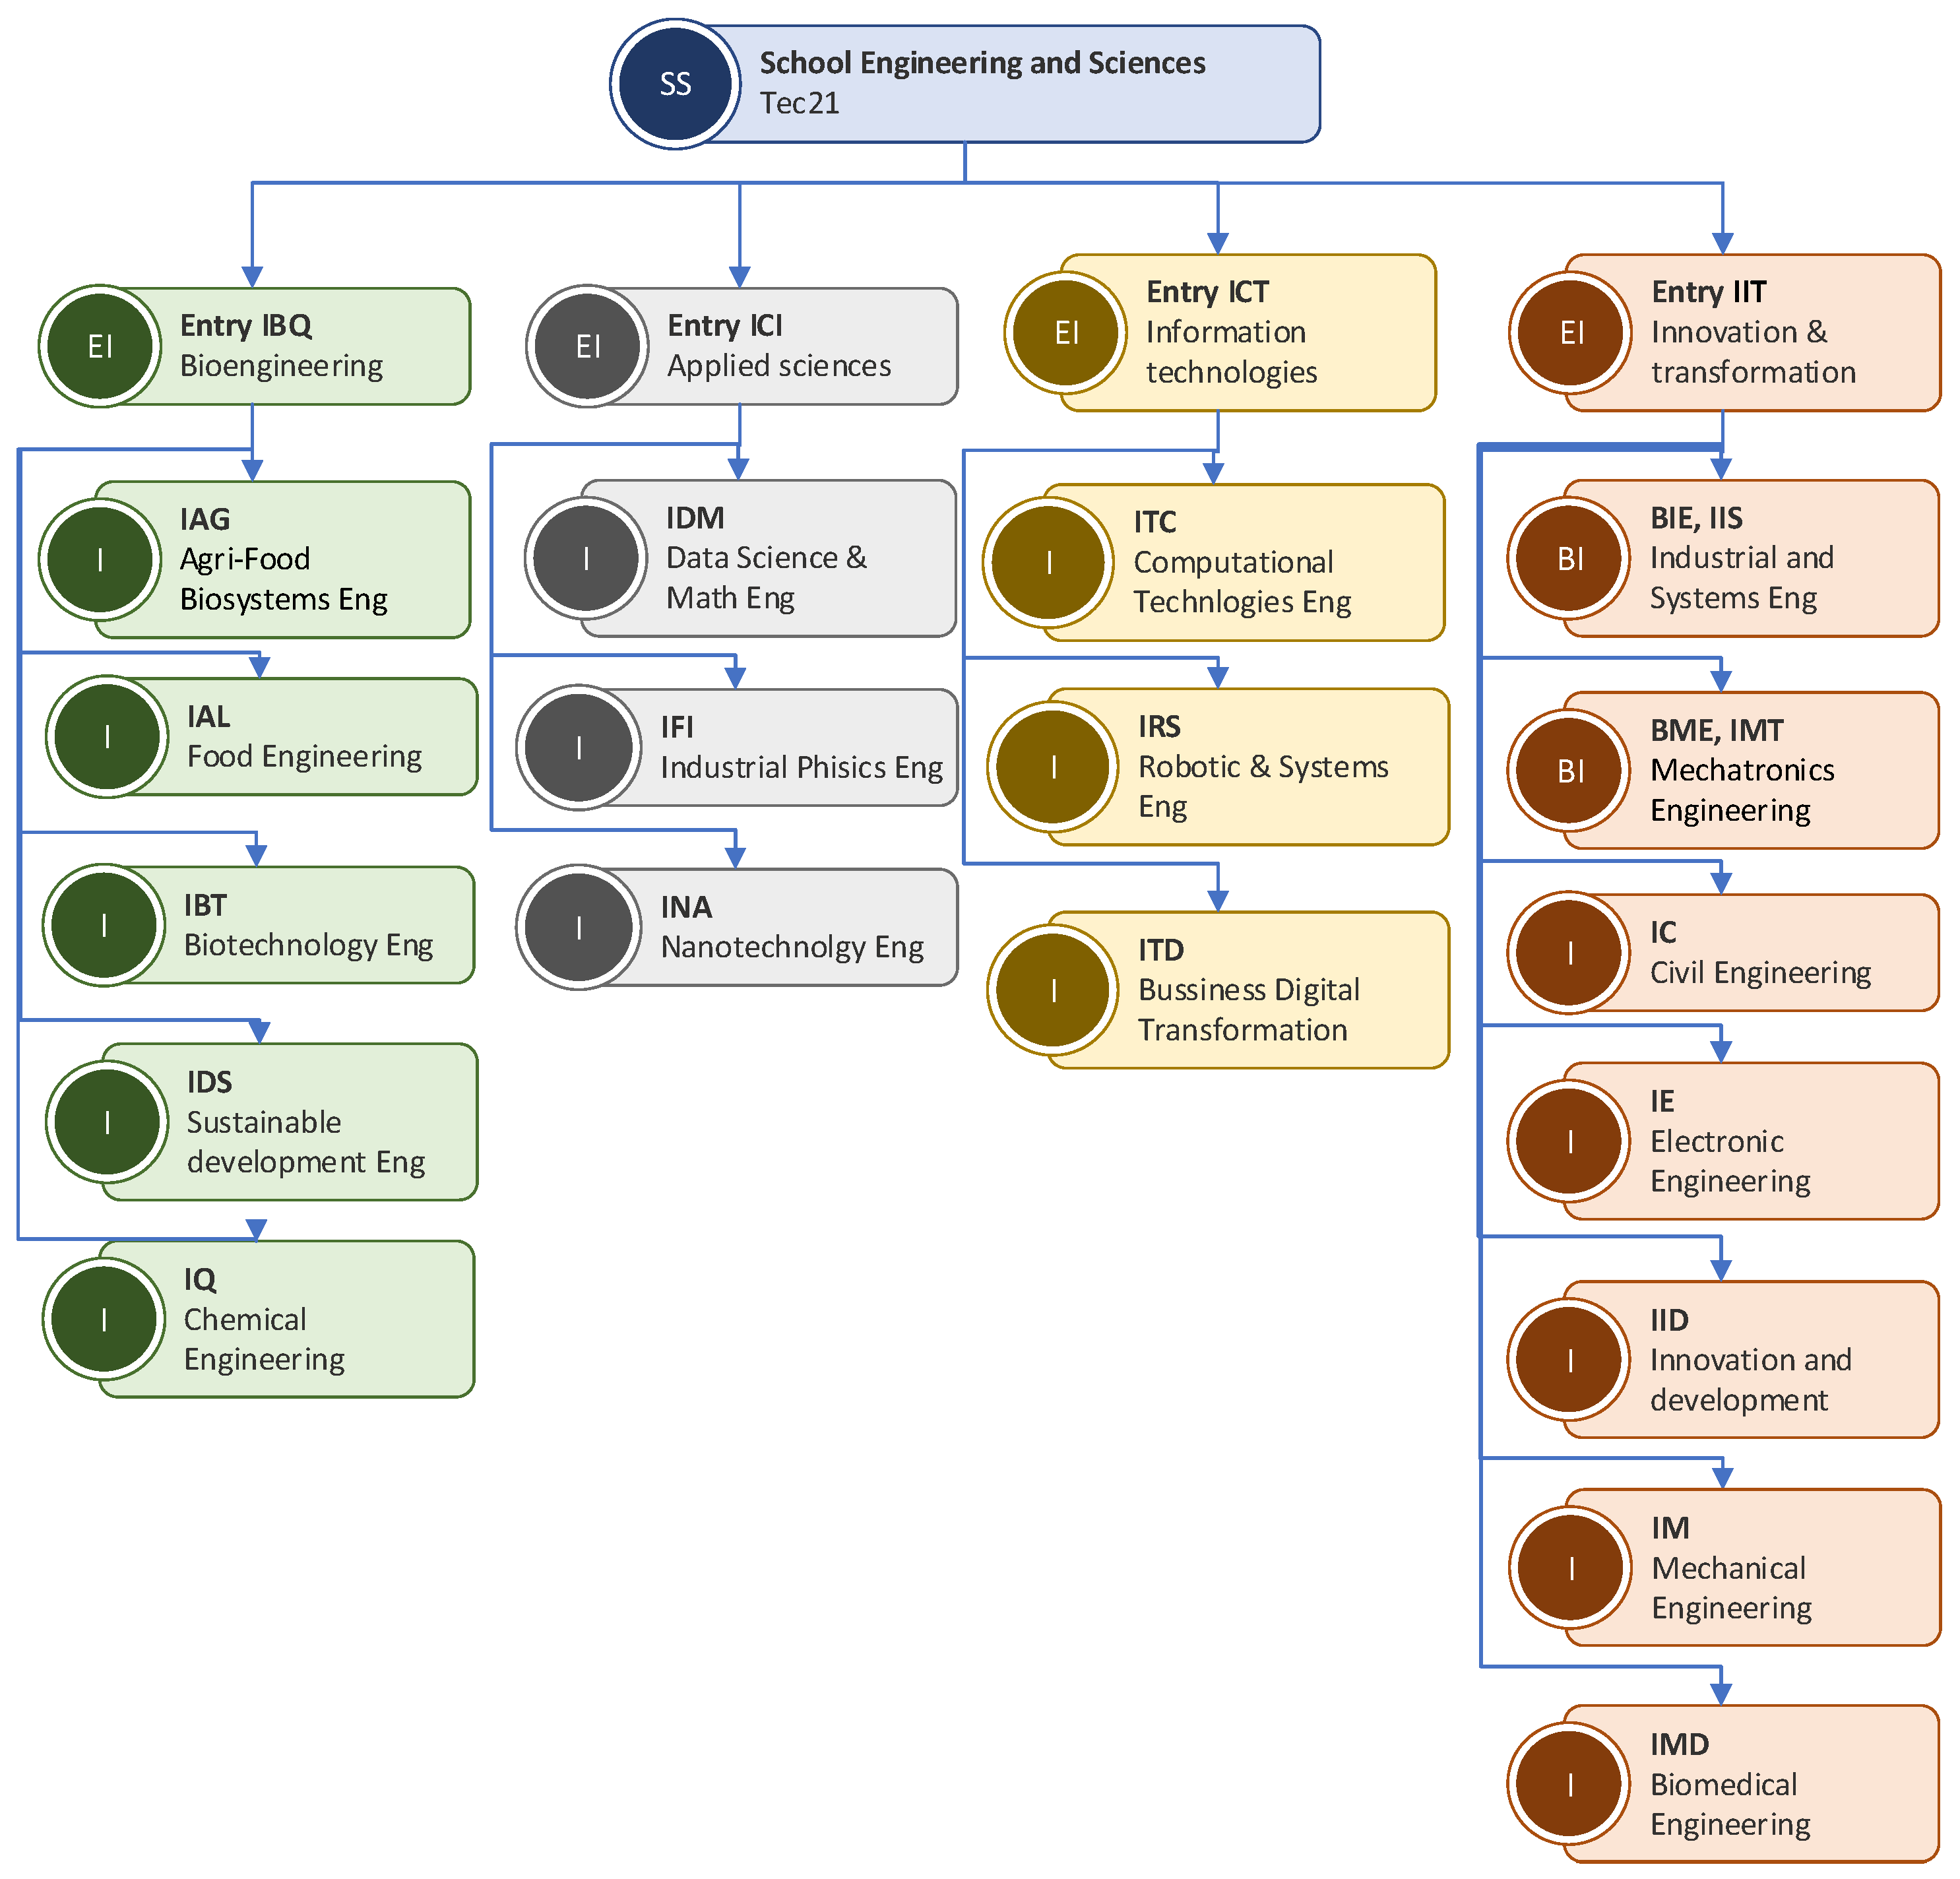
3.1. The Tec21 Pedagogical Model and the Structure of Tec’s STEM Programs

The Tec21 educational model integrates the development and assessment of competencies across all courses. Each course outlines the specific competencies that students are expected to develop and be evaluated on. During the program, students develop three different types of competencies, namely, transversal, area, and discipline competencies. Transversal competencies are essential for all students at the university, not just those in STEM fields. These include skills such as complex thinking, communication, and digital transformation. Area competencies are specific to STEM students and encompass abilities like problem-solving and data analysis. Discipline competencies are tailored to the long-term program a student is enrolled in.
Each competency is a broad, main skill or ability that students are expected to develop. Competencies are composed of multiple sub-competencies. Sub-competencies break down a broader competency into manageable, actionable components, providing a clear, precise framework for instructors to assess. They are, thus, very specific, and, together, they are expected to account for the mastery of the corresponding competency.
The development of each sub-competency is structured into three levels of proficiency: Level A (basic), Level B (intermediate), and Level C (advanced) (Olivares et al., 2021). The summative evaluation of each course includes a competency assessment, where students are required to demonstrate evidence of achieving the proficiency level that the course is designed to develop. As students progress through different academic periods, the model guides them to develop competencies through the sub-competencies, starting from Level A in the initial semesters and progressing to Level C in the final ones.
Figure 1 illustrates the structure of the STEM academic programs, which are organized into three five-week periods per term. During each period, students engage in formative units, which go beyond traditional courses to focus on the development of competencies. These formative units are divided into two main types: subjects and blocks. Subjects resemble typical courses but are specifically designed to facilitate competency development. Blocks, on the other hand, are formative units centered around a challenge-based educational strategy. In these blocks, students tackle a well-designed challenge that requires them to develop the competencies assigned to the unit while acquiring and applying the knowledge taught in the block’s modules.
Programs are structured into three stages: exploration, focus, and specialization. The exploration stage spans three semesters, during which students take formative units that allow them to explore various STEM disciplines and decide on a long-term program to pursue. The focus stage constitutes the core of the program, where students primarily engage in formative units alongside peers from their chosen discipline. Finally, the specialization stage includes two semesters: the Tecsemester, which offers opportunities for internships, research projects, or studying abroad, and the last semester, which is dedicated to integrating all the competencies developed throughout the program.
All skills are worked on continuously over the course of the program, but their focus varies depending on the stage of the educational journey. In this model, students have the option to choose their long-term program from the beginning. However, for those who are undecided, the exploratory stage provides a valuable opportunity to explore different STEM disciplines. Figure 2 illustrates the STEM programs offered at the university.
Students can start their university experience by selecting a long-term program, such as Food Engineering, or by opting for an academic area (entry program) like Bioengineering, which includes five related programs. Within an academic area, students develop the same competencies, including both transversal and area competencies. During the exploration stage, these are the prevalent competencies. As students progress to the focus stage, they transition into their chosen long-term program and receive formative units tailored to that program, alongside other electives and general courses. In this stage, students continue to develop transversal and area competencies while beginning to focus on discipline-specific competencies. Appendix A provides a comprehensive list of all the competencies that STEM academic program students developed between 2019 and 2022.

3.2. Database and Sample Description

The database published by Tecnológico de Monterrey is distributed as a collection of text files, separated by academic programs due to its large size. The raw database contains 5 , 940 , 006 records corresponding to evaluations of 16 , 500 STEM students at the School of Engineering and Sciences of Tecnológico de Monterrey from August–December 2019 (abbreviated to 2019AD) to February–June 2022 (abbreviated to 2022FJ). This dataset encompasses the initial three academic courses implementing the Tec21 pedagogical model divided into six academic periods.
The database includes 44 raw features that collect information about the student, the group, the formative unit, and the competency and sub-competency evaluated. In our data analysis problem, we employed the public data transformation steps reported in Valdes-Ramirez et al. (2024) for obtaining a dataset. However, we retained all competencies and sub-competencies instead of the sustainability competencies.
According to the raw dataset, the ICT and IBQ academic programs exhibit the closest values in terms of the number of students and database rows collected. Figure 3 presents two heatmaps illustrating the differences between entry programs regarding the number of students and database rows. In these heatmaps, darker gray tones represent larger differences. To mitigate bias associated with academic programs, we selected the ICT and IBQ entry programs for analysis, as they demonstrate the smallest differences in both metrics. Additionally, we included data from the full academic programs associated with these entry programs, namely, IAG, IAL, IBT, IDS, IQ, ITC, IRS, and ITD.
For cohort selection, we included the first two cohorts to enable a comprehensive evaluation of their academic progress. The dataset for the 2019 cohort encompasses six academic periods (from August–December 2019 to February–June 2022), whereas the 2020 cohort includes four semesters (from August–December 2020 to February–June 2022). To refine the dataset, we applied filters to exclude records of subjects not listed in the official program guides published on the Tec website. These exclusions address instances where students might have taken subjects outside their programs due to the flexibility of the academic model, resulting in a reduced sample size for evaluating performance.
After applying these filters, the dataset comprised 557 , 675 records for 4566 students, each representing a unique sub-competency evaluation in terms of the student, formative unit, semester, and competency (refer to Appendix B). The dataset includes evaluations of 60 competencies, with 50 associated with IBQ-related programs and 33 with ICT-related programs. Furthermore, it contains assessments of 150 sub-competencies, of which 111 are linked to IBQ-related programs and 69 to ICT-related programs. Similarly, evaluations span 351 formation units, with 285 belonging to IBQ-related programs and 242 to ICT-related programs.
Regarding gender distribution, male students ( 2682 ) constitute nearly two-thirds of the sample. Students are distributed across campuses, which are grouped into five regions (Figure 4): RM (Monterrey Region), RCS (South/Central Region), RCM (Mexico City Region), RO (West Region), and DR (Regional Development Region). Notably, the Monterrey Region and Regional Development Region represent the highest and lowest numbers of students, respectively, while the other regions have relatively balanced student distributions. Some students have moved between regions, resulting in their total counts exceeding the actual number of students. The sunflower chart in Figure 5 details the number of students by entry program and corresponding long-term programs. Among long-term programs, IAG ( 66 ) and ITD ( 166 ) have the fewest students enrolled under the IBQ and ICT entry programs, respectively, while IBT ( 1110 ) and ITC ( 1113 ) have the largest number of enrollments.
Although the majority of students in the dataset are Mexican ( 93.47 % ), Tec de Monterrey academic programs consistently attract international students, enhancing their global reputation and value. Figure 6 depicts the distribution of the remaining 6.53 % of students by country. The most represented foreign countries include the USA, Ecuador, Venezuela, Honduras, and Guatemala, each accounting for over 5 % of the international students. However, nationality data are incomplete for 1.3 % of the foreign students, who are listed without specified country information.

4. Results and Discussion

In this section, we describe the findings of our study. First, we will present the results of the analysis about whether delaying the choice of enrolling on a long-term program is beneficial for students or not. Next, we will describe whether there exist sub-competencies that are harder to develop and how they relate to dropout. Then, we will show whether there exists a relation among final grades, the number of credits allocated to a module, and whether a module is part of a Tec week or not.

4.1. Entry Program or Long-Term Program? An Analysis of Student Performance

To perform this analysis, we first generated a dataset view with records of students enrolled in the programs under study. In particular, we needed to separate active students from those who abandoned the School of Engineering and Science (dropouts). Also, we needed to identify students’ choices (whether they continued opting for an entry program or switched to a specific one). We proceeded as follows: If there is no record of a student as of Fall 2021 for the 2019 cohort and Spring 2022 for the 2020 cohort, she is considered to have left the school. Otherwise, the student is allocated to the last program in which she was enrolled. Next, we computed the total number students (and the associated percentage) in each subject. The three most relevant long-term programs are selected based on the school’s programs (see Figure 2). Students who did not drop out or who were not enrolled in any of these three programs were grouped into the Other category. Table 1 shows the percentages of IBQ/ICT students per destination program chosen based on their cohort.
Figure 7 and Figure 8 convey the academic progression of students who enrolled in the ICT and in the IBT entry programs, respectively, starting in the academic year 2019AD. They track their movement through various programs until the academic year 2022FJ. The identification of the new entrants in each year is based on the column enrollment_period.id, which indicates the period in which the student first enrolled at Tec. New entrants for a given year are those whose enrollment_period.id corresponds to that year. Each node represents a specific academic program and year, while the bands connecting the nodes indicate the flow of students transitioning between these programs over time.
Key observations from Figure 7 include the following: a majority of the students who initially enrolled in the ICT program in 2019AD remained in the ICT program through to 2020FJ; from 2020AD onwards, there is a noticeable transition of students into the Engineering in Computer Technologies (ITC) program, with many continuing in ITC up to 2022FJ; some students diverted to other programs such as Robotics and Digital Systems Engineering (IRS), Digital Business Transformation Engineering (ITD), and various other engineering disciplines, as indicated by the thinner bands extending to these nodes; a substantial portion of students who initially enrolled in the ICT program in 2020AD remained in the ICT program through to 2021FJ; from 2021AD onwards, there is a significant transition of students into the Engineering in Computer Technologies (ITC) program, with many continuing in ITC up to 2022FJ; some students diverted to other programs such as Robotics and Digital Systems Engineering (IRS), Digital Business Transformation Engineering (ITD), and various other engineering disciplines, as indicated by the thinner bands extending to these nodes.
Key observations from Figure 8 include the following: almost all students that were in IBQ 2019AD are in the IBQ program in 2020FJ; there is a notable transition of students from IBQ to IBT in 2020AD and subsequent years; some students diverted to other programs such as Chemical Engineering (IQ), Environment Engineering (IA), and various other engineering disciplines, as indicated by the thinner bands extending to these nodes; a large majority of students who initially enrolled in the IBQ program in 2020AD remained in the IBQ program through to 2021FJ; from 2021AD onward, there is a notable shift of students transitioning to the Biotechnology Engineering (IBT) program, particularly in 2022FJ, and there are also transitions to other programs such as Chemical Engineering (IQ), Food Engineering (IAL), and various other engineering disciplines, as shown by the thinner bands extending to these nodes.

Comparison of Academic Performance

To test the hypothesis that a longer permanence in entry programs, which allows students to delay their choice of degree, benefits their performance in subsequent semesters, we created two new datasets: one with students who did not complete the entry program (stayed one or two terms), and another with students who did otherwise (stayed three terms). As can be seen in Table 1, the dropout rate decreased by nearly two percentage points from the 2019 cohort to 2020 cohort. However, it is still significant that a considerable percentage of students, 27.94% in ICT and 18.89% in IBQ (see Table 2), continued studying for only two terms before transitioning to a long-term program.
Considering only the number of semesters taken by both cohorts, without differentiating by cohort, the reduction in the percentage of dropouts is even greater. In the case of ICT, it is reduced by up to four percentage points (from 7.87 % to 3.04 % ), and by up to five points (from 9.33 % to 3.73 % ) in IBQ, as seen in Table 3. High dropout rates are observed for those who only studied one term, as observed in other studies carried out for STEM careers (Casanova et al., 2023).
These findings suggest that the flexibility of entry programs generally benefits students’ academic performance in the following academic years. Continuing with this line of analysis, we examined whether students who completed the three-term entry program demonstrated better academic outcomes compared to those who completed only part of it.
Table 4 shows the IBQ dataset, which confirms that students who took the complete entry program had a better ratio of approved sub-competencies and better grades than those who completed part of it. Although the differences are not significant, the trend is repeated on the different Teccampuses. Furthermore, students who took the complete entry program had a better ratio of approved sub-competencies and better grades in the different types of formative units than those who completed it partially in IBQ (see Table 5), except for the sub-competencies of the ‘block’-type formative unit, where the ratio for the complete program is 0.947 and for the partial program is 0.948. However, the difference is practically insignificant. Even more, the performance of the A-level sub-competencies was higher in the students of the full entry program than those of the partial one, with both groups having a similar size of about 500 students (see Table 6).
Apart from that, the ratio of approved sub-competencies, including both area and general education sub-competencies, is higher in students from the full entry program than in those from a specific one, as shown in Table 7.
The analysis conducted on the ICT and IBQ entry programs demonstrates that providing students with the opportunity to delay their choice of specific degree pathway can positively impact their academic performance. Only IBQ results are shown in order to not make the article too long. By examining the academic progression and outcomes of students who either completed or partially completed the entry programs, we observed that those who completed the entire entry program generally achieved better academic results, both in the traditional numeric evaluation and its corresponding competency evaluation.

4.2. An Analysis of Competency Difficulty

Next, we carried out a competency study from different perspectives with the aim of (i) identifying formative units and sub-competencies that are more difficult to pass; (ii) checking if dropout could be a cause of the difficulty in overcoming these harder sub-competencies; (iii) verifying whether sub-competency evaluation is consistent when it is performed by professors in different formative units; and, finally, (iv) uncovering the number of observations needed on average to acquire a sub-competency.
To observe which formative units are more difficult to pass, the dataset available for the ICT entry program was filtered, selecting only subjects that are gathered in these programs according to the Tec website. Despite being compulsory formative units, Tec weeks do not form part of the final grade of a subject; hence, we discarded them for this particular study on competency analysis. Next, the mean and standard deviation of the grades for each subject were calculated only considering students who studied them in the semester in which they were planned. Then, the sub-competencies taught in each subject were included.
Observing those sub-competencies taught in subjects with a greater dispersion (SD) and number of failed students (see Table 8), it can be concluded that learners struggle more with subjects that involve learning new paradigms and problem solving, such as Mathematical Thinking I and Object-Oriented Computational Thinking.
Once the most difficult subjects were identified, we tested if the sub-competencies that challenge students the most are also assessed in the subjects which reflect lower ratings in the evaluation. For this purpose, we examined which sub-competencies had the highest number of ‘non-observations’ (failed competency assessments), and also weighting this value by the total number of observations (ratio).
By examining the sub-competencies within the previously identified difficult subjects and comparing them with the sub-competencies shown in Table 9, a clear relationship emerged: the sub-competencies that are the most challenging to approve are the same ones that are evaluated in these subjects. A ratio is also added, as a quotient of the number of approvals by the number of failures, showing an optimal comparison.
Also, by analyzing the evaluation of these subjects according to gender, it is possible to observe that women tend to fail less than men, as can be seen by comparing the percentage of enrollments to the percentage of failures between the two genders in Table 10.
Using the datasets created, we can identify the IDs of students who leave the technological branch (TEC). Now, by knowing the subjects and sub-competencies that pose the greatest challenges, we can examine if there are any common academic features in this group. For this purpose, we calculated the average grade for the subjects performed achieved by those students who dropped out of the STEM branch, as well as the number of passes and failures in each subject. As shown in Table 11, there is a notable increase in the number of failures compared to the number of passes. Additionally, there is a notable decrease in the average grade, particularly in several subjects previously identified as the most challenging (e.g., Mathematical Thinking I).
Next, the relationship between the difficulty of sub-competencies and how much emphasis is placed on their assessment was analyzed. Attending to the tuple of subject, sub-competency, and required level, the number of times the sub-competency is evaluated was determined, ordering the sub-competencies by this value. Then, the ranking of the sub-competencies that are most complicated to pass was calculated (the lower the number, the greater the difficulty), according to the study carried out previously (Table 9). Observing the results shown in Table 12, it can be concluded that there are sub-competencies for which the number of evaluations could be reduced in favor of others that pose a greater barrier for the students, such as systemic thinking or written language.
Next, the following analysis checked whether the assessment of sub-competencies is consistent when it is evaluated in different formative units and by different teachers. This means that, once the sub-competency has been observed (approved) in one formative unit, it is also passed in the subsequent ones. Table 13 shows the number of instances where the previous assertion was not fullfilled, i.e., where failed evaluations were found after having been passed, such as in systemic and scientific thinking or problem solving. However, the number of such cases is significantly lower compared to the frequency with which these sub-competencies are evaluated. This suggests that an appropriate criterion (evaluation rubric) is being used to assess whether sub-competencies are observed or surpassed.
By identifying the subjects that evaluate each competency, it is possible to visualize the weight given to each competency within the program (Figure 9). Some transversal competencies such as communication or reasoning for complexity appear in a large number of subjects in which they are evaluated. These mainly correspond to transversal competencies in optional subjects, which is directly related to the number of subjects offered by the university.
Based on the previous analysis of the most complicated sub-competencies to surpass, it is also possible to check whether the competencies include them and group sub-competencies of a similar difficulty, and check if they are great differences among them, easily by ordering them by means of a difficulty ranking (lower ratio means higher difficulty). As can be seen in Table 14, there are competencies such as problem solving with computing that integrate sub-competencies that contrast with each other in difficulty, while other competencies collect sub-competencies that are more level with the rest.
Finally, we aimed to investigate the relationship between the frequency of attempts at a sub-competency and the corresponding performance outcomes. Specifically, we wanted to determine how many attempts a student needs to either approve or fail a sub-competency, knowing that the same student encounters the same sub-competency at different formative units throughout their program.
The analysis reveals that, on average, sub-competencies that failed in the most recent evaluation had been assessed 0.221876 times previously. In contrast, those that were approved had undergone around 1.266455 prior evaluations. This suggests that sub-competencies passing the final evaluation tend to have been evaluated more frequently compared to those that failed. Furthermore, it is more common for a student to fail a sub-competency when it is being evaluated for the first time.

4.3. Analysis of Competency Development Against Type and Grade of the Formative Unit

Finally, a subject-centered analysis was conducted to determine whether variations in the number of credits allocated to different subjects significantly impacted final grades, and whether subjects related to Tec weeks exhibited different evaluation patterns.
To assess the effort students dedicated to each subject, the grades in the dataset were weighted by the number of credits. This enabled us to observe if notable differences existed between the classic and weighted averages at the program level. However, no substantial differences beyond 1 point out of 100 were observed in either program (see Table 15). This reflects the fact that the customization of the number of credits thus varied does not really have a significant impact in the overall assessment of a student’s record. Furthermore, the weighted average grade for females is 90.565 and for males 88.525, revealing no notable differences by sex.
In the case of Tec week subjects, a particular behavior was observed with respect to other types of subjects. Even means of 100.0 are appreciated for these subjects. However, the sub-competency self-knowledge in the entry program (Table 16), which is the most assessed, with a high rate of ‘no observations’ (835 failed vs. 1196 approved), appears in subjects where only this sub-competency is assessed and still the mean is 95-100.0. Seeing the high scores and the sub-competencies being assessed, there seems to be a lower correlation between the assessment of the sub-competencies and the grade for the Tec week subjects. Something similar happens in the ITC program (Table 17).
In addition, it was observed that, in the entry program, hardly any sub-competencies that are related to the ‘block’- or ‘subject’-type subjects are evaluated in the Tec weeks. These are sub-competencies that are more generic or involve more personal knowledge, as seen in Table 18. In the long-term program, they appear to a greater extent, although only one or two sub-competencies are evaluated per week (Table 19).

Student Workload Versus Failure Rate

Knowing that students fail a learning unit if their final grade is below 70, we analyzed whether enrolling in more credits than usual negatively affects IBT students. Our analysis revealed a very weak negative correlation, indicating no strong or direct relationship between the number of credits a student enrolls in and the number of subjects they fail. The near-zero correlation value suggests there is no clear evidence that a heavier course load impacts the number of failed subjects. This comparison is illustrated in Table 20.
Next, we aimed to determine if there is a relationship between the number of credits taken and course grades. In the IBQ program (see Table 21), students who enrolled in more credits than they were entitled to received the lowest grades. This group was followed by students who enrolled in fewer credits and those who enrolled in the exact number of credits they were entitled to. Although the difference in grades is only 3 points out of 100, it suggests that enrolling in fewer credits is slightly better for academic performance in the IBQ program than exceeding the standard enrollment.

4.4. Limitations

We must point out the limitations of this study. First, we have a dataset that does not include the performance of one or more complete cohorts of students. Thus, a study of performance at the end of the studies was not feasible. This also hampered the analysis of competencies, which was limited to those observed in the first semesters. Thus, our findings stress the importance of data quality and quantity in research, suggesting that more robust and complete datasets are essential for making definitive conclusions about the efficacy of CBE models.
There was also no contextual information available that could provide answers to certain questions. For example, we could not compare students who took the long-term program without going through the entry program. This seems to be a decision established by the university. Additionally, one cohort, 2019, was affected by the pandemic produced by COVID-19, and we are not aware of any information regarding academic changes between the different cohorts; therefore, the study treats all records equally. On the other hand, the sub-competencies are not evaluated with a numeric grade; thus, the skill level acquired cannot be ranked.

5. Conclusions and Directions for Further Work

In this study, we analyzed the Tec21 dataset, released by Tecnologico de Monterey for the evaluation of the Tec21 competency-based education pedagogic model. Unlike the study of Sánchez-Carracedo et al. (2021) or Talamás-Carvajal et al. (2024), ours involved millions of records and did not separate the traditional numeric evaluation of a subject from the assessment of competency development.
The findings of our study suggest that the structure and flexibility of the entry programs, available in the Tec21 educational model, give a student more opportunities for success. This is because these programs allow students to explore their interests and build a solid academic foundation before committing to a specific subject. We have seen that not only does this approach enable increased student performance in subsequent semesters, but it also reduces the dropout rate, contributing to students’ long-term academic and professional development.
In particular, students who completed the full three-semester entry program had higher average grades and a better ratio of approved sub-competencies across different Teccampuses. This trend was consistent for both the ICT and IBQ programs, despite only IBQ’s results being shown, as well as across various types of formative units such as ‘block’ and ‘subject’. The complete-program students also showed a lower dropout rate, indicating that extended exposure to the entry program helps in retaining students within STEM fields.
Additionally, the performance in sub-competencies was notably higher for students who completed the full program. These students showed a higher approval ratio in both area and general education competencies compared to those who transitioned to a specific degree program after only two semesters. Interestingly, students who failed after completing the partial program tended to struggle more with ‘subject’ formative units, whereas those who completed the full program found ‘block’-type units more challenging.
Our study also shows that students find it more difficult to successfully complete subjects that involve learning new paradigms for problem solving. Coincidentally, such modules also involve observing competencies that students found very challenging to develop. Example competencies of this kind include mathematical thinking and computational thinking. Students who dropped out of school had particularly poor marks in these modules. Overall, our results further support the work of Talamás-Carvajal et al. (2024), who found out that critical thinking is crucial for developing both complex thinking and other competencies.
Our study suggests that academic coordinators should review each subject’s syllabus to balance the number of times a (sub-)competency is evaluated depending on its level of difficulty, and to balance the level of difficulty in the sub-competencies that compose a competency, while keeping in mind the number of observations that on average are needed for a student to acquire a sub-competency.
Our study also concludes that there are no significant differences in the assessment of competencies due to the teacher or campus where the student is enrolled. Also, in our findings, we noticed that the number of credits allocated to a formative unit has no significant impact on the final grade obtained (on average) by students, and yet students who enroll in full program perform better that those who follow more or fewer training units than scheduled for the academic period, though only to a slight extent.
Having the competency evaluations for each student and academic period, our future work encompasses longitudinal studies analyzing the evolution of the students regarding their competencies evaluation through the academic periods by program, geographical region, and gender. Further work also involves conducting a contrast pattern mining approach so as to characterize interesting behavior, for example, discovering what distinguishes a student who successfully develops complex competencies from those who do not.

Author Contributions

Conceptualization, E.M., M.Z., G.Z. and R. M.; Methodology, M.Z.; Software, E.S. and M.M.; Validation, E.M., D.V.-R., G.Z. and R.M.; Formal analysis, E.S., M.M. and D.V.-R.; Resources, E.M.; Data curation, E.S., M.M. and D.V.-R.; Writing–original draft, E.S., M.M., M.Z. and D.V.-R.; Writing – review & editing, E.M., M.M., M.Z. and D.V.-R.; Supervision, R.M., E.M. and M.Z. All authors have read and agreed to the published version of the manuscript.

Funding

This research received no external funding.

Institutional Review Board Statement

Not applicable.

Informed Consent Statement

Not applicable.

Data Availability Statement

The data that support the findings of this study are available from the Institute for the Future of Education (IFE)’s Educational Innovation collection of the Tecnológico de Monterrey’s Research Data Hub but restrictions apply to the availability of these data, which were used under a signed Terms of Use document for the current study, and so are not publicly available. Data are, however, available from the IFE Data Hub upon reasonable request at https://doi.org/10.57687/FK2/R9LOXP.

Acknowledgments

The authors would like to acknowledge the Living Lab & Data Hub of the Institute for the Future of Education, Tecnológico de Monterrey, México, for the data used in this work and provided through the Call “Fostering the Analysis of Competency-based Higher Education”. Also, we thank the Writing Lab at the Institute for the Future of Education of Tecnológico de Monterrey for their valuable contribution to this work.

Conflicts of Interest

No potential conflicts of interest are reported by the authors.

Abbreviations

The following abbreviations are used in this manuscript:
ADAugust to December
CBECompetency-Based Education
FJFebruary to June
FTE   Full-Time Equivalent
HEHigher Education
IBQBioengineering and Chemical Process
ICTComputer Science and Information Technologies
IDIdentification
ITCB.S. in Computer Science and Technology
RCMMonterrey Region
RCSCentral/South Region
RMMonterrey Region
ROWest Region
SDStandard Deviation
STEMScience, Technology, Engineering, and Mathematics

Appendix A. List of Competencies by Type

Transversal: reasoning for complexity, communication, digital transformation, ethical and citizen commitment, self-knowledge and management, social intelligence, innovative entrepreneurship.
Area: foundation of engineering and science systems, engineering problem solving, problem solving, foundation of engineering systems and devices, commitment to sustainability, data analysis in engineering and science, solution of chemical or biological process problems, foundation of chemical and biological phenomena, problem solving with computing, systems and engineering devices data analysis, foundation of computer systems, data analysis of chemical and biological systems, generation of computational models for data analysis, application of international standards, problem solution in natural and exact sciences, foundation of natural phenomena, natural phenomena data analysis, design of maintenance analysis and fault prevention systems.
Disciplinary: manufacture of nanomaterials, bioproduct development, innovation management, foundation of the functioning of living organisms, transport infrastructure design, characterization of the land, construction management, complex problem solution, model construction, information communication, design of maintenance analysis and fault prevention systems, development of manufacturing processes, electronic design, personalized food design, biorreactors design, digital strategies, software systems development, scientific communication, data science, mathematical modeling, smart interfaces, smart robotic and digital systems, development of biomedical devices, transformation of mechanical energy, chemical process design, improvement of chemical processes, improvement of competitiveness in organizations, multidisciplinary project administration, automates systems and processes, integrates mechanical electronic control and software components, scientific and technological communication in nanotechnology, mechanical systems development, structural design, evaluation of nanomaterial properties, optimization, innovation of organizational processes, manage innovation projects and programs, create technological base solutions, design new technological base business models, computer algorithms development, data governance management, integration of productive biosystems, integration of technologies in productive biosystems, bioprocess design, measurement of medical-biological systems, problem solution in nanoscale, generates comprehensive energy solutions, characterization of physical phenomena, hydraulic systems design, development of business architectures, healthy food development, research in nanotechnology, solutions with systemic vision, evaluation of sustainable technologies in biosystems, energy systems development, telecommunications systems design, food safety evaluation, food process efficiency evaluation, health technology management, biomedical engineering solutions, productive biosystems management, identification of physical phenomena, embedded systems, computer infrastructure implementation, make proposals for mechanical systems, mechanical engineering projects administration, identify opportunities for improvement in processes, statistics-based business intelligence, security and cryptography, design mechatronic systems, evaluate the availability and restitution of natural resources, development of nanotechnological products, technology integration into chemical processes, development of the business plan and economic feasibility, cognitive methods, design corporate sustainability strategies.

Appendix B. Feature Description by Categories

Table A1. Table of sociodemographic-related features after feature engineering.
VariableDomainDescription
student.idNumericUnique identifier for each student
term_period.idCategoricalAcademic period of the evaluation, where the first four digits indicate the year and the second two chars indicate the starting and end months, e.g., 2019AD is August–December 2019
student.ageNumericStudent’s age in the academic period
student.nationalityCategoricalStudent’s nationality
student.isForeignBooleanTrue if their student residence is in the same city as the campus, False otherwise
student_origSchool.TECBooleanIndicates whether the student studied in a high school that belongs to Tec de Monterrey
campus.region_nameCategoricalCode of the region of the enrollment campus: RM Monterrey Region, RO Western Region, RCS Central/South Region, RCM Mexico City Region, DR Other Regions
student.cohort.idNumericYear of admission (cohort) of the student
student.isWomanBooleanStudent’s gender, which is coded as True if the student is a woman and False if the student is a man.
semesters_from.enrollmentNumericCounts how many academic periods have passed since the student enrolled
enrollment_period.idCategoricalAcademic period where the student.id appears first in the data (2019FJ, 2020AD, etc.)
student.subject_sem_enrolledNumericCounts how many training units the student has enrolled in during the current academic period
Table A2. Table of academic-related features after feature engineering.
VariableDomainDescription
student.status_descCategoricalDescription of the student’s academic status
student.isConditionedBooleanWhether the student is in conditional academic status
program.major_idCategoricalAcronym of the academic program of the student
student.semester_descCategoricalDescription of the semester of the student
student.lastTerm_gpaNumericStudent’s last semester average
student.term_gpa_programNumericGlobal average of the student’s academic program for the closing of the consulted academic term
student.fteNumericProportion of the number of training units the student has enrolled on in the academic period, where 1 indicates the exact number of training units, < 1 indicates fewer training units, and > 1 indicates more training units than scheduled for the academic period
subject.longNameCategoricalTraining unit’s name
subject.tec21Type_descCategoricalType of educational init in the Tec21 model
subject.type_descCategoricalDescription of the type of training unit
group.isVirtualBooleanIndicates whether the classes in this group are taught virtually
group.isEnglishLanguageBooleanIndicates whether the training unit is taught in English
student_grades.final_numericNumericStudent’s final grade in the training unit
group.modalityCategoricalGroup’s modality
group.periodCategoricalEach semester has three periods of five weeks (1, 2, 3)
group.hasEvaluationInstBooleanWhether the educational unit has an evaluation instrument
group.duration_weeksNumericDuration in weeks of the educational unit
group.sizeNumericCount of student.id in the same group during the academic period
program.isAvenueBooleanIndicates whether the academic program is an entry program. Entry programs are initial academic programs spanning the first three academic periods, allowing students to explore various programs related to a specific knowledge area
Table A3. Table of competency-related features after feature engineering.
VariableDomainDescription
competency.descCategoricalCompetency name according to the list in Appendix A
competency.typeCategoricalType of competency: transversal, area, or disciplinary
sub-competency.descCategoricalSub-competency name
sub-competency.level_requiredCategoricalLevel to be developed in the sub-competency: A, B, or C, where A is the simplest and C the hardest. Only one level is required for a sub-competency and subject
sub-competency.equivalent_keyCategoricalA code describing the sub-competency P P P C C S S L , where P P P indicates the academic program, C C is the ID of the competency, S S is the ID of the sub-competency in the competency, and L indicates the sub-competency level required. Some equivalent sub-competencies have different codes; thus, they can be unified depending on the purpose of the study
sub-competency.observed_countNumericCount of how many times the current sub-competency has been assessed as “Observed” or “Approved” for the current student
sub-competency.notobserved_countNumericCount of how many times the current sub-competency has been assessed as “Not Observed” or “Failed” for the current student
sub-competency.level_assignedBooleanEvaluation assigned by the professor for the current student and sub-competency, coded as True for “Observed” and False for “Not Observed”

Note

1

References

  1. Casanova, J. R., Castro-López, A., Bernardo, A. B., & Almeida, L. S. (2023). The dropout of first-year STEM students: Is it worth looking beyond academic achievement? Sustainability, 15(2), 1253. [Google Scholar] [CrossRef]
  2. Henri, M., Johnson, M. D., & Nepal, B. (2017). A review of competency-based learning: Tools, assessments, and recommendations. Journal of Engineering Education, 106(4), 607–638. [Google Scholar] [CrossRef]
  3. Larre-Bolaños-Cacho, M., Hernández-Alamilla, S., Fuentes-Valdéz, R., & Najera-García, P. (2020). Data analytics and cloud computing vs breast cancer: Learning that helps. International Journal of Information and Education Technology, 10(4), 245–251. [Google Scholar]
  4. Liu, H.-Y. (2023). Design thinking competence as self-perceived by nursing students in Taiwan: A cross-sectional study. Nurse Education Today, 121, 105696. [Google Scholar] [CrossRef] [PubMed]
  5. Marcotte, K. M., & Gruppen, L. D. (2022). Competency-based education as curriculum and assessment for integrative learning. Education Sciences, 12(4), 267. [Google Scholar] [CrossRef]
  6. Miço, H., & Cungu, J. (2023). Entrepreneurship education, a challenging learning process towards entrepreneurial competence in education. Administrative Sciences, 13(1), 22. [Google Scholar] [CrossRef]
  7. Moonen-van Loon, J. M. W., Govaerts, M., Donkers, J., & van Rosmalen, P. (2022). Toward automatic interpretation of narrative feedback in competency-based portfolios. IEEE Transactions on Learning Technologies, 15(2), 179–189. [Google Scholar] [CrossRef]
  8. Navarro, I. J., Martí, J. V., & Yepes, V. (2023). Evaluation of higher education students’ critical thinking skills on sustainability. International Journal of Engineering Education, 39(3), 592–603. [Google Scholar]
  9. Olivares, S. L., Islas, J. R. L., Garín, M. J. P., Chapa, J. A. R., Hernández, C. H. A., & Ortega, L. O. P. (2021). Tec21 educational model: Challenges for a transformative experience. Editorial Digital del Tecnológico de Monterrey. [Google Scholar]
  10. Rasmussen, K., Northrup, P., & Colson, R. (2016). Handbook of research on competency-based education in university settings. IGI Global. [Google Scholar]
  11. Rustamov, I. T. (2023, January 8–10). Enhancing literature knowledge of future English teacher. Proceedings of International Conference on Scientific Research in Natural and Social Sciences (Vol. 2, ), Guangzhou, China. [Google Scholar]
  12. Sa’dijah, C., Purnomo, H., Abdullah, A. H., Permadi, H., Anwar, L., Cahyowati, E. T. D., & Sa’diyah, M. (2023). Students’ numeracy skills in solving numeracy tasks: Analysis of students of junior high schools. AIP Conference Proceedings, 2569(1), 040011. [Google Scholar]
  13. Sangwan, D., Sangwan, K. S., & Raj, P. (2022). 21st-century competencies in engineering education: Initiation, evolution, current, and now whither to. In Towards a new future in engineering education, new scenarios that european alliances of tech universities open up (pp. 672–681). Universitat Politècnica de Catalunya. [Google Scholar]
  14. Sánchez-Carracedo, F., Sabate, F., & Gibert, K. (2021). A methodology to assess the sustainability competencies in engineering undergraduate programs. International Journal of Engineering Education, 37(5), 1231–1243. [Google Scholar]
  15. Spady, W. G. (1977). Competency based education: A bandwagon in search of a definition. Educational Researcher, 6(1), 9–14. [Google Scholar] [CrossRef]
  16. Talamás-Carvajal, J. A., Ceballos, H. G., & Ramírez-Montoya, M.-S. (2024). Identification of complex thinking related competencies: The building blocks of reasoning for complexity. Journal of Learning Analytics, 11(1), 37–48. [Google Scholar] [CrossRef]
  17. Thanachawengsakul, N., & Wannapiroon, P. (2021). The development of a MOOCs knowledge repository system using a digital knowledge engineering process to enhance digital entrepreneurs’ competencies. International Journal of Engineering Pedagogy, 11(6), 85–101. [Google Scholar] [CrossRef]
  18. Valdes-Ramirez, D., de Armas Jacomino, L., Monroy, R., & Zavala, G. (2024). Assessing Sustainability competencies in contemporary STEM higher education: A data-driven analysis at tecnológico de monterrey. Frontiers in Education, 9, 1415755. [Google Scholar] [CrossRef]
  19. Vargas, H., Heradio, R., Farias, G., Lei, Z., & de la Torre, L. (2024). A Pragmatic framework for assessing learning outcomes in competency-based courses. IEEE Transactions on Education, 67(2), 224–233. [Google Scholar] [CrossRef]
Figure 1. Tec21 model description.
Education 15 00513 g001
Figure 2. Structure of STEM academic programs organized by knowledge area.
Education 15 00513 g002
Figure 3. Heatmaps indicating the differences regarding the number of students (left) and rows (right) between entry programs. Darker grays indicate greater differences.
Education 15 00513 g003
Figure 4. Students by region.
Education 15 00513 g004
Figure 5. Student distribution by program.
Education 15 00513 g005
Figure 6. Foreign student distribution by country of origin.
Education 15 00513 g006
Figure 7. Academic progression of students in the ICT program. The top plot (A) corresponds to the 2019AD cohort, while the bottom plot (B) corresponds to the 2020AD cohort.
Education 15 00513 g007
Figure 8. Academic progression of students who started in the IBQ program in 2019AD (A) and in 2020AD (B).
Education 15 00513 g008
Figure 9. Count of subjects in which each competency is assessed (based on the 2019 cohort of the ICT program).
Education 15 00513 g009
Table 1. Percentages of ICT/IBQ students per destination program chosen.
ProgramCohortITCIRSITDOtherDropout STEM
ICT201957.09615.3858.2346.17613.109
202057.50015.3268.6967.06511.413
IBTIQIDS
IBQ201940.01520.50310.82314.48214.177
202043.77620.21710.52612.86512.615
Table 2. Percentages of students that attended one, two, three, four, five, or six semesters in an entry program.
ProgramCohort123456
ICT201917.0179.522.600.540.220.11
202012.3927.9458.041.63--
IBQ201911.8883.853.430.690.150.0
202012.1018.8967.441.57--
Table 3. Percentages of students per entry program, long-term program chosen, and semesters completed.
Entry ProgramSemesters CompletedDropout STEMIRSITCITDOther
ICT148.3411.0720.303.6916.61
27.8724.5255.707.973.94
33.051.6180.2912.013.05
IBTIDSIQ
IBQ160.267.6210.604.3017.22
29.3340.2616.3321.2212.87
33.7357.512.2125.1511.41
Table 4. Summary of average grade and approved sub-competencies ratio by campus region and set of students for IBQ dataset.
Campus RegionAvg GradeSetApproved Ratio
DR93.429467Complete0.950221
DR92.646617Partial0.949588
RCM94.022748Complete0.978515
RCM92.055155Partial0.946551
RCS93.549451Complete0.959267
RCS91.987231Partial0.914206
RM93.855562Complete0.950907
RM91.955947Partial0.952878
RO94.796176Complete0.932837
RO91.636012Partial0.926436
Table 5. Summary of average grade and approved sub-competencies ratio by subject type and set of students for IBQ dataset.
Subject TypeAvg GradeSetApproved Ratio
Block92.121894Complete0.946806
Block90.153518Partial0.947961
Subject92.382627Complete0.974444
Subject90.170732Partial0.947870
Tec week99.301826Complete0.902334
Tec week99.194415Partial0.702470
Table 6. Summary of approved sub-competencies ratio and unique student counts by sub-competency level and set of students for IBQ dataset.
Sub-Competence LevelApproved RatioSetUnique Student Count
A0.964370Complete501
A0.930930Partial480
B0.965177Complete501
B0.966134Partial479
C1.000000Partial1
Table 7. Summary of approved sub-competencies ratio and unique student counts by competency type and set for IBQ dataset.
Competence TypeApproved RatioSetUnique Student Count
Area0.963002Complete501
Area0.951998Partial480
Disciplinary0.883252Complete491
Disciplinary1.000000Partial1
General education0.958172Complete501
General education0.908418Partial480
Table 8. Statistics of 2019 cohort from ICT program subjects (top 10 with the highest dispersion). SD and Avg represent the standard deviation and average grade; the Fail and Pass columns collect the number of students who failed or passed the subject; sub-competencies include all the sub-competencies that are involved in the evaluation of the subject.
SubjectSubject TypeSDAvgFailPassSub-Competencies
Object-Oriented ProgrammingSubject15.9488.4834663Problem evaluation, decision making, cutting-edge technologies
Object-Oriented Computational ThinkingSubject15.5086.1267679Application of standards and norms, demonstration of the functioning of systems in engineering and sciences, cutting-edge technologies, problem evaluation, decision making, implementation of actions
Mathematical ThinkingSubject14.6683.3978680Explanation of the functioning of systems in engineering and sciences, scientific thought, understanding others’ code, problem evaluation
Computational Thinking for EngineeringSubject13.2788.1140762Application of standards and norms, demonstration of the functioning of systems in engineering and sciences, cutting-edge technologies, problem evaluation, decision making, implementation of actions
Computational Modeling Applying Conservation LawsBlock13.1285.6442609Scientific thought, demonstration of the functioning of systems in engineering and sciences, explanation of the functioning of systems in engineering and sciences, systemic thinking, written language, problem evaluation, decision making, implementation of actions
Computational Biology AnalysisSubject13.0990.4926687Scientific though, understanding others’ code, determination of patterns, application of sustainability principles
Fundamentals of Biological SystemsSubject12.9185.54346Explanation of the functioning of systems in engineering and sciences, demonstration of the functioning of systems in engineering and sciences, scientific thought, digital culture, wellness and self-regulation
Ecological Processes for Human DevelopmentSubject12.9185.32245Application of standards and norms, scientific thought, digital culture, recognition and empathy, application of sustainability principles
Foundation of the Structure and Transformation of MatterSubject12.2184.4462761Explanation of the principles of systems in engineering and sciences, scientific thought, problem evaluation
Computational Modeling of MovementBlock11.8586.1744594Scientific thought, demonstration of the principles of systems in engineering and sciences, explanation of the principles of systems in engineering and sciences, systemic thinking, written language, problem evaluation, decision making, implementation of actions
Table 9. Top ten sub-competencies that posed the greatest difficulties to the students of the 2019 cohort from the ICT program.
Sub-CompetencyLevelFailedApprovedRatio
Problem evaluationA594668911.261
Demonstration of the functioning of systems in engineering and sciencesA255477118.71
Scientific thoughtA54646928.593
Decision makingA293389613.30
Explanation of the functioning of systems in engineering and sciencesA316361211.43
Implementation of actionsA185330517.865
Cutting-edge technologiesA131294722.496
Understanding others’ codesA221227310.285
Critical thinkingA200201710.085
Explanation of the functioning of systems in engineering and sciencesB103201319.544
Table 10. Comparison of both genders between the percentage of enrollments and failures, revealing a lower proportion of failures among females on ICT program subjects for the 2019 cohort.
SubjectMenWomenFail MenFail WomenWomen (%)Fail Women (%)
Object-Oriented Programming56313531319.348.82
Object-Oriented Computational Thinking603149551219.8117.91
Mathematical Thinking I60615769920.5811.54
Computational Thinking for Engineering63916334620.3215.00
Computational Modeling Applying Conservation Laws52612936619.6914.29
Computational Biology Analysis57114226019.920.00
Fundamentals of Biological Systems38113022.450.00
Ecological Processes for Human Development36113223.40100.00
Foundation of the Structure and Transformation…65416954820.5312.90
Computational Modeling of Movement51712141318.976.82
Intermediate Mathematical Modeling56314025119.913.85
Statistic Analysis56714015119.806.25
Engineering and Science Modeling68017222220.198.33
Mathematics and Data Science for Decision Making43101018.870.00
Computational Modeling of Electrical Systems51213216020.500.00
Table 11. Average results for ICT program subjects achieved by the students of the 2019 cohort who dropped out.
SubjectAvgFailPassSub-Competences
Foundation of the Structure and Transformation of Matter73.623275Explanation of the functioning of systems in engineering and sciences, scientific thought, problem evaluation
Mathematical Thinking67.512945Explanation of the functioning of systems in engineering and sciences, scientific thought, understanding others’ codes, problem evaluation
Object-Oriented Computational Thinking69.962643Application of standards and norms, demonstration of the functioning of systems in engineering and sciences, cutting-edge technologies, problem evaluation, decision making, implementation of actions
Computational Modeling of Movement71.582641Scientific thought, demonstration of the functioning of systems in engineering and sciences, explanation of the functioning of systems in engineering and sciences, systemic thinking, written language, problem evaluation, decision making, implementation of actions
Engineering and Science Modeling80.122095Explanation of the functioning of systems in engineering and sciences, problem evaluation, self-knowledge
Computational Thinking for Engineering75.822076Application of standards and norms, demonstration of the functioning of systems in engineering and sciences, cutting-edge technologies, problem evaluation, decision making, implementation of actions
Computational Modeling Applying Conservation Laws70.591540Scientific thought, demonstration of the functioning of systems in engineering and sciences, explanation of the functioning of systems in engineering and sciences, systemic thinking, written language, problem evaluation, decision making, implementation of actions
Object-Oriented Programming62.59913Problem evaluation, decision making, cutting-edge technologies
Computational Biology Analysis68.73716Scientific thought, understanding others’ codes, determination of patterns, application of sustainability principles
Intermediate Mathematical Modeling79.04520Problem evaluation, understanding others’ codes, explanation of the functioning of systems in engineering and sciences
Table 12. Ranking of most difficult sub-competencies and number of times that they are evaluated (based on the 2019 cohort of the ICT program, 15 examples). The difficulty value in the ranking is obtained by the difference between the number of approvals and fails for the sub-competency weighted by the total number of observations for each one.
Sub-CompetencyLevelEvaluationsRanking
Systemic thinkingA1611
Scientific thoughtA133
Written languageA1013
Understanding others’ codesA108
Problem evaluationA101
Critical thinkingA109
Demonstration of the functioning of systems in engineering and sciencesA82
Cutting-edge technologiesA77
Decision makingA74
Explanation of the functioning of systems in engineering and sciencesA75
Digital cultureA621
Implementation of actionsA66
Explanation of the functioning of systems in engineering and sciencesB410
Application of standards and normsA412
Wellness and self-regulationA322
Table 13. Number of evaluations in which a sub-competency is marked as failed after having been approved for the 2019 cohort in the ICT program (discarding cases equal to 0).
Sub-CompetencyLevelFailed
Problem evaluationA367
Scientific thoughtA297
Demonstration of the functioning of systems in engineering and sciencesA196
Explanation of the functioning of systems in engineering and sciencesA192
Decision makingA182
Implementation of actionsA90
Cutting-edge technologiesA89
Critical thinkingA79
Systemic thinkingA67
Understanding others’ codesA56
Written languageA37
Explanation of the functioning of systems in engineering and sciencesB34
Application of standards and normsA26
Application of sustainability principlesA3
InnovationA1
Implementation of actionsB1
Table 14. Grouping of sub-competencies by competencies in which they are evaluated (based on the 2019 cohort of the ICT program).
CompetenciesEvaluated Sub-CompetenciesRanking
Application of international standardsApplication of standards and norms—A, application of sustainability principles—A, application of sustainability principles—B, application of standards and norms12, 14, 36, 37
Commitment to sustainabilityApplication of standards and norms—A, application of sustainability principles—A12, 14
CommunicationUnderstanding others’ codes—A, written language—A, oral language—A8, 13, 38
Data analysis in engineering and scienceInterpretation of variables—A, development of scenarios—A, development of scenarios—B, interpretation of variables—B17, 19, 20, 18
Development of business architecturesRequirements analysis—A, incorporation of technology—A31, 33
Digital transformationDigital culture—A, cutting-edge technologies—A21, 7
Embedded systemsManaging technological design projects—A39
Ethical and citizen commitmentRecognition and empathy—A, citizen commitment for social transformation—A23, 40
Foundation of computer systemsDemonstration of the functioning of systems in engineering and sciences—A, explanation of the functioning of systems in engineering and sciences—A, explanation of the functioning of systems in engineering and sciences—B, demonstration of the functioning of systems in engineering and sciences—B2, 5, 10, 27
Foundation of engineering and science systemsExplanation of the functioning of systems in engineering and sciences—A, demonstration of the functioning of systems in engineering and sciences—A, explanation of the functioning of systems in engineering and sciences—B5, 2, 10
Generation of computational models for data analysisDetermination of patterns—A, determination of patterns—B, interpretation of variables—B, development of scenarios—B16, 34, 18, 20
Innovative entrepreneurshipInnovation—A26
Problem solvingProblem evaluation—A, decision making—A, implementation of actions—A1, 4, 6
Problem solving with computingProblem evaluation—A, decision making—A, implementation of actions—A, problem evaluation—B, decision making—B, implementation of actions—B1, 4, 6, 30, 29, 25
Reasoning for complexityScientific thought—A, systemic thinking—A, critical thinking—A3, 11, 9
Self-knowledge and managementWellness and self-regulation—A, self-knowledge—A22, 15
Social intelligenceDiversity—A, collaboration—A24, 41
Software systems developmentDefinition of software requirements—A, application of software methodologies—A, computer project management—A28, 32, 35
Table 15. Comparison between arithmetic and weighted mean by number of credits for the 2019 and 2020 cohorts of the ICT and IBQ programs.
ProgramSemesterMean 2019Weighted Mean 2019Mean 2020Weighted Mean 2020
ICT185.19785.51289.67190.185
ICT289.69789.87089.98689.874
ICT388.48888.58390.34590.578
ICT470.50270.78882.09481.707
ICT566.77566.570--
ICT685.48583.921--
IBQ186.37786.88990.35590.810
IBQ289.92689.43091.15491.099
IBQ386.52485.66289.40988.580
IBQ483.25682.57281.97382.249
IBQ583.53582.228--
IBQ686.73186.944--
Table 16. Evaluation of Tec weeks for the 2019 cohort of the ICT entry program. SD and Avg represent the standard deviation and average grade; the Fail and Pass columns collect the number of students who failed or passed the subject.
SubjectSDAvgFailPassSub-Competences
Week 18 Engineering—118.3396.5229805Self-knowledge
Week 18 Engineering—213.6998.0915769Self-knowledge
Entrepreneurship with Purpose17.2296.9421665Conscious entrepreneurship
Turn Your Wellness On10.5198.884353Wellness and self-regulation
My Selfie Today17.8196.746178Self-knowledge
A Trip to My Interior19.9995.866139Self-knowledge
Me, You, Others, Us12.0498.542135Diversity
Meaningful Theater14.6797.81289Innovation
Induction to the Social Service28.8191.30221Recognition and empathy
18th Week All Entries47.0569.57716Self-knowledge
Week 18 Multientry Exploration—322.3695.00119Self-knowledge
Table 17. Evaluation of Tec weeks for the 2019 cohort of the ITC program (long duration).
SemestSubjectSDAvgFailPassSub-Competences
4Week 18 Engineering ICT—46.5099.572466Self-knowledge
5Week 18 Focus ITC—515.1297.6610418Self-knowledge
3Induction to the Social Service13.7798.074203Recognition and empathy
5Next Level: Competitive Programming Expert10.1998.952189Collaboration, computational algorithm optimization
3CS Tool—Mastering Programming0.00100.000139Application of standards and norms
5Web World Connecting12.7298.362120Cutting-edge technologies, software component development
5Diversity in a Globalized World20.0795.835115Diversity
6One Click Away from your Professional Life12.8698.332118Self-knowledge
4CS Tool—Mastering Programming16.0197.393112Application of standards and norms
4CS Tool—Mastering Analytics9.7699.051104Interpretation of variables
6Web World Connecting10.2398.95194Software component development, cutting-edge technologies
4Ikigai: Building your Dreams14.5197.87292Wellness and self-regulation
6Diversity in a Globalized World27.8091.67777Diversity
5CS Tool—Mastering Programing10.9898.80182Application of standards and norms
3CS Tool—Mastering Analytics26.3592.59675Interpretation of variables
3Diversity in a Globalized World11.3298.72177Diversity
4Multigenerational Leadership19.7396.00372Effectiveness in negotiation
4The Art of Emotion11.5598.67174Understanding others’ codes
5CS Tool—Mastering Analytics11.5598.67174Interpretation of variables
3Multigenerational Leadership0.00100.00075Effectiveness in negotiation
4The Role of Integrity in Practicing my Profession16.4497.26271Integrity
4Diversity in a Globalized World20.6995.59365Diversity
4Me, You, Others, Us12.2298.51166Diversity
6CS Tool—Mastering Programing24.5893.65459Application of standards and norms
Table 18. Sub-competencies assessed in the Tec weeks of the ICT entry program.
Sub-CompetencyLevelFalseTrueTotal
Self-knowledgeA83511962031
Conscious entrepreneurshipA24666690
Wellness and self-regulationA10361371
DiversityA6150156
InnovationA3105108
Recognition and empathyA22729
Application of standards and normsA41115
Interpretation of variablesA088
CollaborationA077
Understanding others’ codesA077
Effectiveness in negotiationA167
Digital cultureA123
Table 19. Sub-competencies assessed in the Tec weeks of the ITC long-term program.
Sub-CompetencyLevelFalseTrueTotal
Self-knowledgeA4919331424
DiversityA16562578
Application of standards and normsA20547567
Wellness and self-regulationA13414427
CollaborationA7360367
Interpretation of variablesA6294300
Effectiveness in negotiationA5239244
Computational algorithm optimizationB1225226
Recognition and empathyA9216225
Software component developmentA3214217
Cutting-edge technologiesA3214217
Understanding others’ codesA4208212
Citizen commitment for social transformationB4158162
IntegrityB5146151
Conscious entrepreneurshipA106373
Wellness and self-regulationB23234
Digital cultureA088
InnovationA167
Self-knowledgeB022
Table 20. Correlation matrix between full-time equivalent (FTE) and suspensions count.
student.ftesuspensions_count
student.fte1.000000−0.035677
suspensions_count−0.0356771.000000
Table 21. Comparison of student final grades by FTE category. This table shows the average final grades of students after adjustments, categorized by their FTE status.
fte_categorystudent_grades.final_numeric_afterAdjustment
Above 187.186581
Below 188.042601
Exactly 190.308793
Disclaimer/Publisher’s Note: The statements, opinions and data contained in all publications are solely those of the individual author(s) and contributor(s) and not of MDPI and/or the editor(s). MDPI and/or the editor(s) disclaim responsibility for any injury to people or property resulting from any ideas, methods, instructions or products referred to in the content.

