Article

Electrochemical Sensors Based on Metal-Porous Carbon Nanozymes for Dopamine, Uric Acid and Furazolidone

College of Chemistry and Chemical Engineering, Jiangxi Normal University, 99 Ziyang Avenue, Nanchang 330022, China
*
Authors to whom correspondence should be addressed.
Chemosensors 2022, 10(11), 458; https://doi.org/10.3390/chemosensors10110458
Submission received: 14 October 2022 / Revised: 31 October 2022 / Accepted: 1 November 2022 / Published: 4 November 2022

Abstract

:
A series of electrochemical sensors based on metal-porous carbon nanozymes were developed for the detection of dopamine (DA), uric acid (UA) and furazolidone (FZ). The metal-porous carbon nanozymes were prepared by calcination of porous crystalline covalent-organic frameworks (COFs) loaded metal ions. By carbonizing, the COFs was transformed into carbon nanosheets (CN) and metal ions were reduced into 5–10 nm MNPs loaded on CN uniformly (CuNPs/CN, FeNPs/CN, NiNPs/CN and CoNPs/CN). These porous MNPs/CN nanozymes were used for electrochemical detection of DA, AA and FZ, showing good performance. The electrochemical sensor based on CuNPs/CN nanozymes was used to simultaneously measure DA and UA. The linear range of DA detection was 0.015 μ–140 μM, the linear range of UA detection was 0.03 μM–175 μM, and the sensitivity of DA and UA were 1.03 μA μM−1 cm−2 and 0.52 μA μM−1 cm−2. The sensitivity of sensors based on FeNPs/CN, CoNPs/CN and NiNPs/CN nanozymes to detect DA were 1.30 μA cm−2 μM−1, 1.07 μA cm−2 μM−1 and 0.88 μA cm−2 μM−1, the linear ranges were 35 nM–200 μM, 42 nM–250 μM and 52 nM–250 μM. The sensitivity of detecting UA were 0.310 μA cm−2 μM−1, 0.587 μA cm−2 μM−1 and 0.360 μA cm−2 μM−1, the linear ranges were 145 nM–900 μM, 77 nM–700 μM and 125 nM–800 μM. Finally, CuNPs/CN was also used to construct a FZ sensor with a linear range of 61.5 nM–200 μΜ and a detection limit of 20.1 nM. The sensors also have good reproducibility and repeatability.

1. Introduction

Metal nanoparticles (MNPs) nanozymes are widely used in electrochemical sensors due to their excellent enzyme-like catalytic activity and intrinsic adsorbability. However, the property of easy aggregation originated from their high surface energy seriously affects the performance of MNPs nanozymes in electrochemical sensors [1,2,3,4]. Accordingly, many two-dimensional (2D) nanomaterials such as graphene [5], graphyne [6,7], MXenes [8,9], MoS2 and metal-organic frameworks [10,11,12,13] have been used to load MNPs nanozymes to prevent them from gathering. Among these 2D nanomaterials, graphene and graphyne have attracted extensively attentions due to their excellent electrical conductivity and large specific surface area. Many results indicated that the combination of MNPs nanozymes with graphene or graphyne improved their performance greatly [14,15,16]. Unfortunately, the lack of uniformly distributed functional groups makes them unable to anchor MNPs nanozymes well [17,18]. So, it is necessary to explore a satisfactory 2D material for loading MNPs nanozymes.
Covalent-organic frameworks (COFs) are a class of 2D crystalline materials with ordered pores, large specific surface area and abundant functional groups, and are being tested for application in sensors [19,20,21,22,23]. The abundant functional groups on the surface of COFs could be used as chelating sites for anchoring metal ions, which make them promising in the preparation of MNPs nanozymes with monodisperse and small size. For example, Song’s group prepared monodisperse CuNPs and PtNPs on the surface of COFs for the construction of glucose and hydrogen peroxide sensors [24]. The COFs have been used to anchor metal ions to prepare metal oxide nanostructures/carbon nanocomposites for enhanced Li-storage by high-temperature carbonization of 2D COFs@M2+/3+ [25,26,27]. The as-formed metal oxide nanostructures were uniformly arrayed carbon nanomaterials-derived from COFs, which enhanced the Li storage performance. The results suggest 2D COFs may be good precursors to prepare MNPs nanozymes with monodisperse and small size/carbon nanosheets (CN).
In this work, 2D COFTD with double chelating sites were prepared based on condensation of 1,3,5-tris(4-aminophenyl)benzene (TAPB) and 2,6-dihydroxynaphthalene-1,5-diformaldehyde (DHNDA). Then, COFTD was used as precursor to chelate metal ions (M2+/3+). The porous structure and large specific surface of COFTD allow functional groups as metal ion chelating sites to be fully exposed on its surface. So, the M2+/3+ were doped into the COFTD lamellas and pores uniformly and stably. MNPs nanozymes with monodisperse and small size were arrayed on porous CN-derived from 2D COFTD by high temperature carbonization of COFTD/M2+/3+. The MNPs nanozymes/CN was used to construct electrochemical sensors for detecting dopamine (DA), uric acid (UA) and furazolidone (FZ). Dysregulation of DA can cause many diseases [28,29,30]. The change of UA concentration will reflect the status of purine metabolism, immunity and other functions and are associated with risks of gout, Lesh-Nyhan syndrome, cardiovascular disease, metabolic syndrome and cancer [31,32,33,34,35]. FZ as carcinogenic and mutagenic drugs was widely used in feed additive for animals [36,37,38,39]. Various detection techniques, such as high performance liquid chromatography (HPLC), mass spectrometry and spectrophotometry, have been developed to detect these substances. However, although these techniques do well, they are limited by high cost and complicated operation. Because of the simplicity and portability of electrochemical sensors, it is very necessary to develop electrochemical DA, UA and FZ sensors [40].

2. Experimental

2.1. Reagents

1,3,5-tris(4-aminophenyl)benzene (TAPB) and 2,6-dihydroxynaphthalene-1,5-diformaldehyde (DHNDA) were purchased from Jilin Chinese Academy of Sciences-Yanshen Technology Co., Ltd. (Changchun, China). DA, UA, FZ, acetic acid (C2H4O2), 1,2-dichlorobenzene, 1-butanol, tetrahydrofuran, acetone, Cu(NO3)2·6H2O, Fe(NO3)3·9H2O, Co(NO3)2·6H2O and Ni(NO3)2·6H2O were purchased from Aladdin Co., LTD. (Shanghai, China). Na2HPO4·12H2O, NaH2PO4·2H2O, ethanol and other chemical substances were purchased from Beijing Chemical Reagent Factory (Beijing, China). A phosphate buffer (0.2 M PBS) was made from 0.2 M dibasic sodium phosphate solution and 0.2 M sodium dihydrogen phosphate solution. All reagents were analytically pure and were not further purified and used directly. All solution was prepared with ultrapure water, and the ultrapure water purification system is the Millipore-Q purified (ρ ≥ 18.2 MΩ cm−1).

2.2. Instruments

JEM-2010 (HR) was used for obtaining transmission electron microscopy (TEM) images. Fourier transform infrared spectroscopy (FTIR) was recorded on model Perkin-Elmer Spectrome 100 spectrometer (Perkin-Elmer Company, Waltham, Massachusetts, USA). N2 adsorption/desorption isotherm tests were carried out with Autosorb-iQ (Quantachrome) under 77 K (Shanghai, China). X-ray photoelectron spectroscopy was taken using the ESCA-LAB-MKII, with Al Kα as the excitation source, and C1s (284.6 eV) as the reference line. SDT 2960 was used for obtaining the instrument model of the thermogravimetric analysis (TGA), the heating rate was 10 °C min−1, and the test was performed under a nitrogen atmosphere. Powder X-ray diffraction (XRD) analysis was performed on a D/Max 2500 V/PC X-ray powder diffractometer using kCu Kα radiation range from 2° to 35° with scanning step controlled 1°/min. All electrochemical measurements were performed on a CHI 760D electrochemical workstation (Shanghai, China) with a conventional three-electrode system including COFTD/GCE, CN/GCE and MNPs/GCE (M = Cu, Fe, Co, Ni) modified electrode as the working electrodes, a platinum wire as the auxiliary electrode and a saturated calomel electrode (SCE, saturated KCl) as the reference electrode. Cyclic voltammetry (CVs) and electrochemical impedance spectroscopy (EIS) were performed in a 0.1 M KCl solution containing 5.0 mM [Fe(CN)6]3-/4-, the frequency range is 0.01–100 KHz, and the voltage was the open circuit voltage. AC impedance was used to analyze the electron transmission rate and the interface state of ion transmission at various stages. The differential pulse voltammetry (DPV) test was performed in 0.2 M N2-statured PBS (pH = 7).

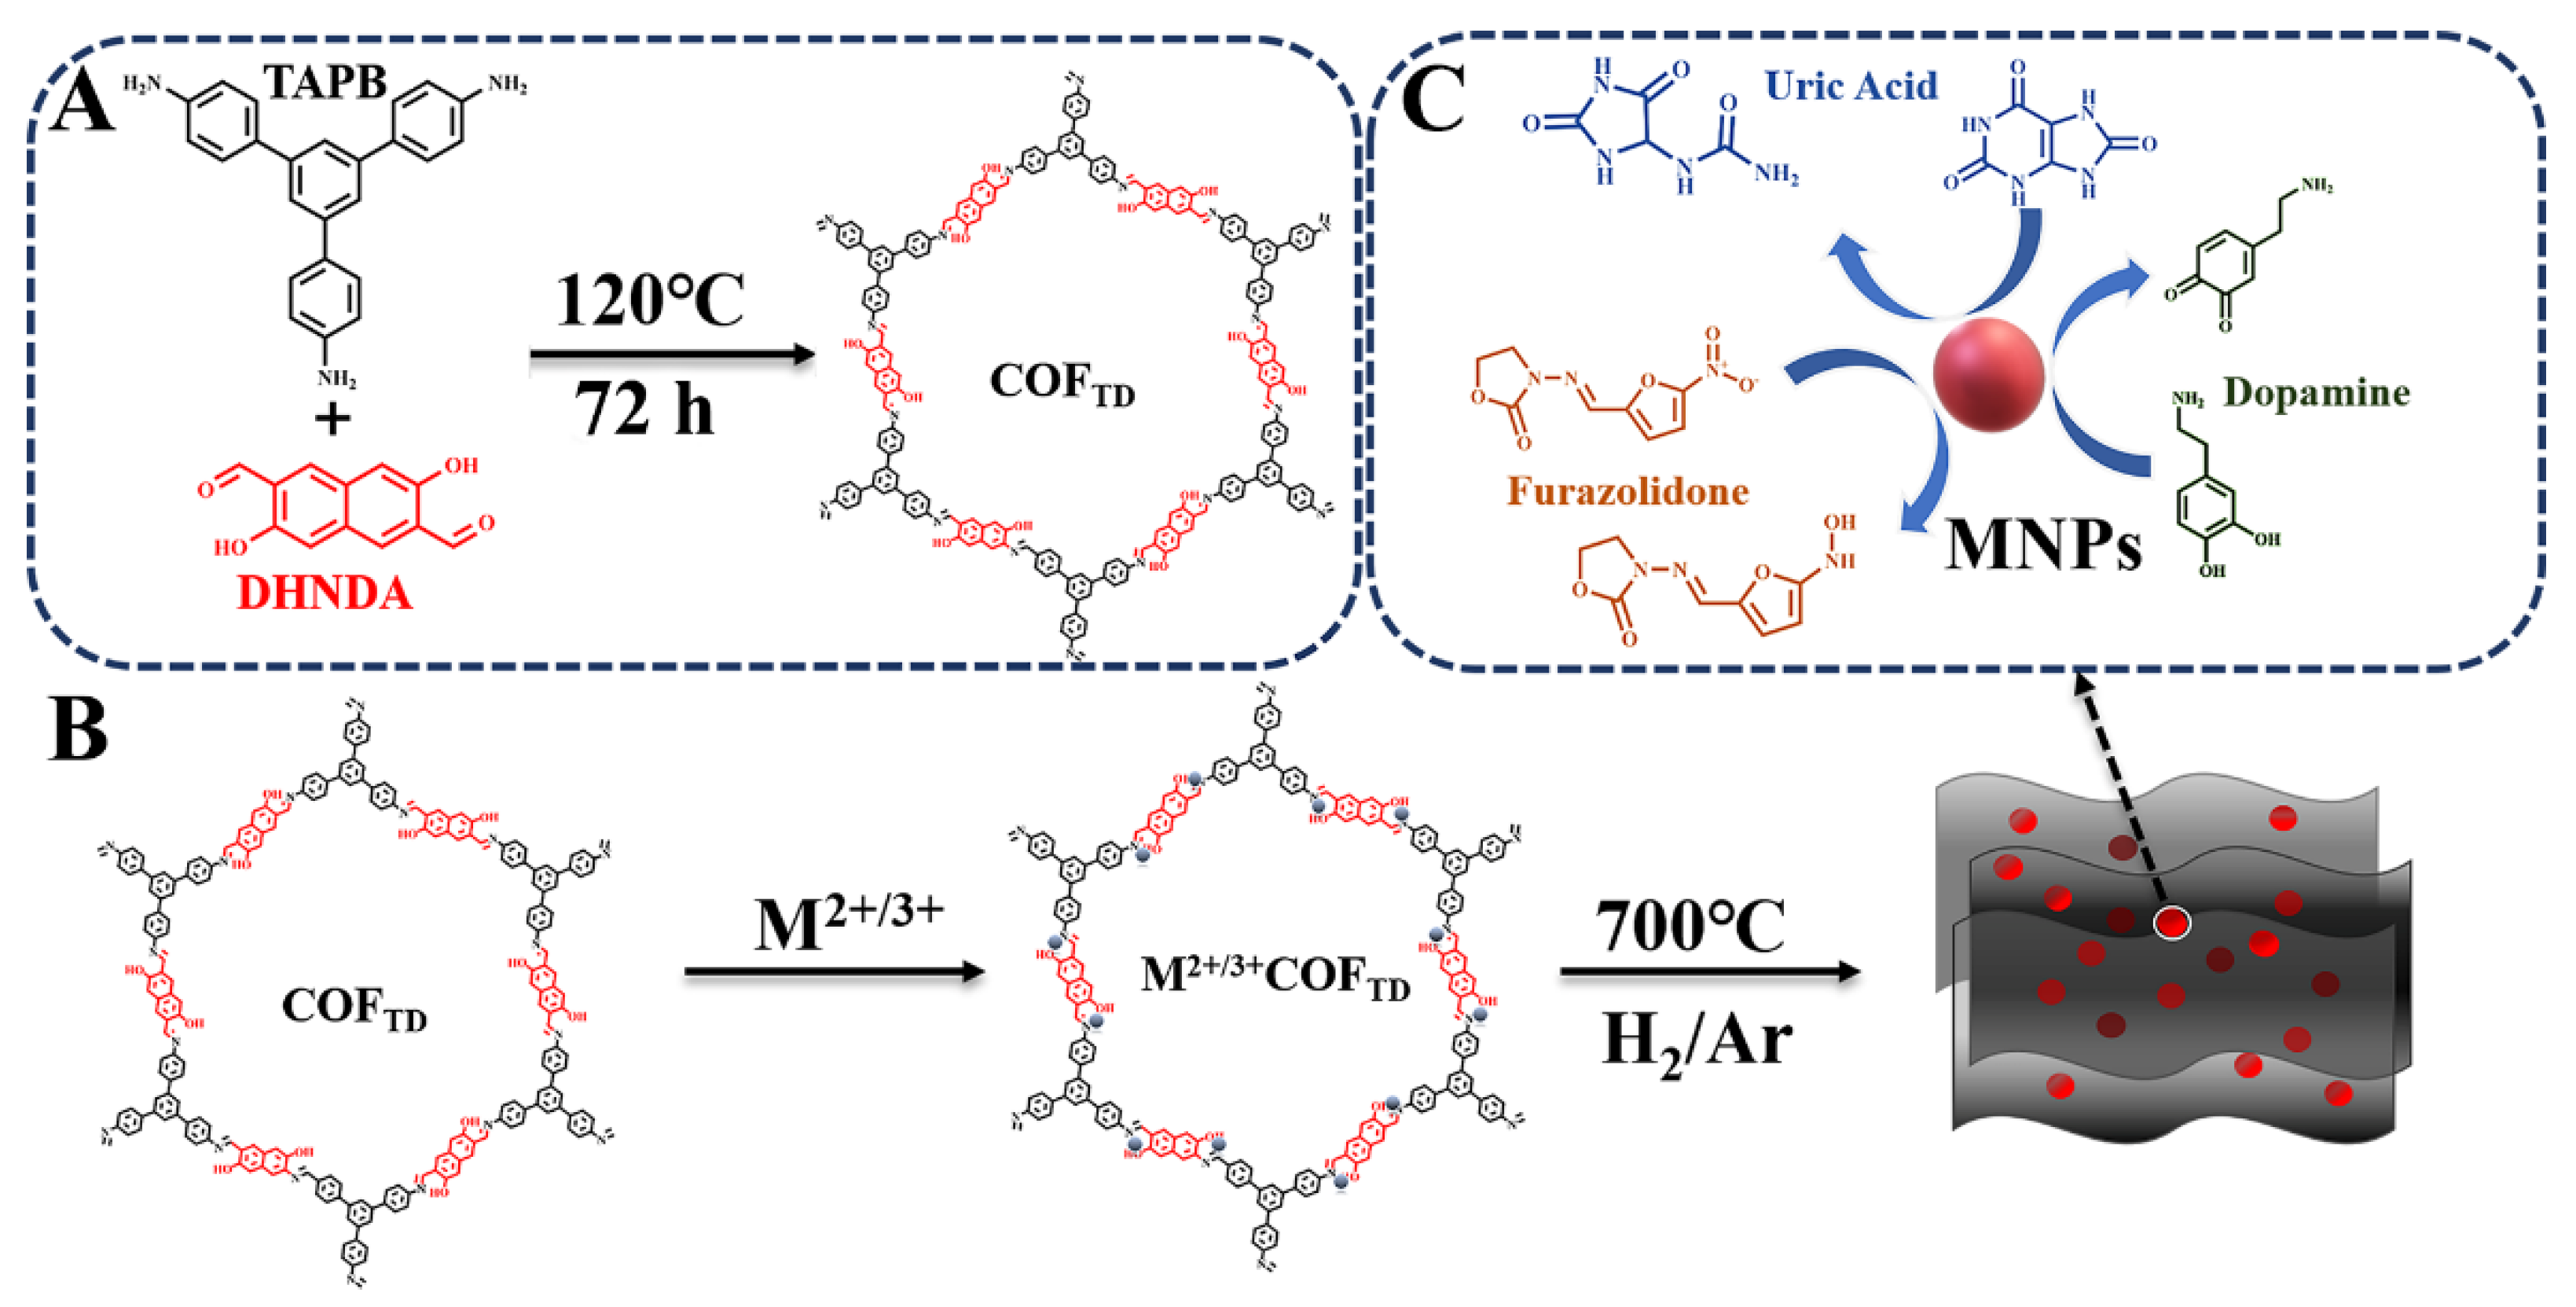
2.3. Preparation of COFTD, CN, MNPs Nanozymes/CN

For preparation of COFTD, 21.1 mg TAPB and 19.4 mg DHNDA were added to a mixed solution with 0.5 mL 1,2-dichlorobenzene and 1.5 mL 1-butanol. Then, the pale-yellow solution was obtained by ultrasonic dispersion. After 0.2 mL 6 M HAc was added, the dispersion was heated to 120 °C. After 72 h, reddish-brown precipitates were obtained. Then the precipitate was washed in turn with tetrahydrofuran, acetone and dichloromethane for several times until the upper liquid was colorless, and COFTD was obtained after freeze-drying for 12 h.
For preparation of M2+/3+/COFTD (M = Cu, Fe, Co, Ni), 24.2 mg Cu(NO3)2·6H2O, 40.4 mg Fe(NO3)3·9H2O, 29.1 mg Co(NO3)2·6H2O or 29.1 mg Ni(NO3)2·6H2O were dissolved in 40 mL ethanol solution. Then 40 mg COFTD was added to the above solution and stirred at room temperature for 24 h. Next, the products were washed with ethanol and ultrapure water, and freeze-dried to obtain M2+/3+/COFTD.
For preparation of CN and MNPs/CN nanocomposites, the dried COFTD and M2+/3+/COFTD were put into a porcelain boat, and then carbonized under H2/Ar at 700 °C for 2 h. After that, the black powders of CN and MNPs/CN nanomaterials were obtained. The schematic preparation of COFTD and MNPs/CN as well as the catalysis of UA, DA and FZ by MNPs/CN nanozymes were shown in Scheme 1.

2.4. Preparation of COFTD/Glassy Carbon Electrode (GCE), M2+/3+/COFTD/GCE, CN/GCE and MNPs/CN/GCE

2 mg COFTD, M2+/3+/COFTD, CN or MNPs/CN nanozymes were dispersed in 1 mL ultrapure water. Then the suspension was sonicated to obtain the dispersion, and dropped on the surface of GCE that has been cleaned by polishing. Finally, the COFTD/GCE, M2+/3+/COFTD/GCE, CN/GCE and MNPs/CN/GCE were obtained.

3. Results and Discussion

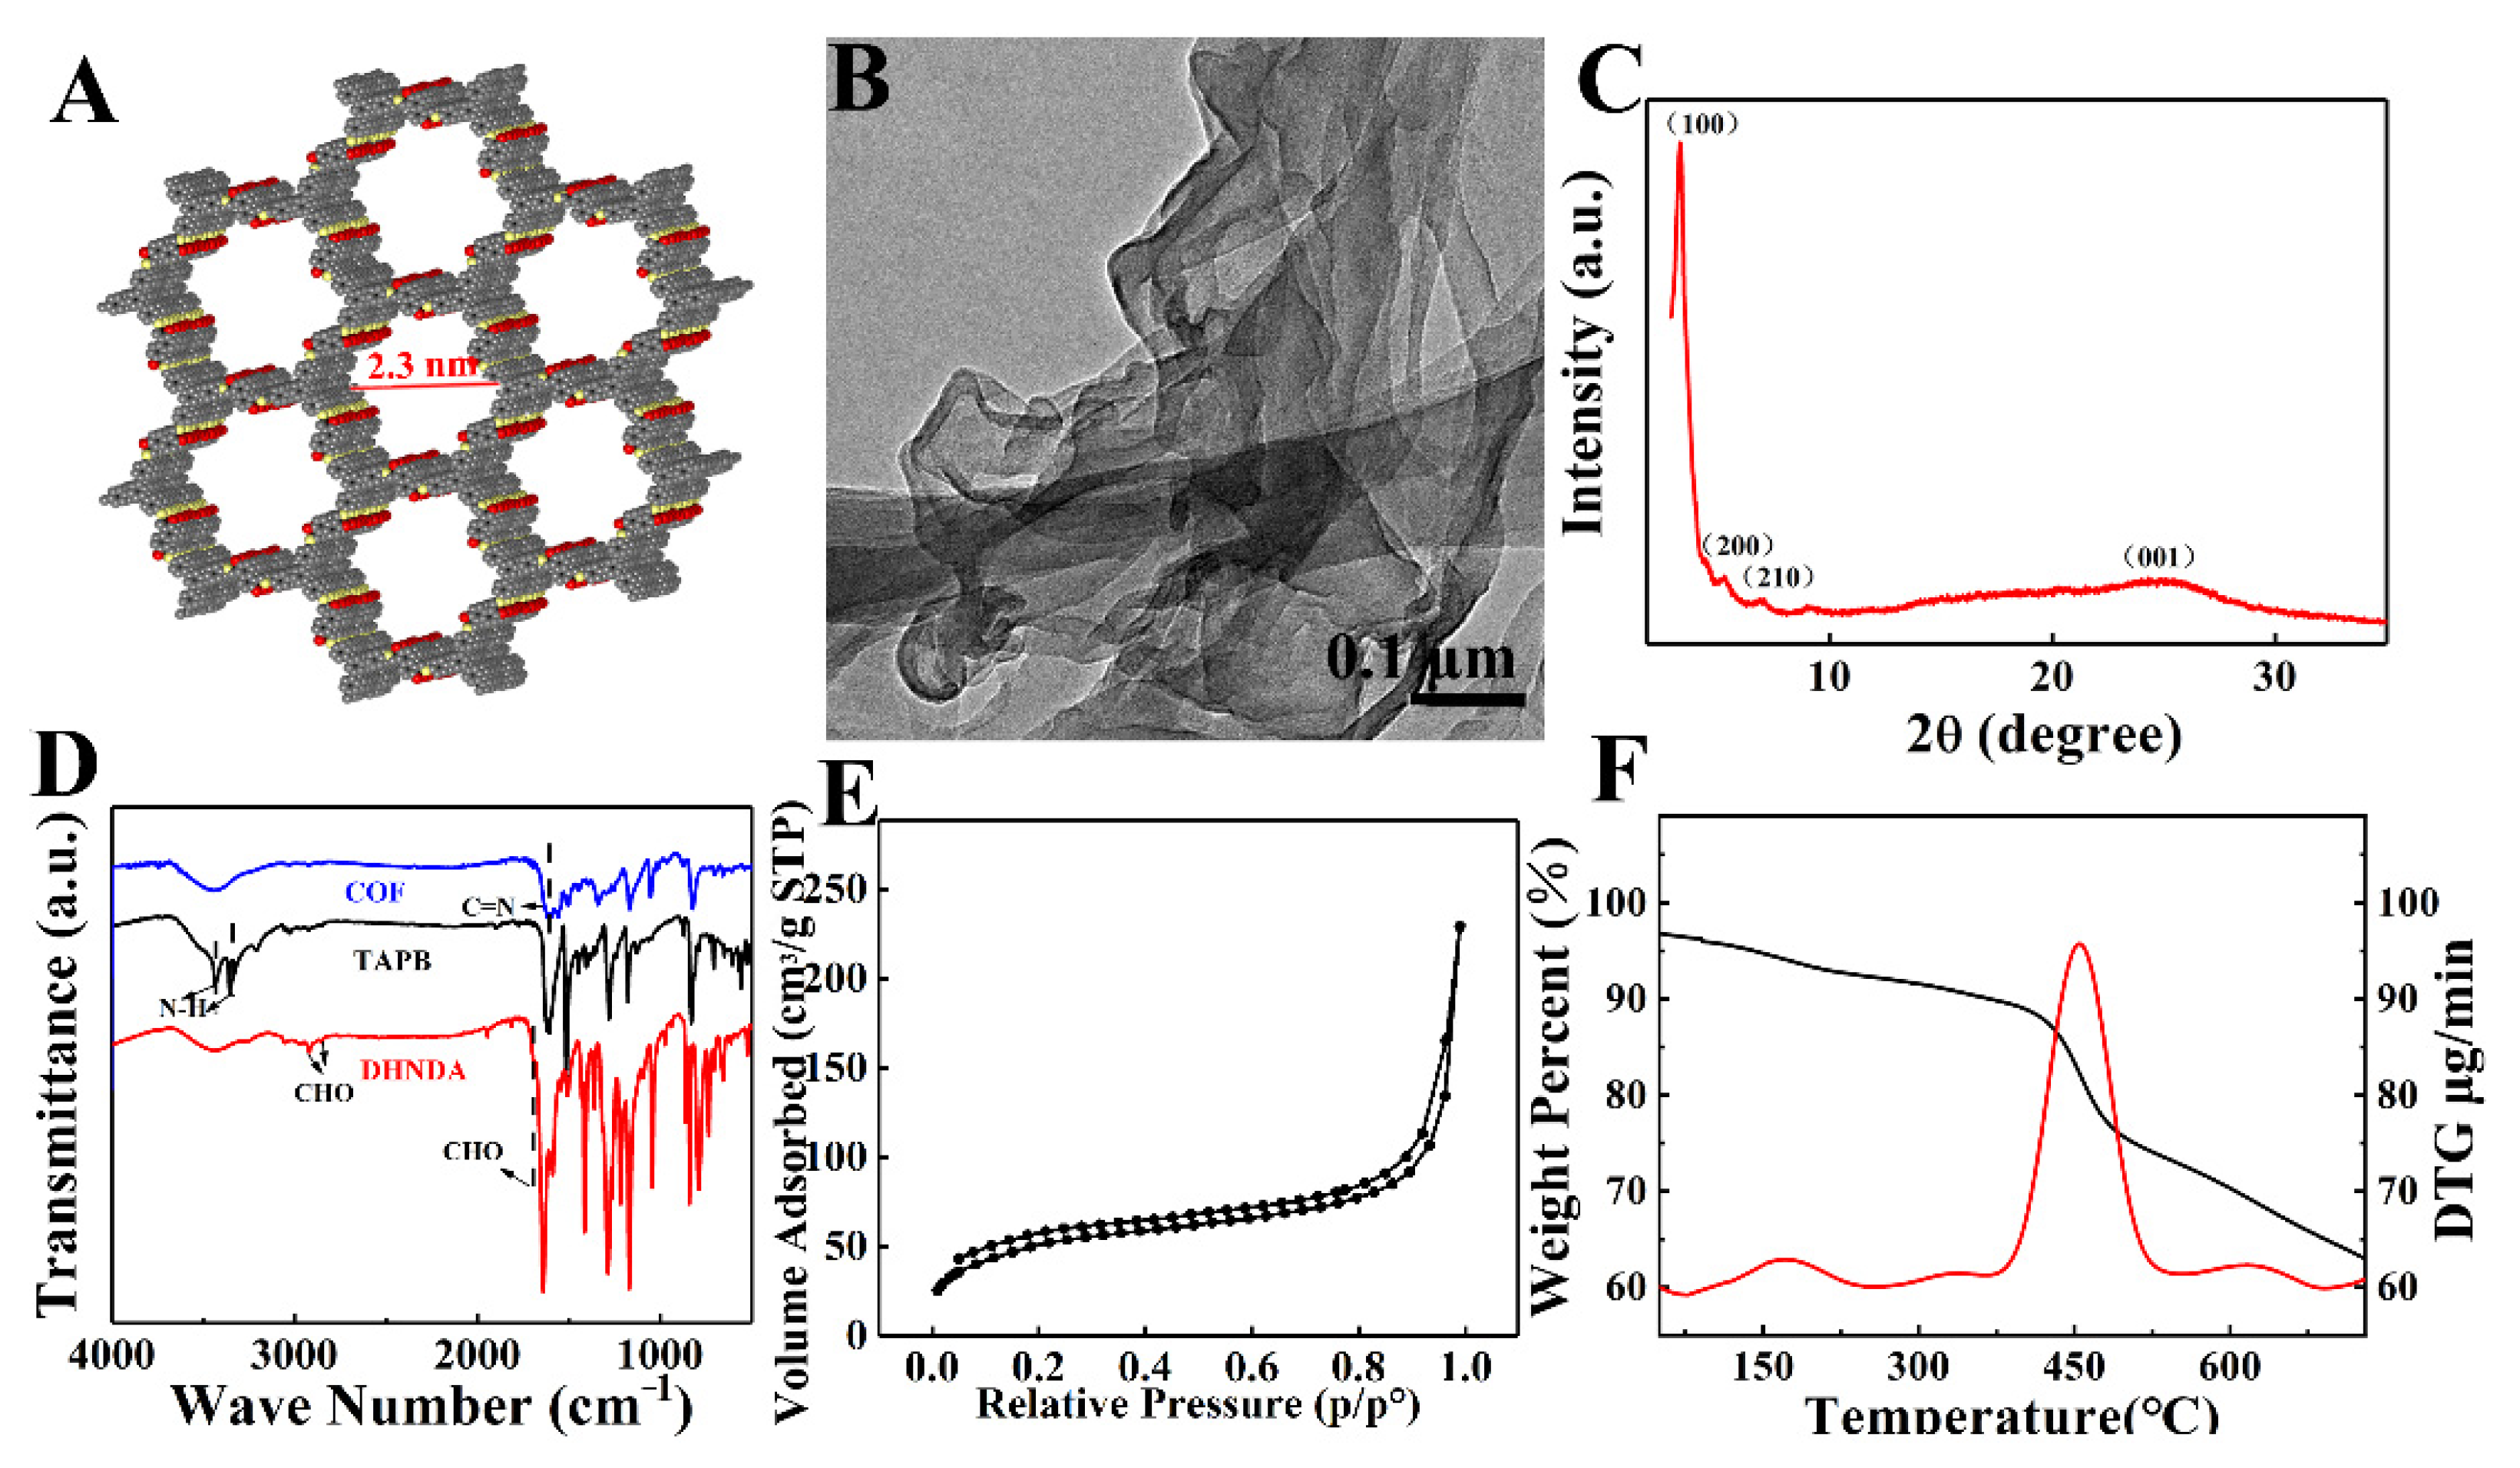
3.1. Characterization of COFTD

Figure 1A showed packing structure of COFTD with well-ordered 2.3 nm pores, indicating that the as-prepared COFTD belongs to AA stacking model [41]. TEM image showed that COFTD presented a 2D nanosheet structure with good flexibility (Figure 1B) [42]. XRD pattern of COFTD showed the characteristic peaks of (100), (200), (210) and (001) crystal planes at 3.29°, 5.3°, 7.21° and 25.1° (Figure 1C), proving that the crystallinity of COFTD was good [43,44,45]. Next, the formation of COFTD was confirmed by FTIR (Figure 1D). FTIR of COFTD showed that the stretching vibration of -NH2 in TAPB at 3372 cm−1 and 3299 cm−1 and the stretching vibration of -CHO in DHNDA at 2997 cm−1, 2854 cm−1 and 1698 cm−1 disappeared. Meanwhile, there was a new vibration peak of C=N at 1605 cm−1. The results proved that the amine-aldehyde condensation reaction between TAPB and DHNDA was carried out successfully [46,47,48]. N2-adsorption/desorption isotherm showed that Brunner-Emmet-Teller (BET) surface area of COFTD was 176 m2 g−1 (Figure 1E). The thermogravimetric analysis (TGA) curve (Figure 1F) showed an obvious weight loss of COFTD at about 450 °C [49].

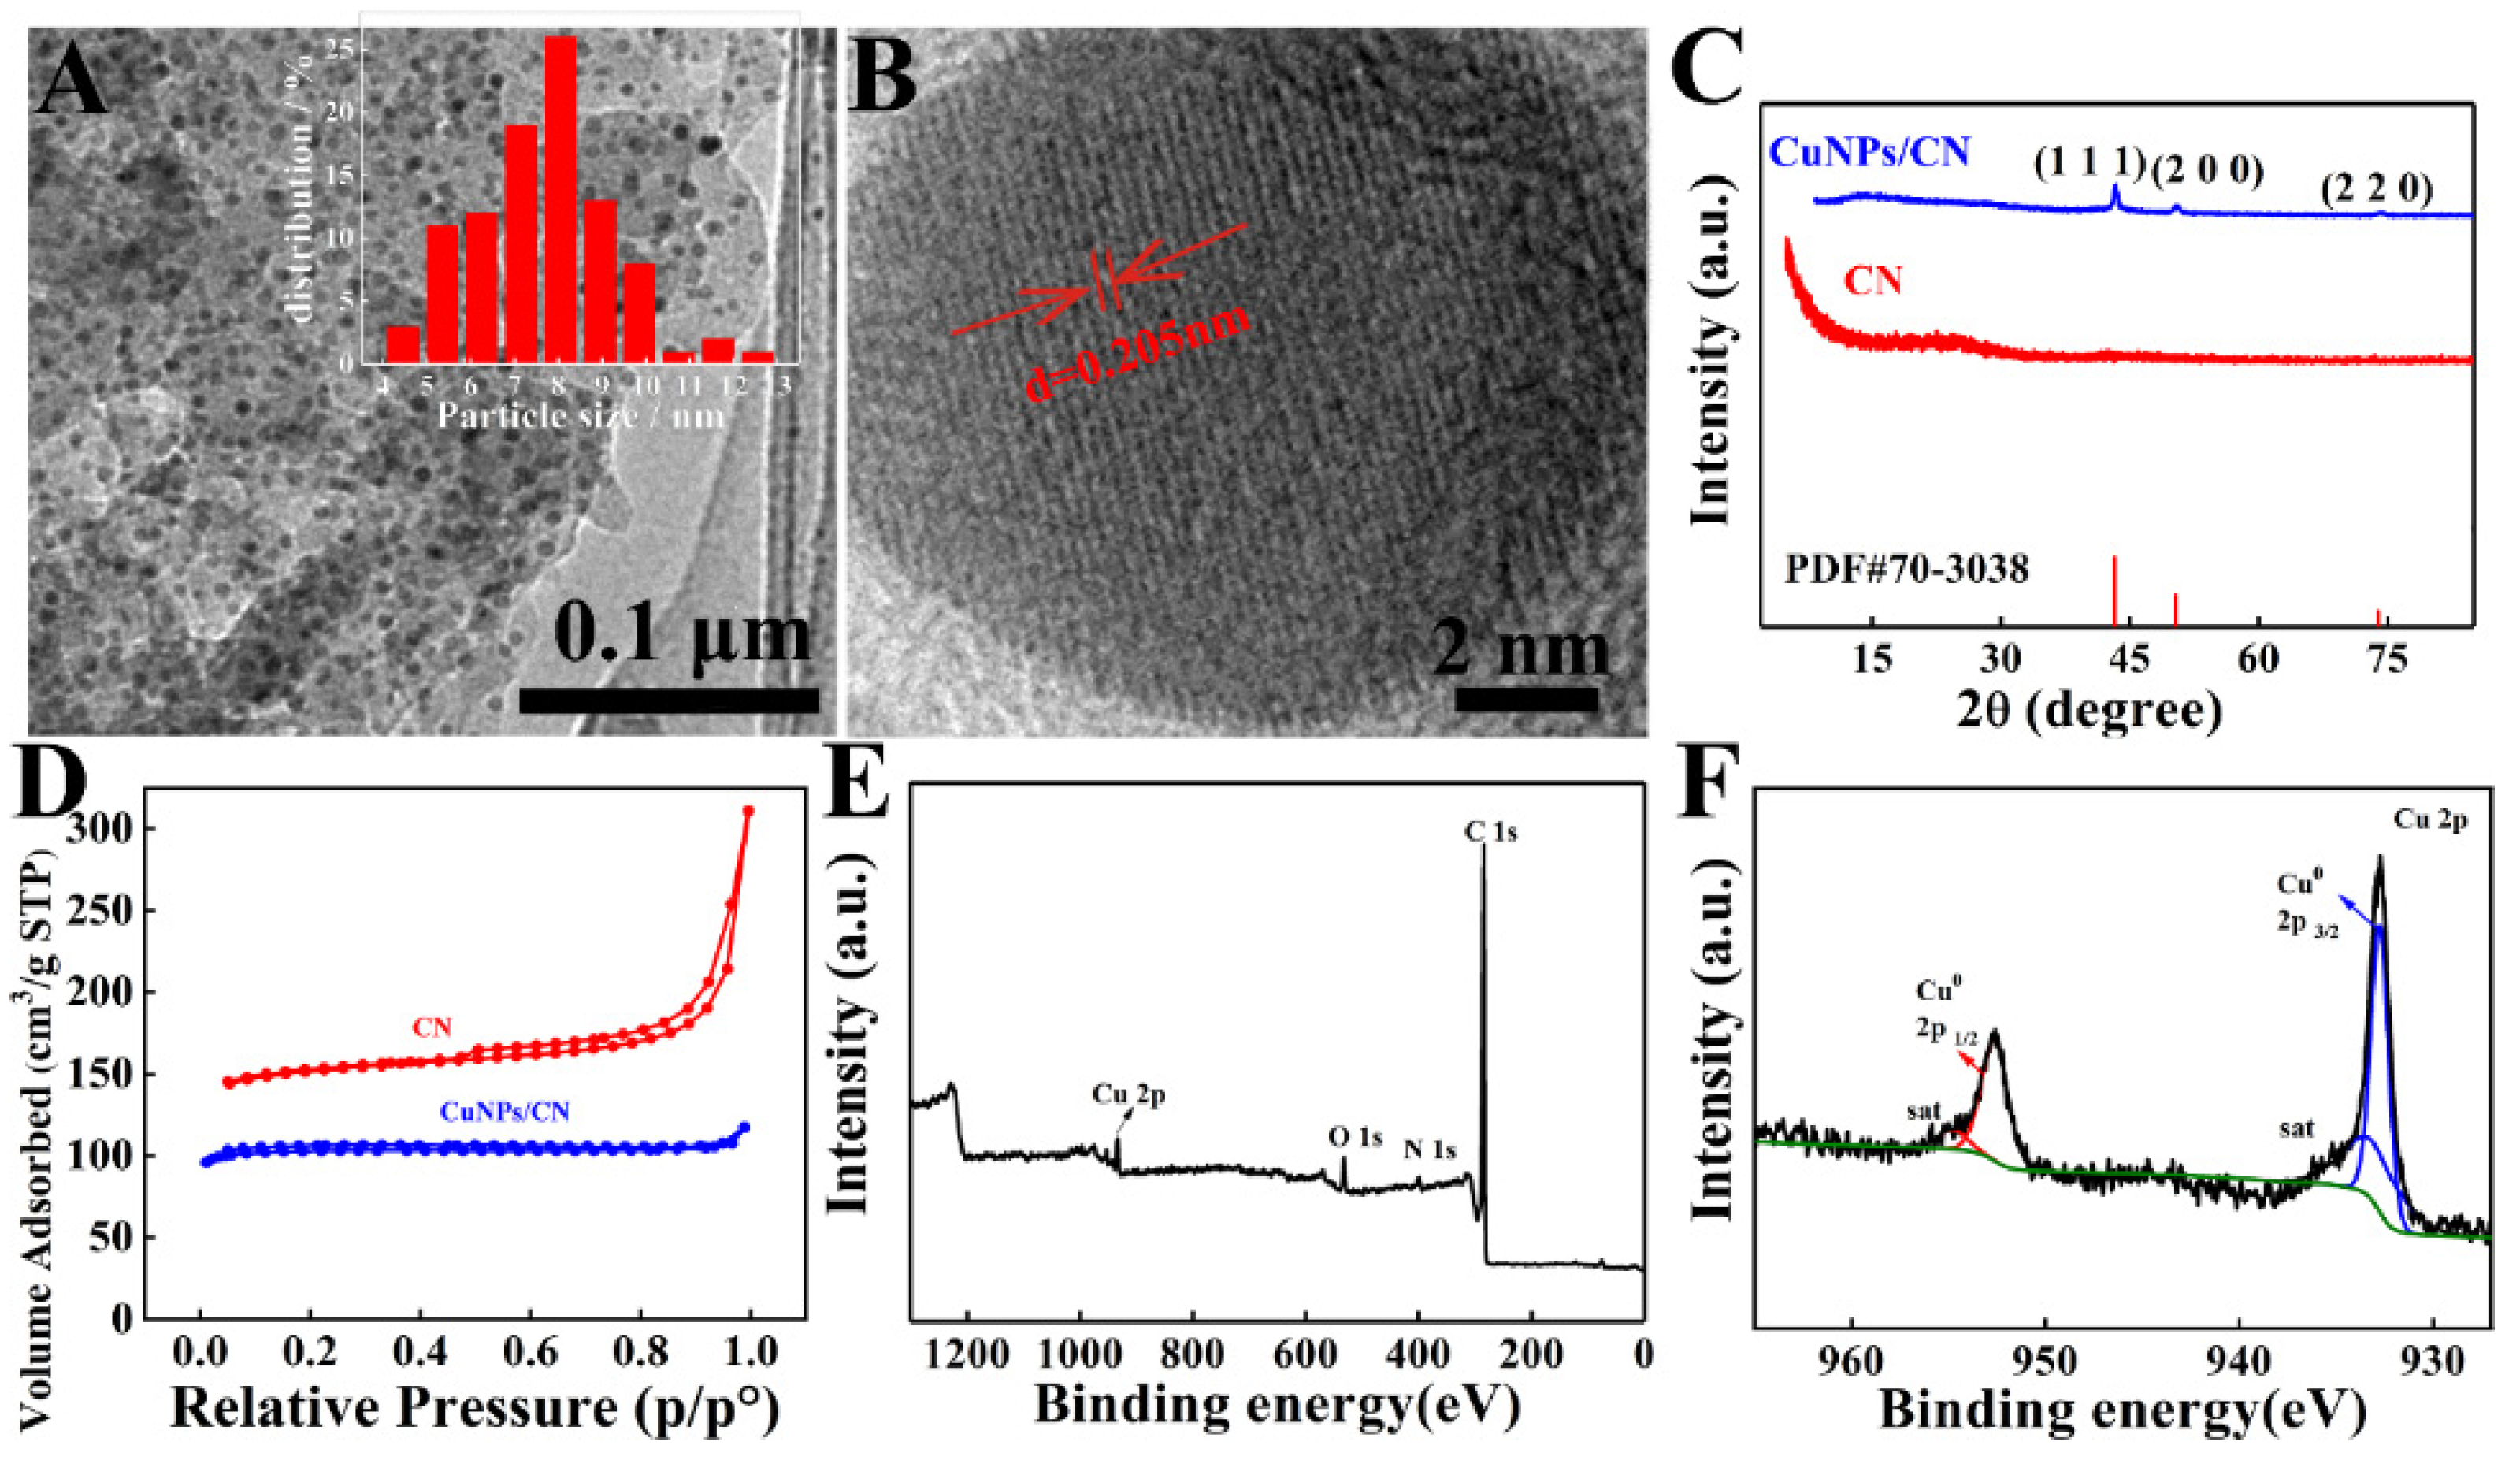
3.2. Characterization of CuNPs/CN

As shown in Figure S1, the CN with 2D nanosheet structure was formed after carbonization of COFTD. TEM image showed that CuNPs/CN were 2D nanosheets with a large number of nanoparticles uniformly (Figure 2A), and the inset indicated these nanoparticles were 8 nm in diameter. As shown in Figure 2B, there were obvious lattice fringes with a lattice spacing of 0.205 nm corresponded to (111) plane of CuNPs, demonstrating that the nanoparticles on CN were CuNPs [50]. Figure 2C showed the XRD of CN and CuNPs/CN. There was only a peak at around 25° on CN, which corresponded to the (001) crystal plane of carbon. The peaks at 43.19°, 50.30° and 73.89° on CuNPs/CN corresponded to the (111), (200) and (220) crystal planes of CuNPs (PDF#70-3038), which proved the successful formation of CuNPs on CN [51]. The BET area of CN and CuNPs/CN were 471 m2 g−1 and 356 m2 g−1, respectively (Figure 2D). XPS spectrum showed there were C, N, O and Cu elements in CuNPs/CN (Figure 2E). High-resolution XPS spectrum of CuNPs showed the peaks at 933.0 eV and 952.0 eV corresponded to Cu0 2p3/2 and Cu0 2p1/2 (Figure 2F), which further proved that the successful formation of CuNPs on CN. In addition, the two satellite peaks could also confirm the existence of Cu in CuNPs/CN composites. The amount of CuNPs in CuNPs/CN was about 11.8%.

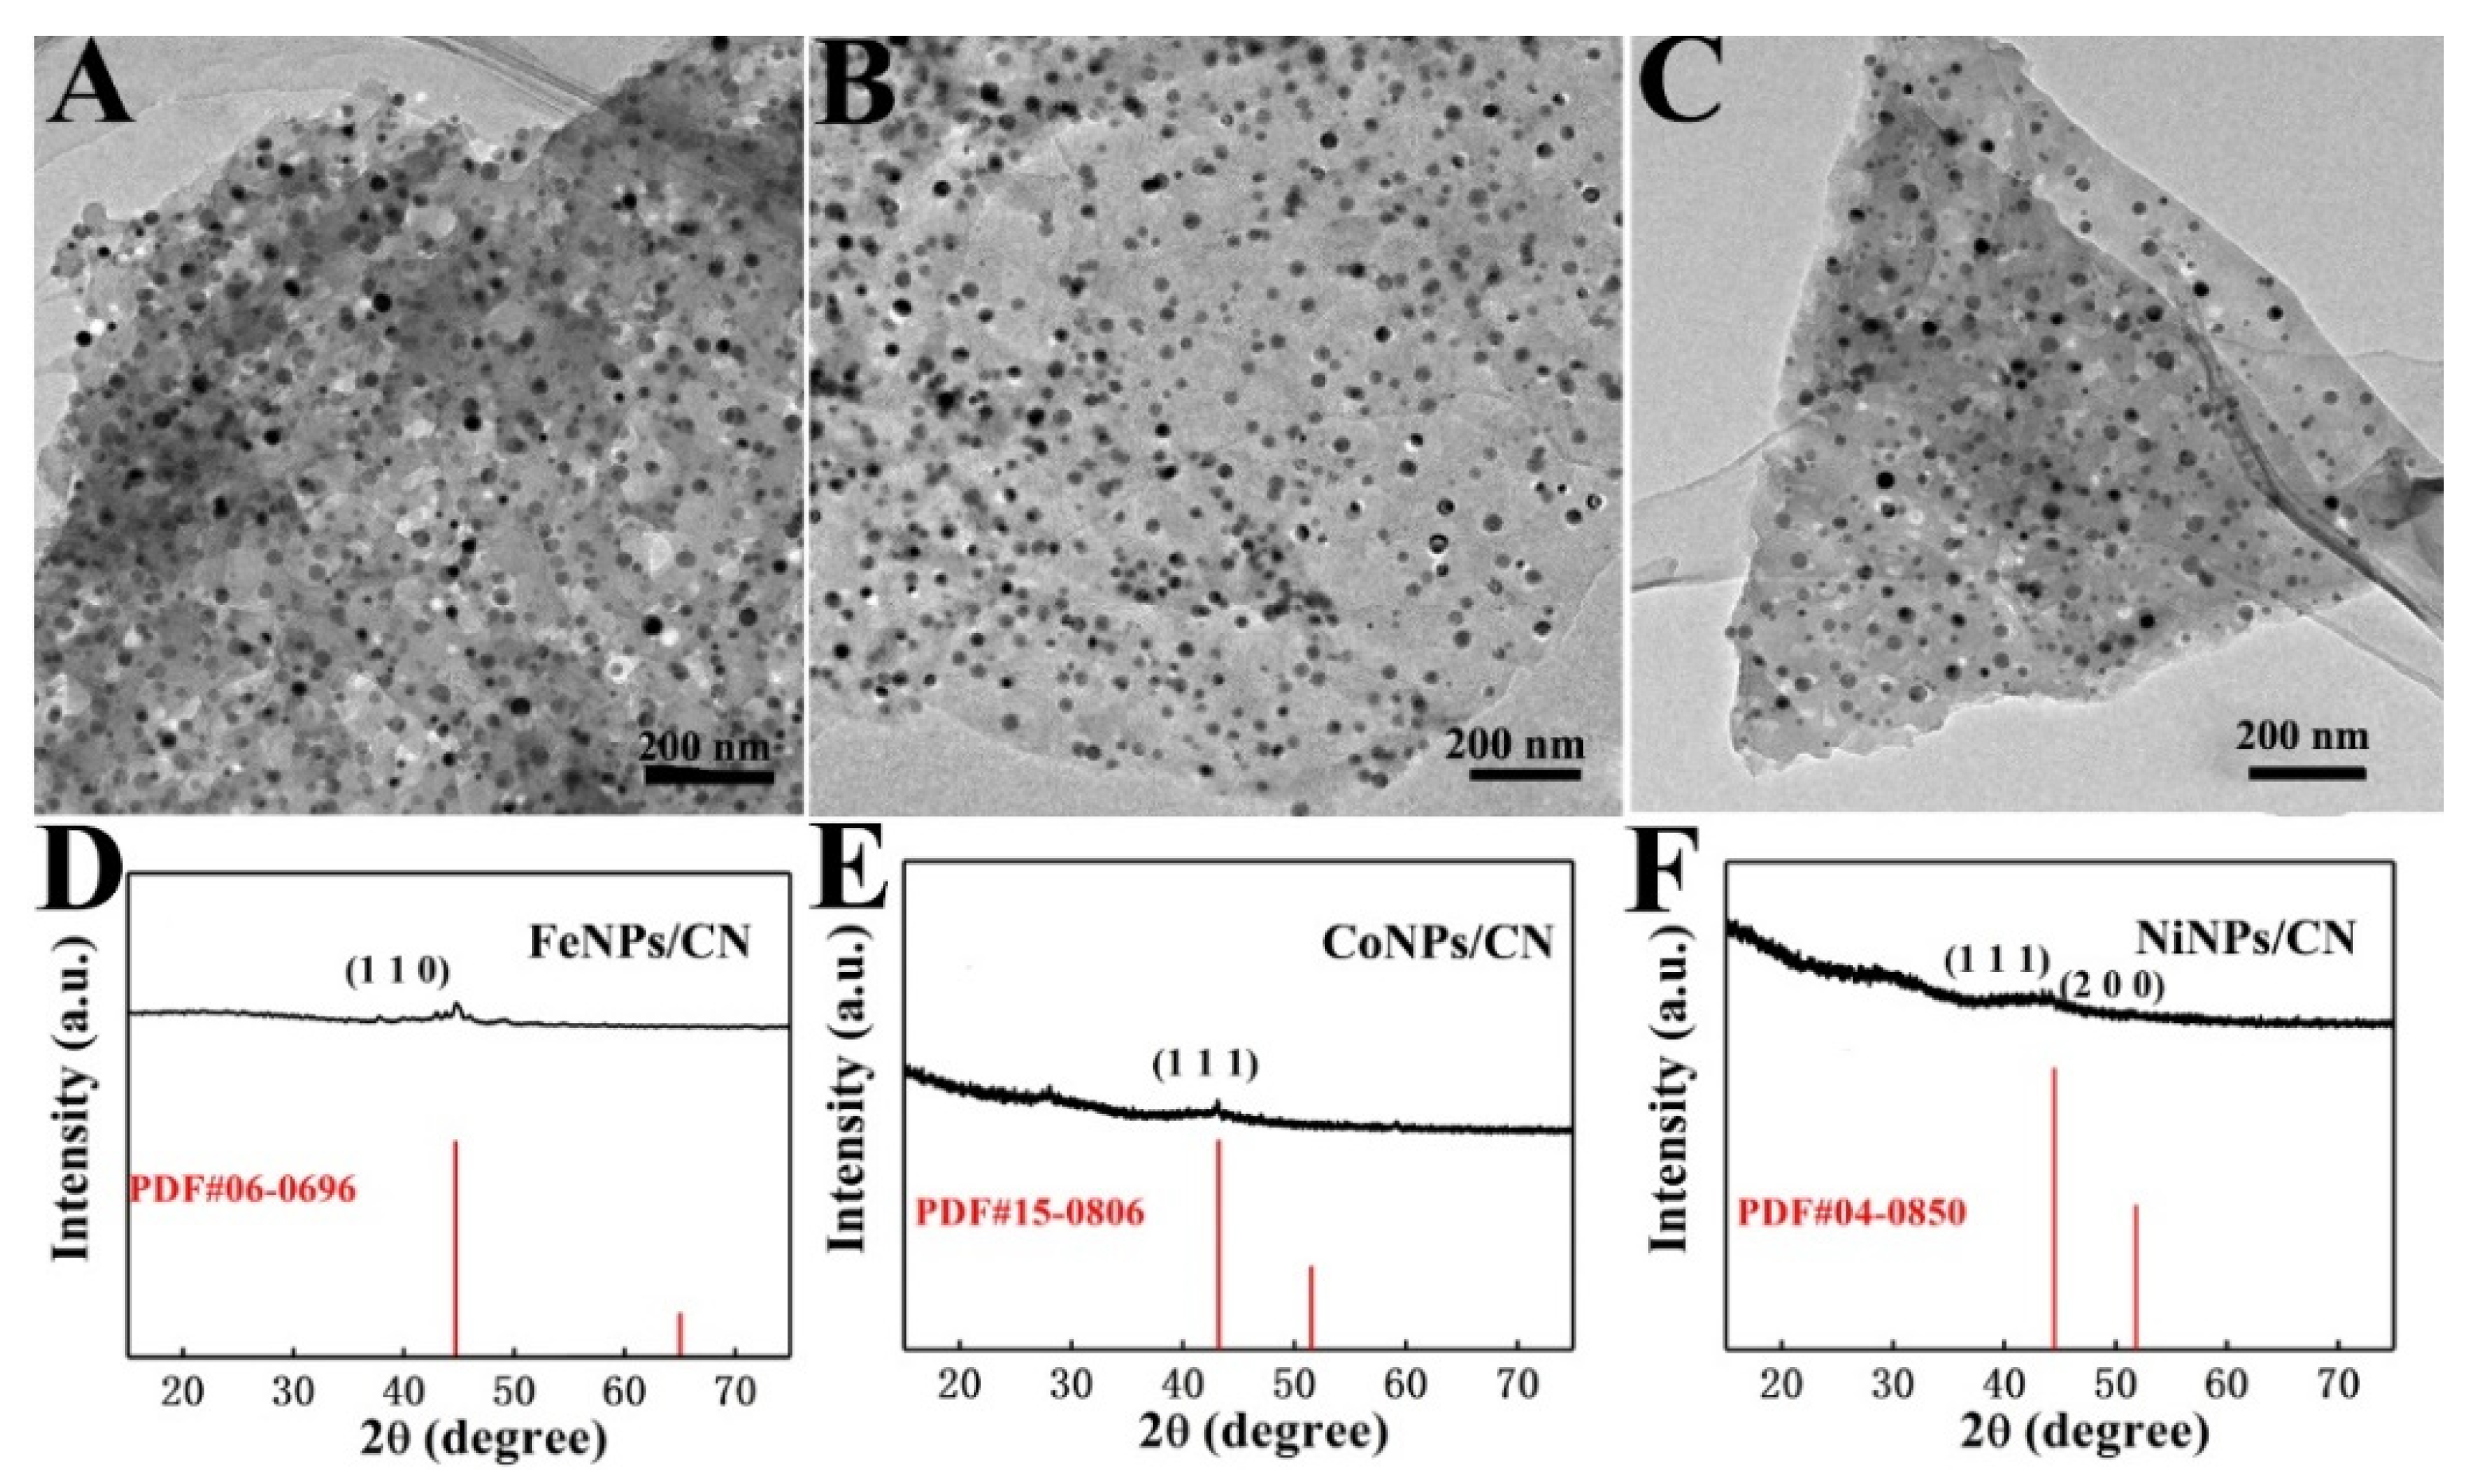
3.3. Characterization of FeNPs/CN, CoNPs/CN and NiNPs/CN

TEM images of FeNPs/CN (Figure 3A), CoNPs/CN (Figure 3B) and NiNPs/CN (Figure 3C) showed MNPs could be uniformly dispersed and loaded on the CN. This proved that COFTD had a good chelation and fixing effect for a series of metal ions, which could prevent the aggregation of MNPs effectively. XRD pattern of FeNPs/CN showed a peak at 44.7°, which corresponded to the (110) crystal plane of FeNPs (PDF#06-0696), demonstrating the successful synthesis of FeNPs on CN (Figure 3D) [52]. XRD pattern of CoNPs/CN showed a peak at 43.2°, which corresponded to the (111) crystal plane of CoNPs (PDF#15-0806), confirming the successful synthesis of CoNPs on CN (Figure 3E) [53]. XRD pattern of NiNPs/CN showed two peaks at 44.5° and 51.8°, which corresponded to the (111) and (200) crystal planes of NiNPs (PDF#04-0850) respectively, indicating the successful synthesis of NiNPs on CN(Figure 3F).

3.4. Electrochemical Detection of DA and UA by Using MNPs/CN Nanozymes

CVs were measured in 0.1 M KCl solution with 5 mM [Fe(CN)6]3−/4− at 50 mV s−1 (Figure 4A). Compared with other materials, the peak current of [Fe(CN)6]3−/4− on CuNPs/CN/ GCE was significantly increased, which showed that the electrochemical performance was significantly improved after carbonization because of the synergistic effect of CN and CuNPs. EIS of CuNPs/CN/GCE, CN/GCE, GCE and COFTD/GCE clearly showed that CuNPs/CN/GCE owned the lowest resistance (Figure 4B). The fast electron transfer manifested that CuNPs/CN/GCE could be used for further electrochemical sensors, such as the electrochemical detection of DA and UA. The DPV curves of CuNPs/CN/GCE, CN/GCE, GCE and COFTD/GCE toward 10 μM DA and 50 μM UA in N2-saturated PBS showed that CuNPs/CN/GCE obtained the largest response current toward DA and UA (Figure 4C), which proved that the CuNPs/CN had the best detection performance. The good performance could be ascribed to the synergistic effect of CuNPs and CN. COFTD as a precursor had a strong chelating effect on Cu2+, and a large amount of Cu2+ are evenly dispersed in the pores of COFTD. After carbonization, the CN was formed, and CuNPs with a diameter of 8 nm were obtained, so that more active sites were exposed and the catalytic effect on DA and UA was improved. In order to study the kinetics of CuNPs/CN/GCE toward DA and UA, the electrochemical behavior of CuNPs/CN/GCE toward DA and UA in N2-saturated PBS with different pH (6.0–8.0) were investigated (Figure 4D). The oxidation peak potential of DA and UA gradually shifted negatively with the increase of pH, and the oxidation peak current was the largest when the pH was 7.0. The inset showed a linear fitting curve of pH and Epa, the slopes of the fitted curves were −57.5 mV pH−1 and −61.4 mV pH−1, approaching to −59 mV pH−1 of the isoelectronic and proton process. It clearly showed that oxidation of DA and UA catalyzed CuNPs/CN was an isoelectronic and proton process.
Then, under the condition of 0.2 M N2-saturated PBS (pH = 7.0) with DA and UA, the CVs at different scan rates were explored. As shown in Figure S2A,B, the redox process of DA occurred at about 0.15 V, and the effect of scan rates on peak position was not obvious, which demonstrated that the reversibility was good. Through the fitting graph, it could be found that the peak current density was directly proportional to the scan rate, which proved that what was happening on the electrode surface was a classic surface control process. The peak current density of UA was proportional to the scan rate, so it was also the dominant electron transfer process controlled by the surface (Figure S2C,D).
Thanks to the good electrical conductivity and excellent catalytic properties, the electrochemical biosensor based on CuNPs/CN/GCE was used to detect DA and UA. To ensure the performance of the biosensor, optimization of testing conditions was carried out. Under the condition that the mass of COFTD was 40 mg to coordinate with 0.1 mmol Cu2+, the resulted sensor achieved the best catalytic effect (Figure S3A). The calcination temperature of Cu2+/COFTD was optimized from 500 °C to 800 °C (Figure S3B), and the results revealed that 700 °C was the best temperature for obtaining the highest activity of CuNPs/CN. When the pH was 7.0, the peak current density of DA and UA detection reached the maximum (Figure S3C). Finally, the concentration of CuNPs/CN was optimized. 2 mg mL−1 CuNPs/CN was optimal and used to construct electrochemical CuNPs/CN biosensor (Figure S3D).
Next, CuNPs/CN/GCE was used to separately measure DA and UA. Figure 5A,B showed the DPV diagrams of DA and UA, respectively. Insets were the corresponding linear fitting diagram. With the gradual increase of DA and UA concentrations, the corresponding oxidation peak current density also gradually increased. The sensitivity of DA detection was 0.805 μA μM−1 cm−2, and the linear range was 55 nM–250 μM. The sensitivity of UA detection was 0.73 μA μM−1 cm−2, and the linear range was 62 nM–800 μM. This result indicated that CuNPs/CN could be used as a good catalytic material to construct electrochemical enzyme-free DA and AA sensors with good performances.
As we all know, the oxidation peaks of DA and UA are very close or even overlap, and they usually interfere with each other when using ordinary electrodes for detection. In order to prove the excellent catalytic effect of CuNPs/CN/GCE, DA and UA were measured simultaneously by DPV. In 0.2 M N2-saturated PBS (pH = 7.0), the DA was detected after adding quantitative 200 μM UA (Figure 5C), the UA was detected after adding quantitative 50 μM DA (Figure 5D) and the insets were corresponding curves of the peak current density versus concentration. Under the condition that the peak current of UA was basically constant, with the increase of DA concentration, the peak current linearly increased in the range of 0.042 μM–200 μM, and the sensitivity was 1.050 μA μM−1 cm−2. In the presence of DA, as the concentration of UA increased, the increase of DA was within the allowable range of error. The anode peak current of UA was proportional to the concentration from 0.12 μM to 1100 μM, and the sensitivity was 0.38 μA μM−1 cm−2. In summary, the oxidation of DA and UA on the CuNPs/CN/GCE occurred independently, with different oxidation peak positions, and without any mutual interference. In the mixed solution, the concentrations of DA and UA were changed at the same time. As shown in Figure 5E, the oxidation peak of DA was at 0.12 V, the oxidation peak of UA at 0.25 V, and the peak current densities of DA and UA all were directly proportional to the concentration. The linear range of DA detection was 0.015 μM–140 μM, the linear range of UA detection was 0.03 μM–175 μM, and the sensitivity of DA and UA were 1.03 μA μM−1 cm−2 and 0.52 μA μM−1 cm−2 (Figure 5F). As shown in Table S1 [54,55,56,57,58,59,60], the sensor exhibited a wider linear range and better sensitivity than other works, which proved the advantages of CuNPs/CN materials in the construction of sensors.
Subsequently, the repeatability, reproducibility and stability of sensors based on CuNPs/CN/GCE were explored. The CuNPs/CN/GCE was placed for 30 days, and DA and UA were continuously detected. As shown in Figure S4A, the detection peak current densities of the two substances don’t change much within one month, the relative standard deviation (RSD) of DA is only 10.1%, and the RSD of UA is 11.41%, indicating that the sensor has good repeatability for DA and UA detection. Six CuNPs/CN/GCE were prepared to detect DA and UA at the same time, and the peak current densities were basically unchanged, indicating that the CuNPs/CN/GCE also has good repeatability (Figure S4B). In the presence of DA and UA, the addition of interfering substances caused the changes in the oxidation peaks of DA and UA to be less than 10% of their original current density, which was sufficient to prove that the sensor had good selectivity (Figure S4C,D). In conclusion, the CuNPs/CN/GCE biosensor has good stability, repeatability and selectivity for DA and UA detection. Next, different concentrations of DA and UA were added to the blood serum, and the DA and UA in the actual samples were determined by CuNPs/CN/GCE sensor and HPLC. The DA and UA content in the actual samples obtained by CuNPs/CN/GCE sensor was close to the results of the HPLC test.
In view of the excellent performance of electrochemical sensors based on CuNPs/ CN/GCE, the MNPs/CN nanozymes synthesized above were also used to construct electrochemical sensors, and the catalytic effects of the nanozymes were verified by detecting DA and UA. In 0.2 M N2-satruated PBS in the presence of UA, FeNPs/CN/GCE (Figure 6A), CoNPs/CN/GCE (Figure 6C) and NiNPs/CN/GCE (Figure 6E) were used to detect DA. In 0.2 M N2-satruated PBS in the presence of DA, FeNPs/CN/GCE (Figure 6B), CoNPs/CN/GCE (Figure 6D) and NiNPs/CN/GCE (Figure 6F) were used to detect UA. The insets are plots of peak current density versus concentration. It can be observed that three nanozymes could clearly distinguish the oxidation peaks of DA and UA, and the oxidation process of DA and UA could occur independently and did not affect each other when DA and UA existed at the same time. The sensitivity of FeNPs/CN/GCE, CoNPs/CN/GCE and NiNPs/CN/GCE to detect DA were 1.30 μA cm−2 μM−1, 1.07 μA cm−2 μM−1 and 0.88 μA cm−2 μM−1, the linear ranges were 35 nM–200 μM, 42 nM–250 μM and 52 nM–250 μM. The sensitivity of FeNPs/CN/GCE, CoNPs/CN/GCE and NiNPs/CN/GCE for detecting UA were 0.310 μA cm−2 μM−1, 0.587 μA cm−2 μM−1 and 0.360 μA cm−2 μM−1, the linear ranges were 145 nM–900 μM, 77 nM–700 μM and 125 nM–800 μM. The performance of electrochemical sensors were compared with the related sensors in Table S1, and they all showed excellent performance.

3.5. Electrochemical Detection of FZ Based on CuNPs/CN/GCE

In view of high catalytic performance, an electrochemical sensor for FZ detection based on CuNPs/CN/GCE was constructed. Figure S5 compared DPV curves of different materials in 0.2 M PBS containing FZ. These materials showed a reduction peak of FZ around −0.4 V. For the same concentration of FZ detection, the sensor based on CuNPs/CN/GCE not only had a higher current density, but also the reduction peak of FZ was positively shifted. This indicated the sensitivity of FZ on CuNPs/CN/GCE was higher and the reduction process was easier. The CVs at different scanning speeds in 0.2 M PBS containing 20 μM FZ were investigated (Figure S6). With the increase of the scan rate, the reduction peak current also gradually increased. The FZ reduction peak current had a linear proportional relationship with different scan rates. This result confirmed that for CuNPs/CN/GCE, the electrochemical reduction of FZ also was a surface-controlled electron transfer process.
Subsequently, the FZ was measured by DPV technique using CuNPs/CN/GCE, and the results were shown in Figure 7A,B. With the gradual increase of FZ, the concentration and reduction peak current showed a good linear relationship. The sensitivity of CuNPs/CN/GCE sensor to detect FZ was 0.732 μA μM−1 cm−2, and the detection limit was calculated by (LOD) = 3SD/SCP, where “SCP” is the slope of the calibration and the standard of “SD” regression difference. The LOD was calculated to be 20.5 nM, and the linear range was 61.5 nM–200 μM, which exceeded the previously reported FZ sensors (Table S2) [61,62,63,64,65,66]. This result once again proved the potential of CuNPs/CN/GCE to construct electrochemical enzyme-free biosensors.
By adding different bioactive molecules and nitrogen-containing organic compounds, the anti-interference of CuNPs/CN/GCE was studied. Figure S7 showed that CuNPs/CN/GCE had good selectivity for FZ detection. Next, the repeatability and stability of the FZ electrochemical sensor were studied. For 30 consecutive days, the same CuNPs/CN/GCE was used to measure the current response of a PBS containing 50 μM FZ, and its RSD was 7.58%, so the sensor had good stability (Figure S8A). Under the same conditions, five CuNPs/CN/GCE modified electrodes were used to detect 50 μM FZ, and the RSD was only 8.62%, so the CuNPs/CN/GCE sensor had good repeatability (Figure S8B). Consequently, the FZ electrochemical biosensor constructed with CuNPs/CN/GCE had an excellent performance.

4. Conclusions

In summary, a two-dimensional COFTD with double chelating sites are used to coordinate a series of metals ions, and then calcined to obtain a series of MNPs/CN nanozymes, and finally applied to electrochemical DA, UA and FZ sensors. First, to simultaneously detect DA and UA, the two active substances independently underwent redox processes on the surface of the MNPs/CN/GCE, and the related sensors had good sensitivity. The first reason was that the layered crystalline COFTD provided a larger specific surface area for the loading of metal ions, and the second was that the size of the nanoparticles on the CN after calcination was generally below 10 nm, showing strong catalytic activity. Secondly, CuNPs/CN/GCE was also used in the construction of FZ sensors, with a wide linear range from 61.5 nM–200 μM, good reproducibility and repeatability. Finally, this work provides a feasible way for the application of COF in electrochemistry and the synthesis of small-sized nanoparticles.

Supplementary Materials

The following supporting information can be downloaded at: https://www.mdpi.com/article/10.3390/chemosensors10110458/s1, Figure S1: TEM image of CN; Figure S2: CVs of CuNPs/CN/GCE at different scan rates from 100 mV s−1 to 500 mV s−1 in 0.2 M N2-statured PBS (pH = 7.0) to the detection of DA (A) and UA (C). Fitting curve between current density and the concentration of DA (B), UA (D); Figure S3. (A) The plot of peak current density versus Cu2+ concentrations. (B) The plot of peak current density versus different temperatures of carbonization. (C) The plot of peak current density versus different pH. (D) The plot of peak current density versus different concentrations of CuNPs/CN; Figure S4: (A) Stability of the CuNPs/CN/GCE for DA and UA detection. (B) Reproducibility of the CuNPs/CN/GCE for DA and UA detection. (C), (D) Selectivity of the CuNPs/CN/GCE for DA and UA detection; Figure S5: DPV of CuNPs/CN/GCE, CN/GCE, GCE, COFTD/GCE in 0.2 M PBS solution (pH = 7) containing FZ; Figure S6: (A) CVs of CuNPs/CN/GCE at different scan rates from 50 mV s−1 to 500 mV s−1 in 0.2 M N2-statured PBS (pH = 7.0) to the detection of FZ. (B) Fitting curve between current density and different scan rates; Figure S7. (A) Selectivity of the CuNPs/CN/GCE for FZ detection; Figure S8. (A) Stability of the CuNPs/CN/GCE for FZ detection. (B) Reproducibility of the CuNPs/CN/GCE for FZ detection; Table S1: Comparison of the sensor based on based on MNPs/CN nanozymes to other DA and UA sensors; Table S2: Comparison of the sensor based on based on MNPs/CN nanozymes to other FZ sensors.

Author Contributions

Conceptualization, Y.S. and Y.D.; methodology, J.X. and Y.Y.; validation, J.X. and L.W.; formal analysis, L.W. and Y.Y.; investigation, J.X. and Y.Y.; resources, S.C.; writing—original draft preparation, J.X. and Y.Y.; writing—review and editing, Y.S. and Y.D.; supervision, Y.S. and Y.D.; project administration, S.C.; funding acquisition, Y.S. All authors have read and agreed to the published version of the manuscript.

Funding

This work was financially supported by National Natural Science Foundation of China (21964010).

Institutional Review Board Statement

Not applicable.

Informed Consent Statement

Not applicable.

Data Availability Statement

The data is available under the request to the correspondence.

Conflicts of Interest

The authors declare no competing financial interest.

References

  1. He, C.; Asif, M.; Liu, Q.; Xiao, F.; Liu, H.; Xia, B.Y. Noble metal construction for electrochemical nonenzymatic glucose detection. Adv. Mater. Technol. 2022, 30, 2200272. [Google Scholar] [CrossRef]
  2. Kurtoğlu, S.F.; Hoffman, A.S.; Akgül, D.; Babucci, M.; Aviyente, V.; Gates, B.C.; Bare, S.R.; Uzun, A. Electronic structure of atomically dispersed supported iridium catalyst controls iridium aggregation. ACS Catal. 2020, 10, 12354–12358. [Google Scholar] [CrossRef]
  3. Ahangaran, F.; Navarchian, A.H. Recent advances in chemical surface modification of metal oxide nanoparticles with silane coupling agents: A review. Adv. Colloid Interface Sci. 2020, 286, 102298. [Google Scholar] [CrossRef] [PubMed]
  4. Chen, Q.; Nie, Y.; Ming, M.; Fan, G.; Zhang, Y.; Hu, J.S. Sustainable synthesis of supported metal nanocatalysts for electrochemical hydrogen evolution. Chin. J. Catal. 2020, 4, 1791–1811. [Google Scholar] [CrossRef]
  5. Han, Q.F.; Pang, J.B.; Li, Y.F.; Sun, B.J.; Ibarlucea, B.Y.; Liu, X.Y.; Gemming, T.; Cheng, Q.L.; Zhang, S.; Liu, H.; et al. Graphene biodevices for early disease diagnosis based on biomarker detection. ACS Sens. 2021, 6, 3841–3881. [Google Scholar] [CrossRef]
  6. Chen, X.; Jiang, X.; Yang, N. Graphdiyne Electrochemistry: Progress and Perspectives. Small 2022, 18, 2201135. [Google Scholar] [CrossRef]
  7. Zhou, W.X.; Shen, H.; Zeng, Y.; Yi, Y.P.; Zuo, Z.C.; Li, Y.J.; Li, Y.L. Controllable synthesis of graphdiyne nanoribbons. Angew. Chem., Int. Ed. 2020, 59, 4908–4913. [Google Scholar] [CrossRef]
  8. Han, X.; Cao, K.; Yao, Y.; Zhao, J.; Chai, C.; Dai, P. A novel electrochemical sensor for glucose detection based on a Ti3C2TX/ZIF-67 nanocomposite. RSC Adv. 2022, 12, 20138–20146. [Google Scholar] [CrossRef]
  9. Yadav, P.; Cao, Z.; Barati Farimani, A. DNA Detection with Single-Layer Ti3C2 MXene Nanopore. ACS Nano 2021, 15, 4861–4869. [Google Scholar] [CrossRef]
  10. Qiu, Q.M.; Chen, H.Y.; You, Z.H.; Feng, Y.Y.; Wang, X.; Wang, Y.X.; Ying, Y.B. Shear Exfoliated Metal-Organic Framework nanosheet-enabled flexible sensor for real-time monitoring of superoxide anion. ACS Appl. Mater. Interfaces 2020, 12, 5429–5436. [Google Scholar] [CrossRef]
  11. Li, X.; Zhao, X.; Chu, D.; Zhu, X.; Xue, B.; Chen, H.; Zhou, Z.; Li, J. Silver nanoparticle-decorated 2D Co-TCPP MOF nanosheets for synergistic photodynamic and silver ion antibacterial. Surf. Interfaces 2022, 33, 102247. [Google Scholar] [CrossRef]
  12. Liu, H.; Gao, J.; Duan, C.; Wu, K.; Guo, K. A novel mediator-free biosensor based on hemoglobin immobilized in the Au nanoparticals and TiO2 nanosheets co-modified graphene nanocomposite. Mater. Lett. 2020, 275, 128142. [Google Scholar] [CrossRef]
  13. Gao, J.; Liu, H.; Wu, K.; Yan, J.; Tong, C. A novel nonenzymatic ascorbic acid electrochemical sensor based on gold nanoparticals-chicken egg white-copper phosphate-graphene oxide hybrid nanoflowers. Nanotechnology 2021, 32, 325504. [Google Scholar] [CrossRef] [PubMed]
  14. Chakraborty, B.; Roychaudhuri, C. Metal/Metal oxide modified graphene nanostructures for electrical biosensing applications: A Review. IEEE Sens. J. 2021, 21, 17629–17642. [Google Scholar] [CrossRef]
  15. Mohammed, H.Y.; Farea, M.A.; Ingle, N.N.; Sayyad, P.W.; Al-Gahouari, T.; Mahadik, M.M.; Bodkhe, G.A.; Shirsat, S.M.; Shirsat, M.D. Review—Electrochemical hydrazine sensors based on graphene supported Metal/Metal oxide nanomaterials. J. Electrochem. Soc. 2021, 168, 106509. [Google Scholar] [CrossRef]
  16. Devasenathipathy, R.; Tsai, S.H.; Chen, S.M.; Karuppiah, C.; Karthik, R.; Wang, S.F. Electrochemical synthesis of β-cyclodextrin functionalized silver nanoparticles and reduced graphene oxide composite for the determination of hydrazine. Electroanalysis 2016, 28, 1970–1976. [Google Scholar] [CrossRef]
  17. Ji, K.; Zhang, X.; Che, Q.; Yue, Y.; Yang, P.; Jiang, S.P. Composite nanoarchitectonics of ZIF-67 derived CoSe2/rGO with superior charge transfer for oxygen evolution reaction. Electrochim. Acta 2022, 426, 140785. [Google Scholar] [CrossRef]
  18. Chu, Q.; Lin, H.; Ma, M.; Chen, S.; Shi, Y.; He, H.; Wang, X. Cellulose nanofiber/graphene Nanoplatelet/Mxene nanocomposites for enhanced electromagnetic shielding and high in-plane thermal conductivity. ACS Appl. Nano Mater. 2022, 5, 7217–7227. [Google Scholar] [CrossRef]
  19. Yang, L.; Li, M.; Kuang, L.J.; Li, Y.; Chen, L.L.; Lin, C.H.; Wang, L.; Song, Y.H. Benzotrithiophene-based covalent organic frameworks for real-time visual onsite assays of enrofloxacin. Biosens. Bioelectron. 2022, 214, 114527. [Google Scholar] [CrossRef]
  20. Liang, H.H.; Luo, Y.; Li, Y.; Song, Y.H.; Wang, L. An immunosensor using electroactive COF as signal probe for electrochemical detection of carcinoembryonic antigen. Anal. Chem. 2022, 94, 5352–5358. [Google Scholar] [CrossRef]
  21. Liang, H.H.; Wang, L.Y.; Yang, Y.X.; Song, Y.H.; Wang, L. A novel biosensor based on multienzyme microcapsules constructed from covalent-organic framework. Biosen. Bioelectron. 2021, 193, 113553. [Google Scholar] [CrossRef] [PubMed]
  22. Wang, L.Y.; Yang, Y.X.; Liang, H.H.; Wu, N.; Peng, X.; Wang, L.; Song, Y.H. A novel N,S-rich COF and its derived hollow N,S-doped carbon@Pd nanorods for electrochemical detection of Hg2+ and paracetamol. J. Hazard Mater. 2021, 409, 124528. [Google Scholar] [CrossRef] [PubMed]
  23. Guo, L.L.; Yang, L.; Li, M.Y.; Kuang, L.J.; Song, Y.H.; Wang, L. Covalent organic frameworks for fluorescent sensing: Recent developments and future challenges. Coord. Chem. Rev. 2021, 440, 213957. [Google Scholar] [CrossRef]
  24. Yang, Y.X.; Shen, Y.; Wang, L.Y.; Song, Y.H.; Wang, L. Three-dimensional porous carbon/covalent-organic framework films integrated electrode for electrochemical sensors. J. Electroanal. Chem. 2019, 855, 113590. [Google Scholar] [CrossRef]
  25. Gu, F.L.; Chen, K.X.; Du, Y.; Song, Y.H.; Wang, L. CeO2-NiO/N,O-rich porous carbon derived from covalent-organic framework for enhanced Li-storage. Chem. Eng. J. 2022, 442, 136298. [Google Scholar] [CrossRef]
  26. Chen, K.X.; Huang, R.; Gu, F.L.; Du, Y.; Song, Y. A novel hollow Co3O4@N-doped carbon nanobubble film composite for high-performance anode of lithium-ion batteries. Compos. Part B-Eng. 2021, 224, 109247. [Google Scholar] [CrossRef]
  27. Gu, F.L.; Liu, W.; Huang, R.; Song, Y.H.; Jia, J.; Wang, L. A g-C3N4 self-templated preparation of N-doped carbon nanosheets@Co-Co3O4/carbon nanotubes as high-rate lithium-ion batteries’ anode materials. J. Colloid Interf. Sci. 2021, 597, 1–8. [Google Scholar] [CrossRef]
  28. Kumar, M.; Wang, M.; Swamy, B.E.K.; Praveen, M.; Zhao, W. Poly (alanine)/NaOH/MoS2/MWCNTs modified carbon paste electrode for simultaneous detection of dopamine, ascorbic acid, serotonin and guanine. Colloid. Surface B 2020, 196, 111299. [Google Scholar] [CrossRef]
  29. Arif, N.; Gul, S.; Sohail, M.; Rizwan, S.; Iqbal, M. Synthesis and characterization of layered Nb2C MXene/ZnS nanocomposites for highly selective electrochemical sensing of dopamine. Ceram. Int. 2021, 47, 2388–2396. [Google Scholar] [CrossRef]
  30. Song, Y.H.; Han, J.J.; Xu, L.; Miao, L.F.; Peng, C.W.; Wang, L. A dopamine-imprinted chitosan film/porous ZnO NPs@carbon nanospheres/macroporous carbon for electrochemical sensing dopamine. Sens. Actuators B 2019, 298, 126949. [Google Scholar] [CrossRef]
  31. Shekh, M.I.; Amirian, J.; Du, B.; Kumar, A.; Sharma, G.; Stadler, F.J.; Song, J. Electrospun ferric ceria nanofibers blended with MWCNTs for high-performance electrochemical detection of uric acid. Ceram. Int. 2020, 46, 9050–9064. [Google Scholar] [CrossRef]
  32. Fan, K.; Zeng, J.; Yang, C.; Wang, G.; Lian, K.; Zhou, X.; Deng, Y.; Liu, G. Digital quantification method for sensitive point-of-care detection of salivary uric acid using smartphone-assisted μPADs. ACS Sens. 2022, 7, 2049–2057. [Google Scholar] [CrossRef] [PubMed]
  33. Tang, T.F.; Zhou, M.L.; Lv, J.P.; Cheng, H.; Wang, H.S.; Qin, D.F.; Hu, G.Z.; Liu, X.Y. Sensitive and selective electrochemical determination of uric acid in urine based on ultrasmall iron oxide nanoparticles decorated urchin-like nitrogen-doped carbon. Colloid. Surface B 2022, 216, 112538. [Google Scholar] [CrossRef] [PubMed]
  34. Yang, W.; Fei, J.W.; Xu, W.; Jiang, H.Y.; Sakran, M.; Hong, J.L.; Zhu, W.Y.; Zhou, X.M. A biosensor based on the biomimetic oxidase Fe3O4@MnO2 for colorimetric determination of uric acid. Colloid. Surface B 2022, 212, 112347. [Google Scholar] [CrossRef]
  35. Wang, H.; Xie, A.; Li, S.; Wang, J.; Chen, K.; Su, Z.; Song, N.; Luo, S. Three-dimensional g-C3N4/MWNTs/GO hybrid electrode as electrochemical sensor for simultaneous determination of ascorbic acid, dopamine and uric acid. Anal. Chim. Acta 2022, 252, 339907. [Google Scholar] [CrossRef] [PubMed]
  36. Jesu Amalraj, A.J.; Wang, S.-F. Synthesis of transition metal titanium oxide (MTiOx, M = Mn, Fe, Cu) and its application in furazolidone electrochemical sensor. J. Ind. Eng. Chem. 2022, 111, 356–368. [Google Scholar] [CrossRef]
  37. Koventhan, C.; Pandiyarajan, S.; Chen, S.M. Simple sonochemical synthesis of flake-ball shaped bismuth vanadate for voltammetric detection of furazolidone. J. Alloys Compd. 2022, 895, 162315. [Google Scholar] [CrossRef]
  38. Liu, S.J.; Dou, L.N.; Yao, X.L.; Zhang, W.T.; Zhao, B.X.; Wang, Z.H.; Ji, Y.W.; Sun, J.; Xu, B.C.; Zhang, D.; et al. Polydopamine nanospheres as high-affinity signal tag towards lateral flow immunoassay for sensitive furazolidone detection. Food Chem. 2020, 315, 126310. [Google Scholar] [CrossRef]
  39. Su, L.H.; Chen, Y.Q.; Wang, L.L.; Zhang, H.; Sun, J.; Wang, J.L.; Zhang, D.H. Dual-signal based immunoassay for colorimetric and photothermal detection of furazolidone. Sens. Actuators B 2021, 331, 129431. [Google Scholar] [CrossRef]
  40. Baranwal, J.; Barse, B.; Gatto, G.; Broncova, G.; Kumar, A. Electrochemical Sensors and Their Applications: A Review. Chemosensors 2022, 10, 363. [Google Scholar] [CrossRef]
  41. Liu, X.; Hu, M.; Wang, M.; Song, Y.; Zhou, N.; He, L.; Zhang, Z. Novel nanoarchitecture of Co-MOF-on-TPN-COF hybrid: Ultralowly sensitive bioplatform of electrochemical aptasensor toward ampicillin. Biosens. Bioelectron. 2019, 123, 59–68. [Google Scholar] [CrossRef] [PubMed]
  42. Zhao, C.; Hao, L.; Ji, Z.; Zhu, C.; Yaghi, Y.O.M. Ester-linked crystalline covalent organic frameworks. J. Am. Chem. Soc. 2020, 142, 14450–14454. [Google Scholar] [CrossRef] [PubMed]
  43. Zhao, Y.; Dai, W.; Peng, Y.; Niu, Z.; Sun, Q.; Shan, C.; Yang, H.; Verma, G.; Wojtas, L.; Yuan, D.; et al. A corrole-based covalent organic framework featuring desymmetrized topology. Angew. Chem. Int. Ed. 2020, 59, 4354–4359. [Google Scholar] [CrossRef] [PubMed]
  44. Acharjya, A.; Pachfule, P.; Roeser, J.; Schmitt, F.-J.; Thomas, A. Vinylene-linked covalent organic frameworks by base-catalyzed aldol condensation. Angew. Chem. Int. Ed. 2019, 58, 14865–14870. [Google Scholar] [CrossRef] [Green Version]
  45. Chen, N.; Wang, Y.; Liu, T.; Xia, Y. Fourier transform infrared nano-spectroscopy: Mechanism and applications. Appl. Spectrosc. Rev. 2021, 56, 531–552. [Google Scholar]
  46. Nigam, V.; Setua, D.K.; Mathur, G.N. Wide-angle X-ray scattering, Fourier transform infrared spectroscopy, and scanning electron microscopy studies on the influence of the addition of liquid functional rubber into epoxy thermoset. J. Appl. Polym. Sci. 2015, 70, 537–543. [Google Scholar] [CrossRef]
  47. Adiani, V.; Gupta, S.; Ambolikar, R.; Variyar, P.S. Development of rapid method to assess microbial quality of minimally processed pomegranate arils using FTIR. Sens. Actuators B 2018, 260, 800–807. [Google Scholar] [CrossRef]
  48. Erdogan, B.; Arbag, H.; Yasyerli, N. SBA-15 supported mesoporous Ni and Co catalysts with high coke resistance for dry reforming of methane. Int. J. Hydrogen Energy 2018, 43, 1396–1405. [Google Scholar] [CrossRef]
  49. Bakhshi, O.; Bagherzade, G.; Ghamari Kargar, P. Biosynthesis of organic nanocomposite using pistacia vera L. hull: An efficient antimicrobial agent. Bioinorg. Chem. Appl. 2021, 54, 1–18. [Google Scholar] [CrossRef]
  50. Devasenathipathy, R.; Liu, Y.-X.; Yang, C.; Kohila Rani, K.; Wang, S.-F. Simple electrochemical growth of copper nanoparticles decorated silver nanoleaves for the sensitive determination of hydrogen peroxide in clinical lens cleaning solutions. Sens. Actuators B 2017, 252, 862–869. [Google Scholar] [CrossRef]
  51. Zhao, J.; Dong, W.; Zhang, X.; Chai, H.; Huang, Y. FeNPs@Co3O4 hollow nanocages hybrids as effective peroxidase mimics for glucose biosensing. Sens. Actuators B 2018, 263, 575–584. [Google Scholar] [CrossRef]
  52. Dong, W.; Zhuang, Y.; Li, S.; Zhang, X.; Chai, H.; Huang, Y. High peroxidase-like activity of metallic cobalt nanoparticles encapsulated in metal–organic frameworks derived carbon for biosensing. Sens. Actuators B 2018, 255, 2050–2057. [Google Scholar] [CrossRef]
  53. Egbosiuba, T.C.; Egwunyenga, M.C.; Tijani, J.O.; Mustapha, S.; Abdulkareem, A.S.; Kovo, A.S.; Krikstolaityte, V.; Veksha, A.; Wagner, M.; Lisak, G. Activated multi-walled carbon nanotubes decorated with zero valent nickel nanoparticles for arsenic, cadmium and lead adsorption from wastewater in a batch and continuous flow modes. J. Hazard. Mater. 2022, 423, 126993. [Google Scholar] [CrossRef]
  54. Zhao, D.; Yu, G.; Tian, K.; Xu, C. A highly sensitive and stable electrochemical sensor for simultaneous detection towards ascorbic acid, dopamine, and uric acid based on the hierarchical nanoporous PtTi alloy. Biosens. Bioelectron. 2016, 82, 119–126. [Google Scholar] [CrossRef] [PubMed]
  55. Aparna, T.K.; Sivasubramanian, R.; Dar, M.A. One-pot synthesis of Au-Cu2O/rGO nanocomposite based electrochemical sensor for selective and simultaneous detection of dopamine and uric acid. J. Alloys Compd. 2018, 741, 1130–1141. [Google Scholar] [CrossRef]
  56. Mei, L.; Feng, J.; Wu, L.; Chen, J.; Shen, L.; Xie, Y.; Wang, A. A glassy carbon electrode modified with porous Cu2O nanospheres on reduced graphene oxide support for simultaneous sensing of uric acid and dopamine with high selectivity over ascorbic acid. Microchim. Acta 2016, 183, 2039–2046. [Google Scholar] [CrossRef]
  57. Wang, M.; Zhang, M.; Zhu, J.; Wang, J.; Hu, L.; Sun, T.; Wang, M.; Tang, Y. G-C3N4/Co nanohybrids for ultra-sensitive simultaneous detection of uric acid and dopamine. ChemElectroChem 2020, 76, 1373–1377. [Google Scholar] [CrossRef]
  58. Bi, Y.; Liu, B.; Liu, X.; Qin, Y.; Zou, B. A h-BCN for electrochemical sensor of dopamine and uric acid. J. Nanomater. 2020, 2020, 4604820. [Google Scholar] [CrossRef] [Green Version]
  59. Wang, Z.; Yue, H.Y.; Huang, S.; Yu, Z.M.; Gao, X.; Chen, H.T.; Wang, W.Q.; Song, S.S.; Guan, E.H.; Zhang, H.J. Gold nanoparticles anchored onto three-dimensional graphene: Simultaneous voltammetric determination of dopamine and uric acid. Microchim. Acta 2019, 186, 573. [Google Scholar] [CrossRef]
  60. Guo, H.; Wang, M.; Zhao, L.; Youliwasi, N.; Liu, C. The effect of Co and N of porous carbon-based materials fabricated via sacrificial templates MOFs on improving DA and UA electrochemical detection. Microporous Mesoporous Mater 2018, 263, 21–27. [Google Scholar] [CrossRef]
  61. Sun, Y.; Waterhouse, G.I.N.; Xu, L.; Qiao, X.; Xu, Z. Three-dimensional electrochemical sensor with covalent organic framework decorated carbon nanotubes signal amplification for the detection of furazolidone. Sens. Actuators, B 2020, 321, 128501. [Google Scholar] [CrossRef]
  62. Jesu Amalraj, A.J.; Umesh, N.M.; Wang, S.-F. Synthesis of core-shell-like structure SnS2-SnO2 integrated with graphene nanosheets for the electrochemical detection of furazolidone drug in furoxone tablet. J. Mol. Liq. 2020, 313, 113554. [Google Scholar] [CrossRef]
  63. He, B.; Du, G. A simple and sensitive electrochemical detection of furazolidone based on an Au nanoparticle functionalized graphene modified electrode. Anal. Methods 2017, 9, 4341–4348. [Google Scholar] [CrossRef]
  64. Chen, C.X.; Chen, W.; Jiang, J.L.; Qian, L.; Zhang, X. Nitrofuran determination in aquaculture water by using poly-alizarin red-modified electrode. J. Electrochem. Soc. 2019, 166, H425–H432. [Google Scholar] [CrossRef]
  65. Ensafi, A.A.; Zandi-Atashbar, N.; Gorgabi-Khorzoughi, M.; Rezaei, B.J.I.S.J. Nickel-ferrite oxide decorated on reduced graphene oxide, an efficient and selective electrochemical sensor for detection of furazolidone. IEEE Sens. J. 2019, 19, 5396–5403. [Google Scholar] [CrossRef]
  66. Kokulnathan, T.; Wang, T.; Thangapandian, M.; Alaswad, S.O. Synthesis and characterization of hexagonal boron nitride/halloysite nanotubes nanocomposite for electrochemical detection of furazolidone. Appl. Clay Sci. 2020, 187, 105483. [Google Scholar] [CrossRef]
Scheme 1. Schematic preparation of COFTD and MNPs/CN: (A) the synthesis of COFTD and (B) the synthesis of MNPs/CN. (C) The catalysis of UA, DA and FZ by MNPs/CN nanozymes.
Chemosensors 10 00458 sch001
Figure 1. (A) The 3D structure of COFTD. (B) TEM image of COFTD. (C) XRD pattern of COFTD. (D) FTIR of COFTD, TAPB and DHNDA. (E) N2-adsorption/desorption isotherm of COFTD. (F) TGA curve of COFTD.
Chemosensors 10 00458 g001
Figure 2. (A) TEM image of CuNPs/CN. (B) HRTEM image of CuNPs/CN. (C) XRD pattern of CuNPs/CN, CN and COFTD. (D) N2-adsorption/desorption isotherm of CuNPs/CN, CN and COFTD. (E) XPS pattern of CuNPs/CN. (F) Fine XPS spectrum of Cu 2p. Inset in Figure 2A: Particle size distribution of CuNPs.
Chemosensors 10 00458 g002
Figure 3. (A) TEM image of FeNPs/CN. (B) TEM image of CoNPs/CN. (C) TEM image of NiNPs/CN. (D) XRD pattern of FeNPs/CN. (E) XRD pattern of CoNPs/CN. (F) XRD pattern of NiNPs/CN.
Chemosensors 10 00458 g003
Figure 4. (A) CVs and (B) EIS of CuNPs/CN/GCE, CN/GCE, GCE, COFTD/GCE in 0.1 M KCl solution containing 5 mM [Fe(CN)6]3−/4− (scanning rate of 50 mV s−1 for CVs). Inset in Figure 4B Randles circuit model. (C) DPV of CuNPs/CN/GCE, CN/GCE, GCE, COFTD/GCE in 0.2 M PBS (pH = 7) containing 10 μM DA and 50 μM UA. (D) DPV of CuNPs/CN/GCE in 0.2 M N2-satruated PBS with different pH from 6.0 to 8.0 containing DA and UA (Inset: fitting curve between Ep and pH).
Chemosensors 10 00458 g004
Figure 5. (A,B) DPV of CuNPs/CN/GCE in 0.2 M N2-statured PBS (pH = 7) with different DA (A) and UA (B). (C) DPV of CuNPs/CN/GCE in 0.2 M N2-statured PBS (pH = 7) containing 200 μM UA to detect DA. (D) DPV of CuNPs/CN/GCE in 0.2 M N2-statured PBS (pH = 7) containing 50 μM DA to detect UA. (E) DPV of CuNPs/CN/GCE in 0.2 M N2-statured PBS (pH = 7) to detect DA and UA. (F) Curve of peak current density and concentration. Insets: plots of peak current density versus concentration.
Chemosensors 10 00458 g005
Figure 6. (A,C,E) DPV of FeNPs/CN/GCE, CoNPs/CN/GCE, NiNPs/CN/GCE in 0.2 M N2-statured PBS (pH = 7) containing UA to detect DA. (B,D,F) DPV of FeNPs/CN/GCE, CoNPs/CN/GCE, NiNPs/CN/GCE in 0.2 M N2-statured PBS (pH = 7) containing DA to detect UA. Insets: plots of peak current density versus concentration.
Chemosensors 10 00458 g006
Figure 7. (A) DPV of CuNPs/CN/GCE in 0.2 M N2-statured PBS (pH = 7) to detect FZ. (B) Plot of peak current density and concentration.
Chemosensors 10 00458 g007
Publisher’s Note: MDPI stays neutral with regard to jurisdictional claims in published maps and institutional affiliations.

