Article

Enhanced Sensing Performance of Electrospun Tin Dioxide Nanofibers Decorated with Cerium Dioxide Nanoparticles for the Detection of Liquefied Petroleum Gas

College of Control Science and Engineering, China University of Petroleum (East China), Qingdao 266580, China
*
Author to whom correspondence should be addressed.
Chemosensors 2022, 10(12), 497; https://doi.org/10.3390/chemosensors10120497
Submission received: 23 October 2022 / Revised: 9 November 2022 / Accepted: 22 November 2022 / Published: 23 November 2022
(This article belongs to the Special Issue The State-of-the-Art Gas Sensor)

Abstract

:
Tin dioxide (SnO2) nanofibers and cerium dioxide (CeO2) nanoparticles were prepared by electrospinning and hydrothermal methods, respectively. The morphology and structure of the synthesized SnO2/CeO2 samples were characterized by a variety of methods. The gas-sensing properties of the SnO2/CeO2 sensor were investigated for liquefied petroleum gas (LPG) detection at room temperature. Compared with pure SnO2 nanofibers, the SnO2/CeO2 composite sensor showed a much higher response and shorter response time for LPG sensing after doping with CeO2 nanoparticles. Furthermore, the SnO2/CeO2 composite sensor had better resistance to interference from humidity than the pure SnO2 sensor. The significantly enhanced sensing performance of the SnO2/CeO2 composite sensor for LPG can be attributed to the modification with CeO2 to increase oxygen vacancies and form a heterostructure with SnO2 nanofibers. Meanwhile, the LPG detection circuit was built to realize real-time concentration display and alarm for practical applications.

1. Introduction

With the progress of industrialization, people are paying more and more attention to personal health and safety [1]. Liquefied petroleum gas (LPG) is mainly composed of propane, butane, and other alkanes [2]. It can be used as an industrial and civil fuel for kiln roasting, automobile driving, and residential life. It is widely used in daily life and industrial production as an efficient source of combustion energy [3]. The lower explosive limit of liquefied petroleum gas is only 2 vol.% [4]. Since the specific gravity of liquefied petroleum gas is greater than that of air, once it leaks, it is easy for it to gather in low-lying areas and mix with air to reach this concentration [5]. Therefore, for the safety of production and general living, it is necessary to develop liquefied petroleum gas sensors to detect leakages and take further measures in a timely manner.
In view of the good crystal structure and stable chemical properties of SnO2, it can be used in the fields of batteries, photocatalysis, and sensing [6]. However, the application of pure SnO2 still has many limitations. For example, detection can only be carried out under high operating temperatures, and it even fails to detect certain gases [7]. To solve these problems, most research groups control the morphology of SnO2 and introduce dopants based on it [8,9]. Electrospinning is one of the methods used to quickly and directly fabricate nanofibers. Due to its advantages of large specific surface area and high porosity, electrospinning has potential application value in many fields—especially for gas sensors [10,11]. Morais et al. successfully prepared a NO2 sensor from electrospun WO3 nanofibers and studied the influence of the temperature and heating rate on the thickness and grain size of the electrospun nanofibers [12]. Ultimately, they found that the WO3 nanofibers calcined at 500 °C with a heating rate of 10 °C/min performed better in gas sensing. Shingange et al. prepared one-dimensional LaCoO3 nanofibers by electrospinning to detect ethanol gas [13]; their results showed a high response of 32.4 to 40 ppm ethanol at the optimal working temperature of 120 °C. This excellent ethanol sensing performance can be attributed to the interconnected porous nanofiber morphology.
In addition to controlling the morphology, forming oxide semiconductor composites is also an effective way to improve the sensing performance [14]. The modification of functional materials can take advantage of the synergistic effect of the two materials to obtain good sensing characteristics [15,16]. Liu et al. synthesized polyaniline-coated Rh-doped hollow SnO2 nanotubes through electrospinning and in situ polymerization techniques [17]. At room temperature, the sensor had a response value of 13.6 to 100 ppm NH3. In recent years, rare-earth elements have been used in gas sensors because of their unique characteristics, such as excellent oxygen storage capacity and abundant oxygen vacancy [18,19]. The surface modification of SnO2 nanofibers through rare-earth elements can improve their sensitivity to the target gas [20]. As a typical n-type semiconductor, CeO2 is recognized as a promising sensing material for the detection of liquefied petroleum gas, benefiting from the characteristics of its high thermal stability, tunable bandgap, and high diffusion coefficient for oxygen vacancies induced by reversible transition between Ce3+ and Ce4+ oxidation states [21,22]. Yoon et al. modified In2O3 by redox conversion between the valence states of CeO2 to remove the hydroxyl groups on the surface of In2O3 to prepare an acetone gas sensor that was resistant to humidity interference [23].
In this study, tin dioxide (SnO2) nanofibers and cerium dioxide (CeO2) nanoparticles were prepared by electrospinning and hydrothermal methods, respectively. The composite of tin dioxide nanofibers decorated with cerium dioxide nanoparticles (SnO2/CeO2) was used as sensitive nanomaterial for the detection of liquefied petroleum gas (LPG). The nanostructure of the SnO2/CeO2 composite was characterized by a variety of methods, such as X-ray diffraction (XRD), X-ray photoelectron spectroscopy (XPS), scanning electron microscopy (SEM), and transmission electron microscopy (TEM). The characterization results verified the synthesis of tin dioxide nanofibers decorated with cerium dioxide nanoparticles. The as-prepared SnO2/CeO2 composite sensor showed a much higher response and shorter response time for LPG detection at room temperature, compared with that of the pure SnO2 nanofibers. Furthermore, the SnO2/CeO2 composite sensor demonstrated higher resistance to humidity interference than the pure SnO2 sensor, as proven by the comparative experiments for LPG detection. In this paper, the significantly enhanced sensing performance of the SnO2/CeO2 composite sensor for LPG can be attributed to the modification of CeO2 to increase oxygen vacancies and form a heterostructure with SnO2 nanofibers. Meanwhile, the LPG detection circuit was built to realize real-time concentration display and alarm for practical applications.

2. Experimental Section

2.1. Materials

Tin(II) dichloride dihydrate (SnCl2·2H2O), absolute ethanol (CH3CH2OH), N,N-dimethylformamide (DMF), polyvinylpyrrolidone (PVP, Mw = 1,300,000), cerium nitrate hexahydrate [Ce(NO3)3·6H2O], ethylene glycol (EG), and glacial acetic acid (CH3COOH) were obtained from Sinopharm Chemical Reagent Co. Ltd(Shanghai, China).

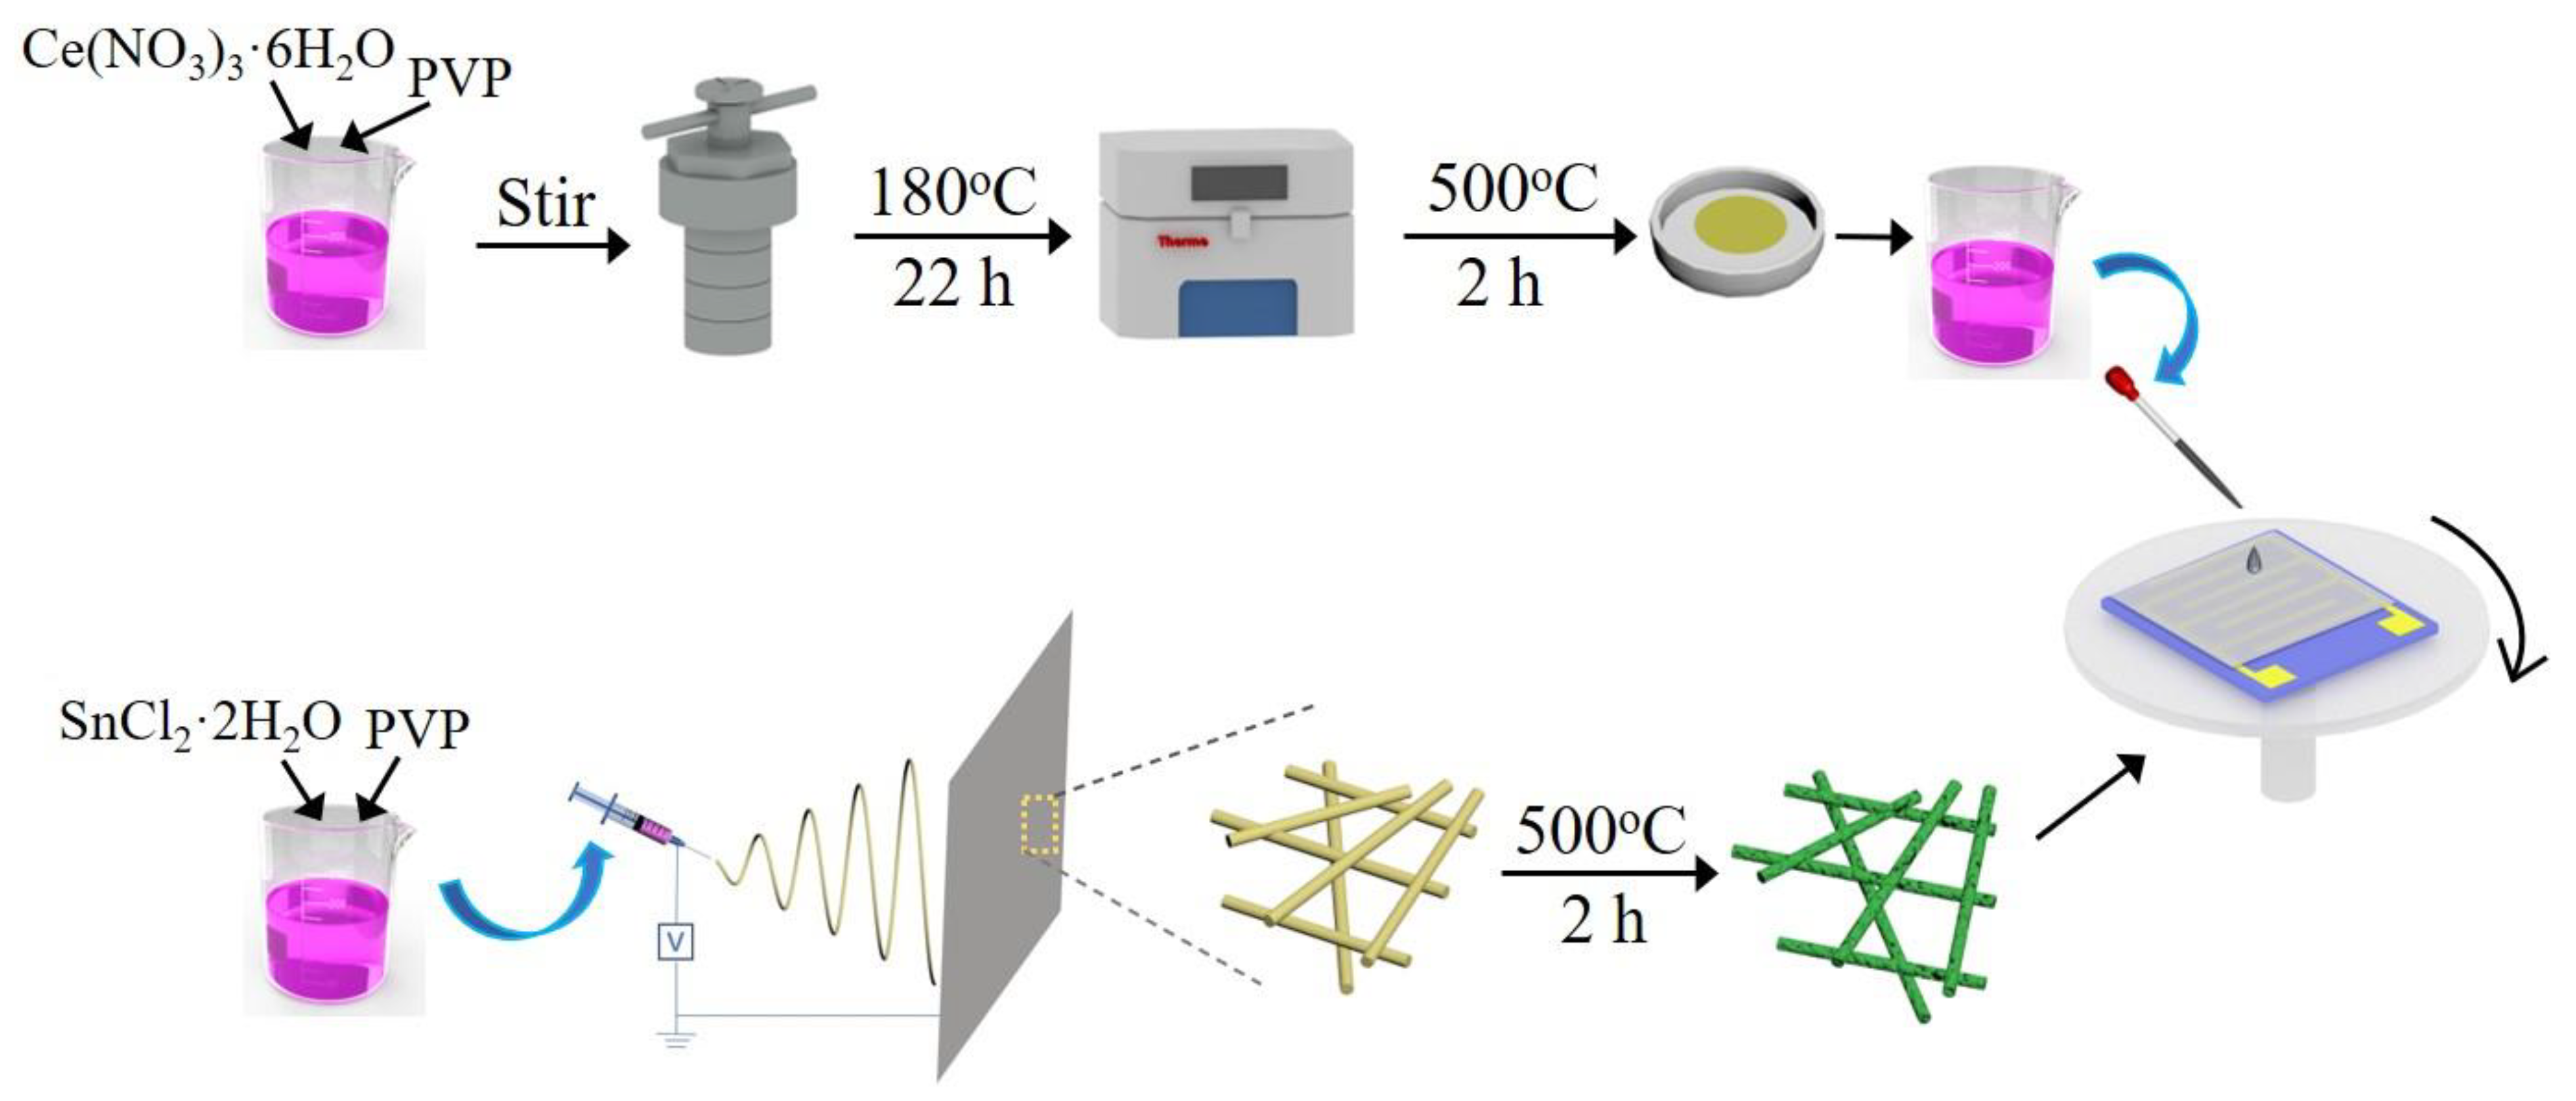
2.2. Material Synthesis and Sensor Fabrication

SnO2 nanofibers were prepared by electrospinning. Firstly, under magnetic stirring at 25 °C for 30 min, 2 mmol of SnCl2·2H2O was dissolved in a mixed solution containing 5 mL of ethanol and 5 mL of DMF. Next, 1 g of PVP was added to the above solution, and stirring was continued at 50 °C for 5 h until a viscous transparent precursor solution was formed. Then, the precursor solution was transferred to a syringe connected to a spinneret with an inner diameter of 0.5 mm. During the electrospinning process, the voltage was 15 kV, and the distance between the positive electrode (needle) and the negative electrode (current collector) was 20 cm. The injection speed of the solution was maintained at 0.5 mL/h by using a peristaltic pump. After electrospinning, the obtained samples were calcined in the air at 500 °C with a heating rate of 1 °C/min for 2 h to remove the organic polymer components.
CeO2 nanoparticles were prepared via hydrothermal reaction. First, 1 g of Ce(NO3)3·6H2O, 10 mL of deionized (DI) water, and 20 mL of EG were stirred at room temperature to be evenly mixed in a beater. During the stirring process, 1 mL of EG was added by dripping, and 0.8 g of PVP was slowly added into the mixed solution to be completely dissolved. The uniformly mixed solution was transferred to a 50 mL autoclave and treated at 180 °C for 22 h. After the reaction was completed and cooled to room temperature, the obtained powder was filtered, washed twice with ethanol and DI water by centrifugation, and dried at 50 °C to obtain the light gray precursor powder sample. Then, the precursor powder was calcined in a muffle furnace at 500 °C for 2 h to obtain a light yellow CeO2 hollow sphere powder. For the sensor fabrication, SnO2 nanofibers and CeO2 hollow spheres were dispersed in DI water, and then they were spin-coated on an epoxy substrate with a pair of Cu/Ni interdigital electrodes to form a two-layer SnO2/CeO2 composite film, as shown in Figure 1. The molar ratio of the SnO2/CeO2 composite was determined to be 1:1, which was adopted in subsequent experiments, and the interfinger electrode was mainly composed of a printed circuit board and Cu/Ni electrode (length × width × height: 1 cm × 1 cm × 1 mm). The Cu/Ni electrode spacing and line width were 300 μm.

2.3. Gas-Sensing Experimental Setup

The temperature and relative humidity of the experimental environment in which the sensor was tested were 25 °C and 47% RH (relative humidity), respectively. The liquefied petroleum gas was composed of propane (25% ± 5%) and isobutane (75% ± 5%). The sensor was placed into a closed gas chamber, into which different volumes of LPG were injected. The Agilent 34470A was used to measure the output electrical signal of the sensor and record the resistance value, which changed with the concentration of the measured gas. The formula for calculating the sensor response value was S = (Ra − Rg)/Ra × 100%, where Ra is the resistance value of the sensor in air, while Rg is the resistance value of the sensor exposed to a certain concentration of liquefied petroleum gas.

3. Results and Discussion

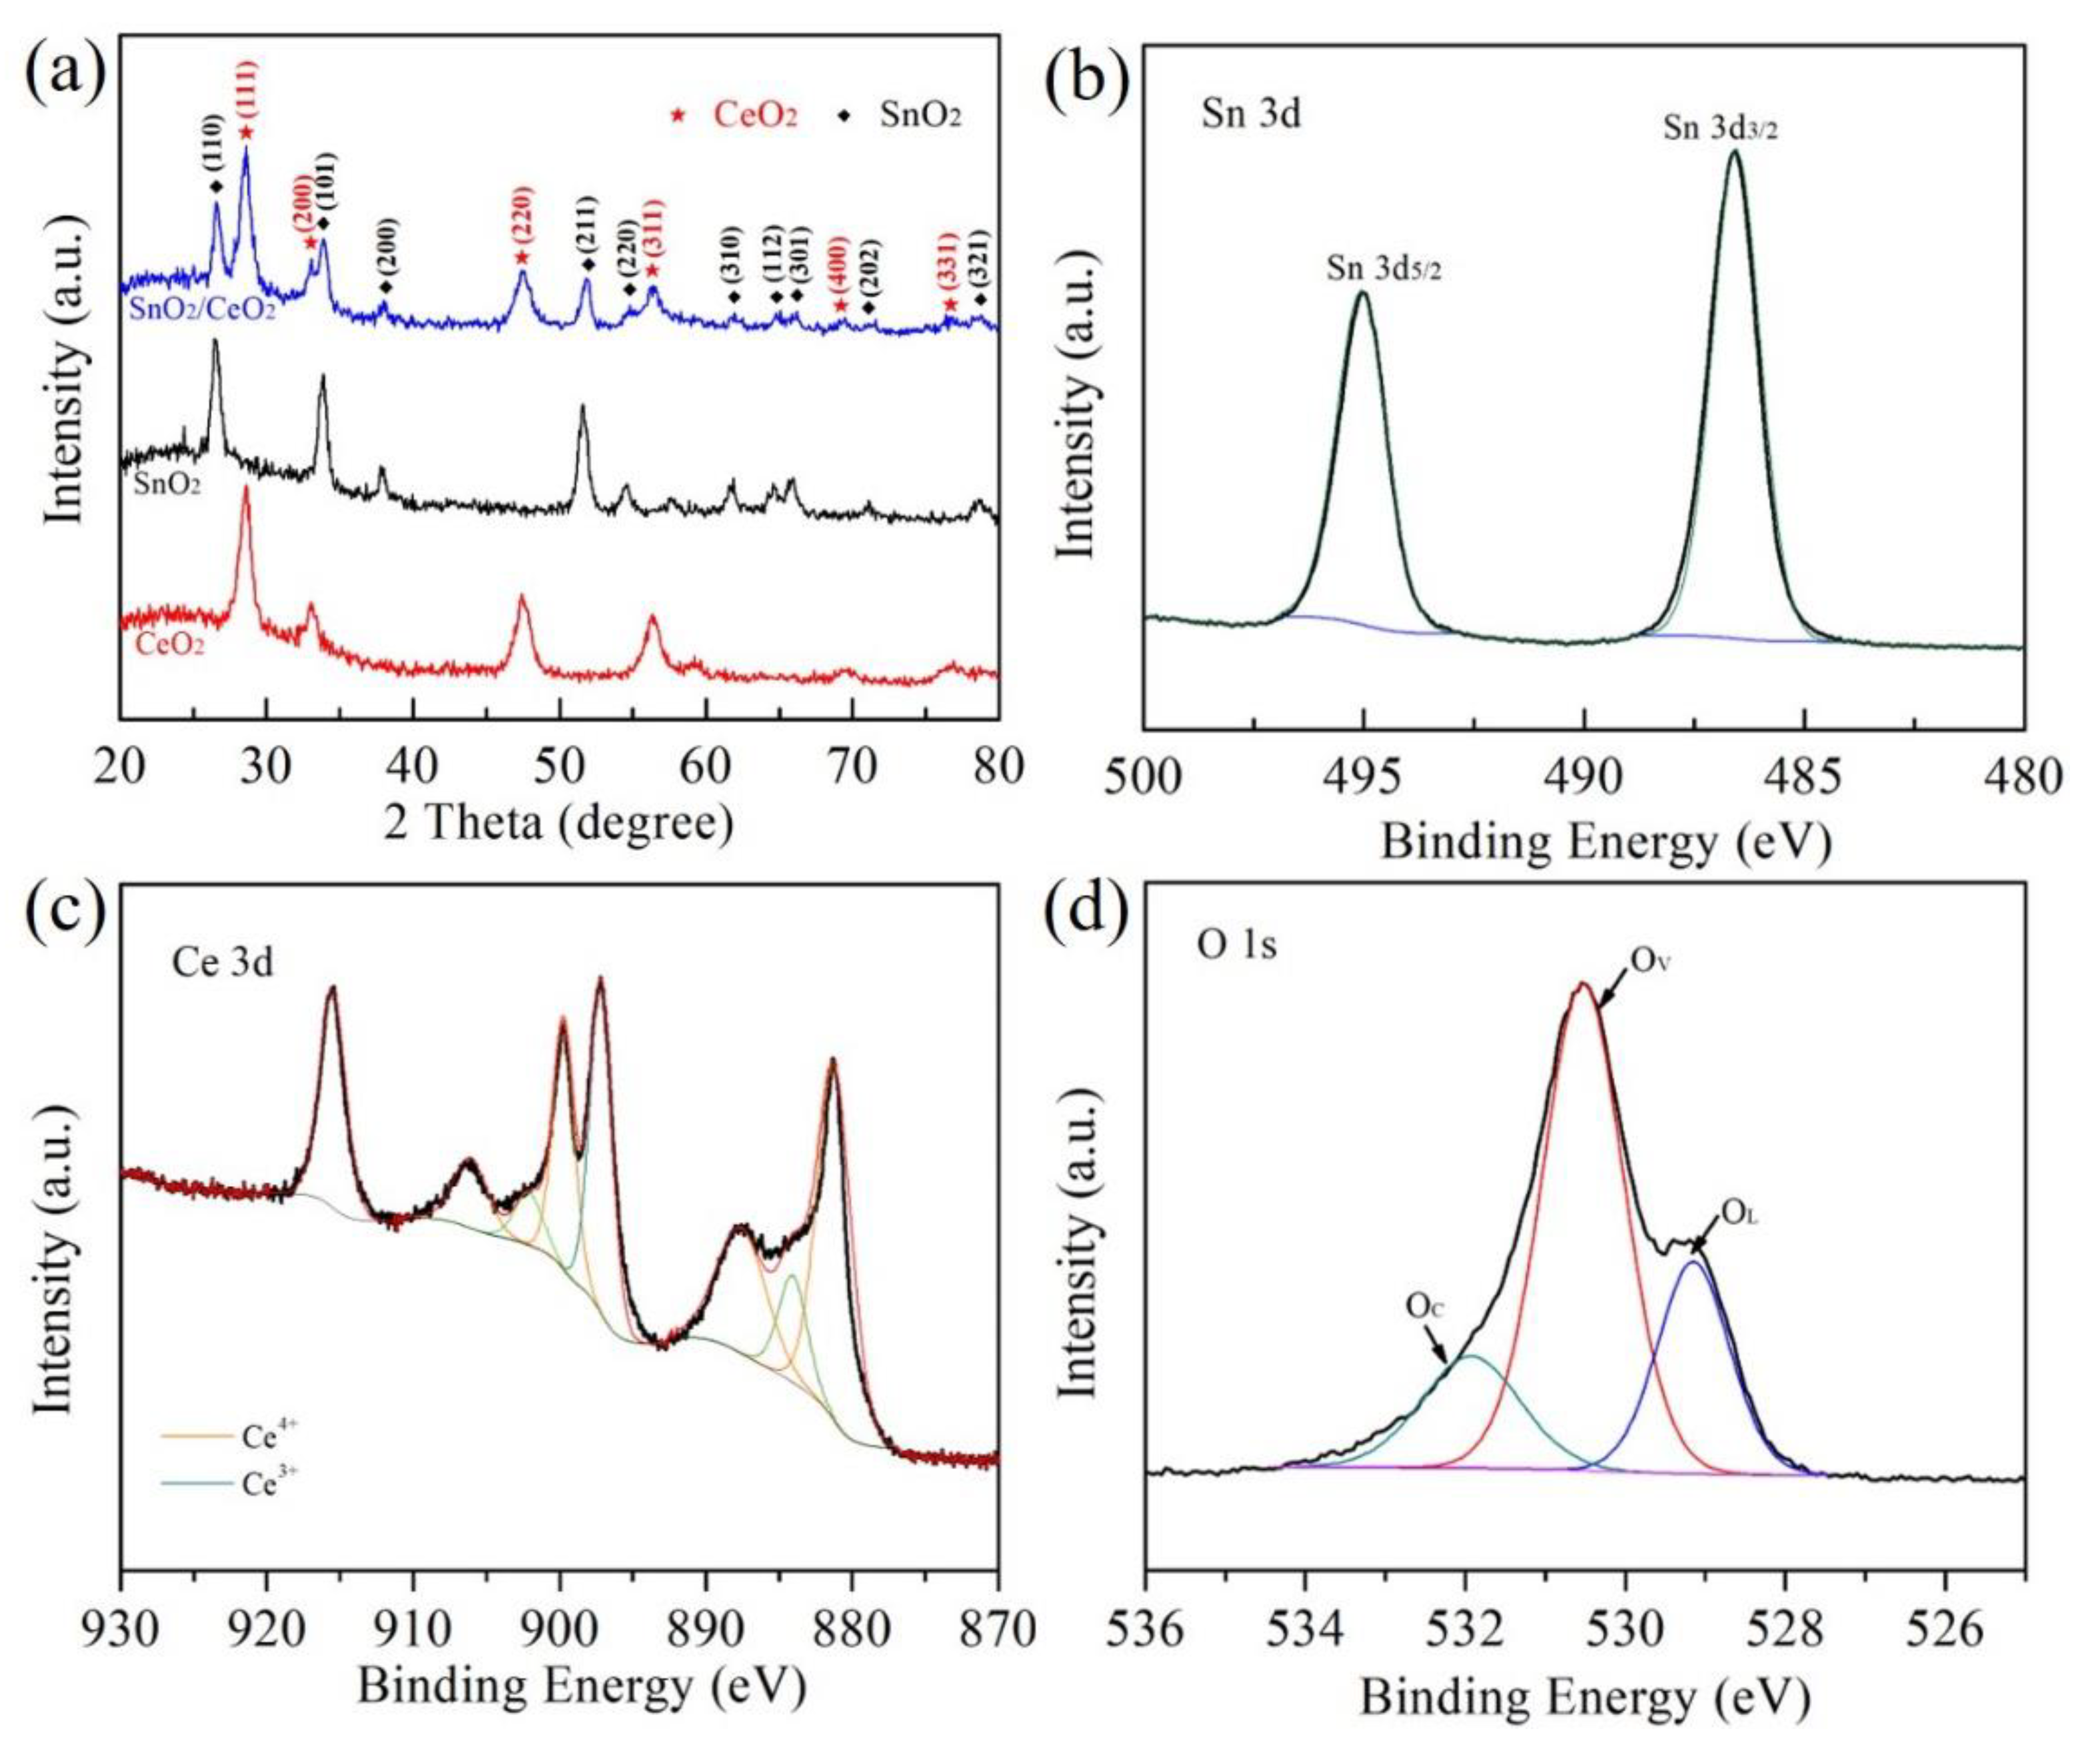
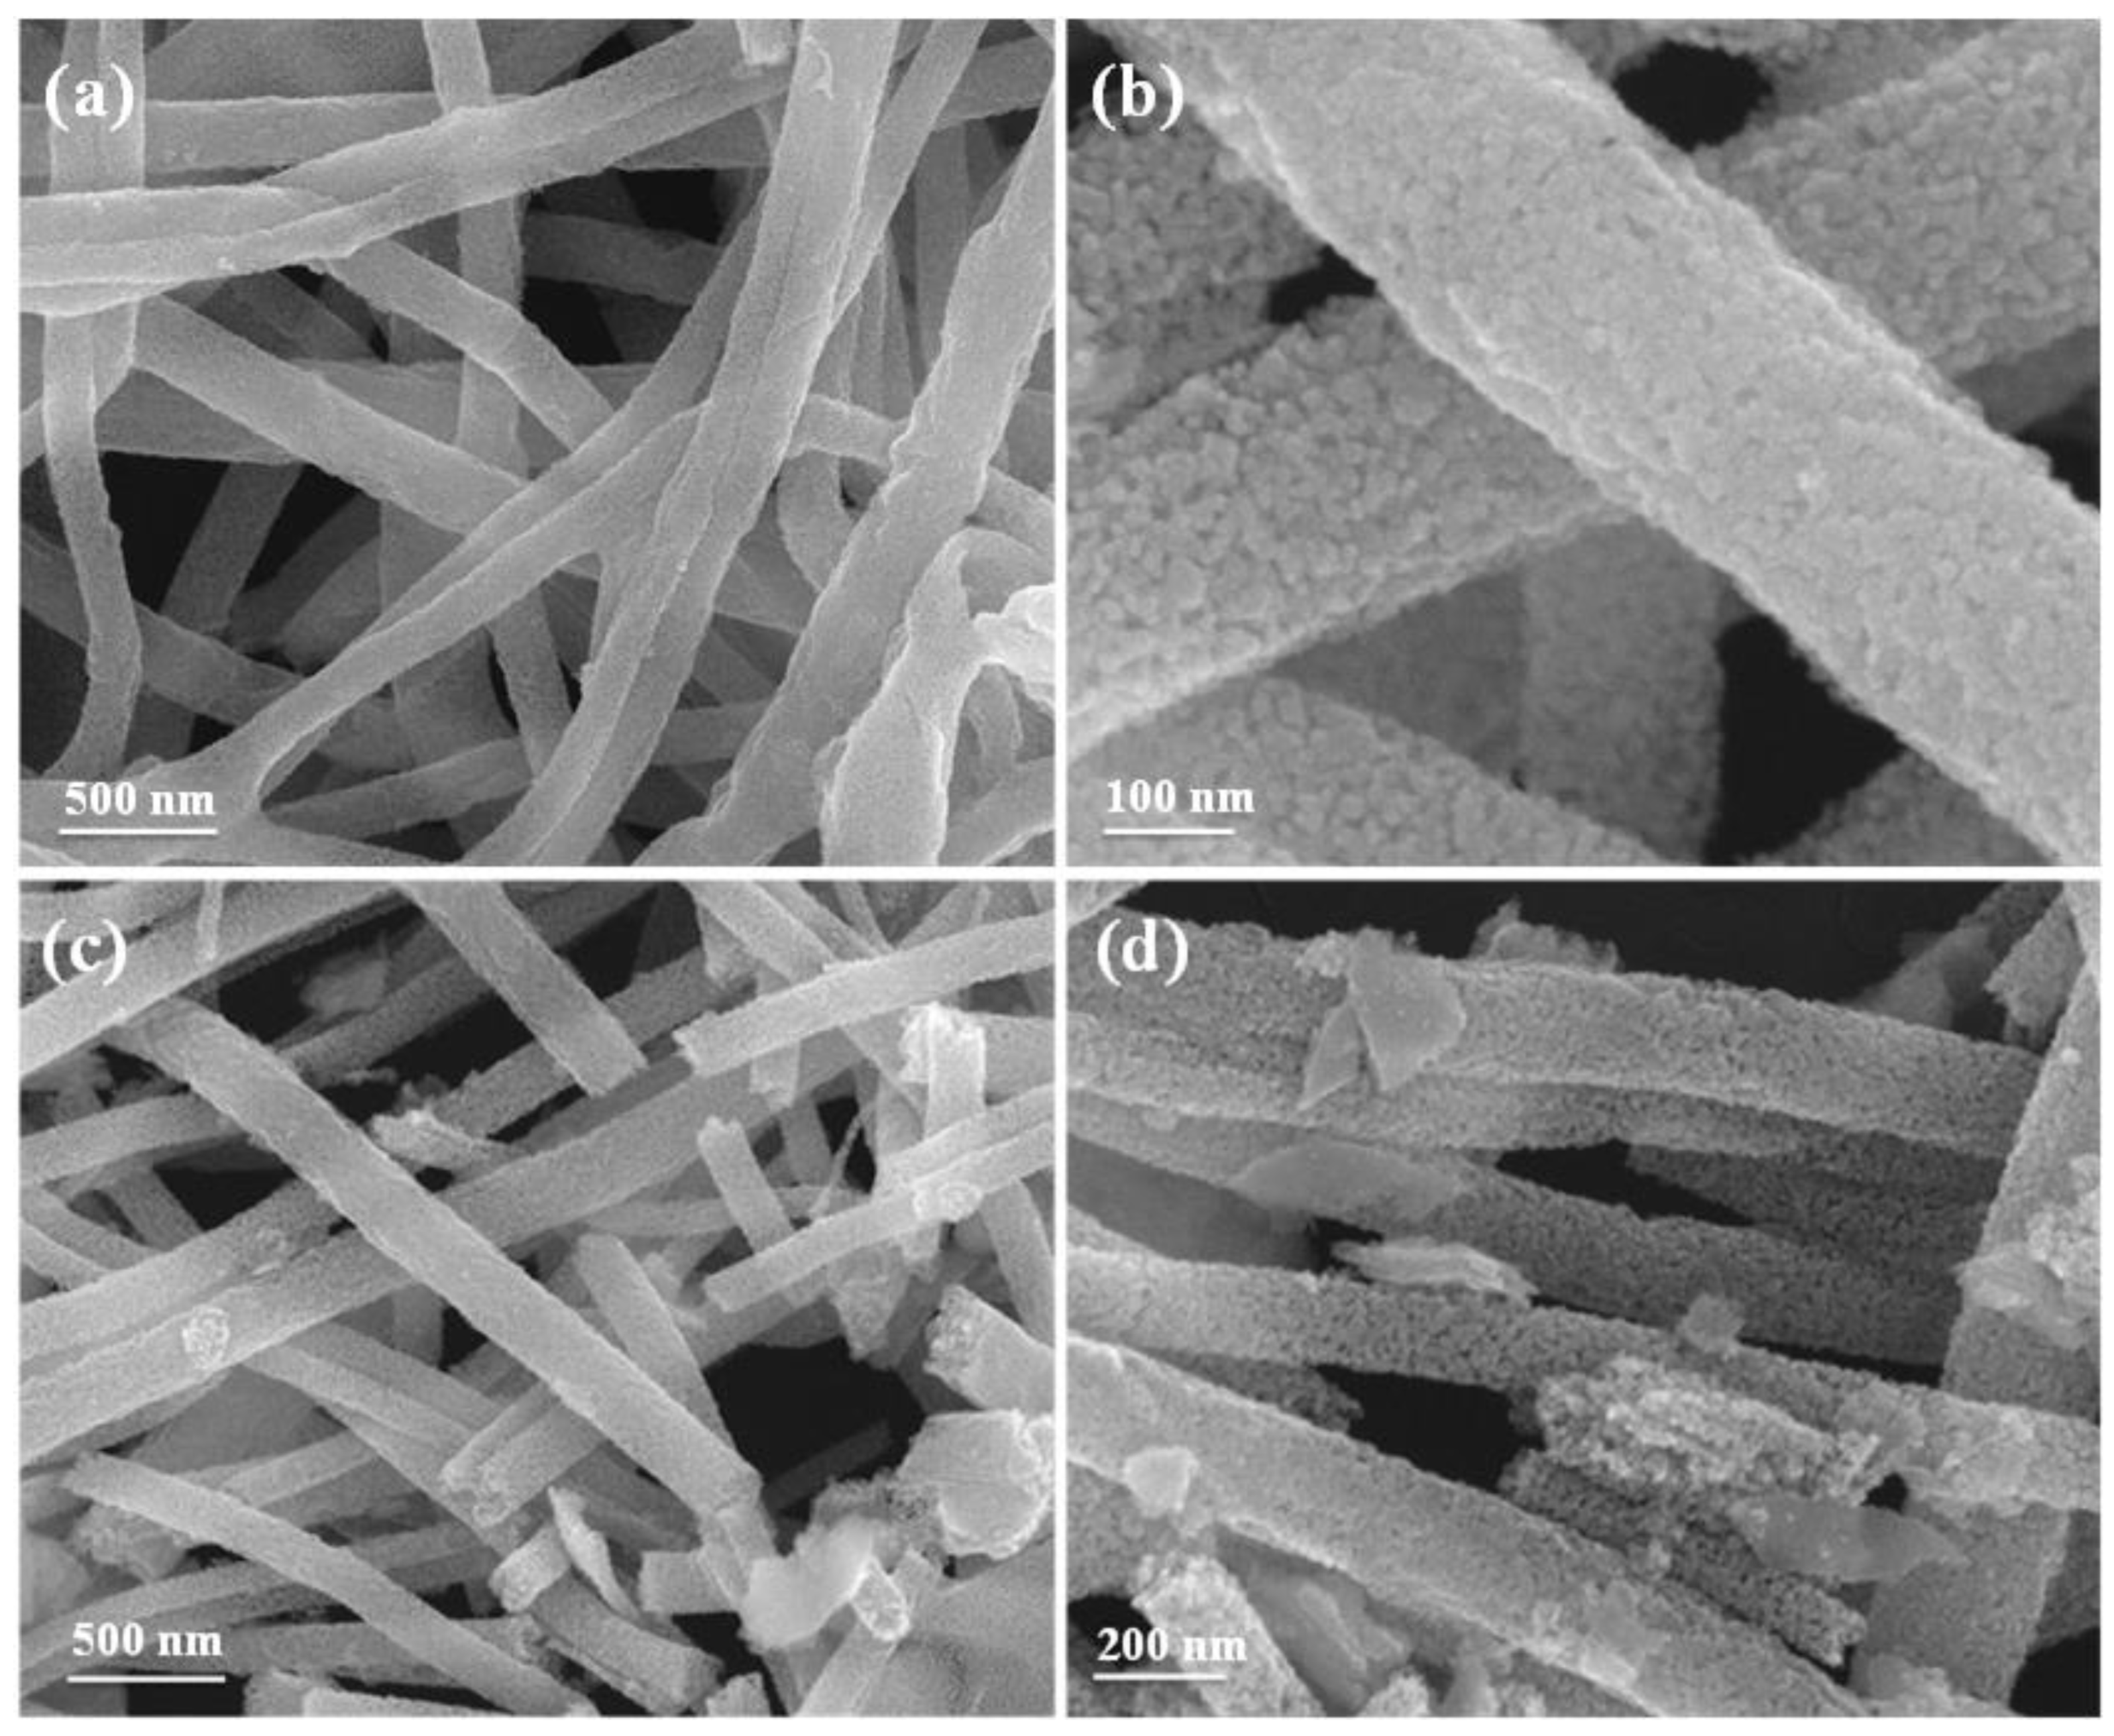
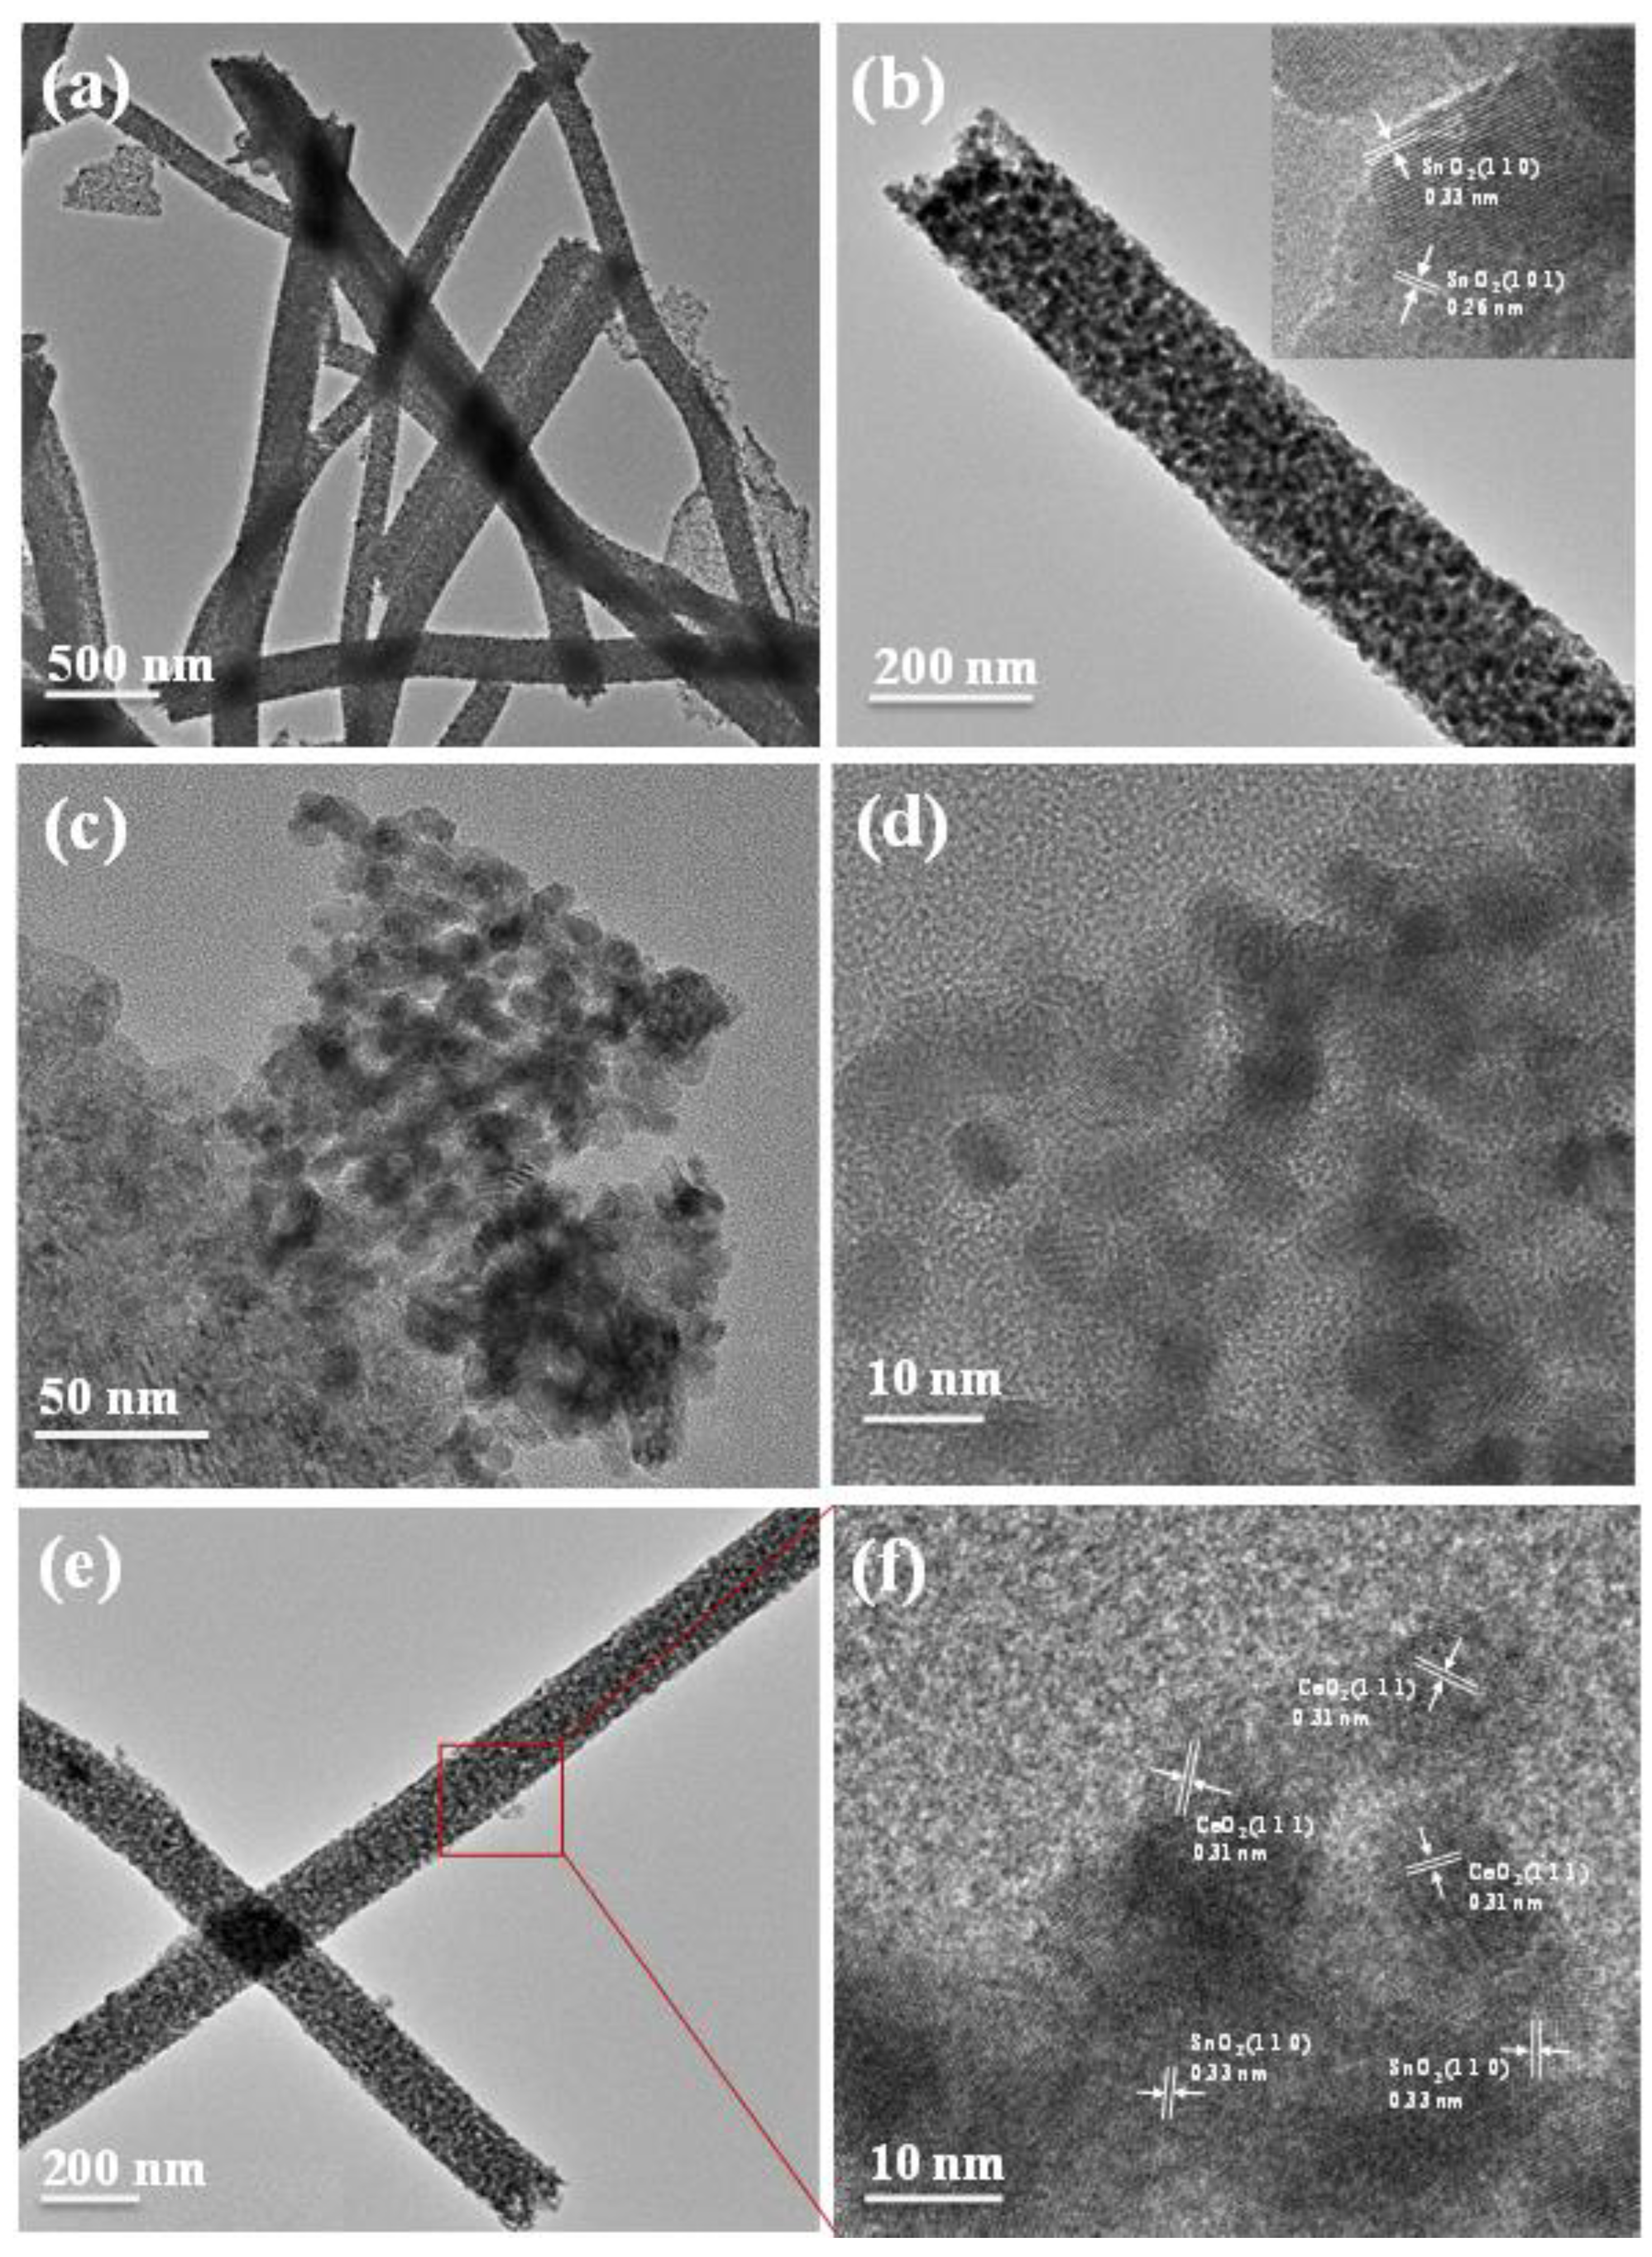
3.1. Structure Characterization

A Rigaku D/Max 2500PC with Cu Kα radiation was used to analyze the crystal planes of pure SnO2, pure CeO2, and SnO2/CeO2 composites. The X-ray diffraction patterns are shown in Figure 2a. The diffraction angles were scanned in the range of 10–80°. The XRD peaks of SnO2 at 26.44°, 33.86°, 37.78°, 51.57°, 54.51°, 61.86°, 64.59°, 65.78°, 71.1°, and 78.73° corresponded to the (110), (101), (200), (211), (220), (310), (112), (301), (202), and (321) planes of the tetragonal phase SnO2 (JCPDS 41-1445), respectively [24,25]. It can be seen from the XRD pattern of CeO2 that the planes of (111), (200), (220), (311), (400), and (331) are located at 28.68°, 33.16°, 47.37°, 56.33°, 69.56°, and 76.77°, respectively, which is consistent with previous reports (JCPDS 34-0394) [26,27]. The characteristic peaks of CeO2 and SnO2 appear in the XRD patterns of the SnO2/CeO2 samples, indicating that the composites were successfully prepared.
The elemental composition and chemical state of the SnO2/CeO2 composite were further determined by X-ray photoelectron spectroscopy (XPS). Figure 2b shows the spectrum of Sn 3d. The characteristic peaks with binding energies of 486.60 eV and 495.05 eV are attributed to Sn 3d3/2 and Sn 3d5/2, respectively [28]. The XPS analysis of Ce 3d is shown in Figure 2c. The peaks located at 881.15, 887.55, 899.75, 906.30, and 915.60 eV correspond to Ce4+ [29]. The characteristic peaks located at 884.20, 897.15, and 902.15 eV in the spectrum correspond to Ce3+, proving the multivalent state of cerium ions in CeO2 [30]. The three characteristic peaks of the O 1s spectrum in Figure 2d can be attributed to lattice oxygen (OL), vacancy oxygen (OV), and adsorbed oxygen (OC), according to the level of binding energy [31].
After 2 h of calcination at 500 °C, the morphology of single SnO2 nanofibers was characterized by field-emission scanning electron microscopy (SEM, Hitachi S-4800), as shown in Figure 3a,b. The sample exhibited fibrous morphology, with a diameter of approximately 180 nm. These nanofibers were composed of many small nanoparticles. The network structure of the nanofibers facilitated the diffusion of gas from the surface of the sensing material to the interior. The SEM images of the SnO2/CeO2 composite are shown in Figure 3c,d. Compared with the individual SnO2 nanofibers, agglomerated CeO2 nanoparticles attached to the surface of SnO2, indicating that the CeO2 nanoparticles had successfully decorated the surface of the SnO2 nanofibers.
The structural characteristics of the SnO2/CeO2 composite were further observed by transmission electron microscopy (TEM, JEOL JEM-2100). TEM images of typical nanofibers are shown in Figure 4a,b. It can be seen from Figure 4b that the nanofibers are composed of many nanoparticles. As the calcination removes the polymer, there are pores between adjacent nanoparticles. The crystal lattice corresponding to the (110) plane and the (101) plane of SnO2 can be seen in the inset of Figure 4b [32]. Figure 4c,d show granular CeO2 with uniform size distribution. In the TEM images of the SnO2/CeO2 composite shown in Figure 4e, the CeO2 nanoparticles are attached to the surface of the SnO2 nanofibers. Figure 4f shows a high-resolution image of the SnO2/CeO2 composite, which displays the presence of SnO2 and CeO2 lattices. The interplanar spacings of 0.33 and 0.31 nm correspond to the spacings of the (110) plane of tetragonal SnO2 and the (111) plane of CeO2, respectively [33,34].

3.2. LPG Sensing Properties

The effect of CeO2 modification on the LPG sensing performance of SnO2 was investigated. Figure 5a,b show the dynamic response curves of the single SnO2 sensor and the SnO2/CeO2 composite sensor, respectively, toward concentrations of LPG ranging from 500 to 5000 ppm at room temperature. With the increase in the LPG concentration, the responses of both sensors exhibit an upward trend, and it is clear that the sensor based on SnO2/CeO2 has a higher response value, which is twice that of the individual SnO2 sensor. The fitting curves of the response value vs. the concentration are shown in Figure 5c, which can be expressed as Y = 4.4220x0.2034 − 11.5169 and Y = 1.7377x0.3709 − 10.6888, respectively. The regression coefficient (R2) of the SnO2/CeO2 composite sensor is 0.98, indicating that the fitting equation can adequately reflect the relationship between the concentration and the sensor response. Figure 5d shows the response–recovery curves of the SnO2 sensor and SnO2/CeO2 sensor to 2000 ppm LPG. The response time of the SnO2/CeO2 sensor (45 s) is shorter than that of the SnO2 sensor (78 s). However, the recovery time of the SnO2/CeO2 sensor is long, indicating that the LPG adsorbed on the surface of the material desorbs slowly in the air. Reasonable solutions should be sought in subsequent research.
The response time and recovery time of the SnO2/CeO2 sensor at different concentrations are shown in Figure 6a. Figure 6b shows the I–V characteristic curves of the SnO2 sensor and the SnO2/CeO2 sensor. Compared with the pure SnO2 sensor, the forward current and reverse current of the SnO2/CeO2 composite sensor are asymmetric, and the curve is nonlinear, indicating that the SnO2/CeO2 sensor has a heterogeneous structure. We can see from the repeatability measurements shown in Figure 6c that the response value did not change significantly in the three test cycles with gas concentrations of 1000 ppm and 3000 ppm. Figure 6d shows the long-term stability results of the SnO2/CeO2 sensor. The response of the sensor at 2000 ppm was tested for a month. The fluctuation was small, indicating that the SnO2/CeO2 sensor has good commercial potential.
Furthermore, we considered the influence of humidity on gas detection. Figure 7a shows that as the humidity increases, the resistance of the SnO2 sensor and the SnO2/CeO2 sensor will decrease. Figure 7b shows a comparison chart of the ratio of Ra-wet to Ra-dry of the SnO2 sensor and SnO2/CeO2 sensor. To explore the ability of the sensor to resist the influence of humidity, we switched the sensor in the air environment with a given humidity to a gas environment with the same humidity. Figure 7c plots the response values of the SnO2/CeO2 composite sensor to 500 ppm, 1000 ppm, and 2000 ppm LPG under different levels of humidity. Figure 7d shows a comparison chart of the ratio of Swet to Sdry of the SnO2 sensor and the SnO2/CeO2 sensor. The ability of the SnO2/CeO2 sensor to resist the influence of humidity was more effective than that of the single SnO2 sensor.
A real-time gas detection circuit was built by using the microcontroller to apply the SnO2/CeO2 gas sensor for the detection of LPG. A TL431 chip was used to generate a steady voltage as reference for the bleeder circuit and the analog/digital converter chip of the TLC549. The output voltage of the sensor was amplified after the voltage follower and filtering circuit, and then it was converted to a digital signal by using the TLC54, as shown in Figure 8. The terminal realizes real-time detection and concentration visualization of LPG through an LCD display. When the concentration exceeds the safe value, an alarm prompt appears immediately on the display interface, and the buzzer begins to sound. This provides a feasible scheme for the safety monitoring of LPG and promotes the development of industrial safety.

3.3. LPG Sensing Mechanism

The sensing performance of the semiconductor gas sensor is related to the oxygen-adsorption capacity of the gas-sensitive film [35,36]. The electronic gain and loss of oxygen leads to the transfer of electrons in the sensitive film, changing the output electrical parameters of the sensor. As shown in Figure 9a, the oxygen molecules adsorbed on the surface of the SnO2/CeO2 composite can capture electrons from the conduction band and form oxygen ions on the surface of the material, resulting in a decrease in the electron concentration [37]. When the SnO2/CeO2 sensor is exposed to LPG, the adsorbed oxygen ions react with propane molecules and isobutane molecules to release electrons to the conduction band of the material, as shown in Figure 9b [38]. Therefore, the conductivity of the SnO2/CeO2 gas sensor will increase, resulting in a decrease in the sensor’s resistance.
The enhanced response of the SnO2 sensor modified with CeO2 may be attributed to the following reasons: First, a heterojunction is formed between CeO2 and SnO2. Since the work function of CeO2 is 4.69 eV—less than the 4.9 eV of SnO2—the electrons will migrate from CeO2 to SnO2, forming an electron depletion layer at the CeO2 interface and an electron accumulation layer at the SnO2 interface, as shown in Figure 9c [39,40]. The formation of the heterojunction leads to an increase in chemically adsorbed oxygen and the capture of more electrons [41,42]. Compared with pure SnO2, the formation of the higher barrier between the two semiconductor oxides leads to an increase in the base resistance value. When the SnO2/CeO2 gas sensor is transferred to the LPG atmosphere, more electrons captured by the oxygen are released back into the conduction band [43]. As the electron concentration becomes higher, the balance of the Fermi level of the composite is destroyed. Some electrons are injected into CeO2 from SnO2, resulting in a decrease in the barrier height, as shown in Figure 9d [44].
Secondly, the XPS characterization results show that Ce3+ and Ce4+ coexist in the SnO2/CeO2 composite. Some studies report that the redox reaction between Ce4+ and Ce3+ in CeO2 can generate oxygen defects. The reaction equation is as follows [45,46,47,48]:
Ce4+ + O2− = Ce3+ + Vo•• + O2
where Vo•• represents the oxygen vacancy with two negative charges as the electron donor. Increased oxygen vacancies in composites modified with CeO2 induce stronger oxygen adsorption and lead to enhanced gas sensitivity [49,50,51].
Thirdly, cerium oxide is widely used in automobile exhaust catalysts because it has good stability. It can absorb and release oxygen under oxidation and reduction reactions, allowing more electrons to be easily captured and released from the conduction band, which leads to a higher response [52].

4. Conclusions

In conclusion, the SnO2/CeO2 composite was fully characterized for the preparation of LPG sensors. The gas-sensing properties of the SnO2/CeO2 sensor were investigated for LPG detection at room temperature. The SnO2/CeO2 composite sensor showed a much higher response and shorter response time for LPG sensing after doping with CeO2 nanoparticles. In addition, the SnO2/CeO2 composite sensor had higher resistance to humidity interference than the pure SnO2 sensor. The enhanced gas-sensing performance of SnO2/CeO2 composites can be attributed to the fact that CeO2, with abundant oxygen vacancies, provides more active sites for gas sensing and the formation of heterostructures between SnO2 and CeO2.

Author Contributions

Conceptualization, D.Z. and X.L.; methodology, D.Z.; validation, J.Z., H.Z. and X.L.; formal analysis, C.C.; investigation, J.Z.; data curation, J.Z.; writing—original draft preparation, J.Z.; writing—review and editing, D.Z. and X.L. All authors have read and agreed to the published version of the manuscript.

Funding

This work was supported by the National Natural Science Foundation of China (51777215) and the Original Innovation Special Project of Science and Technology Plan of Qingdao West Coast New Area (2020-85).

Institutional Review Board Statement

Not applicable.

Informed Consent Statement

Not applicable.

Data Availability Statement

Not applicable.

Conflicts of Interest

The authors declare no competing financial interests.

References

  1. Zhang, H.; Zhang, D.; Zhang, B.; Wang, D.Y.; Tang, M. Wearable pressure sensor array with layer-by-layer assembled MXene nanosheets/Ag nanoflowers for motion monitoring and human-machine interfaces. ACS Appl. Mater. Interfaces 2022, 14, 48907–48916. [Google Scholar] [CrossRef] [PubMed]
  2. Shukla, P.; Saxena, P.; Madhwal, D.; Bhardwaj, N.; Jain, V.K. Battery-operated resistive sensor based on electrochemically exfoliated pencil graphite core for room temperature detection of LPG. Sens. Actuators B 2021, 343, 130133. [Google Scholar] [CrossRef]
  3. Choudhary, S.; Annapoorni, S.; Malik, R. Facile strategy to synthesize donut-shaped α-Fe2O3 nanoparticles for enhanced LPG detection. Sens. Actuators B 2021, 334, 129668. [Google Scholar] [CrossRef]
  4. Yadav, B.C.; Singh, S.; Yadav, A. Nanonails structured ferric oxide thick film as room temperature liquefied petroleum gas (LPG) sensor. Appl. Surf. Sci. 2011, 257, 1960–1966. [Google Scholar] [CrossRef]
  5. Gupta, P.; Pandey, N.K.; Kumar, K.; Yadav, B.C. Structural, optical and LPG sensing properties of zinc-doped nickel oxide pellets operated at room temperature. Sens. Actuators A 2021, 319, 112484. [Google Scholar] [CrossRef]
  6. Kang, Z.J.; Zhang, D.Z.; Li, T.T.; Liu, X.H.; Song, X.S. Polydopamine-modified SnO2 nanofiber composite coated QCM gas sensor for high-performance formaldehyde sensing. Sens. Actuators B 2021, 345, 130299. [Google Scholar] [CrossRef]
  7. Wang, L.; Ma, S.Y.; Xu, X.L.; Li, J.P.; Yang, T.T.; Cao, P.F.; Yun, P.D.; Wang, S.Y.; Han, T. Oxygen vacancy-based Tb-doped SnO2 nanotubes as an ultra-sensitive sensor for ethanol detection. Sens. Actuators B 2021, 344, 130111. [Google Scholar] [CrossRef]
  8. Meng, F.J.; Guo, X.M. Tuning the oxygen defects and Fermi levels via In3+ doping in SnO2-In2O3 nanocomposite for efficient CO detection. Sens. Actuators B 2022, 357, 131412. [Google Scholar] [CrossRef]
  9. Mnethu, O.; Nkosi, S.S.; Kortidis, I.; Motaung, D.E.; Kroon, R.E.; Swart, H.C.; Ntsasa, N.G.; Tshilongo, J.; Moyo, T. Ultra-sensitive and selective p-xylene gas sensor at low operating temperature utilizing Zn doped CuO nanoplatelets: Insignificant vestiges of oxygen vacancies. J. Colloid Interface Sci. 2020, 576, 364–375. [Google Scholar] [CrossRef]
  10. Bulemo, P.M.; Kim, D.H.; Kim, I.D. Controlled synthesis of electrospun hollow Pt-loaded SnO2 microbelts for acetone sensing. Sens. Actuators B 2021, 344, 130208. [Google Scholar] [CrossRef]
  11. Wang, T.T.; Cheng, L. Hollow hierarchical TiO2-SnO2-TiO2 composite nanofibers with increased active-sites and charge transfer for enhanced acetone sensing performance. Sens. Actuators B 2021, 334, 129644. [Google Scholar] [CrossRef]
  12. Paulo, V.M.; Pedro, H.S.; Ranilson, A.S.; Marcelo, O.O. High gas sensor performance of WO3 nanofibers prepared by electrospinning. J. Alloys Compd. 2021, 864, 158745. [Google Scholar]
  13. Shingange, K.; Swart, H.C.; Mhlongo, G.H. Design of porous p-type LaCoO3 nanofibers with remarkable response and selectivity to ethanol at low operating temperature. Sens. Actuators B 2020, 308, 127670. [Google Scholar] [CrossRef]
  14. Wang, X.W.; Zhang, D.Z.; Zhang, H.B.; Gong, L.K.; Yang, Y.; Zhao, W.H.; Yu, S.J.; Yin, Y.D.; Sun, D.F. In situ polymerized polyaniline/MXene (V2C) as building blocks of supercapacitor and ammonia sensor self-powered by electromagnetic-triboelectric hybrid generator. Nano Energy 2021, 88, 106242. [Google Scholar] [CrossRef]
  15. Cai, Z.C.; Goo, E.; Park, S. Synthesis of tin dioxide (SnO2) hollow nanospheres and its ethanol-sensing performance augmented by gold nanoparticle decoration. J. Alloys Compd. 2021, 883, 160868. [Google Scholar] [CrossRef]
  16. Choi, M.S.; Ahn, J.; Kim, M.Y.; Mirzaei, A.; Choi, S.M.; Chun, D.W.; Jin, C.; Lee, K.H. Changes in the crystal structure of SnO2 nanoparticles and improved H2S gas-sensing characteristics by Al doping. Appl. Surf. Sci. 2021, 565, 150493. [Google Scholar] [CrossRef]
  17. Liu, A.; Lv, S.Y.; Zhao, L.J.; Liu, F.M.; Wang, J.; You, R.; Yang, Z.J.; He, J.M.; Jiang, L.; Wang, C.G.; et al. Room temperature flexible NH3 sensor based on polyaniline coated Rh-doped SnO2 hollow nanotubes. Sens. Actuators B 2021, 330, 129313. [Google Scholar] [CrossRef]
  18. Li, P.P.; Wang, B.; Qin, C.; Han, C.; Sun, L.; Wang, Y.D. Band-gap-tunable CeO2 nanoparticles for room-temperature NH3 gas sensors. Ceram. Int. 2020, 46, 19232–19240. [Google Scholar] [CrossRef]
  19. Wang, D.Y.; Zhang, D.Z.; Tang, M.C.; Zhang, H.; Sun, T.H.; Yang, C.Q.; Mao, R.Y.; Li, K.S.; Wang, J.H. Ethylene chlorotrifluoroethylene/hydrogel-based liquid-solid triboelectric nanogenerator driven self-powered MXene-based sensor system for marine environmental monitoring. Nano Energy 2022, 100, 107509. [Google Scholar] [CrossRef]
  20. Zhang, Y.Q.; Wang, C.; Zhao, L.J.; Liu, F.M.; Sun, X.Y.; Hu, X.L.; Lu, G.Y. Preparation of Ce-doped SnO2 cuboids with enhanced 2-butanone sensing performance. Sens. Actuators B 2021, 341, 130039. [Google Scholar] [CrossRef]
  21. Ortega, P.; Hangai, B.; Moreno, H.; Rocha, L.; Ramirez, M.; Ponce, M.; Longo, E.; Simoes, A. Tuning structural, optical, and gas sensing properties of ceria-based materials by rare-earth doping. J. Alloys Compd. 2021, 888, 161517. [Google Scholar] [CrossRef]
  22. Hu, Q.; Huang, B.Y.; Li, Y.; Zhang, S.M.; Zhang, Y.X.; Hua, X.H.; Liu, G.; Li, B.S.; Zhou, J.Y.; Xie, E.Q. Methanol gas detection of electrospun CeO2 nanofibers by regulating Ce3+/Ce4+ mole ratio via Pd doping. Sens. Actuators B 2020, 307, 127638. [Google Scholar] [CrossRef]
  23. Yoon, J.W.; Kim, J.S.; Kim, T.H.; Hong, Y.J.; Kang, Y.C.; Lee, J.H. A new strategy for humidity independent oxide chemiresistors: Dynamic self-refreshing of In2O3 sensing surface assisted by layer-by-layer coated CeO2 nanoclusters. Small 2016, 12, 4229–4240. [Google Scholar] [CrossRef] [PubMed]
  24. Bai, X.; Lv, H.; Liu, Z.; Chen, J.K.; Wang, J.; Sun, B.H.; Zhang, Y.; Wang, R.H.; Shi, K.Y. Thin-layered MoS2 nanoflakes vertically grown on SnO2 nanotubes as highly effective room-temperature NO2 gas sensor. J. Hazard. Mater. 2021, 416, 125830. [Google Scholar] [CrossRef]
  25. Ma, Z.Z.; Yang, K.; Xiao, C.L.; Jia, L.C. Electrospun Bi-doped SnO2 porous nanosheets for highly sensitive nitric oxide detection. J. Hazard. Mater. 2021, 416, 126118. [Google Scholar] [CrossRef]
  26. Liu, J.S.; Song, B.Y.; Huang, J.; Deng, Z.P.; Zhang, X.F.; Xu, Y.M.; Huo, L.H.; Gao, S. Absorbent cotton derived mesoporous CeO2 hollow tubule for enhanced detection of p-xylene at low energy consumption. J. Hazard. Mater. 2021, 873, 159774. [Google Scholar] [CrossRef]
  27. Bi, H.; Zhang, L.X.; Xing, Y.; Zhang, P.; Chen, J.J.; Yin, J.; Bie, L.J. Morphology-controlled synthesis of CeO2 nanocrystals and their facet-dependent gas sensing properties. Sens. Actuators B 2021, 330, 129374. [Google Scholar] [CrossRef]
  28. Tammanoon, N.; Wisitsoraat, A.; Tuantranont, A.; Liewhiran, C. Flame-made Zn-substituted SnO2 nanoparticulate compound for ultra-sensitive formic acid gas sensing. J. Alloys Compd. 2021, 871, 159547. [Google Scholar] [CrossRef]
  29. Zito, C.A.; Perfecto, T.M.; Dippel, A.C.; Volanti, D.P.; Koziej, D. Low-temperature carbon dioxide gas sensor based on yolk−shell ceria nanospheres. ACS Appl. Mater. Interfaces 2020, 12, 17745–17751. [Google Scholar] [CrossRef]
  30. Oosthuizen, D.N.; Motaung, D.E.; Swart, H.C. Gas sensors based on CeO2 nanoparticles prepared by chemical precipitation method and their temperature-dependent selectivity towards H2S and NO2 gases. Appl. Surf. Sci. 2020, 505, 144356. [Google Scholar] [CrossRef]
  31. Li, Q.Y.; Huang, N.; Cui, Y.H.; Lin, J.S.; Zhao, C.; Ding, L. Synthesis of porous rod-like In2O3 nanomaterials and its selective detection of NO at room temperature. J. Alloys Compd. 2022, 902, 163632. [Google Scholar] [CrossRef]
  32. Choi, M.S.; Mirzaei, A.; Na, H.G.; Kim, S.; Kim, D.E.; Lee, K.H.; Jin, C.; Choi, S.W. Facile and fast decoration of SnO2 nanowires with Pd embedded SnO2-x nanoparticles for selective NO2 gas sensing. Sens. Actuators B 2021, 340, 129984. [Google Scholar] [CrossRef]
  33. Lv, Y.K.; Li, Y.Y.; Yao, H.C.; Li, Z.J. Nitrogen-doped graphene quantum dots-modified mesoporous SnO2 hierarchical hollow cubes for low temperature detection of nitrogen dioxide. Sens. Actuators B 2021, 339, 129882. [Google Scholar] [CrossRef]
  34. Zhou, S.Q.; Lu, Q.J.; Chen, M.P.; Li, B.; Wei, H.T.; Zi, B.Y.; Zeng, J.Y.; Zhang, Y.M.; Zhang, J.; Zhu, Z.Q.; et al. Platinum-supported cerium-doped indium oxide for highly sensitive triethylamine gas sensing with good antihumidity. ACS Appl. Mater. Interfaces 2020, 12, 42962–42970. [Google Scholar] [CrossRef]
  35. Sun, Y.J.; Zhao, Z.T.; Zhou, R.; Li, P.W.; Zhang, W.D.; Suematsu, K.; Hu, J. Synthesis of In2O3 nanocubes, nanocube clusters, and nanocubes-embedded Au nanoparticles for conductometric CO sensors. Sens. Actuators B 2021, 345, 130433. [Google Scholar] [CrossRef]
  36. Luo, Y.B.; An, B.X.; Bai, J.L.; Wang, Y.R.; Cheng, X.; Wang, Q.; Li, J.P.; Yang, Y.F.; Wu, Z.K.; Xie, E. Ultrahigh-response hydrogen sensor based on PdO/NiO co-doped In2O3 nanotubes. J. Colloid Interface Sci. 2021, 599, 533–542. [Google Scholar] [CrossRef]
  37. Li, H.K.; Yang, Z.Y.; Ling, W.Y.; Zhu, D.C.; Pu, Y. UV excited gas sensing SnO2-ZnO aerogels to ppb-level ethanol detection. Sens. Actuators B 2021, 337, 129815. [Google Scholar] [CrossRef]
  38. Haldar, T.; Kumar, U.; Yadav, B.C.; Kumar, V.V.R.K. Hierarchical flower-like Bi2SiO5/MWCNT nanocomposites for highly sensitive LPG sensor at room temperature. J. Alloys Compd. 2021, 856, 158157. [Google Scholar] [CrossRef]
  39. Phuoc, P.H.; Viet, N.N.; Thong, L.V.; Hung, C.M.; Hoa, N.D.; Duy, N.V.; Hong, H.S.; Hieu, N.V. Comparative study on the gas-sensing performance of ZnO/SnO2 external and ZnO-SnO2 internal heterojunctions for ppb H2S and NO2 gases detection. Sens. Actuators B 2021, 334, 129606. [Google Scholar] [CrossRef]
  40. Liu, J.; Dai, M.; Wang, T.; Sun, P.; Liang, X.; Lu, G.; Shimanoe, K.; Yamazoe, N. Enhanced gas sensing properties of SnO2 hollow spheres decorated with CeO2 nanoparticles heterostructure composite materials. ACS Appl. Mater. Interfaces 2016, 8, 6669–6677. [Google Scholar] [CrossRef]
  41. Liu, Z.C.; Gui, Y.G.; Xu, L.G.; Chen, X.P. Adsorption and sensing performances of transition metal (Ag, Pd, Pt, Rh, and Ru) modified WSe2 monolayer upon SF6 decomposition gases (SOF2 and SO2F2). Appl. Surf. Sci. 2022, 581, 152365. [Google Scholar] [CrossRef]
  42. Haq, M.; Din, S.U.; Baohui, D.; Khan, S.; Zhu, L.P. Low-Temperature Detection of Sulfur-Hexafluoride Decomposition Products Using Octahedral Co3O4-Modified NiSnO3 Nanofibers. ACS Appl. Mater. Interfaces 2022, 14, 9292–9306. [Google Scholar] [CrossRef] [PubMed]
  43. Shakeel, A.; Rizwan, K.; Farooq, U.; Iqbal, S.; Altaf, A.A. Advanced polymeric/inorganic nanohybrids: An integrated platform for gas sensing applications. Chemosphere 2022, 294, 133772. [Google Scholar] [CrossRef]
  44. Yang, Z.M.; Zhang, D.Z.; Wang, D.Y. Carbon monoxide gas sensing properties of metal-organic frameworks-derived tin dioxide nanoparticles/molybdenum diselenide nanoflowers. Sens. Actuators B 2020, 304, 127369. [Google Scholar] [CrossRef]
  45. Hu, J.; Sun, Y.J.; Xue, Y.; Zhang, M.; Li, P.W.; Lian, K.; Zhuiykov, S.; Zhang, W.D.; Chen, Y. Highly sensitive and ultra-fast gas sensor based on CeO2-loaded In2O3 hollow spheres for ppb-level hydrogen detection. Sens. Actuators B 2018, 257, 124–135. [Google Scholar] [CrossRef]
  46. Cheng, T.; Yang, W.M.; Hao, W.J.; Yang, Y.; Li, X.; Wei, T.H. A colorimetry-impedance dual-mode ceruloplasmin detection strategy based on dendritic mesoporous silicon nanoparticles with CeO2 encapsulation inside and horseradish peroxidase enrichment outside. Sens. Actuators B 2022, 355, 131312. [Google Scholar] [CrossRef]
  47. Gong, L.; Wang, X.; Zhang, D.; Ma, X.; Yu, S. Flexible wearable humidity sensor based on cerium oxide/graphitic carbon nitride nanocomposite self-powered by motion-driven alternator and its application for human physiological detection. J. Mater. Chem. A 2021, 9, 5619–5629. [Google Scholar] [CrossRef]
  48. Zhang, J.; Li, T.; Guo, J.; Hu, Y.; Zhang, D. Two-step hydrothermal fabrication of CeO2-loaded MoS2 nanoflowers for ethanol gas sensing application. Appl. Surf. Sci. 2021, 568, 150942. [Google Scholar] [CrossRef]
  49. Zhang, S.; Zheng, Y.K.; Song, P.; Sun, J.; Wang, Q. Enhanced trimethylamine gas-sensing performance of CeO2 nanoparticles-decorated MoO3 nanorods. J. Mater. Sci. Mater. Electron. 2022, 33, 3453–3464. [Google Scholar] [CrossRef]
  50. Bao, H.M.; Guo, Y.J.; Zhang, T.; Fu, H.; Zhu, S.Y.; Zhou, L.; Zhang, H.W.; Li, Y.; Cai, W.P. Microporous-ceria-wrapped gold nanoparticles for conductometric and SERS dual monitoring of hazardous gases at room temperature. Adv. Mater. Interfaces 2022, 9, 2102107. [Google Scholar] [CrossRef]
  51. Zhang, D.; Yang, Z.; Yu, S.; Mi, Q.; Pan, Q. Diversiform metal oxide-based hybrid nanostructure for gas sensing with versatile prospects. Coord. Chem. Rev. 2020, 413, 213272. [Google Scholar] [CrossRef]
  52. Mou, H.R.; Sun, Y.; Zeng, Z.G.; Zhao, H.B.; An, B.L.; Xu, J.Q.; Wang, X.H. Low-temperature hydrogen detection sensor based on CeO2-DOPED SnO2. J. Mater. Sci. Mater. Electron. 2020, 31, 15785–15793. [Google Scholar] [CrossRef]
Figure 1. Schematic preparation process of the SnO2/CeO2 composite.
Chemosensors 10 00497 g001
Figure 2. (a) XRD patterns of SnO2 and SnO2/CeO2 composites. XPS spectra of the SnO2/CeO2 composite: (b) Sn 3d, (c) Ce 3d, and (d) O 1s.
Chemosensors 10 00497 g002
Figure 3. SEM images of (a,b) SnO2 and (c,d) SnO2/CeO2 samples.
Chemosensors 10 00497 g003
Figure 4. TEM micrographs of (a,b) SnO2, (c,d) CeO2, and (e,f) SnO2/CeO2.
Chemosensors 10 00497 g004
Figure 5. Responses of sensors based on (a) pure SnO2 and (b) SnO2/CeO2 nanocomposite versus LPG concentration in the range of 500–5000 ppm. (c) Response vs. concentration of LPG. (d) Single transient response of pure SnO2 and SnO2/CeO2 nanocomposite.
Chemosensors 10 00497 g005
Figure 6. (a) Response vs. recovery time of the SnO2/CeO2 composite sensor. (b) Current–voltage curves of the SnO2 and SnO2/CeO2 composite sensors. (c) Reproducibility of the SnO2/CeO2 sensor toward 1000 and 3000 ppm LPG. (d) Long-term stability of the SnO2/CeO2 composite sensor upon exposure to 2000 ppm LPG.
Chemosensors 10 00497 g006
Figure 7. (a) The effect of relative humidity on the base resistance of the SnO2 and SnO2/CeO2 composite, and (b) the Ra-wet/Ra-dry values of the SnO2 and SnO2/CeO2 composite. (c) The effect of relative humidity on the response of the SnO2/CeO2 composite, and (d) the Sa-wet/Sa-dry values of the SnO2/CeO2 composite.
Chemosensors 10 00497 g007
Figure 8. Block diagram of the integrated circuit alarm system.
Chemosensors 10 00497 g008
Figure 9. Schematic of the LPG sensing mechanism for the SnO2/CeO2 sensor exposed to (a) air and (b) LPG. Energy band structure diagrams of the SnO2/CeO2 composite in (c) air and (d) LPG atmospheres.
Chemosensors 10 00497 g009
Publisher’s Note: MDPI stays neutral with regard to jurisdictional claims in published maps and institutional affiliations.

