Article

Catalyzed Hairpin Assembly-Assisted DNA Dendrimer Enhanced Fluorescence Anisotropy for MicroRNA Detection

1
Key Laboratory of Luminescence Analysis and Molecular Sensing (Southwest University), Ministry of Education, College of Chemistry and Chemical Engineering, Southwest University, Chongqing 400715, China
2
Key Laboratory of Luminescent and Real-Time Analytical Chemistry (Southwest University), Chongqing Science and Technology Bureau, College of Pharmaceutical Sciences, Southwest University, Chongqing 400715, China
*
Author to whom correspondence should be addressed.
These authors contributed equally to this work.
Chemosensors 2022, 10(12), 501; https://doi.org/10.3390/chemosensors10120501
Submission received: 23 October 2022 / Revised: 24 November 2022 / Accepted: 24 November 2022 / Published: 27 November 2022
(This article belongs to the Special Issue Nanoparticles in Chemical and Biological Sensing)

Abstract

:
Biomacromolecules have been employed successfully as fluorescence anisotropy (FA) amplifiers for biosensing in reported studies. However, the sensitivities of the traditional biomacromolecule amplified FA strategies need to be improved because of the relatively low molecular weight or volume of a single biomacromolecule and the 1:1 binding ratio between the fluorophore-linked probe and target. In this work, a DNA dendrimer with a high molecular weight and volume was employed as a new FA amplifier, which was coupled with target-catalyzed hairpin assembly (CHA) for the sensitive detection of miRNA-21. The fluorophore-modified probe DNA (pDNA) was fixed on the DNA dendrimer, resulting in a high FA value. The addition of miRNA-21 triggered the CHA process and produced plenty of H1-H2 hybrids. The complex of H1-H2 bound to the DNA dendrimer and released the pDNA through a toehold-mediated strand exchange reaction. Thus, a low FA value was obtained because of the low mass and volume of free pDNA. Based on the dramatically reduced FA, miRNA-21 was detected in the range of 1.0–19.0 nM and the limit of detection was 52.0 pM. In addition, our method has been successfully utilized for miRNA-21 detection in human serum. This strategy is sensitive and selective and is expected to be used to detect other biomolecules simply by changing the corresponding nucleic acid probe.

1. Introduction

Fluorescence anisotropy (FA) is an attractive, homogeneous and reproducible method for biosensing [1,2,3]. It is well known that FA values depend on the molecular volume (or molecular weight) [4,5] and solution viscosity [6] of fluorophores at constant temperature. In contrast to the fluorescence intensity signal, FA is a ratiometric measurement, which is not sensitive to fluorescence fluctuations and photobleaching, and is especially suitable for the detection of targets in complex samples [7]. Due to its advantages of high throughput and a rapid and sensitive response, FA is extensively used in studies of biomolecule interactions [8,9,10,11,12], enzyme activity [13,14] and other biosensing applications [15,16,17,18]. Since the FA value is proportional to the molecular volume and mass, a mass amplification strategy is usually adopted for signal amplification [12]. Until now, inorganic nanomaterials (such as graphene oxide [2,13,19,20] and noble metal nanoparticles [21,22,23]) and biomacromolecules (such as protein [12,24] and oligonucleotides [25,26,27,28]) have been widely employed as mass amplifiers for FA measurement. However, some inorganic nanomaterials have a strong fluorescence quenching effect through electron transfer [29,30,31] or via fluorescence resonance energy transfer (FRET) [32,33,34,35]. When the fluorescence is strongly quenched, the measurement of FA is easily affected by the light scattering phenomenon, and the FA value is usually larger than 0.4 [36]. In contrast, biomacromolecules have been used as FA mass amplification platforms because of their large mass without fluorescence quenching effect. Therefore, biomacromolecules have been employed as excellent FA mass amplifiers for biosensing [9,24,27,28,37]. However, in these methods, the detection sensitivity should be improved because a single biomacromolecule can only generate small change in molecular volume and mass [4,38]. In addition, in a traditional FA measurement, a target can only change the FA signal of one fluorescent group. Therefore, it is necessary to find a nanomaterial without fluorescence quenching and with excellent FA amplification ability to expand the use of the FA method.
In studies that have been reported, assembled structures of biomacromolecules, such as DNA [39], DNA-protein [12,40,41] and protein assembly structures [42,43] have attracted widespread attention. Benefiting from their facile synthesis, good biocompatibility, and extensive modifiability, biomolecular assemblies as novel functional materials have enabled a powerful platform for drug delivery [44,45,46], biosensing [47,48], and cancer therapy [39,49,50,51,52]. In contrast to conventional FA amplifiers, DNA dendrimers can serve as novel FA amplifiers due to their following amazing properties: first, DNA dendrimers do not quench the fluorescence of fluorophore through FRET, because they are composed of DNA and protein. In theory, the absorption spectra of DNA and protein are in the ultraviolet region, while the fluorescence spectra of common dyes are in the visible region, and there is no spectral overlap. Therefore, the use of DNA dendrimers can increase the accuracy of FA detection. Second, DNA dendrimers have large molecular masses and volumes, which greatly limit the rotational movements of fluorescent groups and result in a high FA signal, thus greatly improving detection sensitivity. Therefore, we utilized DNA dendrimers to enhance the FA signal to promote the detection sensitivity and accuracy in this work. In addition, an excellent signal amplification method called catalytic hairpin assembly (CHA) [53] was introduced into this FA detection system to achieve the target recovery to further improve the sensitivity. MicroRNA (miRNA) was used as the target to investigate the feasibility of this strategy. It is well known that MiRNAs can regulate cell growth and tissue differentiation, and are involved in growth, development, and disease [54,55,56]. Therefore, the detection of miRNA can provide essential information for disease diagnosis. Thus, in this work, we designed a novel CHA-assisted DNA dendrimer to enhance FA strategy for the detection of miRNA-21 with improved sensitivity and accuracy.

2. Materials and Methods

2.1. Chemicals and Apparatus

TAE buffer (50×), streptavidin (SA), RNase inhibitor, and diethypyrocarbonate (DEPC) water were ordered from Sangon Biotechnology Co., Ltd. (Shanghai, China). All DNA and RNA oligonucleotides were obtained from Sangon Biotechnology Co., Ltd. (Shanghai, China) with HPLC purification. The base sequences of the DNA and RNA oligonucleotides were given in Table S1. All DNA oligonucleotides were dissolved in 1× TAE buffer (10 mM Tris, 1 mM EDTA, pH 8.0) and stored at 4 °C refrigeration. Milli-Q ultrapure water (18.2 MΩ·cm) was used for the whole experiment. All solutions were mixed by a vortex mixer MX-E (Haimen, China). A thermomixer C (Eppendorf, Hamburg, Germany) was used for experiments that required temperature control. A UV-3010 spectrophotometer (Daojin, Kyoto, Japan) was used for measurement of the UV-vis absorption spectra. The excitation spectrum and emission spectrum were measured by an F-2500 fluorescence spectrophotometer (Hitachi, Tokyo, Japan). An S-4800 scanning electron microscope (SEM) (Hitachi, Japan) was utilized to characterize the as prepared mass amplification probes.

2.2. General Procedure

First, the DNA dendrimer-SA nanocomplex (DSN) was prepared according to a previously published method by the Liu group [57]. Table S2 lists the reagents used in the preparation of the DSN. To prepare the DNA dendrimer-SA-pDNA nanocomplex (DSPN), the pDNA was introduced into the solution containing the DSN and a suitable dose of RNase inhibitor with a reaction measurement time of 30 min at room temperature. DNA hairpins H1 and H2 were incubated at 95 °C for 5 min, respectively, and gradually cooled to room temperature. Then, H1, H2, and target miRNA were mixed in 1× TAE buffer with a reaction measurement time of 90 min at 25 °C. Finally, a mass amplifying probe was added, and the solution was provided a reaction measurement time of 150 min at room temperature. The fluorescence intensity of the mixture was measured by an F-2500 fluorescence spectrophotometer with a polarization filter to calculate the FA value.

3. Results and Discussion

3.1. Working Principle

The DNA dendrimer was fabricated according to a previously published report (Figure 1a) [57]. First, there were two double-stranded DNA (complex A and B) and two single-stranded DNA assistants (As-A and B). The complex A was formed by the hybridization of T1 and P1, and the complex B was formed by the hybridization of T2 and P2. After introducing the initiator, the self-assembly process began with the hybridization between the initiator and complex A. First, the As-A hybridized with P1 from complex A through a toehold-mediated strand displacement reaction (SDR). The newly formed initiator/T1 hybrid exposed two toehold domains and hybridized with two T2 that were released from the complex B after the hybridization between As-B and P2 by toehold-mediated SDR, resulting in the formation of a branched DNA nanostructure with the same two arms that have the same sequences as the initiator. Therefore, the two arms would induce a new round of the toehold-mediated SDR. As the cycle increased, the DNA dendrimer was created. As SA has four sites that can bind to four biotin-modified DNA strands, the biotin-modified linker DNA that could be hybridized with the arm DNA and SA was added to the DNA dendrimer to form the DNA dendrimer-SA-linker DNA complex. Then, the TAMRA-modified probe DNA (pDNA) was added and hybridized with the linker DNA to form the DNA dendrimer-SA-pDNA complex (DSPN).
The principle of miRNA-21 detection is shown in Figure 1b. In this reaction, the CHA system was composed of two complementary hairpin structures, H1 and H2. Since a hairpin structure is characterized by intramolecular hybridization, H1 and H2 could not dynamically hybridize spontaneously. Before the addition of miRNA-21, both H1 and H2 maintained their hairpin structures in the solution and could not hybridize with the pDNA on the surface of the DSPN. Hence, a high FA was observed because the rotation of TAMRA on the pDNA was limited by the DSPN which had a large mass and volume. In the presence of miRNA-21, miRNA-21 could hybridize with H1. Thus, the stem of H1 was opened and the stem sequence was exposed, which hybridized with H2. After the formation of H1-H2 complex, miRNA-21 was released which triggered the next round of reactions between H1 and H2. At the same time, the formed H1-H2 duplex reacted with the mass amplifying probe DSPN by the toehold-mediated strand exchange reaction. Due to the formation of H1-H2-DSN complex, the pDNA was released, resulting in the reduced FA. Therefore, miRNA-21 was detected sensitively by the significantly decreased FA.

3.2. Feasibility Study

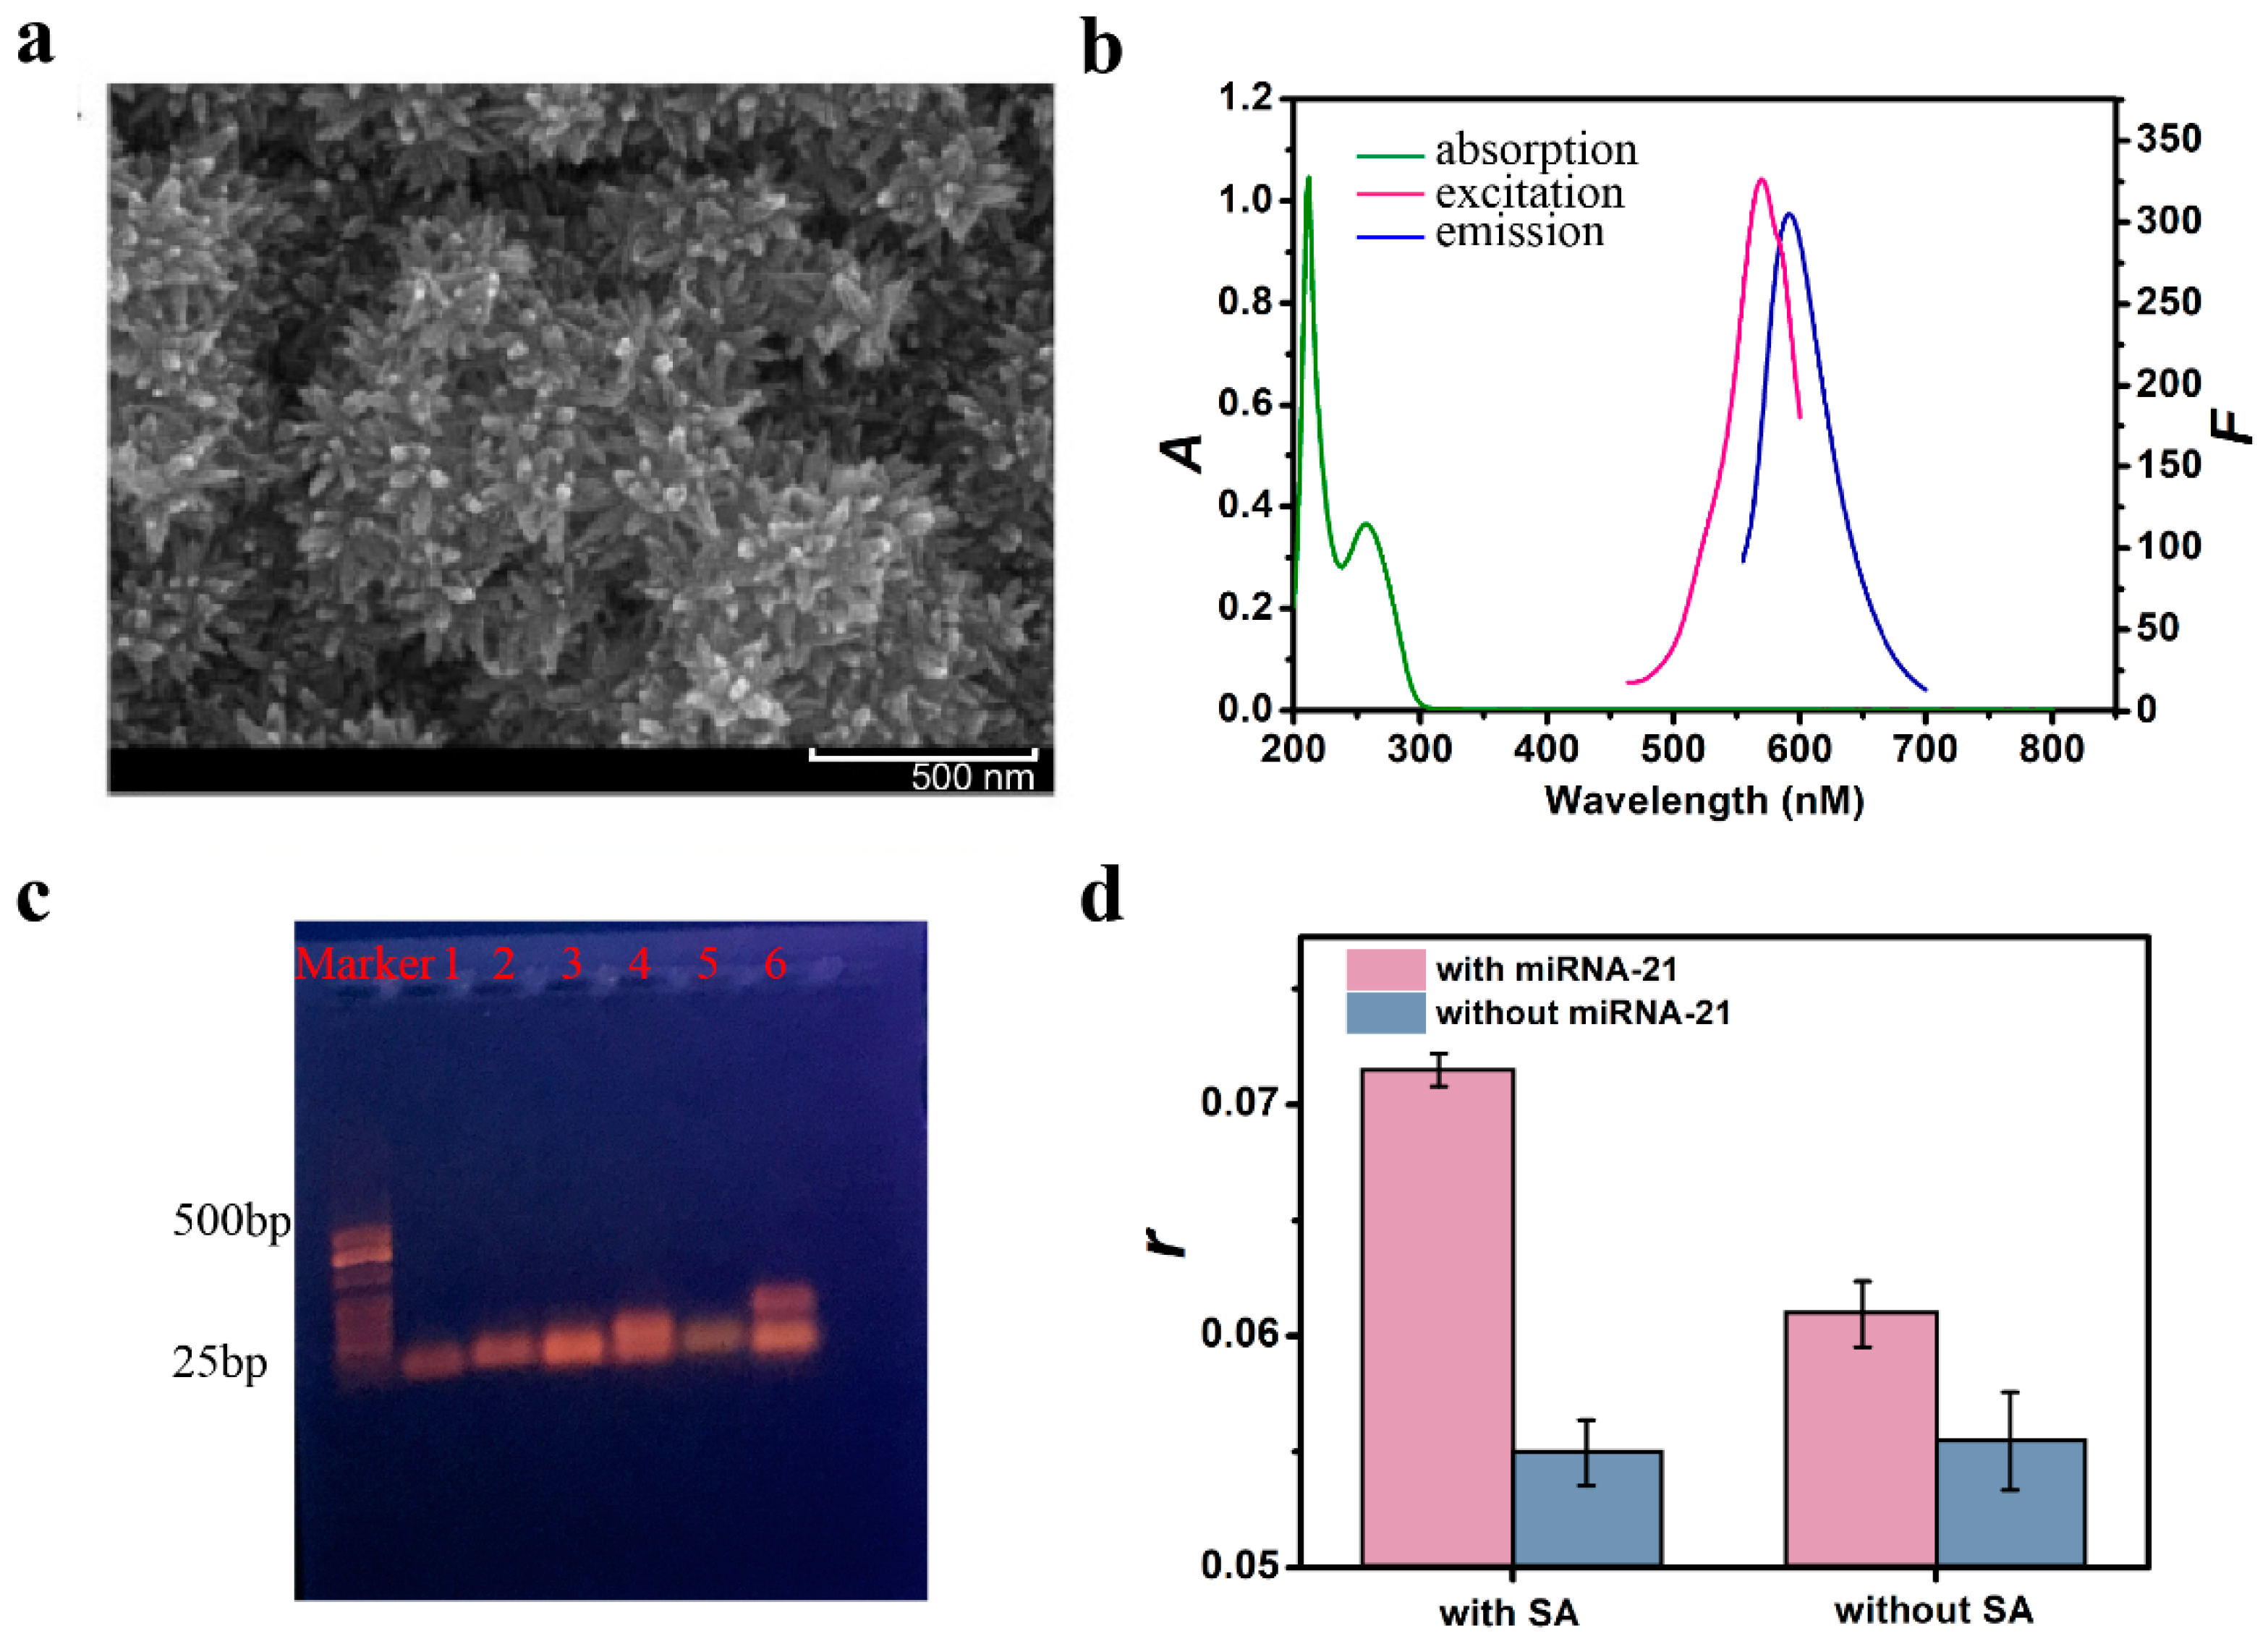
First, the scanning electron microscope (SEM) images (Figure 2a) showed that the size of the DSPN was about 300 nm, indicating that the DSPNs were synthesized successfully. To explore whether the DSNs would affect the fluorescence of the fluorophore, the spectral characteristics of the DSNs were measured. The absorption peak of the DSNs was generally shorter than 300 nm and almost no absorption peak longer than 300 nm was observed (Figure 2b). In contrast, the emission peak of TAMRA-conjugated DNA was mainly between 570 nm and 700 nm. There was almost no spectral overlap between the absorption spectra of the DSNs and the emission spectra of TAMRA-conjugated DNA. Therefore, the DSNs could not quench the fluorescence of TAMRA through FRET, which effectively ensured that the obtained FA values were accurate.
Next, to verify the occurrence of the CHA process, a 1.5% agarose gel electrophoresis was conducted. As shown in Figure 2c, before the addition of miRNA-21, only one mixed band of H1 and H2 could be observed, indicating that the CHA process did not occur (lane 3). In contrast, after the addition of miRNA-21, a new band (the H1-H2 complex) appeared (lane 4), confirming that miRNA-21 successfully induced the CHA reaction. Furthermore, to explore the signal amplification ability of CHA, we compared the FA value with and without the CHA amplification reaction (the method without CHA was depicted in Figure S1, Supplementary Materials). As shown in Figure S2, the decreased FA values induced by miRNA-21 in the absence of CHA were much lower than those in the presence of CHA, confirming that CHA could improve the sensitivity of miRNA-21 detection significantly.
To study the FA enhancement ability of the DSPNs, we compared the FA values with and without SA. As shown in Figure 2d, in the absence of SA, DSPNs could not assemble to form larger complexes, inducing a lower FA value. In the presence of SA, each SA molecule bound four biotin molecules. Thus, DSPNs continuously assembled to form larger complexes, resulting in higher FA value. These results demonstrated that the proposed method had good accuracy and sensitivity for miRNA-21 detection.

3.3. Optimal Conditions

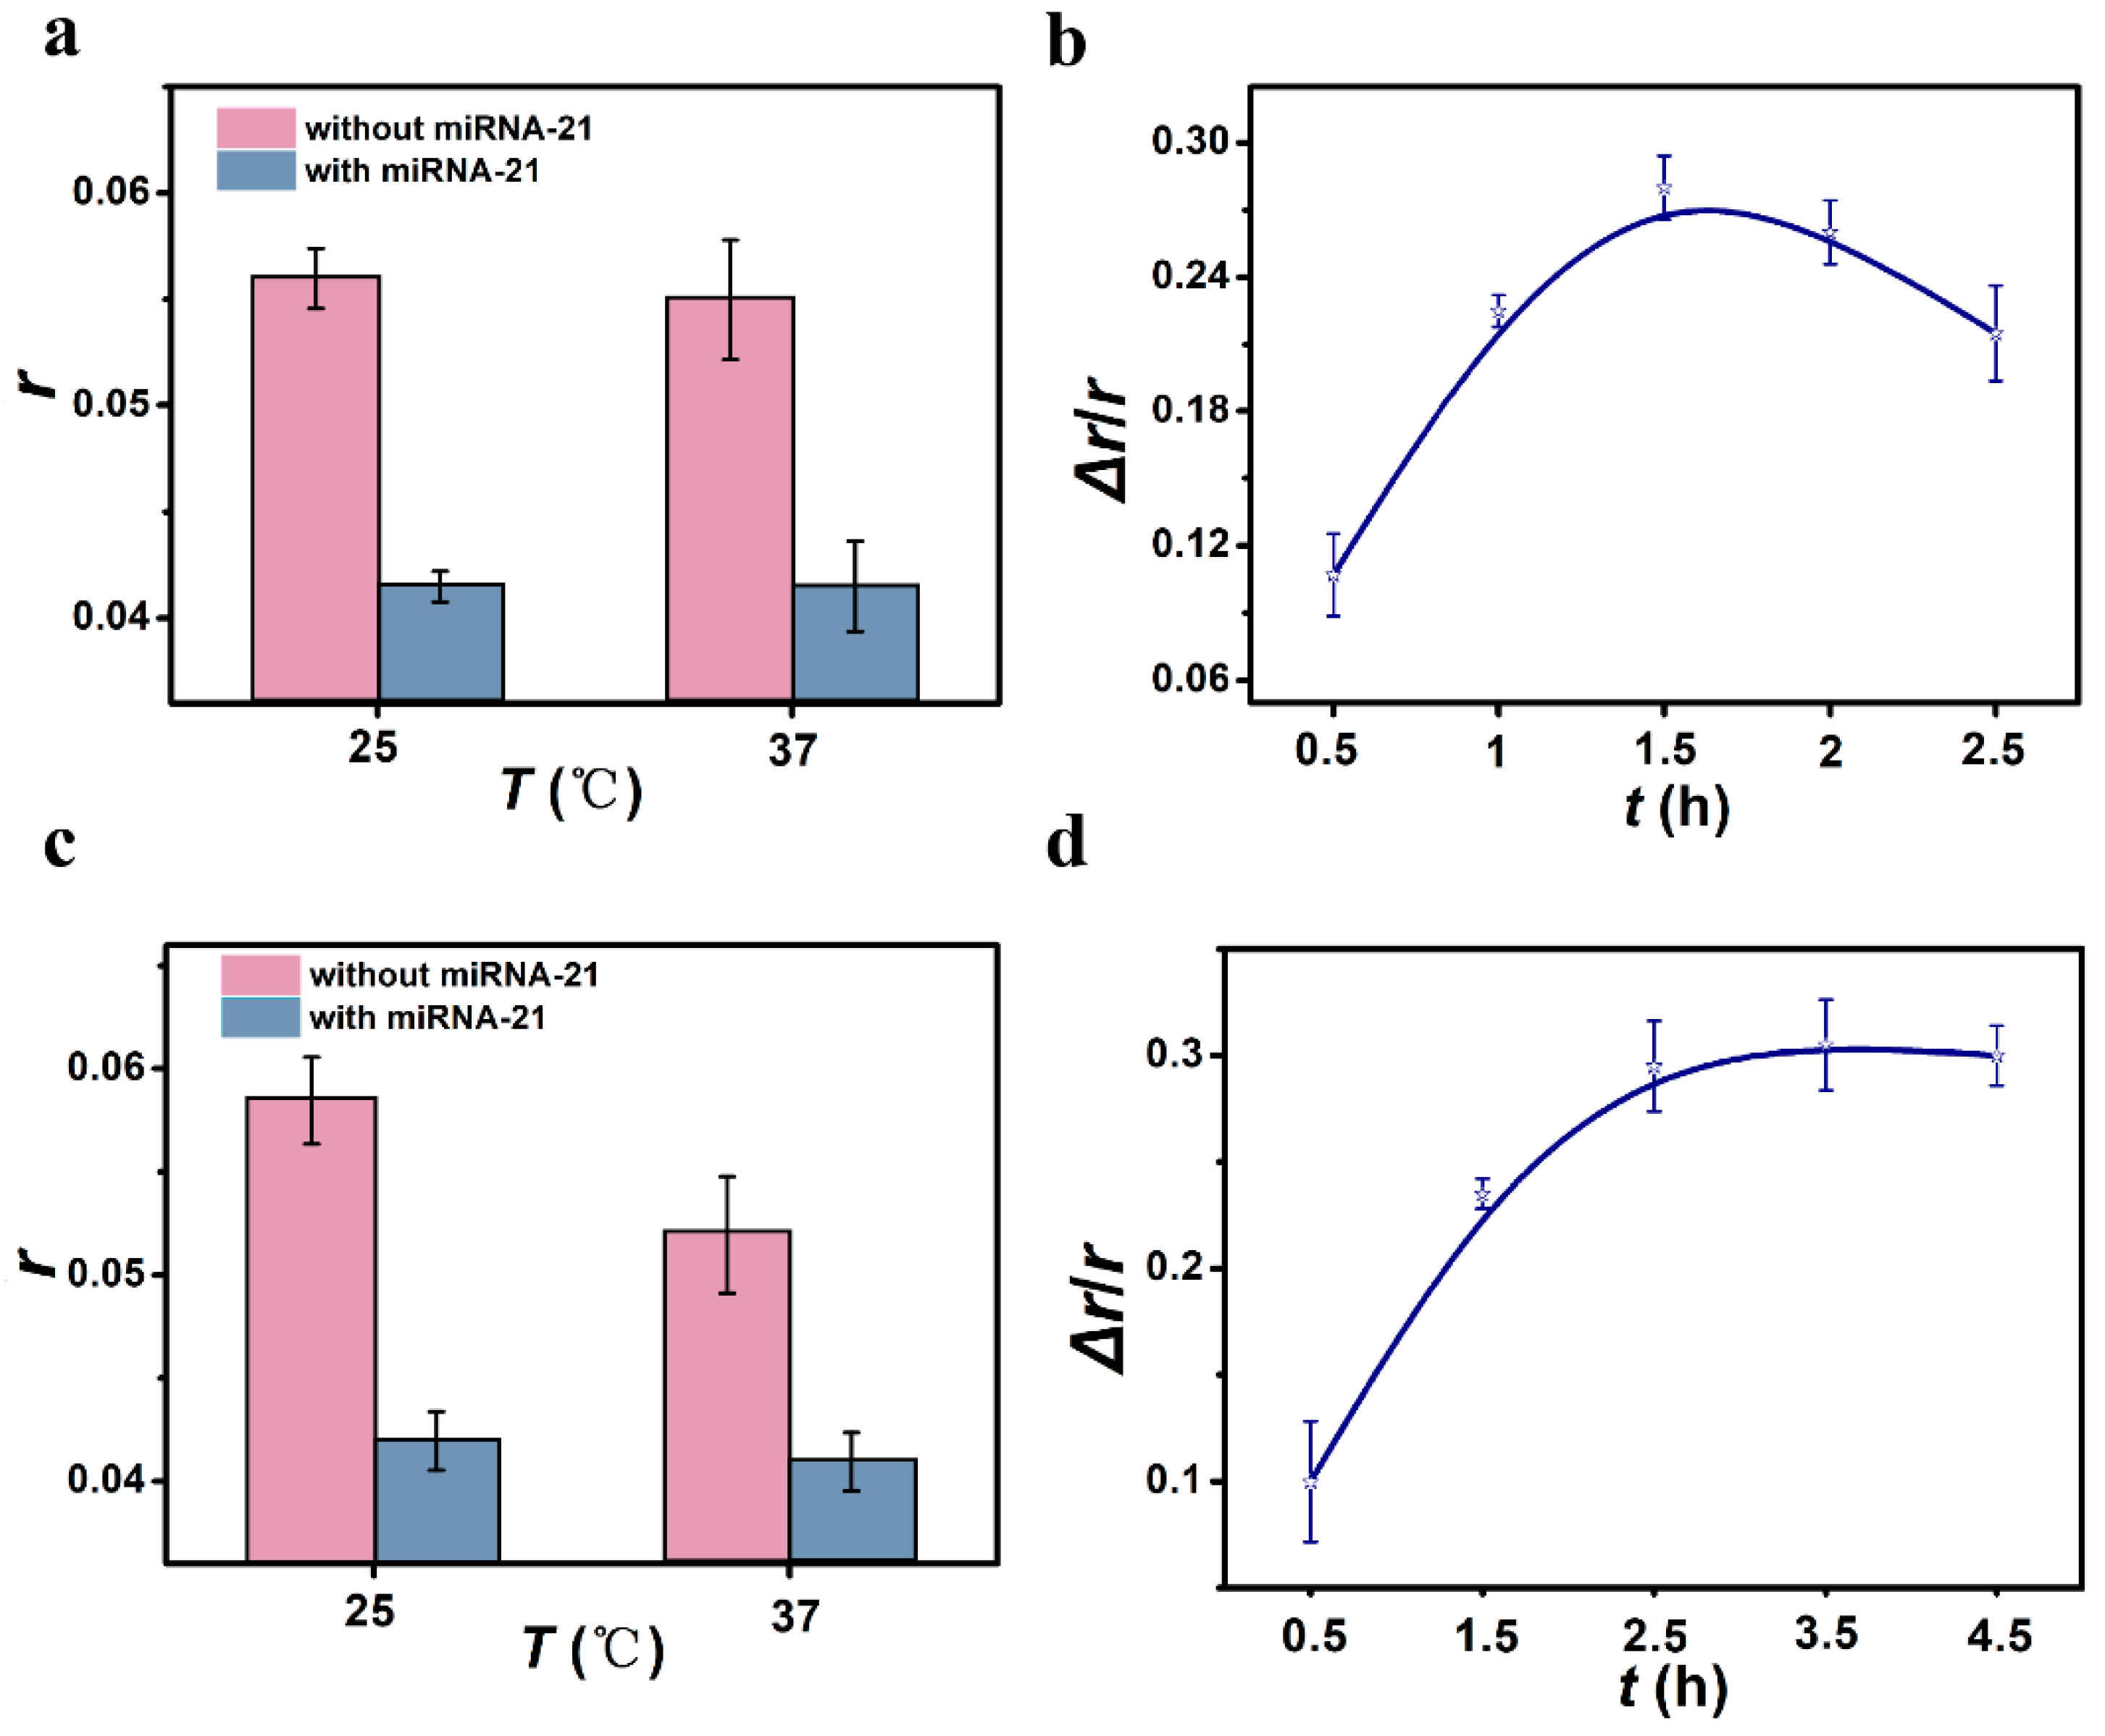
We first tested the FA value at different concentrations of DSNs. The FA value first increased and then decreased with the increased concentration of the DSNs (Figure S3a), and 1× DSN was selected for further experiments. Next, the influence of the concentration ratio of SA and the linker on the detection signal were investigated (Figure S3b). When the concentration ratio of SA to the linker was too high, most of the SA-linker would not participate in the assembly of the dendrimer, and the quality of the formed SA-linker probe mass probe was not sufficient to obtain a high FA signal. However, if the concentration of SA to the linker was too low, then there were many free probes in the solution, which resulted in a small change of FA. When the concentration ratio of SA to the linker was 1:2, Δr/rr = r0-r, where r0 and r were the FA values before and after the addition of miRNA-21, respectively,) at maximum. Then, the influence of the concentration ratio of the linker and probe on the detection signal were tested (Figure S3c). When the concentration ratio of the linker and probe was either too small or too large, there was a low FA value. When the concentration of the linker was much higher than that of the probe, there were redundant linkers and the target was preferentially attached to them rather than releasing the probe, thus inducing a low FA value. When the concentration of the probe was too high, a large amount of free probe would produce a low FA value. When the concentration ratio of the linker and probe was 2:1, Δr/r was highest. Then, the concentration ratio of the dendrimer was studied (Figure S3d) and 1× dendrimer was chosen as the optimal concentration. Next, the incubation temperature and time for the FA assay were examined. We chose two temperatures, 25 °C and 37 °C, for optimization, and a reaction time from 0.5 to 4.5 h for optimization. The results demonstrated that 25 °C for 1.5 h were the optimal conditions for the CHA reaction (Figure 3a,b). The optimal temperature and time for the reaction between the DSPNs and miRNA21 were 25 °C for 2.5 h (Figure 3c,d). The number of toehold base domains (N) on H1 determines the efficiency of CHA, so it was necessary to further optimize the number of N on H1. Five pairs of H1 and H2 (H1, H2; H1-1, H2-1; H1-2, H2-2; H1-3, H2-3; and H1-4, H2-4; shown in Table S1) were designed, in which the numbers of toehold base domains were 8, 4, 6, 10 and 12, respectively. When N was small, the hybridization between H1 and miRNA-21 was not sufficiently stable. Even if miRNA-21 was present, H1 could not be turned on easily. The pDNA in the DSPNs could not be released, inducing a low signal. If N was too large, H1 also hybridized with H2 even in the absence of miRNA-21, and the pDNA in the DSPNs was released which also led to a low Δr. Experimental results showed that the highest Δr was obtained when N was 8 (Figure S4). In addition, when the length of the T spacer was short, it was difficult for the pDNA to fix to the DSN surface, and a low FA was observed. However, if the length of the T spacer was too long, the TAMRA on pDNA was far away from the DSPN, and there was a single strand of DNA between TAMRA and the DSPN. The flexibility of the single strand of DNA made TAMRA less restricted by rotational motion, producing a decreased FA value. According to the experimental results, the optimal number of T bases of the spacer was 5 (Figure S5).

3.4. The Sensitivity and Specificity of the Strategy

In order to verify whether this method could be used for the quantitative detection of miRNA-21, Δr/r after the addition of miRNA-21 at different concentrations was measured at the optimal conditions. It was found that there was a good linear relationship between Δr/r and the concentration of miRNA-21 in the range of 1.0 nM to 19.0 nM (Figure 4a). The linear equation was Δr/r = 0.027c + 0.020 (R2 = 0.991), where c is the concentration of miRNA-21 (nM). The limit of detection (LOD, 3σ) was determined to be 52.0 pM, which was comparable to or lower than that of the reported fluorescent [58,59,60], colorimetric [61,62], electrochemical [63], lateral flow [64,65] and other methods [66,67,68] (Table S3). In addition, the Δr/r values at different concentrations of miRNA-21 without CHA amplification were also measured. It was found that as the miRNA-21 concentration increased from 10.0 nM to 50.0 nM, Δr/r increased continuously (Figure 4b). The Δr/r and miRNA-21 concentrations satisfied the linear equation: Δr/r = 0.0055c + 0.0054 (R2 = 0.990). The LOD (3σ) was calculated to be 7.3 nM. These results indicate that the sensitivity was improved about 4.9 times and the LOD was reduced approximately 140 times by CHA.
Then, we investigated the specificity of this method. The Δr/r signals after the addition of a one-base-mismatched RNA (mis-1), two-base-mismatched RNA (mis-2), four-base-mismatched RNA (mis-4), and miRNA-145 were compared with that induced by miRNA at the same concentrations. As shown in Figure 4c, only after the addition of miRNA-21 was a strong Δr/r signal obtained. The addition of RNAs with mismatched bases and miRNA-145 resulted in a small Δr/r. Even with the addition of mis-1, the Δr/r was only about 1/6 of that after the addition of miRNA-21. Thus, this method has good selectivity. Interestingly, in the absence of CHA, Δr/r increased slightly with the addition of RNAs with mismatched bases and miRNA-145 (Figure 4d). This result shows that the specificity of the method without CHA is significantly poorer than that with CHA. It was believed that only in the presence of miRNA-21 could H1 and H2 hybridize effectively, resulting in large Δr/r value. Therefore, CHA further improved the specificity of miRNA-21 detection.

3.5. Detection of miRNA-21 in Human Serum

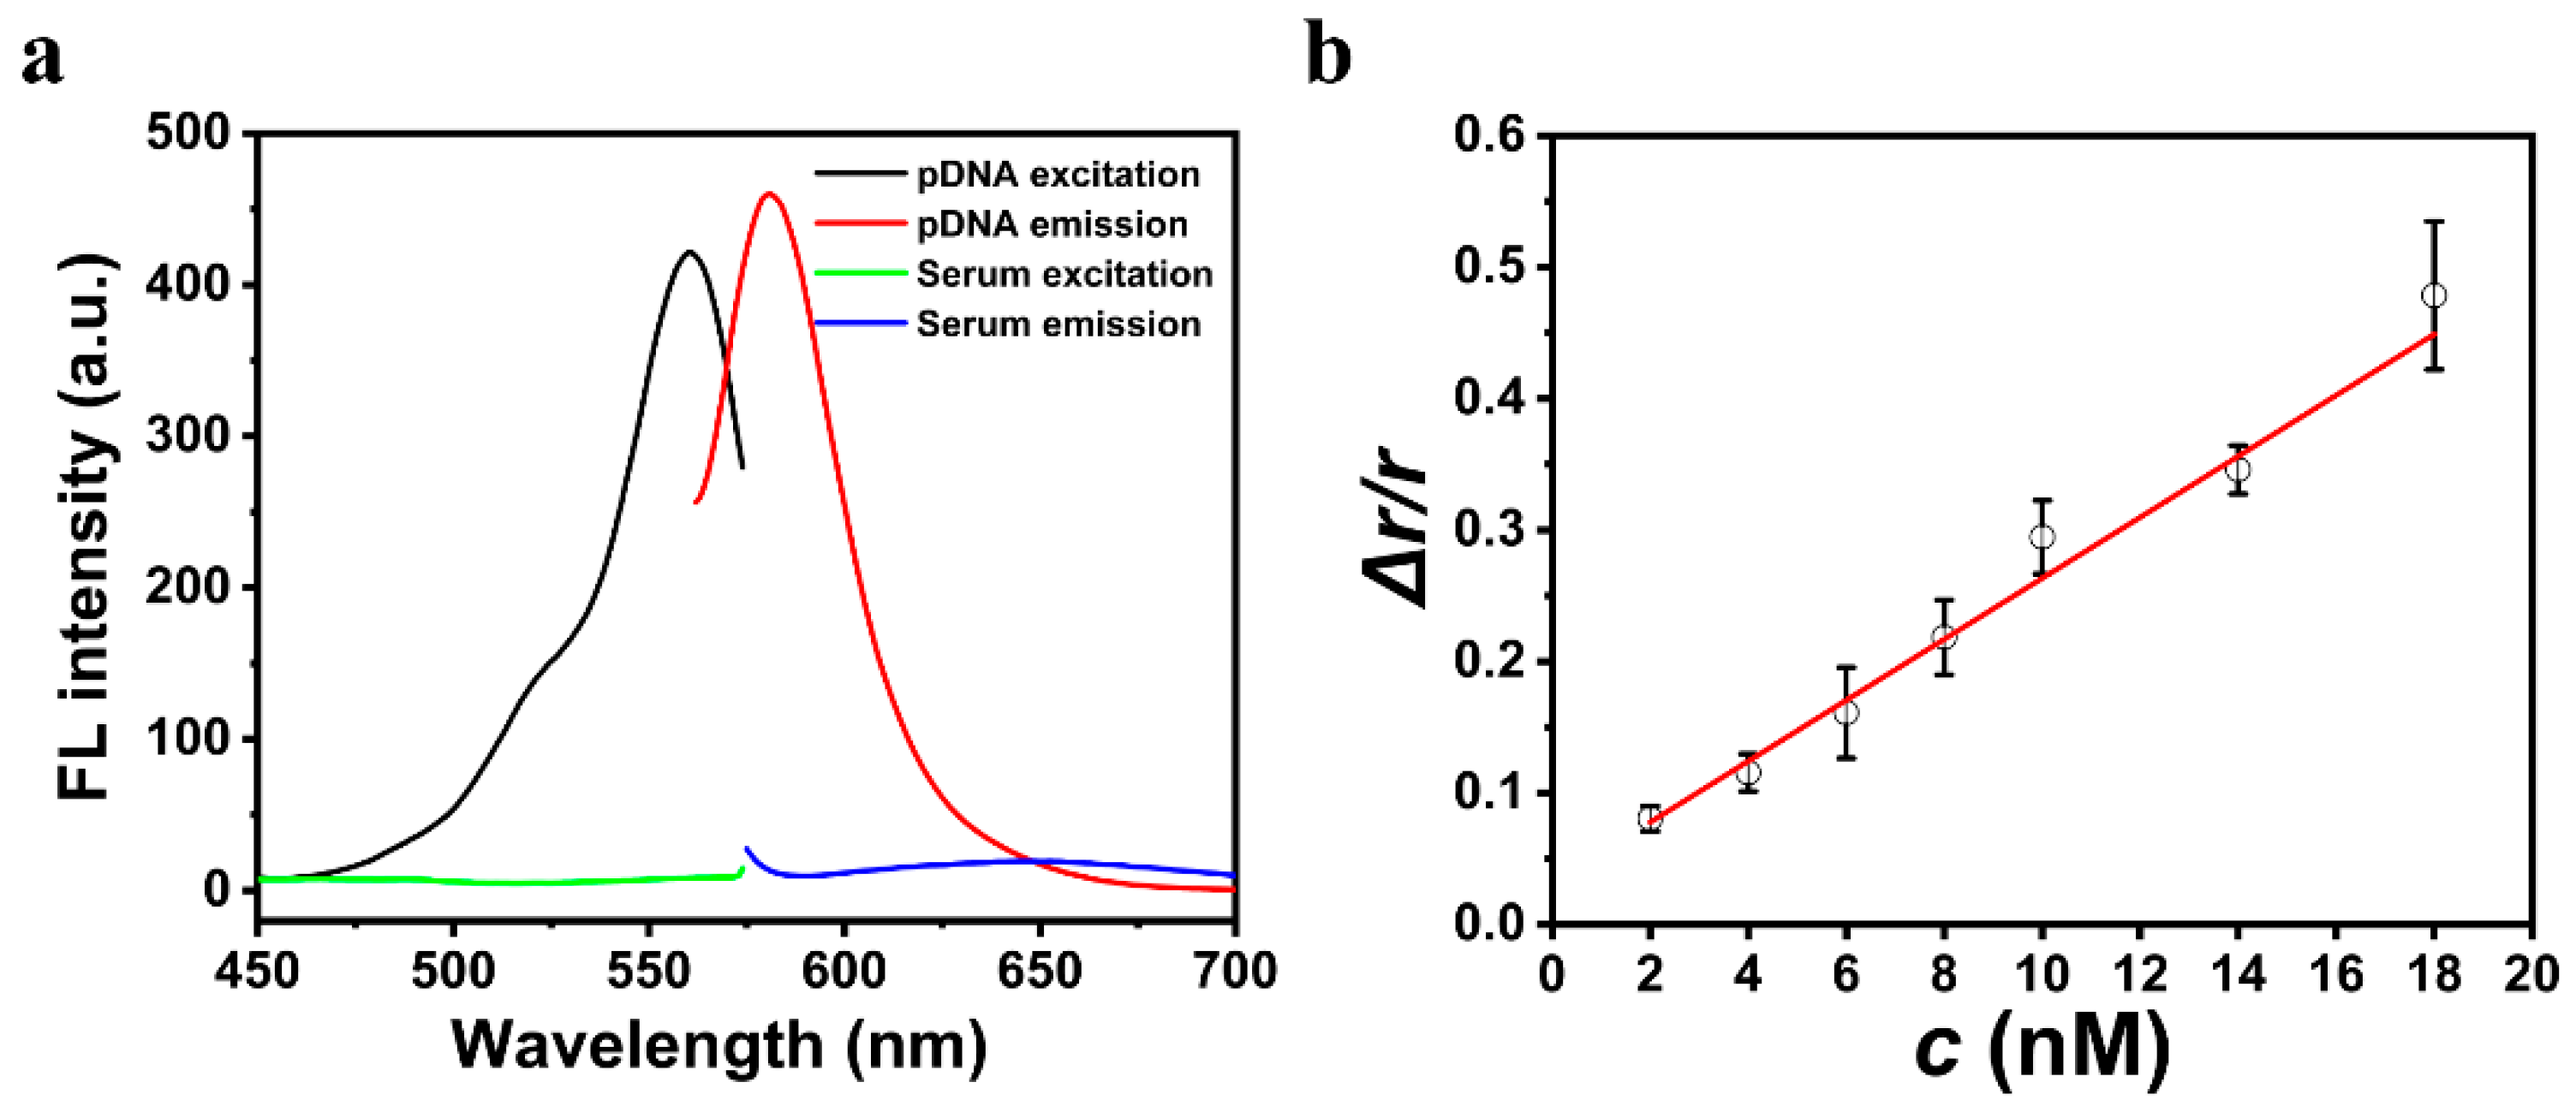
In order to explore whether this method could be used for miRNA-21 detection in human serum, we first investigated whether substances in human serum affected the fluorescence of TAMRA on the pDNA. The excitation and emission spectra of the pDNA and 1% human serum were measured. As can be seen from Figure 5a, there was no significant overlap between the fluorescent spectrum of pDNA and the 1% human serum. Therefore, the substances in human serum did not influence the florescence of TAMRA.
Next, miRNA-21 with different concentrations were added to the human serum and detected by our method. A linear increase in Δr/r was observed when the concentration of miRNA-21 in human serum increased from 2.0 to 18.0 nM (Figure 5b), which satisfied the linear equation: Δr/r = 0.023c + 0.03 (R2 = 0.991), where c is the concentration of miRNA-21 in human serum. The LOD (3σ) was estimated to be 50.0 pM. Therefore, the proposed method could be employed for miRNA-21 detection in human serum.
At the same time, a spike-and-recovery experiment was further carried out. The spiked recoveries of miRNA-21 in human serum were in a range of 90.2 to 119.5% based on the linear equation of the standard diluent (Table 1), and in a range of 91.8 to 125.2% based on the linear equation of the human serum (Table S4). The relative standard deviations (RSDs) were from 0.9 to 5.4%. These results indicate that human serum contains some components that have a bit of influence on detection. Therefore, future work is needed to eliminate the interference effect of the components in human serum.

4. Conclusions

In conclusion, a novel CHA-assisted DNA dendrimer amplified FA strategy was developed for miRNA-21 detection with high sensitivity and selectivity. There are certain advantages of this method. For instance, the DNA dendrimer did not quench the fluorescence of dye on the pDNA, which ensured the accuracy of detection. The DNA dendrimer also has a large molecular mass and volume that limits the rotational motion of TAMRA, which greatly improved the detection sensitivity. In addition, the introduction of the CHA process accomplished the cycle signal amplification, which further improved the sensitivity. Furthermore, this strategy was successfully utilized for the detection of miRNA-21 in human serum samples. In addition, the base sequence of hairpin H1 can be modified for different targets to expand the application range of this strategy. It is believed that this method can potentially be applied in biomedical studies and disease diagnosis routinely.

Supplementary Materials

The following supporting information can be downloaded at: https://www.mdpi.com/article/10.3390/chemosensors10120501/s1, Figure S1: Schematic illustration of DNA dendrimer enhanced FA for miRNA-21 detection without CHA; Figure S2: Function of CHA; Figure S3: Optimization of experimental conditions; Figure S4: FA (r) in the absence and presence of the miRNA-21 with different bases number (NH) of toehold domain of H1; Figure S5: FA (r) in the absence and presence of the miRNA-21 with different bases number (NT) of T spacer on linker DNA; Table S1: Oligonucleotides Sequence Used in this Study; Table S2: The reagents used in preparation of the DSN; Table S3: Comparison of different sensors for miRNA-21 assay.

Author Contributions

Investigation, Data curation, Validation, Formal analysis, Writing—original draft, T.X.; Investigation, Methodology, Writing—original draft, Writing—review & editing, Y.L. (Yuxin Liu); Validation, Formal analysis, J.X., Y.L. (Yujie Luo) and K.M.; Writing—review & editing, C.H. and Y.L. (Yuanfang Li); Methodology, Funding acquisition, Writing—review & editing, Supervision, S.Z. All authors have read and agreed to the published version of the manuscript.

Funding

This research was funded by the National Natural Science Foundation of China (No. 21974109), the Natural Science Foundation of Chongqing (No. CSTB2022NSCQ-MSX1662) and Fundamental Research Funds for the Central Universities (XDJK2019TY003).

Institutional Review Board Statement

Not applicable.

Informed Consent Statement

Not applicable.

Data Availability Statement

Not applicable.

Acknowledgments

The authors would like to thank the Luminescence Analysis and Molecular Sensing (Southwest University) at Chongqing for supporting this research and providing the appropriate research environment.

Conflicts of Interest

The authors declare no conflict of interest.

References

  1. Jameson, D.M.; Ross, J.A. Fluorescence Polarization/Anisotropy in Diagnostics and Imaging. Chem. Rev. 2010, 110, 2685–2708. [Google Scholar] [CrossRef] [PubMed] [Green Version]
  2. Xiao, X.; Li, Y.F.; Huang, C.Z.; Zhen, S.J. A novel graphene oxide amplified fluorescence anisotropy assay with improved accuracy and sensitivity. Chem. Commun. 2015, 51, 16080–16083. [Google Scholar] [CrossRef] [PubMed]
  3. Chen, J.; Liu, J.; Chen, X.; Qiu, H. Recent progress in nanomaterial-enhanced fluorescence polarization/anisotropy sensors. Chin. Chem. Lett. 2019, 30, 1575–1580. [Google Scholar] [CrossRef]
  4. Cui, L.; Zou, Y.; Lin, N.; Zhu, Z.; Jenkins, G.; Yang, C.J. Mass Amplifying Probe for Sensitive Fluorescence Anisotropy Detection of Small Molecules in Complex Biological Samples. Anal. Chem. 2012, 84, 5535–5541. [Google Scholar] [CrossRef] [PubMed]
  5. Kang, L.; Yang, B.; Zhang, X.; Cui, L.; Meng, H.; Mei, L.; Wu, C.; Ren, S.; Tan, W. Enzymatic cleavage and mass amplification strategy for small molecule detection using aptamer-based fluorescence polarization biosensor. Anal. Chim. Acta 2015, 879, 91–96. [Google Scholar] [CrossRef] [PubMed]
  6. Hutchinson, R.B.; Chen, X.; Zhou, N.; Cavagnero, S. Fluorescence Anisotropy Decays and Microscale-Volume Viscometry Reveal the Compaction of Ribosome-Bound Nascent Proteins. J. Phys. Chem. B 2021, 125, 6543–6558. [Google Scholar] [CrossRef] [PubMed]
  7. Zhao, Q.; Tao, J.; Uppal, J.S.; Peng, H.; Wang, H.; Le, X.C. Nucleic acid aptamers improving fluorescence anisotropy and fluorescence polarization assays for small molecules. Trends Analyt. Chem. 2019, 110, 401–409. [Google Scholar] [CrossRef]
  8. Chaudhary, A.; Schneitz, K. Using Steady-State Fluorescence Anisotropy to Study Protein Clustering. Methods Mol. Biol. 2022, 2457, 253–260. [Google Scholar] [PubMed]
  9. Li, Y.; Sun, Y.; Ye, J.; Pan, F.; Peng, B.; Li, H.; Zhang, M.; Xu, Y. Sensitive and selective detection of microRNA in complex biological samples based on protein-enhanced fluorescence anisotropy. Anal. Methods 2020, 12, 687–692. [Google Scholar] [CrossRef]
  10. Yoo, H.; Drummond, D.A. Using fluorescence anisotropy to monitor chaperone dispersal of RNA-binding protein condensates. STAR Protoc. 2022, 3, 101409. [Google Scholar] [CrossRef] [PubMed]
  11. Li, Y.; Zhang, N.; Wang, H.; Zhao, Q. Fluorescence Anisotropy-Based Signal-Off and Signal-On Aptamer Assays Using Lissamine Rhodamine B as a Label for Ochratoxin, A. J. Agric. Food Chem. 2020, 68, 4277–4283. [Google Scholar] [CrossRef] [PubMed]
  12. Liu, Y.X.; Xie, T.J.; Li, C.H.; Ye, Q.C.; Tian, L.L.; Li, Y.F.; Huang, C.Z.; Zhen, S.J. A crosslinked submicro-hydrogel formed by DNA circuit-driven protein aggregation amplified fluorescence anisotropy for biomolecules detection. Anal. Chim. Acta 2021, 1154, 338319. [Google Scholar] [CrossRef]
  13. Xiao, X.; Tao, J.; Zhang, H.Z.; Huang, C.Z.; Zhen, S.J. Exonuclease III-assisted graphene oxide amplified fluorescence anisotropy strategy for ricin detection. Biosens. Bioelectron. 2016, 85, 822–827. [Google Scholar] [CrossRef] [PubMed]
  14. Li, X.; Huang, N.; Zhang, L.; Zhao, J.; Zhao, S. A T7 exonuclease assisted dual-cycle signal amplification assay of miRNA using nanospheres-enhanced fluorescence polarization. Talanta 2019, 202, 297–302. [Google Scholar] [CrossRef] [PubMed]
  15. Hoffmann, C.; Jourdain, M.; Grandjean, A.; Titz, A.; Jung, G. Beta-Boronic Acid-Substituted Bodipy Dyes for Fluorescence Anisotropy Analysis of Carbohydrate Binding. Anal. Chem. 2022, 94, 6112–6119. [Google Scholar] [CrossRef] [PubMed]
  16. Huang, W.; Guo, C.; Zhai, J.; Xie, X. Fluorescence Anisotropy as a Self-Referencing Readout for Ion-Selective Sensing and Imaging Using Homo-FRET between Chromoionophores. Anal. Chem. 2022, 94, 9793–9800. [Google Scholar] [CrossRef]
  17. Jain, P.; Aida, T.; Motosuke, M. Fluorescence Anisotropy as a Temperature-Sensing Molecular Probe Using Fluorescein. Micromachines 2021, 12, 1109. [Google Scholar] [CrossRef] [PubMed]
  18. Tian, H.-W.; Xu, Z.; Li, H.-B.; Hu, X.-Y.; Guo, D.-S. Study on assembling compactness of amphiphilic calixarenes by fluorescence anisotropy. Supramol. Chem. 2021, 33, 527–533. [Google Scholar] [CrossRef]
  19. Ye, H.; Duan, N.; Gu, H.; Wang, H.; Wang, Z. Fluorometric determination of lipopolysaccharides via changes of the graphene oxide-enhanced fluorescence polarization caused by truncated aptamers. Mikrochim. Acta 2019, 186, 173. [Google Scholar] [CrossRef]
  20. Ye, H.; Lu, Q.; Duan, N.; Wang, Z. GO-amplified fluorescence polarization assay for high-sensitivity detection of aflatoxin B-1 with low dosage aptamer probe. Anal. Bioanal. Chem. 2019, 411, 1107–1115. [Google Scholar] [CrossRef]
  21. Zhang, D.; Wang, H. Fluorescence Anisotropy Reduction of An Allosteric G-Rich Oligonucleotide for Specific Silver Ion and Cysteine Detection Based on the G-Ag+-G Base Pair. Anal. Chem. 2019, 91, 14538–14544. [Google Scholar] [CrossRef] [PubMed]
  22. Shokri, E.; Hosseini, M.; Sadeghan, A.A.; Bahmani, A.; Nasiri, N.; Hosseinkhani, S. Virus-directed synthesis of emitting copper nanoclusters as an approach to simple tracer preparation for the detection of Citrus Tristeza Virus through the fluorescence anisotropy immunoassay. Sens. Actuators B Chem. 2020, 321, 128634. [Google Scholar] [CrossRef]
  23. Huang, Y.; Zhao, S.; Chen, Z.-F.; Liu, Y.-C.; Liang, H. Ultrasensitive endonuclease activity and inhibition detection using gold nanoparticle-enhanced fluorescence polarization. Chem. Commun. 2011, 47, 4763–4765. [Google Scholar] [CrossRef] [PubMed]
  24. Li, Y.; Zhao, Q. Aptamer Structure Switch Fluorescence Anisotropy Assay for Small Molecules Using Streptavidin as an Effective Signal Amplifier Based on Proximity Effect. Anal. Chem. 2019, 91, 7379–7384. [Google Scholar] [CrossRef] [PubMed]
  25. Liu, Y.X.; Xiao, X.; Li, C.H.; Men, C.; Ye, Q.C.; Lv, W.Y.; Li, Y.F.; Huang, C.Z.; Zhen, S.J. DNA nanosheet as an excellent fluorescence anisotropy amplification platform for accurate and sensitive biosensing. Talanta 2020, 211, 120730. [Google Scholar] [CrossRef]
  26. Brom, T.; Reddavide, F.V.; Heiden, S.; Thompson, M.; Zhang, Y. Influence of the geometry of fluorescently labelled DNA constructs on fluorescence anisotropy assay. Biochem. Biophys. Res. Commun. 2020, 533, 230–234. [Google Scholar] [CrossRef] [PubMed]
  27. Chen, M.; Wan, B.; Du, W.; Hu, H.; Zeng, L.; Duan, X.; Liu, J.; Wei, Z.; Tang, L.; Peng, Y. A ligation-triggered and protein-assisted fluorescence anisotropy amplification platform for sensitive and selective detection of small molecules in a biological matrix. Rsc Adv. 2020, 10, 21789–21794. [Google Scholar] [CrossRef] [PubMed]
  28. Liu, L.; Zhao, Q. A simple fluorescence anisotropy assay for detection of bisphenol A using fluorescently labeled aptamer. J. Environ. Sci. 2020, 97, 19–24. [Google Scholar] [CrossRef] [PubMed]
  29. Bricker, W.P. Molecular interactions in DNA-scaffolded energy transfer systems. Biophys. J. 2022, 121, 65. [Google Scholar] [CrossRef]
  30. Xu, L.; Zhou, B.; Song, Y.; Cai, X.; Lu, W. Electron-Transfer Study and Single Nucleotide Discrimination of a DNA Sequence on a Polymer Gold Electrode (PGE) by Differential Pulse Voltammetry (DPV). Anal. Lett. 2022, 55, 1919–1931. [Google Scholar] [CrossRef]
  31. Zhang, X.; Zhu, Z.; Liu, W.; Gao, F.; Guo, J.; Song, B.; Lee, L.P.; Zhang, F. The Selective Function of Quantum Biological Electron Transfer between DNA Bases and Metal Ions in DNA Replication. J. Phys. Chem. Lett. 2022, 13, 7779–7787. [Google Scholar] [CrossRef] [PubMed]
  32. Wu, R.; Metternich, J.B.; Tiwari, P.; Benzenberg, L.R.; Harrison, J.A.; Liu, Q.; Zenobi, R. Structural Studies of a Stapled Peptide with Native Ion Mobility- Mass Spectrometry and Transition Metal Ion Fo?rster Resonance Energy Transfer in the Gas Phase. J. Am. Chem. Soc. 2022, 144, 14441–14445. [Google Scholar] [CrossRef] [PubMed]
  33. Hao, L.; Li, M.; Peng, K.; Ye, T.; Wu, X.; Yuan, M.; Cao, H.; Yin, F.; Gu, H.; Xu, F. Fluorescence Resonance Energy Transfer Aptasensor of Ochratoxin A Constructed Based on Gold Nanorods and DNA Tetrahedrons. J. Agric. Food Chem. 2022, 70, 10662–10668. [Google Scholar] [CrossRef] [PubMed]
  34. Hu, T.; Ma, C.; Yan, Y.; Chen, J. Detection of DNA Methyltransferase Activity via Fluorescence Resonance Energy Transfer and Exonuclease-Mediated Target Recycling. Biosensors 2022, 12, 395. [Google Scholar] [CrossRef] [PubMed]
  35. Qi, S.; Zheng, H.; Almashriqi, H.S.; Lv, W.; Zhai, H. DNA-Templated Gold Nanoclusters for Fluorescence Resonance Energy Transfer-Based Human Serum Albumin Detection. J. Anal. Chem. 2022, 77, 216–223. [Google Scholar]
  36. Liu, J.; Wang, C.; Jiang, Y.; Hu, Y.; Li, J.; Yang, S.; Li, Y.; Yang, R.; Tan, W.; Huang, C.Z. Graphene Signal Amplification for Sensitive and Real-Time Fluorescence Anisotropy Detection of Small Molecules. Anal. Chem. 2013, 85, 1424–1430. [Google Scholar] [CrossRef]
  37. Fan, Y.-L.; Liu, Z.-Y.; Zeng, Y.-M.; Huang, L.-Y.; Li, Z.; Zhang, Z.-L.; Pang, D.-W.; Tian, Z.-Q. A near-infrared-II fluorescence anisotropy strategy for separation-free detection of adenosine triphosphate in complex media. Talanta 2021, 223, 121721. [Google Scholar] [CrossRef] [PubMed]
  38. Zhu, Z.; Ravelet, C.; Perrier, S.; Guieu, V.; Fiore, E.; Peyrin, E. Single-Stranded DNA Binding Protein-Assisted Fluorescence Polarization Aptamer Assay for Detection of Small Molecules. Anal. Chem. 2012, 84, 7203–7211. [Google Scholar] [CrossRef] [PubMed]
  39. Li, J.; Zheng, C.; Cansiz, S.; Wu, C.; Xu, J.; Cui, C.; Liu, Y.; Hou, W.; Wang, Y.; Zhang, L.; et al. Self-assembly of DNA Nanohydrogels with Controllable Size and Stimuli-Responsive Property for Targeted Gene Regulation Therapy. J. Am. Chem. Soc. 2015, 137, 1412–1415. [Google Scholar] [CrossRef] [PubMed]
  40. Kashiwagi, D.; Sim, S.; Niwa, T.; Taguchi, H.; Aida, T. Protein Nanotube Selectively Cleavable with DNA: Supramolecular Polymerization of “DNA-Appended Molecular Chaperones”. J. Am. Chem. Soc. 2018, 140, 26–29. [Google Scholar] [CrossRef] [PubMed]
  41. Zhang, C.; Tian, C.; Guo, F.; Liu, Z.; Jiang, W.; Mao, C. DNA-Directed Three-Dimensional Protein Organization. Angew. Chem. Int. Ed. 2012, 51, 3382–3385. [Google Scholar] [CrossRef] [PubMed]
  42. Sanghamitra, N.J.M.; Ueno, T. Expanding coordination chemistry from protein to protein assembly. Chem. Commun. 2013, 49, 4114–4126. [Google Scholar] [CrossRef]
  43. Pieters, B.J.G.E.; van Eldijk, M.B.; Nolte, R.J.M.; Mecinovic, J. Natural supramolecular protein assemblies. Chem. Soc. Rev. 2016, 45, 24–39. [Google Scholar] [CrossRef] [PubMed] [Green Version]
  44. Georgilis, E.; Abdelghani, M.; Pille, J.; Aydinlioglu, E.; van Hest, J.C.M.; Lecommandoux, S.; Garanger, E. Nanoparticles based on natural, engineered or synthetic proteins and polypeptides for drug delivery applications. Int. J. Pharm. 2020, 586, 119537. [Google Scholar] [CrossRef] [PubMed]
  45. Mo, F.; Jiang, K.; Zhao, D.; Wang, Y.; Song, J.; Tan, W. DNA hydrogel-based gene editing and drug delivery systems. Adv. Drug Deliv. Rev. 2021, 168, 79–98. [Google Scholar] [CrossRef]
  46. Shah, B.M.; Palakurthi, S.S.; Khare, T.; Khare, S.; Palakurthi, S. Natural proteins and polysaccharides in the development of micro/nano delivery systems for the treatment of inflammatory bowel disease. Int. J. Biol. Macromol. 2020, 165, 722–737. [Google Scholar] [CrossRef] [PubMed]
  47. Lee, R.V.; Zareie, H.M.; Sarikaya, M. Chimeric Peptide-Based Biomolecular Constructs for Versatile Nucleic Acid Biosensing. ACS Appl. Mater. Interfaces 2022, 14, 23164–23181. [Google Scholar] [CrossRef] [PubMed]
  48. Huang, X.; Williams, J.Z.; Chang, R.; Li, Z.; Burnett, C.E.; Hernandez-Lopez, R.; Setiady, I.; Gai, E.; Patterson, D.M.; Yu, W.; et al. DNA scaffolds enable efficient and tunable functionalization of biomaterials for immune cell modulation. Nat. Nanotechnol. 2021, 16, 214–223. [Google Scholar] [CrossRef] [PubMed]
  49. Lu, L.; Fang, T.; Pang, T.; Chen, Z.; Cheng, L.; Ma, D.; Xi, Z. The Potential Application of Branch-PCR Assembled PTEN Gene Nanovector in Lung Cancer Gene Therapy. Chembiochem 2022, 23, e202200387. [Google Scholar] [CrossRef] [PubMed]
  50. Wang, Z.; Lv, J.; Huang, H.; Xu, H.; Zhang, J.; Xue, C.; Zhang, S.; Wu, Z.-S. Structure-switchable aptamer-arranged reconfigurable DNA nanonetworks for targeted cancer therapy. Nanomedicine 2022, 43, 102553. [Google Scholar] [CrossRef] [PubMed]
  51. Xu, X.; Jiang, Y.; Lu, C. Self-Assembled ATP-Responsive DNA Nanohydrogel for Specifically Activated Fluorescence Imaging and Chemotherapy in Cancer Cells. Anal. Chem. 2022, 94, 10221–10226. [Google Scholar] [CrossRef] [PubMed]
  52. Xu, Z.; Shi, T.; Mo, F.; Yu, W.; Shen, Y.; Jiang, Q.; Wang, F.; Liu, X. Programmable Assembly of Multivalent DNA-Protein Superstructures for Tumor Imaging and Targeted Therapy. Angew. Chem. Int. Ed. 2022, 61, e202211505. [Google Scholar] [CrossRef]
  53. Huang, W.; Zhan, D.; Xie, Y.; Li, X.; Lai, G. Dual CHA-mediated high-efficient formation of a tripedal DNA walker for constructing a novel proteinase-free dual-mode biosensing strategy. Biosens. Bioelectron. 2022, 197, 113708. [Google Scholar] [CrossRef] [PubMed]
  54. Zhang, Y.; Waseem, M.; Zeng, Z.; Xu, J.; Chen, C.; Liu, Y.; Zhai, J.; Xia, R. MicroRNA482/2118, a miRNA superfamily essential for both disease resistance and plant development. New Phytol. 2022, 233, 2047–2057. [Google Scholar] [CrossRef] [PubMed]
  55. Lim, J.; Kim, S.; Oh, S.J.; Han, S.M.; Moon, S.Y.; Kang, B.; Seo, S.B.; Jang, S.; Son, S.U.; Jung, J.; et al. miRNA sensing hydrogels capable of self-signal amplification for early diagnosis of Alzheimer’s disease. Biosens. Bioelectron. 2022, 209, 114279. [Google Scholar] [CrossRef] [PubMed]
  56. Yu, S.; Wang, H.; Liu, T.; Liang, C.; Luo, J. A knowledge-driven network for fine-grained relationship detection between miRNA and disease. Brief. Bioinform. 2022, 23, bbac058. [Google Scholar] [CrossRef] [PubMed]
  57. Zhao, Y.; Hu, S.; Wang, H.; Yu, K.; Guan, Y.; Liu, X.; Li, N.; Liu, F. DNA Dendrimer-Streptavidin Nanocomplex: An Efficient Signal Amplifier for Construction of Biosensing Platforms. Anal. Chem. 2017, 89, 6907–6914. [Google Scholar] [CrossRef] [PubMed]
  58. Lu, X.; Li, D.; Luo, Z.; Duan, Y. A dual-functional fluorescent biosensor based on enzyme-involved catalytic hairpin assembly for the detection of APE1 and miRNA-21. Analyst 2022, 147, 2834–2842. [Google Scholar] [CrossRef] [PubMed]
  59. Liu, Q.; Liu, M.; Jin, Y.; Li, B. Rapid and enzyme-free signal amplification for fluorescent detection of microRNA via localized catalytic hairpin assembly on gold nanoparticles. Talanta 2022, 242, 123142. [Google Scholar] [CrossRef] [PubMed]
  60. Yan, Y.; Hu, T.; Fang, Y.; Xiang, X.; Ma, C. A fluorescence strategy for the rapid detection of miRNA-21 based on G-quadruplex and cyclic amplification signal. Anal. Biochem. 2022, 652, 114775. [Google Scholar] [CrossRef] [PubMed]
  61. Zhang, L.; Pan, M.; Zou, Z.-Q.; Fan, L.; Liu, X.-Q. Hybridization Chain Reaction-Mediated Luminescent Silver Nanocluster System for Amplified Detection of miRNA-21. Chin. J. Anal. Chem. 2020, 48, 1193–1201. [Google Scholar]
  62. Zhao, H.; Qu, Y.; Yuan, F.; Quan, X. A visible and label-free colorimetric sensor for miRNA-21 detection based on peroxidase-like activity of graphene/gold-nanoparticle hybrids. Anal. Methods 2016, 8, 2005–2012. [Google Scholar] [CrossRef]
  63. Huang, X.; Xu, Z.; Liu, J.-H.; Yu, B.-Y.; Tian, J. Dual signal amplification for microRNA-21 detection based on duplex-specific nuclease and invertase. Rsc Adv. 2020, 10, 11257–11262. [Google Scholar] [CrossRef] [PubMed] [Green Version]
  64. He, F.; Lv, X.; Li, X.; Yao, M.; Li, K.; Deng, Y. Fluorescent microspheres lateral flow assay integrated with Smartphone-based reader for multiple microRNAs detection. Microchem. J. 2022, 179, 107551. [Google Scholar] [CrossRef]
  65. Seo, S.B.; Hwang, J.-S.; Kim, E.; Kim, K.; Roh, S.; Lee, G.; Lim, J.; Kang, B.; Jang, S.; Son, S.U.; et al. Isothermal amplification-mediated lateral flow biosensors for in vitro diagnosis of gastric cancer-related microRNAs. Talanta 2022, 246, 123502. [Google Scholar] [CrossRef] [PubMed]
  66. Yin, F.; Cai, R.; Gui, S.; Zhang, Y.; Wang, X.; Zhou, N. A portable and quantitative detection of microRNA-21 based on cascade enzymatic reactions with dual signal outputs. Talanta 2021, 235, 112802. [Google Scholar] [CrossRef] [PubMed]
  67. Zhao, X.; Wang, S.; Zou, R.; Chen, C.; Cai, C. An enzyme-free probe based on G-triplex assisted by silver nanocluster pairs for sensitive detection of microRNA-21. Microchim. Acta 2021, 188, 55. [Google Scholar] [CrossRef] [PubMed]
  68. Yao, S.; Xiang, L.; Wang, L.; Gong, H.; Chen, F.; Cai, C. pH-responsive DNA hydrogels with ratiometric fluorescence for accurate detection of miRNA-21. Anal. Chim. Acta 2022, 1207, 339795. [Google Scholar] [CrossRef] [PubMed]
Figure 1. (a) Schematic illustration of the fabrication principle of the DNA dendrimer-SA-pDNA nanocomplex (DSPN). The patterns in brackets are the DNA dendrimer-SA nanocomplex (DSN) and DSPN simplified images, respectively. (b) Schematic illustration of the CHA-assisted DNA dendrimer amplified fluorescence anisotropy strategy for miRNA-21 detection.
Chemosensors 10 00501 g001
Figure 2. The feasibility analysis of the FA assay. (a) The scanning electron microscope (SEM) image of the DNA dendrimer-pDNA. The scale bar is 500 nm. (b) UV-vis absorption spectra of the DNA dendrimer and fluorescence spectra of TAMRA on the pDNA. Concentrations: H1, H2, 50 nM; pDNA, 25 nM. (c) Characterization of CHA by agarose gel electrophoresis. Lane 1, H1; lane 2, H2; lane 3, H1 + H2; lane 4, H1 + H2 + miRNA-21; lane 5, Linker + pDNA; lane 6, H1 + H2 + miRNA-21 + Linker + pDNA. (d) Fluorescence anisotropy (r) before and after the addition of miRNA-21 with or without subsequent incubation with DNA-SA dendrimer-pDNA. λex = 560, λem = 584 nm. The slits for both excitation and emission were 5 nm. Concentrations: H1, H2, 50 nM; miRNA-21, 9 nM.
Chemosensors 10 00501 g002
Figure 3. Optimization of the experimental conditions. (a) The effect of the temperature of the CHA process on the detection signal. (b) The FA signal at a different incubation time than the CHA process. (c) The effect of the incubation temperature of the formation of the H1–H2 complex and DNA dendrimer-pDNA on the FA signal. (d) The effect of the incubation time of the formation of the H1–H2 complex and DNA dendrimer-pDNA on the FA signal. λex = 560, λem = 584 nm. The slits for both excitation and emission were 5 nm. Concentrations: H1, H2, 50 nM; miRNA-21, 9 nM.
Chemosensors 10 00501 g003
Figure 4. Linear relationship with (a) and without (b) CHA. Concentrations: H1, H2, 50 nM; DNA dendrimer-pDNA, 1×. Selectivity with (c) and without (d) CHA. λex = 560, λem = 584 nm. The slits for both excitation and emission were 5 nm. Concentrations: H1, H2, 50 nM; DNA dendrimer-pDNA, 1×; miRNA-21, mis-1, mis-2, mis-4 and miRNA-145, 9 nM (c) and 35 nM (d).
Chemosensors 10 00501 g004
Figure 5. (a) Fluorescence spectra of human serum and TAMRA on the pDNA. Concentrations: pDNA, 40 nM; human serum, 1%. (b) The linear relationship between Δr/r and the concentration of miRNA-21 in human serum. λex = 560, λem = 584 nm. The slits for both excitation and emission were 5 nm. Concentrations: H1, H2, 50 nM; DNA dendrimer-pDNA, 1×.
Chemosensors 10 00501 g005
Table 1. Recovery experiment for the detection of miRNA-21 in human serum based on the linear equation of the standard diluent.
SampleAdd (nM)Found (nM)Recovery (%)RSD(%) (n = 3)
1% Human serum22.2 ± 0.394.3–119.50.9
109.6 ± 0.790.2–102.31.8
1818.1 ± 1.890.7–109.95.4
Publisher’s Note: MDPI stays neutral with regard to jurisdictional claims in published maps and institutional affiliations.