Article

Phosphoric Acid Induced Controllable Nanoparticle Aggregation for Ultrasensitive SERS Detection of Malondialdehyde in a Microfluidic Chip

Advanced Photonics Center, School of Electronic Science & Engineering, Southeast University, Nanjing 210096, China
*
Author to whom correspondence should be addressed.
These authors contributed equally to this work.
Chemosensors 2022, 10(12), 524; https://doi.org/10.3390/chemosensors10120524
Submission received: 11 November 2022 / Revised: 7 December 2022 / Accepted: 8 December 2022 / Published: 9 December 2022
(This article belongs to the Special Issue Nanocomposites for SERS Sensing)

Abstract

:
Malondialdehyde (MDA), one of the most important products of lipid peroxidation, has been widely accepted as a biomarker to indicate food rancidity as well as the progress of some human diseases. However, ready detection of MDA with ultra-high sensitivity remains a challenge. In this work, a microfluidic surface-enhanced Raman scattering (SERS) sensing chip based on phosphoric acid induced nanoparticles aggregation was proposed for ultrasensitive MDA detection. The sensing chip was composed of an ultrafast microfluidic mixer, which efficiently transferred analytes to hot spots via the mixer assisted hot spots occupying (MAHSO) SERS strategy. Phosphoric acid, a reagent used in MDA detection, played the role of aggregator to induce aggregation of silver nanoparticles (Ag NPs); meanwhile, as fast as a few milliseconds mixing time effectively prevented over-aggregation of Ag NPs. Therefore, this process generated a uniform and dense SERS substrate with analyte molecules located in hot spots. As a result, the MDA SERS sensing chip possessed a limit of detection (LOD) lower than 3.3 × 10⁻¹¹ M, high spot-to-spot uniformity with a relative standard deviation (RSD) of 9.0% and an excellent batch-to-batch reproducibility with a RSD of 3.9%. This method also demonstrated excellent specificity and reliability in real sample detection with recoveries of 90.4–109.8% in spiked tests.

1. Introduction

Malondialdehyde (MDA) is one of the most important products of lipid peroxidation. It may be produced by the peroxidation of polyunsaturated fatty acid [1,2], so that it is recognized as an indicator for monitoring the degree of food rancidity; it is also produced in human body due to intracellular oxidative stress. MDA is cytotoxic and evidence shows that abnormal MDA level are associated with various diseases, such as depression [3], diagnosed gastric adenocarcinoma [4], chronic heart failure [5], atherosclerosis [6], glaucoma [7] and multiple neurodegenerative diseases [8]. Therefore, it is significant for rapid and accurate measurement of MDA in both food industry and clinical diagnostics.
However, MDA is a volatile compound with low molecular weight of 72.07, which makes it difficult to be directly detected by instrumental methods. Usually, the amount of MDA is determined by its derivatives through derivatization between MDA and other reagents, such as thiobarbituric acid (TBA) [9], 2-aminoacridone [10], 1-methy-2-phenylindole [11], 2,4-dinitrophenylhy-drazine [12], 9-fluorenylmethoxycarbonylhydrazine [13]. MDA derivatives are able to be detected by instrumental methods, such as liquid chromatography (LC), gas chromatography (GC), UV-Vis absorption spectrum and capillary electrophoresis. Chromatographic methods are high-precision and usually treated as golden standards, but they are high cost and time consuming, whereas the sensitivity and specificity of absorbance and capillary electrophoresis are not enough [14,15]. Therefore, it is important to develop a sensitive and simple method to detect MDA and meet the requirement for on-field quick testing.
Surface enhanced Raman spectroscopy (SERS) is an ultrasensitive analytical technique with merit of simple operation. Zhang et al. [16] reported the first proof-of-concept study on detection of the TBA-MDA adduct using silver nanoparticles (Ag NPs) as SERS substrate and achieved ultrasensitive detection of 0.45 nM of high-performance liquid chromatography (HPLC) purified TBA-MDA. Meanwhile, they pointed out the drawback of poor reproducibility of the SERS substrate with average relative standard deviation (RSD) of 20%. Recently, Yan et al. [17] improved the uniformity of detection to RSD of 10% and realized the linear quantitative range from 0.33 μM to 3.3 mM in the reaction solution without further separation based on Au NPs enriched by Q sepharose spheres.
In this work, we attained both ultrasensitive and high-reproducible detection of MDA in the microfluidic SERS chip. Phosphoric acid enhanced mixer assisted hot spots occupying (MAHSO) SERS chip was developed for MDA detection. MAHSO SERS strategy greatly improves SERS signal by employing a high-efficiency and ultrafast microfluidic mixer to make as many analyte molecules as possible uniformly adsorb on metal NPs and naturally locate in “hot spots”, while NPs depositing on channel walls to form the SERS substrate [18]. We also found that phosphoric acid, a reagent used in the derivatization reaction of MDA with TBA in our experiment, could induce Ag NPs aggregation and result in greater Raman enhancement. Therefore, phosphoric acid was used as aggregator to reduce the gap between Ag NPs in the process of forming MAHSO substrate, which boosted SERS intensity further. Synergistically by MAHSO mechanism and phosphoric induced NPs aggregation, the limitation of detection (LOD) was down to 3.3 × 10⁻¹¹ M; meanwhile, milliseconds mixing time of the ultrafast mixer prevented over-aggregation of Ag NPs and contributed to high uniformity with RSD of 9.0%.

2. Materials and Methods

2.1. Chemicals and Materials

1,1,3,3-tetraethoxypropane (TEP) was purchased from Macklin (Shanghai, China). Glutaraldehyde, formaldehyde, benzaldehyde and trichloroacetic acid (TCA) were purchased from Aladdin (Shanghai, China). Silver nitrate, trisodium citrate, sodium hydroxide, nitric acid, (3-aminopropyl) trimethoxysilane (APTMS), 2-thiobarbituric acid (TBA), sulfuric acid (H2SO4) and phosphoric acid (H3PO4) were obtained from Chinese medicine group. Ethylenediaminetetraacetic acid disodium (EDTA) was purchased from Chron Chemical (Chengdu, China). Lard, rapeseed oil and sunflower seed oil were purchased from local supermarket. All reagents were analytical reagent (AR) and used as received without further purification. The water was all deionized water.

2.2. Preparation of Uniform Silver NPs (Ag NPs)

Details were shown in our previous work [19]. Briefly, Ag NPs were prepared by the citrate reduction of silver nitrate. The nucleation and growth processes were performed independently, and the pH values were set at 11 and 5, respectively. After low-speed centrifugation, the average size of finally prepared Ag NPs was 57 nm.

2.3. Fabrication of Cascaded Splitting and Recombination (C-SAR) Microfluidic Mixer

The C-SAR mixer is an ultrafast microfluidic mixer. It works in a wide range of Reynolds number (34.6–150) with a mixing efficiency of more than 90%, while the mixing time is on the order of milliseconds. Details of design and characterization are shown in our previous work [20]. The PDMS microfluidic mixer was fabricated using typical replica molding technique. The mold was customized by Suzhou Cchip Scientific Instrument Co., Ltd: briefly, first, by pouring the mixture of PDMS prepolymer and curing agent onto the mold; second, peeling off the cured PDMS replica from the mold; third, punching the inlets and outlets; fourth, cleaning the PDMS replica and a piece of PDMS coverslip by oxygen plasma; and last, bonding the replica and coverslip together to complete the microfluidic chip.

2.4. Preparation of TBA-MDA Adduct and Other Derivatives

MDA was prepared by the hydrolyzation of 1,1,3,3-tetraethoxypropane (TEP) under acidic environment according to Ref. [21]. Generally, 20 mM of TEP solution hydrolyzed in 1% (v/v) H2SO4 solution for 2 h at room temperature produces 20 mM of MDA. The MDA solution was diluted with deionized water to the desired range of concentrations according to experimental requirements and stored at 4 °C. Fresh MDA solution should be utilized within 2 days to avoid MDA dimerization, which could be observed by color changes from colorless to yellow [22].
TBA solution was made by dissolving TBA powder in deionized water and heating at 55 °C for 45 min. Then it was cooled to room temperature for use. The TBA solution should be freshly prepared to avoid contamination.
The derivatization reaction of TBA and MDA is shown in Equation (1) [23]. TBA-MDA adduct was prepared by adding MDA into the mixture of H3PO4 and TBA. TBA was excessive to make sure the complete conversion of MDA into TBA-MDA. Typically, 500 μL of MDA was mixed with 750 μL of 440 mM H3PO4 and 250 μL of 42 mM TBA. The resulting mixture was heated at 90 °C for 1 h, then cooled to room temperature and stored in dark. Lower concentration of TBA-MDA was obtained by diluting with either deionized water or H3PO4 according to experimental design. The final solution was directly performed for SERS analysis without further purification within 2 days.
The derivatization reaction of TBA and other aldehydes is shown in Equation (2) [24]. The corresponding adduct was prepared by mixing TBA and aldehyde, such as benzaldehyde, glutaraldehyde and formaldehyde in phosphoric acid solution and heating, similar with the preparation of TBA-MDA adduct.
Chemosensors 10 00524 i001
Chemosensors 10 00524 i002

2.5. Preparation of Real Samples

Lard, rapeseed oil and sunflower seed oil were selected as real samples. Oil samples were processed following the National standard of China [GB (5009.181-2016)]. TCA-EDTA solution was used to extract MDA form spiked oil samples. It was made by dissolving 37.5 g of TCA and 0.5 g of EDTA in 500 mL of deionized water. Five grams of oil samples with various concentration of MDA were mixed in 50 mL of TCA-EDTA solutions, respectively, and kept stirring for 30 min in a water bath pot at 50 °C. After being cooled to room temperature, the mixture was filtered with double quantitative filter paper. The initial filtrate was discarded and following filtrate was collected. Then, 5 mL of 20 mM TBA was added into 5 mL of filtrate and reacted at 90 °C for 30 min. After being cooled to room temperature, the reaction mixture was ready for SERS measurements.

2.6. Fabrication of Phosphoric Acid Regulated MAHSO SERS Chip

The 2% (v/v) APTMS was injected into the microfluidic mixer from inlets by syringe pumps. Subsequently, ethanol and H2O were infused to wash off residual APTMS. Then, analytes with H3PO4 and silver colloid were injected into the chip from central channel and two side channels separately. The ratio of flow rate of central channel to side channels was 1:5:5. Ag NPs adsorbed with analytes were coated on channel walls evenly by electrostatic interaction [19]. Afterwards, deionized water was pumped into the chip from three inlets to wash away excessive analytes, sliver colloid and H3PO4. Then, the phosphoric acid regulated MAHSO SERS chip was accomplished.

2.7. SERS Measurement

SERS measurements were performed with a HORIBA JOBIN YVON T64000 three-grating Raman spectrometer. The prepared phosphoric acid regulated MAHSO SERS chip was put on the sample station of Raman spectrometer and the laser with 633 nm radiation was focus onto the detection area inside the microfluidic chip. The power at the sample position was 2.3 mW. The scattering light was collected by a 10× objective lens (NA = 0.5) to the CCD detector. The integration time was 1s and the RSD was from at least five measurements, if without specific description.

2.8. Characterization

The extinction spectra of silver colloid were recorded on a U-T1810D UV-Vis spectrophotometer. The scanning electron microscopy (SEM) images of SERS substrate were taken on a Zeiss Ultra Plus field emission scanning electron microscope with an accelerating voltage of 2 kV.

3. Results and Discussion

3.1. Phosphoric Acid Induced Ag NPs Aggregation

Inducing metal NPs aggregation is one of the simplest methods to improve the sensitivity of SERS detection [25]. Common aggregators include haloid [26,27], nitrate salts [28], sulfate salts [29] and cetyltrimethylammonium bromide (CTAB) [30]. During experiments, we found that phosphoric acid used in the TBA-MDA derivatization reaction could induce NPs aggregation. Therefore, we tried to use only phosphoric acid without adding extra aggregator to increase the sensitivity of MDA detection. Figure 1 shows extinction spectra of Ag NPs mixed with phosphoric acid of different concentration. At the low acid concentration, such as pH 5.8 and 4.7, the extinction spectra of Ag NPs almost overlapped with the original spectrum, which indicated that the NPs were still in the monodisperse state. With the increase of phosphoric acid concentration, the absorbance obvious decreased and absorption peak slightly redshifted from 414 nm to 419 nm at pH 3.8. This phenomenon indicated that phosphoric acid entered the Stern layer of the nanoparticles, reducing the surface charge of nanoparticles [31], which would lead to the aggregation of Ag NPs. As increase of the concentration of phosphoric acid, the intensity of the absorption peak at 414 nm continued to decrease, and the width of peak continued to widen. Moreover, a new absorption peak appeared at longer wavelength, which would be the result of the plasmon absorbance coupling of closing spaced NPs [30].

3.2. Phosphoric Acid Regulated SERS Substrate

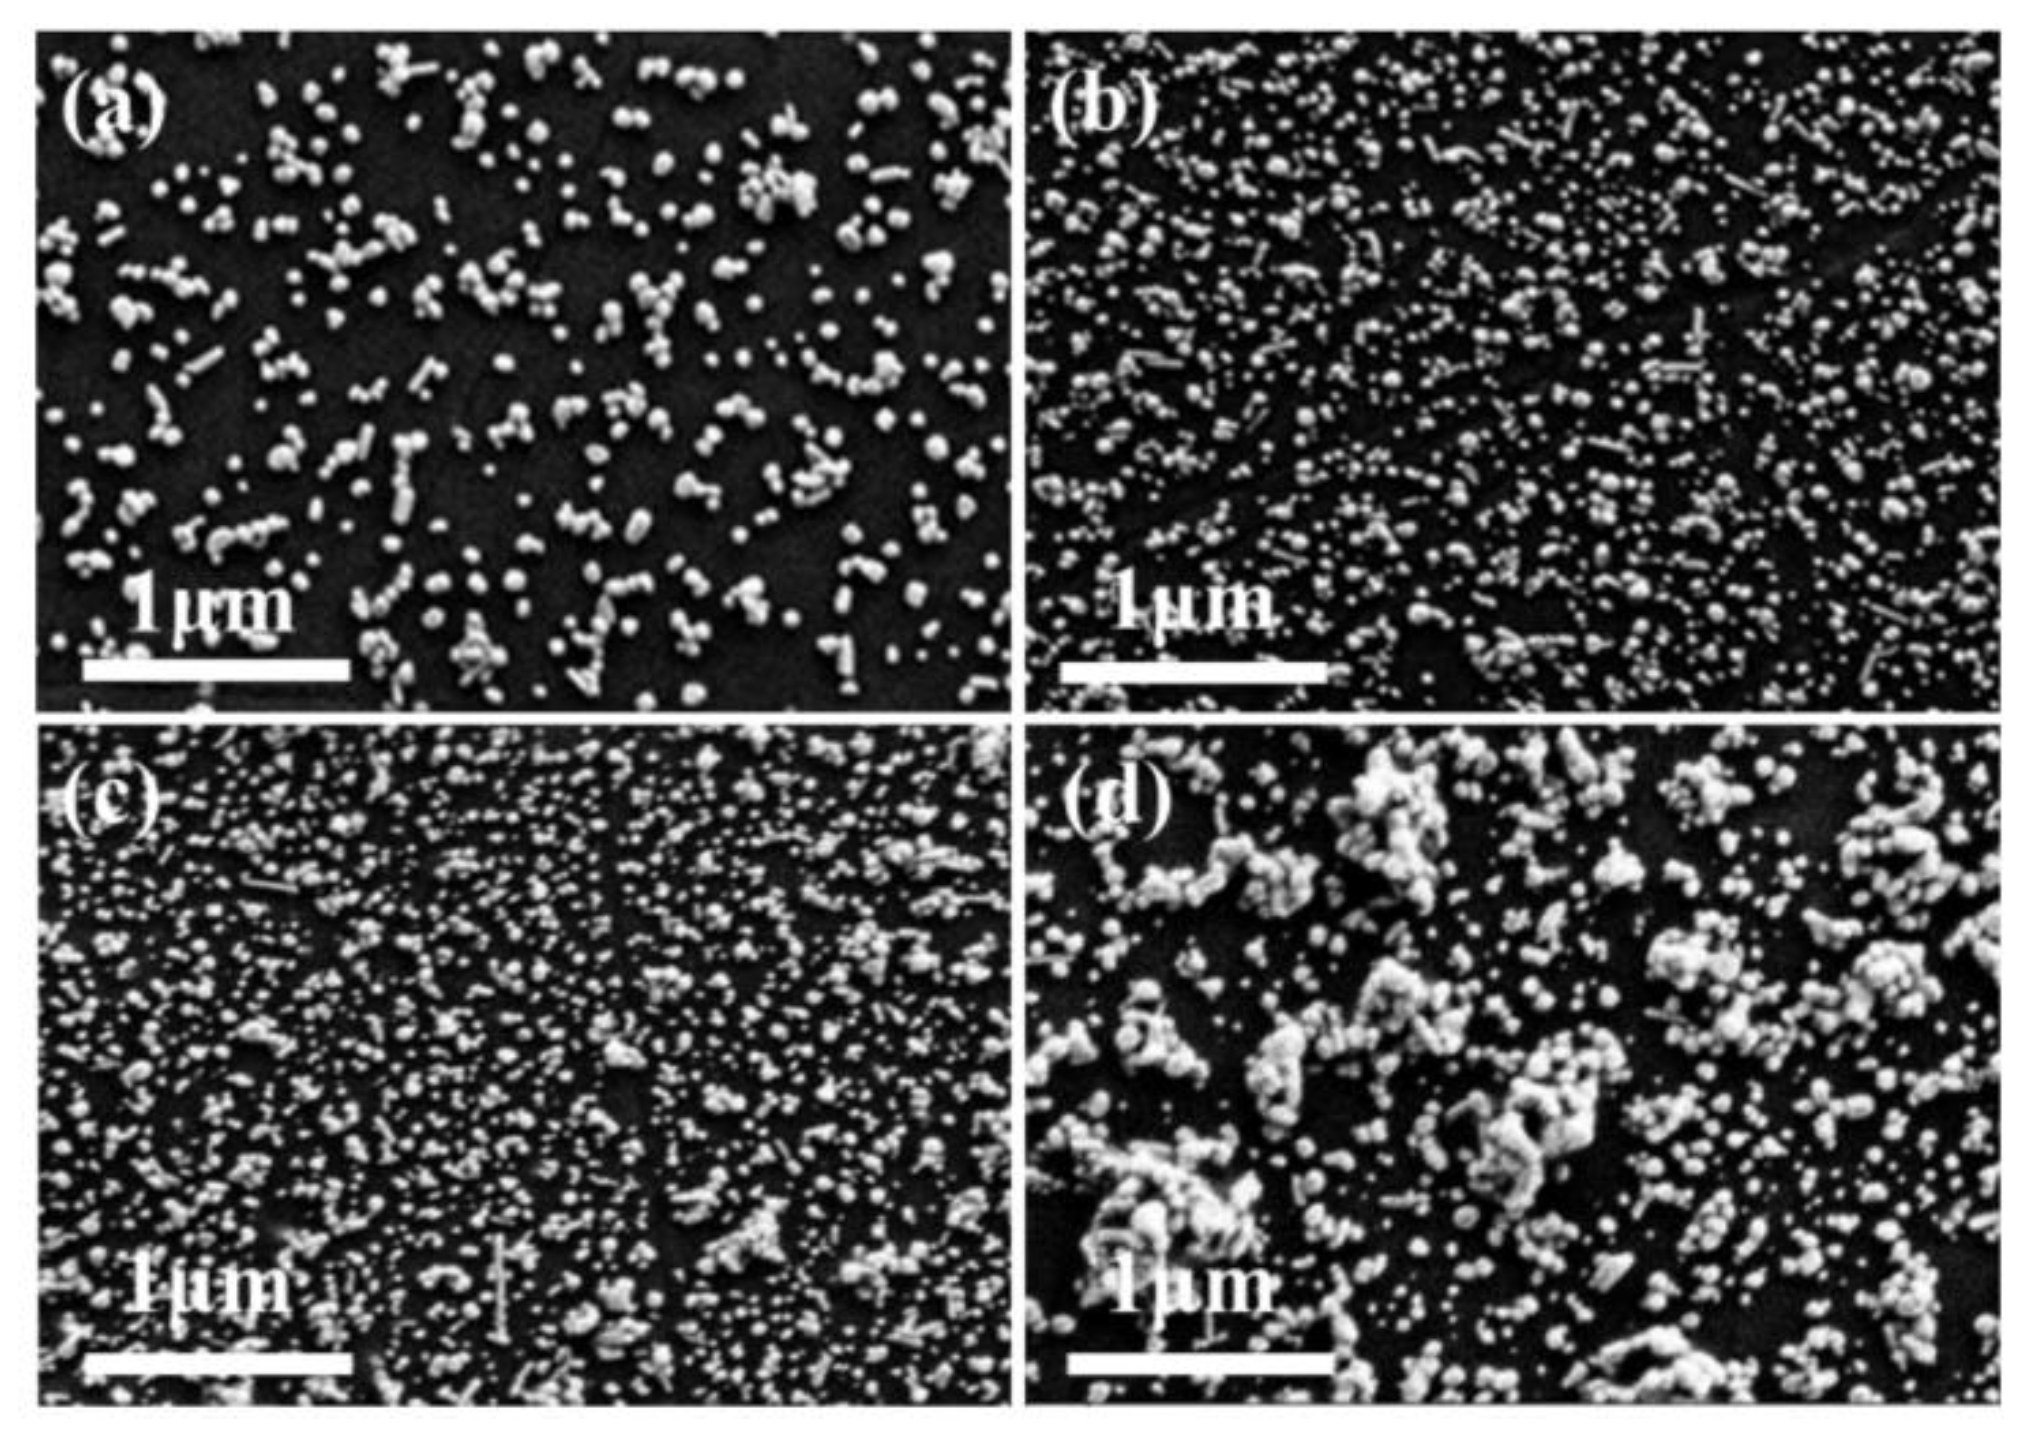
Since the addition of phosphoric acid reduces the repulsion between nanoparticles and results in aggregation of silver colloid, it could be expected that gaps of Ag NPs in forming MAHSO SERS substrates would be regulated with the addition of phosphoric acid. Hence, we injected phosphoric acid of different concentrations into the microfluidic chip to observe the influence of phosphoric acid on SERS substrates formation. As shown in Figure 2, the density of Ag NPs deposited on channel walls of the chip obviously increased with the increment of the phosphoric acid concentration. In other words, phosphoric acid regulated the gaps between NPs—the “hot spots”. However, when the concentration of phosphoric acid was too high, such as 2 mM, Ag NPs significantly aggregated (Figure 2d), which is not conducive to Raman signal enhancement. Therefore, adding the proper amount of phosphoric acid in the process of SERS substrate formation reduces the spacing between NPs and produces denser SERS substrate with more and stronger hot spots, which will greatly improve the sensitivity of SERS detection.

3.3. The Mechanism of Phosphoric Acid Enhanced MAHSO SERS Chip for Ultrasensitive MDA Detection

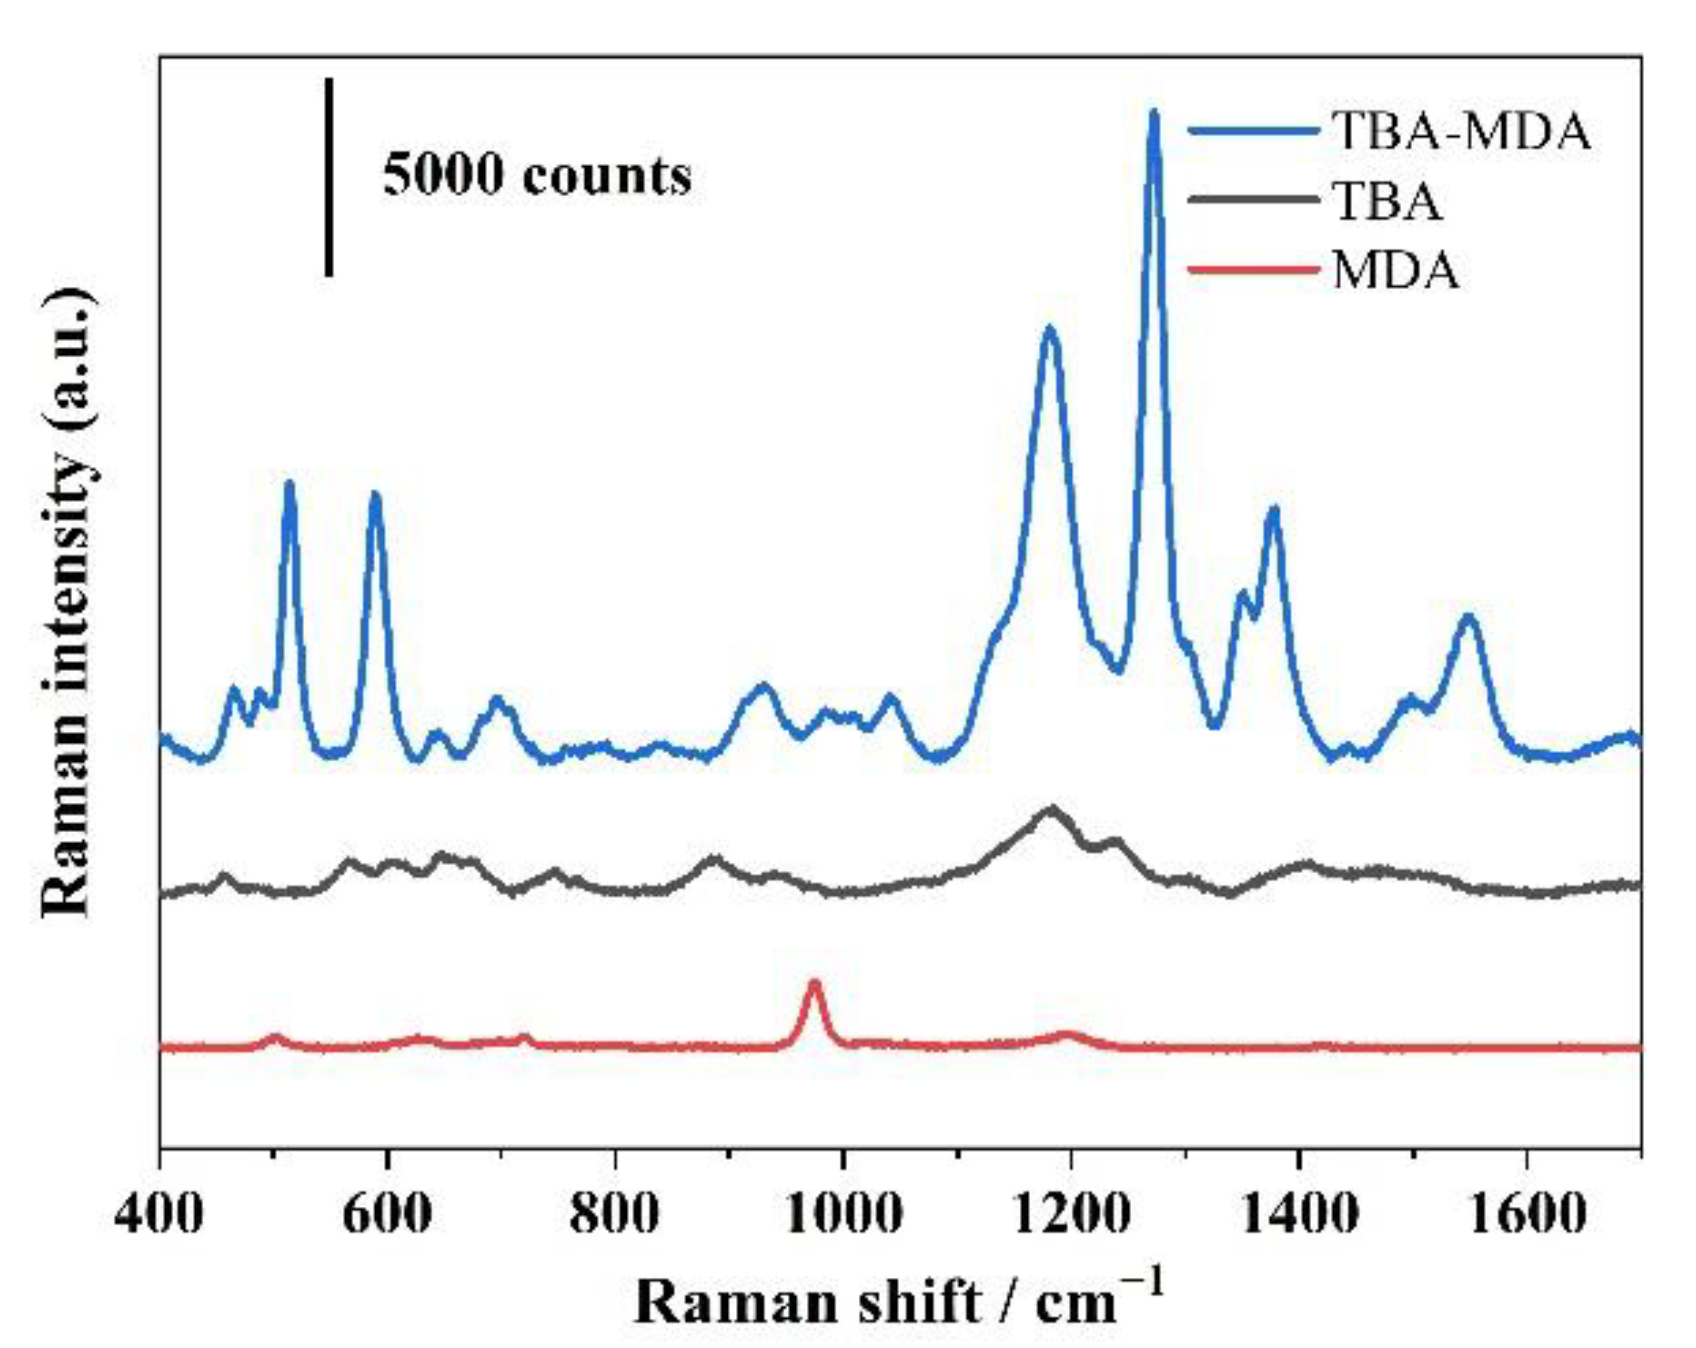
Quantification of MDA is indirectly by detection of its derivative TBA-MDA. On the one hand, TBA-MDA adduct has much larger Raman scattering cross-sectional area than raw MDA; on the other hand, TBA-MDA has stronger affinity to the Ag surface than TBA due to two thiol groups rather than one in TBA [16,17]. Therefore, usually only the SERS signal of TBA-MDA could be detected in the mixture solution of TBA, MDA and TBA-MDA adduct, as shown in Figure 3. The concentration of the TBA-MDA adduct should be equal to that of MDA according to Equation (1).
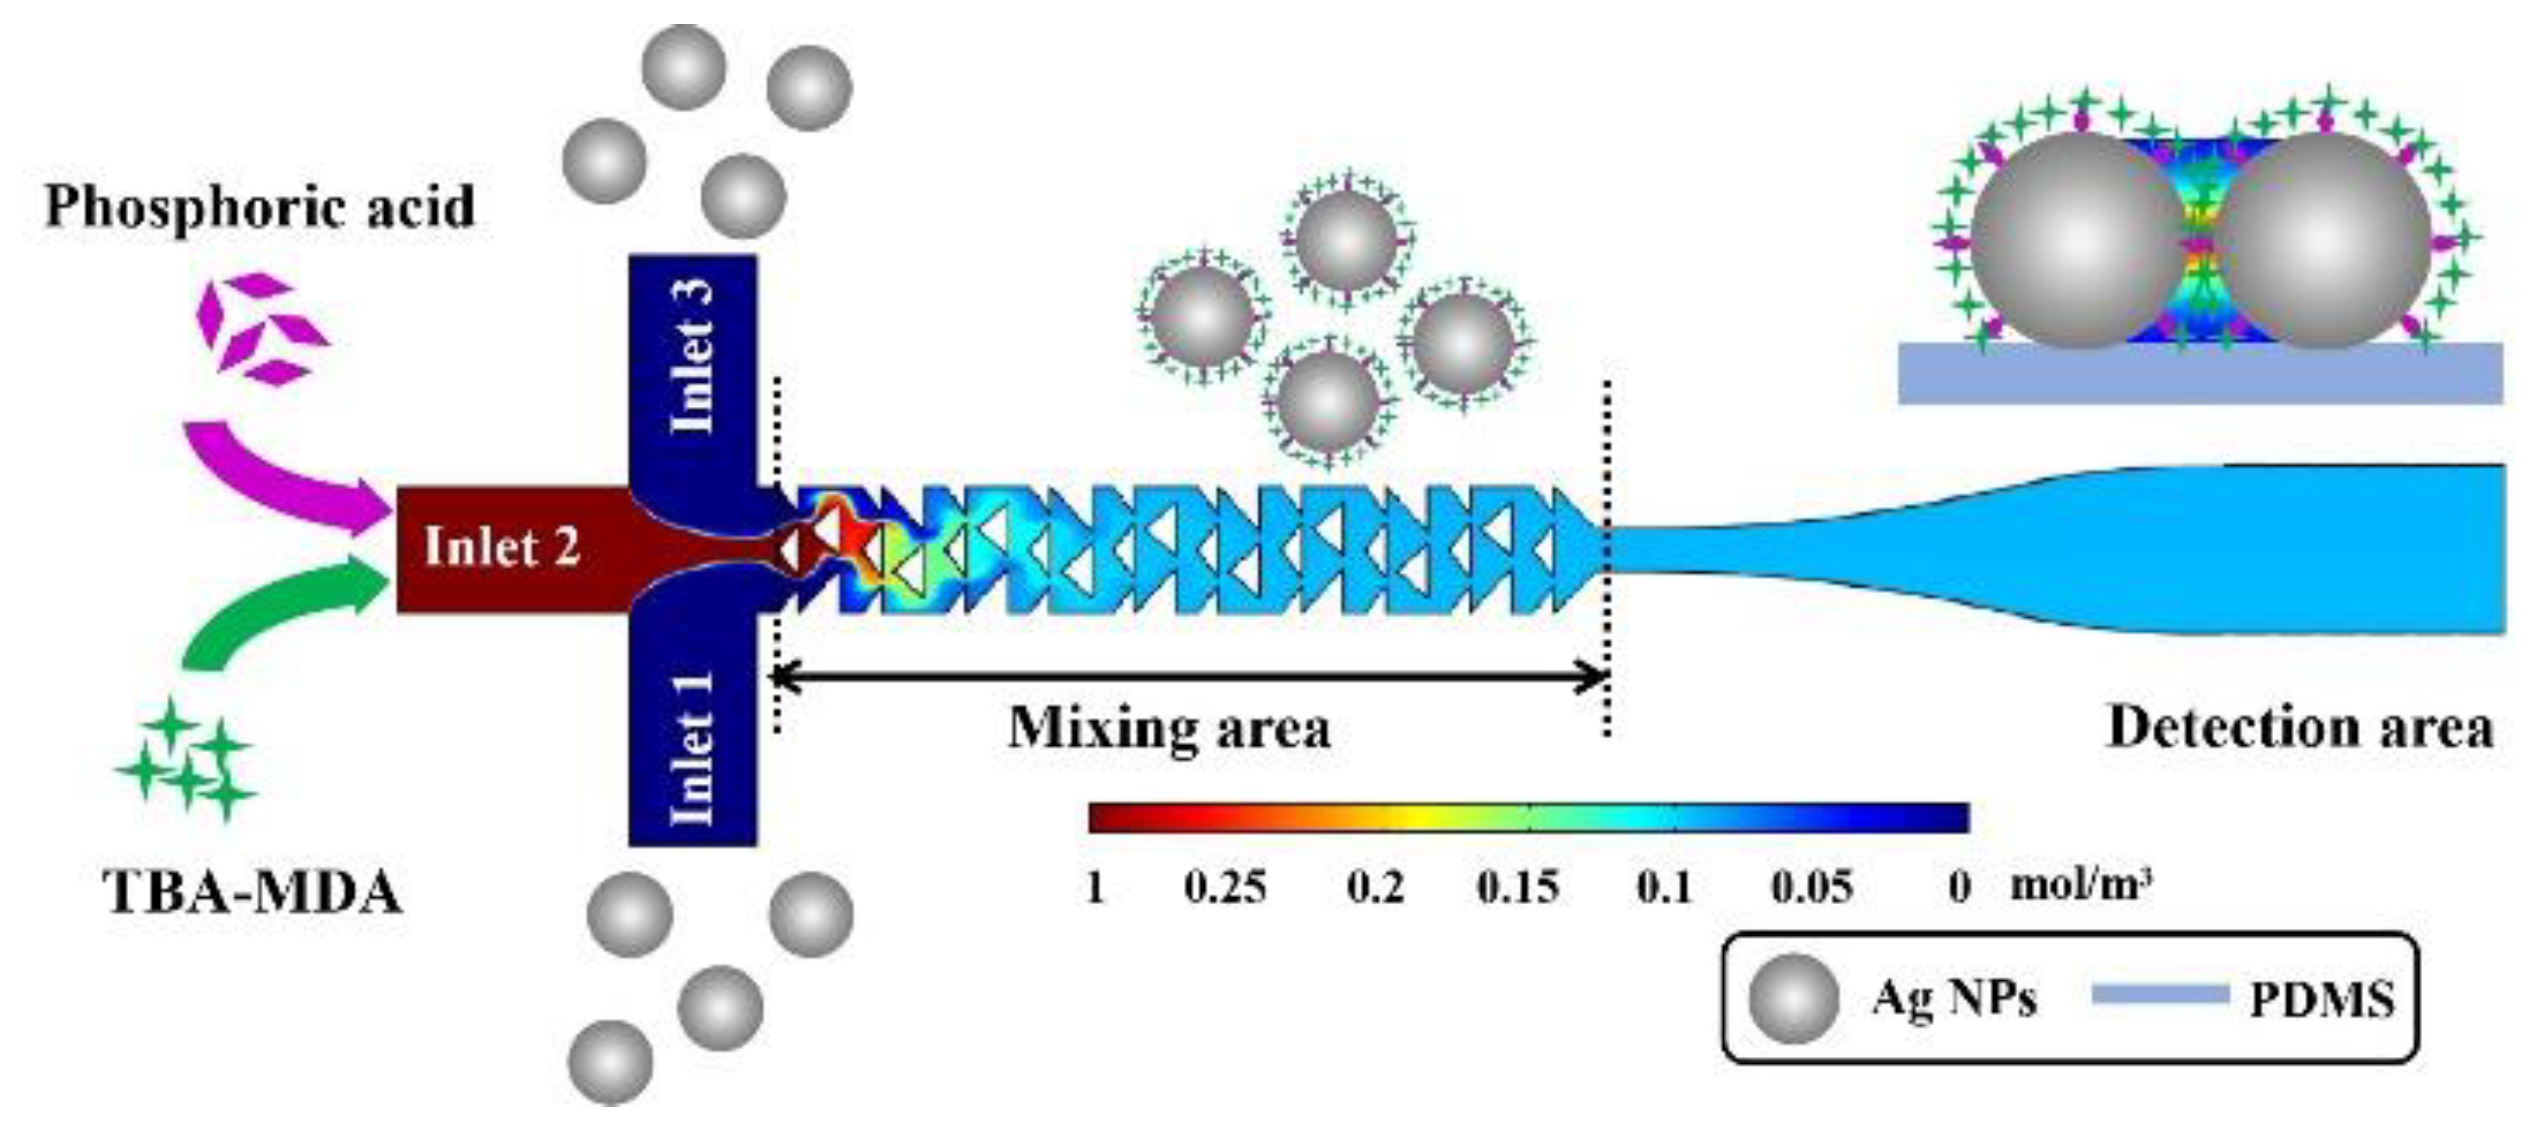
As illustrated in Figure 4, TBA-MDA adduct with phosphoric acid are injected into the microfluidic chip from central channel, and Ag NPs are injected from side channels. The mixing efficiency of the employed cascaded splitting and recombination (C-SAR) microfluidic mixer is more than 90% [20], so that the TBA-MDA adduct and phosphoric acid are thoroughly mixed with Ag NPs, which makes as many analytes as possible adsorbed on the surface of NPs uniformly. After leaving the mixing area, the NPs are captured by APTMS before aggregation and form evenly phosphoric acid regulated MAHSO SERS substrate. Then SERS spectra of TBA-MDA can be measured in the detection area.
At the beginning, we tried to synthesize TBA-MDA in the microfluidic chip directly. We injected MDA instead of TBA-MDA to the microfluidic chip to form the MAHSO SERS substrate. Then, we injected TBA with phosphoric acid into the MAHSO SERS chip and heated the chip at 90 °C for 1 h to produce TBA-MDA adduct inside the chip. However, the collected signal was the SERS spectrum of TBA rather than that of TBA-MDA adduct (Figure S1). This result indicated that TBA could not enter hot spots when they were “occupied” by MDA, so that TBA-MDA could not be actually produced. This experiment proved that analytes could be effectively transferred into tiny “hot spots” by our MAHSO strategy. As a result, SERS signals would be greatly boosted.
In addition, according to results of Figure 2, phosphoric acid plays the role of aggregator in this system. It reduces the spacing between NPs in the process of forming MAHSO substrate and produces denser SERS substrate with more and stronger hot spots, which will contribute to ultra-sensitive MDA detection. On the other hand, the mixing time of C-SAR mixer is on the scale of milliseconds [20], which effectively prevents over-aggregation of Ag NPs and guarantees the high uniformity of the phosphoric acid enhanced MAHSO SERS chip.

3.4. Optimization of Phosphoric Acid Concentration

The concentration of aggregator has great influence on the strength of SERS signal. In order to realize ultrasensitive SERS detection of MDA, we optimized the concentration of phosphoric acid injected into the microfluidic chip. Figure 5 shows the SERS signals of TBA-MDA adduct changed with the addition of phosphoric acid. The SERS intensity of TBA-MDA adduct increased first and then decreased. With the increase of phosphoric acid concentration, the distance between Ag NPs was narrowed and the intensity of electromagnetic field increased, forming a large number of “hot spots”. As a result, the SERS intensity of TBA-MDA adduct increased. However, Ag NPs showed excessive aggregation as the concentration of phosphoric acid continued to increase, which was not conducive to SERS enhancement, but reduced SERS signals. In our experiments, the SERS signal maximized when the pH value of solution in the chip was 3.8, corresponding to 0.2 mM phosphoric acid. The correspondence between concentration of phosphoric acid injected to the chip, concentration of phosphoric acid inside the chip and resulted final pH value is shown in Table S1. The optimized phosphoric acid concentration (0.2 mM, inside the chip) was used in subsequent experiments.

3.5. Specificity and Selectivity of MDA Detection

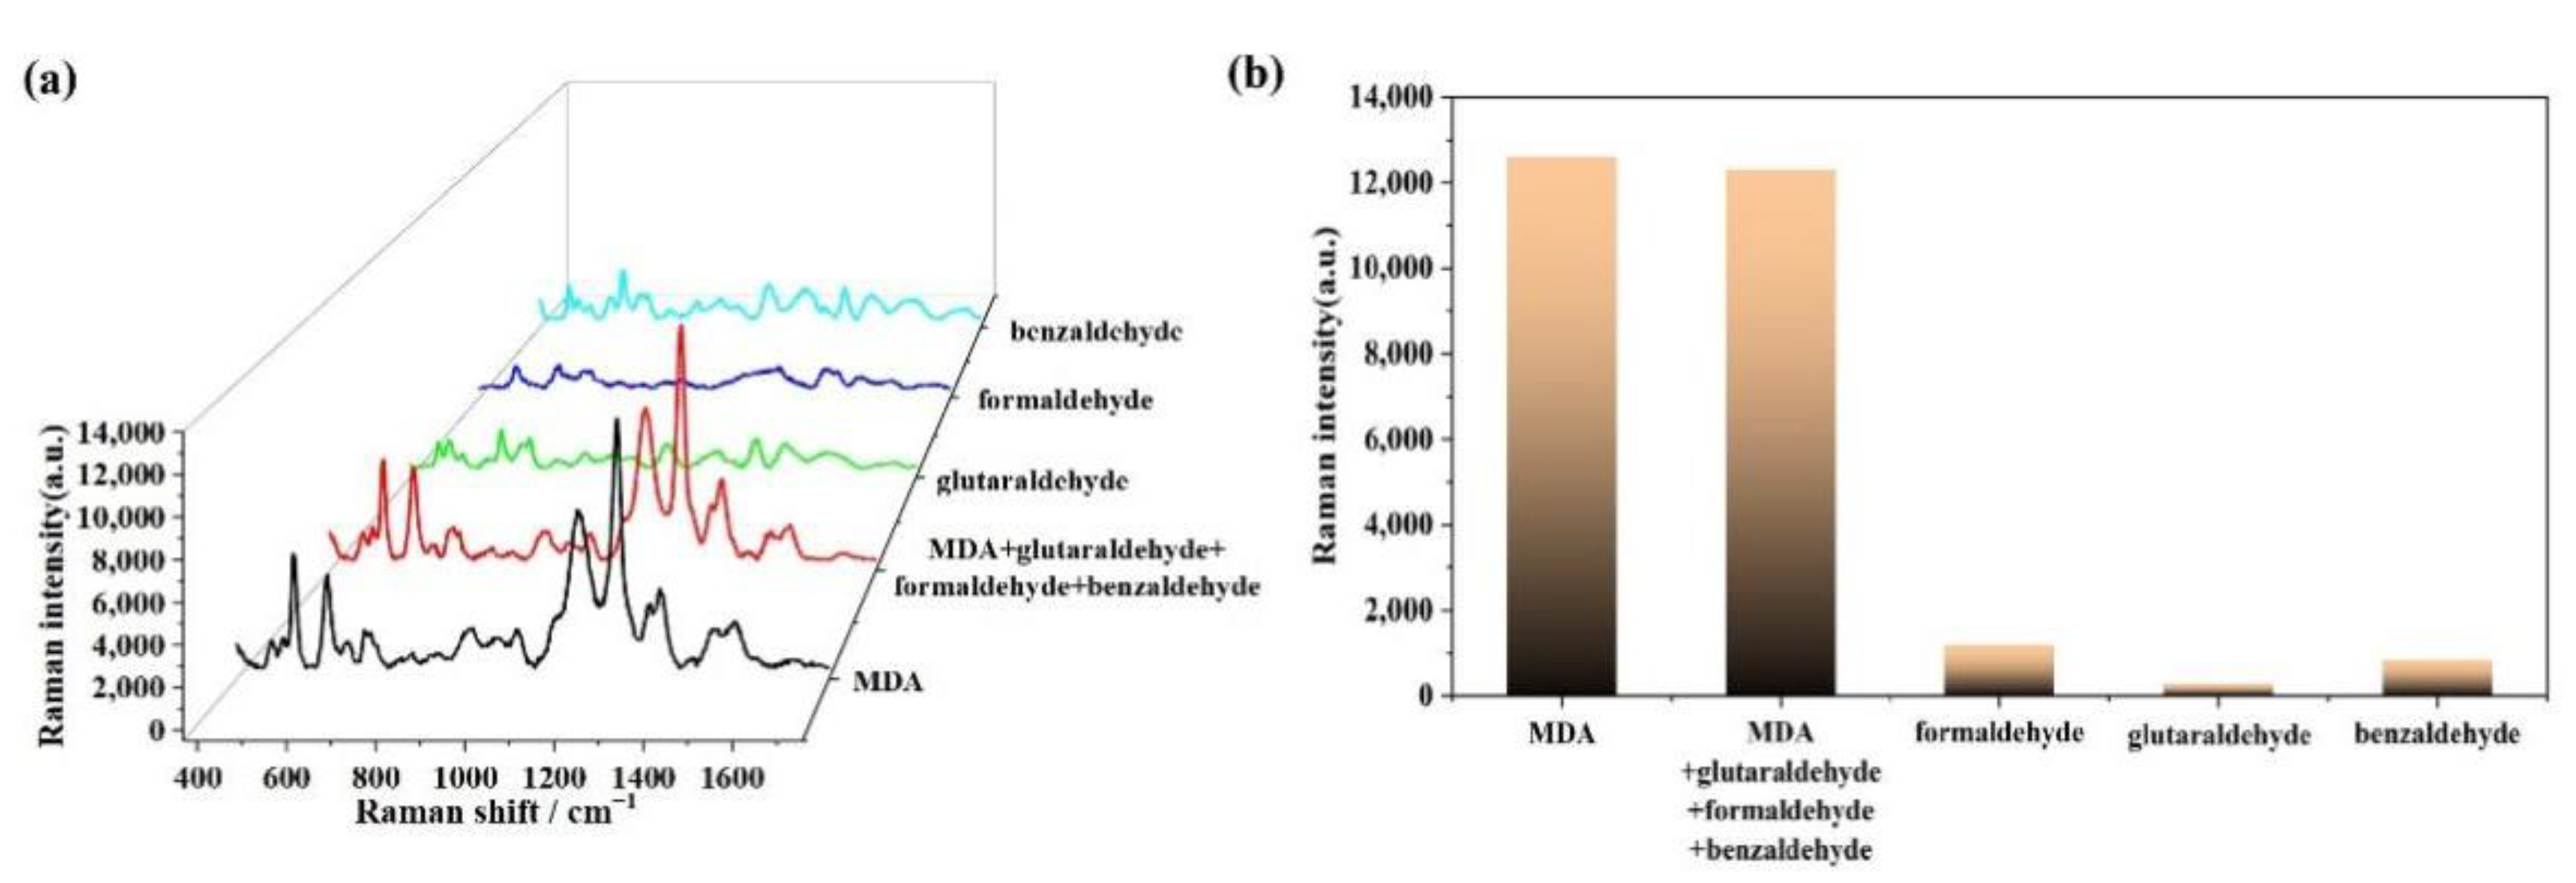
The Raman spectrum provides the fingerprint information of the analyte, which makes it possible to specifically recognize molecules. To examine the specificity and selectivity of proposed MDA detection method, several common aldehydes, including glutaraldehyde, formaldehyde and benzaldehyde were selected as possible disrupting substances. After the derivatization of aldehydes and TBA, the adducts were fed into the microfluidic chip to form MAHSO SERS substrates respectively, and then SERS spectra were acquired and shown in Figure 6a. The derivative of the mixture of MDA and other aldehydes with TBA was also tested. The concentrations of TBA-MDA and other TBA-Aldehyde adducts were all 10−7 M. SERS intensities at 1272 cm−1, the characteristic band of TBA-MDA, of all samples are shown in Figure 6b. SERS intensities of TBA-Aldehyde adducts, including glutaraldehyde, formaldehyde and benzaldehyde were significantly weaker than that of TBA-MDA, but the SERS spectrum of the derivatization reaction product of the mixture of MDA, glutaraldehyde, benzaldehyde and formaldehyde with TBA was consistent with that of TBA-MDA. Since TBA-MDA has two thione groups rather than one in other TBA-Aldehyde adducts, and these thione groups have high binding affinity towards the SERS active Ag NPs surfaces [32], it has higher binding affinity to the SERS substrate and wins in the competitive binding to the SERS substrate. As a result, the SERS intensity of TBA-MDA has little decrease in the mixture of aldehydes. The results show that TBA-MDA is able to be specifically recognized by the SERS method, and the proposed method possesses excellent selectivity in the detection of MDA in a complex system.

3.6. Sensitivity, Uniformity and Reproducibility

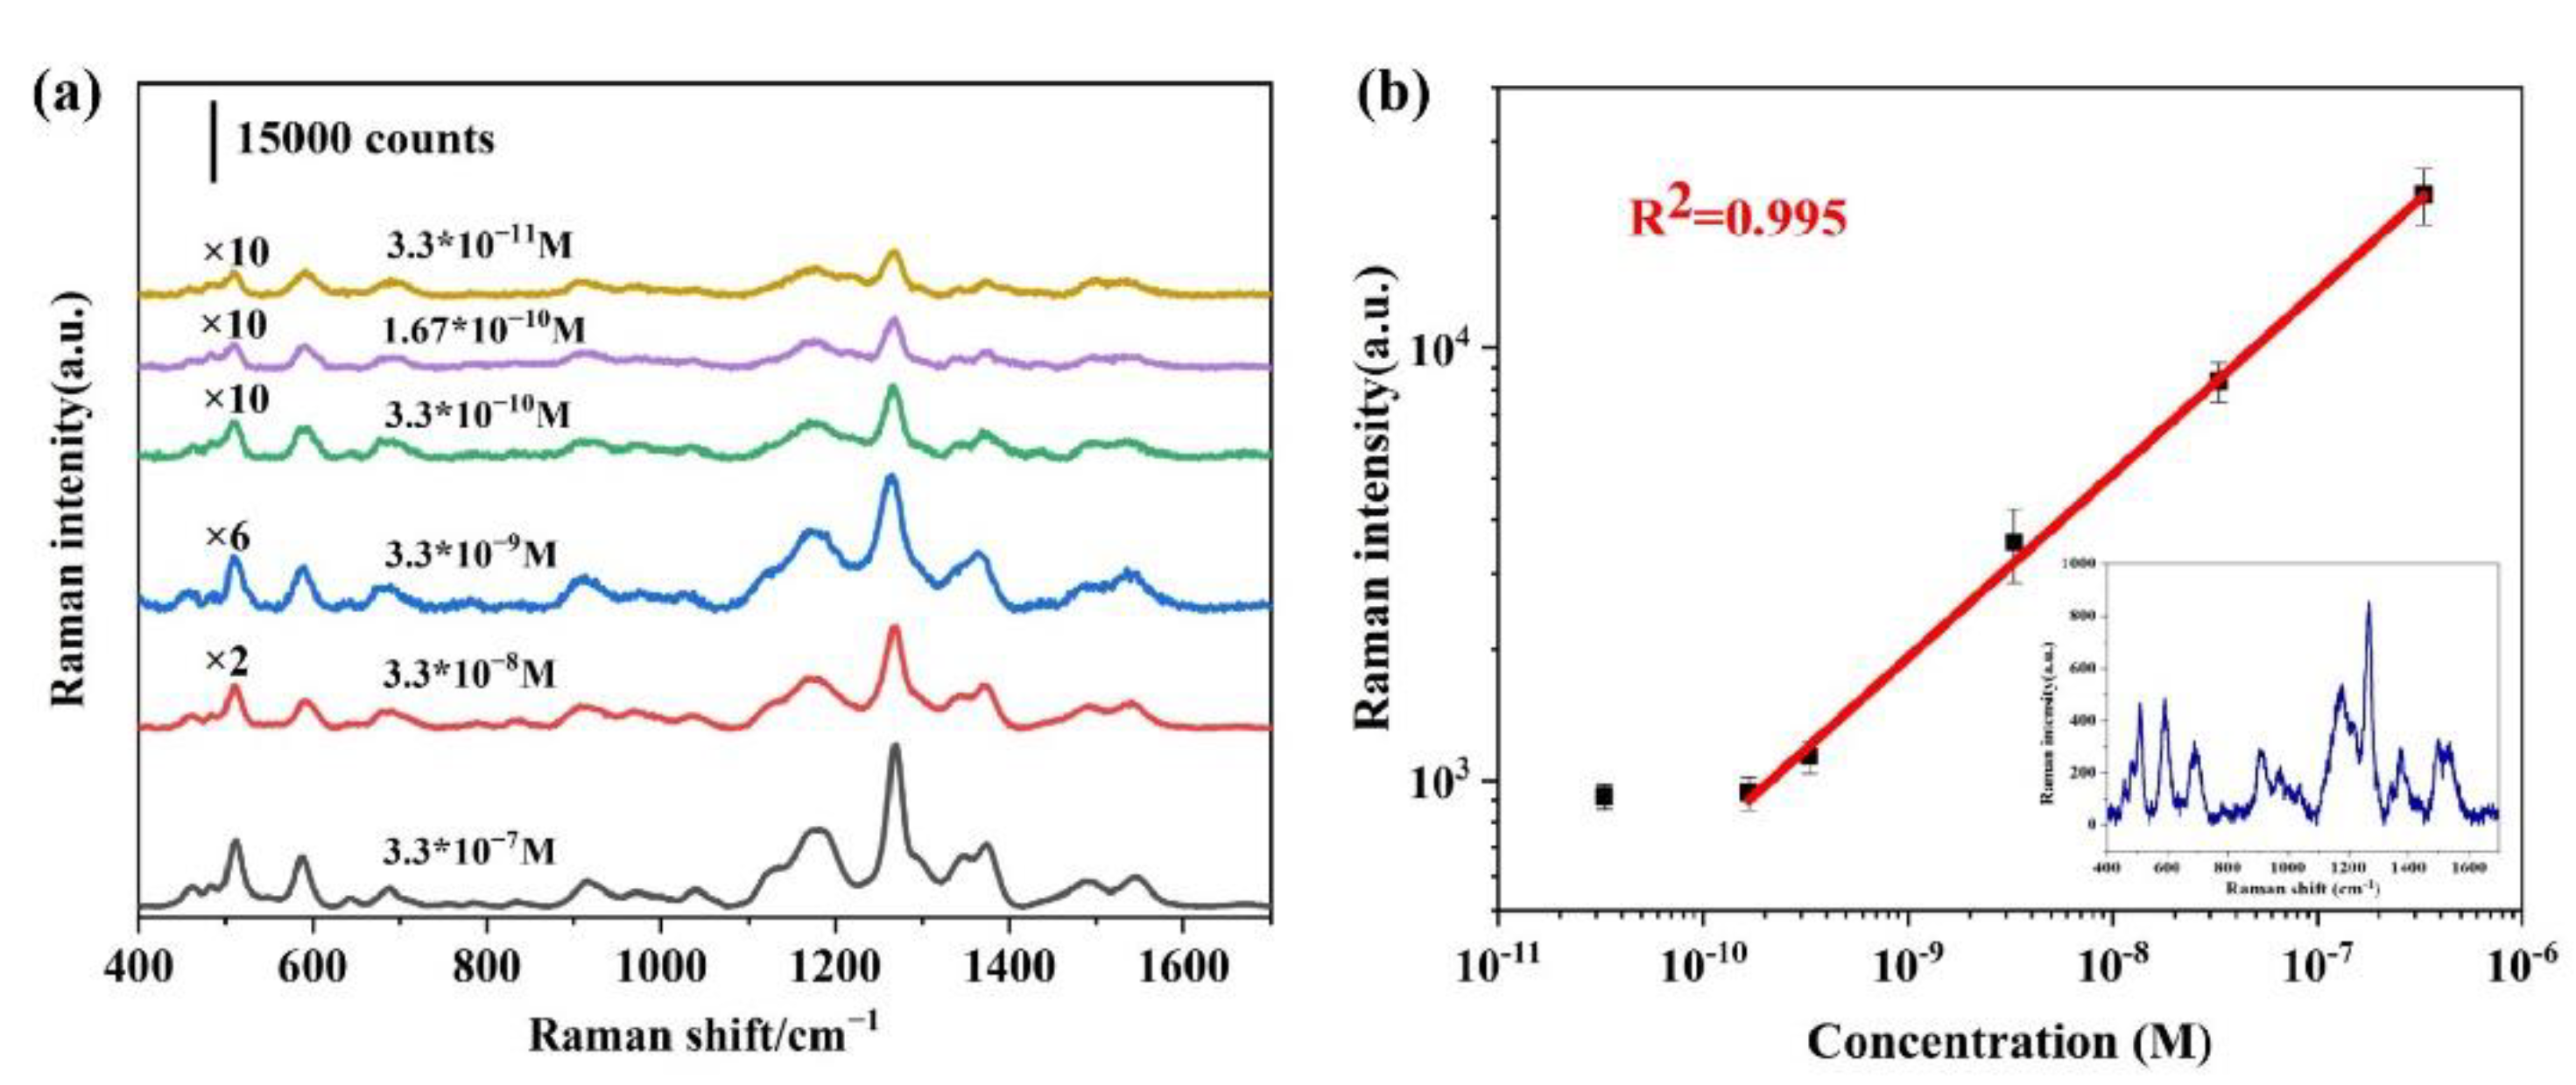
Under the optimized concentration of phosphoric acid, the SERS spectra of TBA-MDA with different concentrations were measured. The results are shown in Figure 7a. The logarithmic intensity of characteristic peak at 1272 cm−1 has excellent linear relationship with the logarithmic concentrations of TBA-MDA, as shown in Figure 7b. The linear detection range was 3.3 × 10⁻⁷ M–1.67 × 10⁻¹⁰ M, the correlation coefficient was 0.995, and the limit of detection (LOD) was lower than 3.3 × 10⁻¹¹ M, shown in the inset in Figure 7b. It should be noted that the concentrations reported here were concentrations of TBA-MDA in the reaction mixture. The detected concentration inside the chip was diluted by 11 times because the flow rate ratio of sample channel to Ag NPs channel was 1:10. The details are shown in Section 2.4. The maximum analytical enhancement factor (AEF) calculated according to the detected concentration was 2.8 × 10⁹. The details are shown in Equation (S1) and Figure S2.
Table 1 shows five MDA detection methods reported in recent years and this work. Our method exhibits wider linear detection range and lower limit of quantification (LOQ) compared with most detection strategies and presents comparable sensitivity with GC-MS.
It is widely established that uniformity and reproducibility are significant advantages of SERS substrates in practical applications. Eighty points on the substrate were randomly selected to characterize the spot-to-spot uniformity, and collected SERS spectra are shown in Figure 8a. The relative standard deviation (RSD) of SERS intensity at 1272 cm−1 was 9.0%. Ten batches of chips were measured to examine the reproducibility and the RSD was 3.9% (Figure 8b), indicating excellent reproducibility of this method.

3.7. MDA Detection in Oil Samples

To further verify the detection capability of the proposed method in a complex environment, MDA in different edible oils such as rapeseed oil, sunflower seed oil and lard were detected. SERS signals of TBA-MDA in different oil samples are shown in Figure 9. Apparently, oil matrices have little effect on SERS signals of TBA-MDA, which makes it a promising method to directly inspect the rancidity of edible oils. Next, the spiked tests were performed. As shown in Table 2, the recoveries are found to be 90.4–109.8% with RSDs of 3.0–8.5% (n = 5) in spiked oil samples, which shows that this method has high sensitivity and reproducibility in the detection of trace MDA in real samples.

4. Conclusions

In this work, a microfluidic SERS sensing chip based on phosphoric acid induced nanoparticles aggregation was proposed for ultrasensitive MDA detection. Phosphoric acid was used as an aggregator to efficiently reduce the spacing of Ag NPs in the formation of MAHSO SERS substrate. The combined effects of MAHSO and narrower gap enhanced the electromagnetic field and greatly improved the detection sensitivity of MDA. In the optimal condition, i.e., pH = 3.8, the linear detection range of MDA was 3.3 × 10⁻⁷ M–1.67 × 10⁻¹⁰ M and the LOD was lower than 3.3 × 10⁻¹¹ M. Since phosphoric acid is the reagent used in the derivatization reaction of TBA and MDA and no extra aggregator is added in the SERS detection, this method shows great specificity and sensitivity in real sample detection. Spiked tests show the recoveries to be 90.4–109.8%. The SERS chip also shows good uniformity (RSD = 9.0%) and batch-to-batch reproducibility (RSD = 3.9%) due to the ultrashort mixing time of merely a few milliseconds, which effectively prevent aggregation of Ag NPs before depositing on the detection area.
These excellent performances of the phosphoric acid enhanced MAHSO SERS chip would make it promising to combine with portable Raman spectrometer for in-field MDA quick testing. It is also expected that a broad range of applications could benefit from the idea of regulating MAHSO SERS chip to achieve ultrasensitive detection.

Supplementary Materials

The following supporting information can be downloaded at: https://www.mdpi.com/article/10.3390/chemosensors10120524/s1, Figure S1: The collected SERS spectra (a) in the experiment of producing TBA-MDA inside the MAHSO chip; (b) standard TBA; (c) standard TBA-MDA; Figure S2: (a) The normal Raman spectrum of 3.3 × 10⁻³ M TBA-MDA acquired by dropping the solution on clean glass sheets for detection. The integral time was 10 s. (b) The SERS spectrum of 3 × 10⁻¹² M of TBA-MDA acquired inside the chip. The integral time was 1 s; Table S1: Correspondence between concentration of phosphoric acid injected to the chip, inside the chip and resulted final pH value; Equation (S1): Definition of SERS enhancement factor (EF).

Author Contributions

Conceptualization, L.Z.; Funding acquisition, L.Z.; Investigation, Y.L., S.W., X.R., H.L. and J.S.; Data acquisition, Y.L., S.W., X.R., H.L. and J.S.; Project administration, L.Z.; Resources, Z.W. and L.Z.; Supervision, Z.W. and L.Z.; Validation, Y.L., S.W. and L.Z.; Visualization, Y.L. and S.W.; Writing—original draft, Y.L. and L.Z.; Writing—review & editing, S.W. and L.Z. All authors have read and agreed to the published version of the manuscript.

Funding

This research was funded by the National Natural Science Foundation of China (61378045) and the Natural Science Foundation of Jiangsu Province (BK20131297).

Institutional Review Board Statement

Not applicable.

Informed Consent Statement

Not applicable.

Data Availability Statement

The data presented in this study are available on request from the corresponding author. The data are not publicly available due to privacy.

Acknowledgments

The authors gratefully acknowledge the financial supports from the National Natural Science Foundation of China (61378045) and the Natural Science Foundation of Jiangsu Province (BK20131297) and gratefully acknowledge the pioneering work of fabricating MAHSO chip done by Hui Lu.

Conflicts of Interest

The authors declare no conflict of interest.

References

  1. Mateos, R.; Lecumberri, E.; Ramos, S.; Goya, L.; Bravo, L. Determination of malondialdehyde (MDA) by high-performance liquid chromatography in serum and liver as a biomarker for oxidative stress: Application to a rat model for hypercholesterolemia and evaluation of the effect of diets rich in phenolic antioxidants from fruits. J. Chromatgr. B 2005, 827, 76–82. [Google Scholar]
  2. Guillén-Sans, R.; Guzmán-Chozas, M. Aldehydes in food and its relation with the TBA test for rancidity. Lipid/Fett 1995, 97, 285–286. [Google Scholar] [CrossRef]
  3. Stefanescu, C.; Ciobica, A. The relevance of oxidative stress status in first episode and recurrent depression. J. Affect. Disord. 2012, 143, 34–38. [Google Scholar] [CrossRef] [PubMed]
  4. Wei, Y.C.; Zhou, F.L.; He, D.L.; Bai, J.R.; Ding, H.; Wang, X.Y.; Nan, K.J. Oxidative stress in depressive patients with gastric adenocarcinoma. Int. J. Neuropsychopharmacol. 2009, 12, 1089–1096. [Google Scholar] [CrossRef] [PubMed] [Green Version]
  5. Michalakeas, C.A.; Parissis, J.T.; Douzenis, A.; Nikolaou, M.; Varounis, C.; Andreadou, I.; Antonellos, N.; Markantonis-Kiroudis, S.; Paraskevaidis, I.; Ikonomidis, I.; et al. Effects of sertraline on circulating markers of oxidative stress in depressed patients with chronic heart failure: A pilot study. J. Card. Fail. 2011, 17, 748–754. [Google Scholar] [CrossRef]
  6. Singh, Z.; Karthigesu, I.P.; Singh, P.; Kaur, R. Use of malondialdehyde as a biomarker for assessing oxidative stress in different disease pathologies: A review. Iran. J. Public Health 2014, 43, 7–16. [Google Scholar]
  7. Ghanem, A.A.; Arafa, L.F.; El-Baz, A. Oxidative stress markers in patients with primary open-angle glaucoma. Curr. Eye Res. 2010, 35, 295–301. [Google Scholar] [CrossRef]
  8. Butterfield, D.A.; Howard, B.; Yatin, S.; Koppal, T.; Drake, J.; Hensley, K.; Aksenov, M.; Aksenova, M.; Subramaniam, R.; Varadarajan, S.; et al. Elevated oxidative stress in models of normal brain aging and Alzheimer’s disease. Life Sci. 1999, 65, 1883–1892. [Google Scholar] [CrossRef]
  9. Kaykhaii, M.; Yahyavi, H.; Hashemi, M. A simple graphene-based pipette tip solid phase extraction of malondialdehyde from human plasma and its determination by spectrofluorometry. Anal. Bioanal. Chem. 2016, 408, 4907–4915. [Google Scholar] [CrossRef]
  10. Giera, M.; Kloos, D.P.; Raaphorst, A. Mild and selective labeling of malondialdehyde with 2-aminoacridone: Assessment of urinary malondialdehyde levels. Analyst 2011, 136, 2763–2769. [Google Scholar] [CrossRef]
  11. Erdelmeier, I.; Gérardmonnier, D.; Yadan, J.C. Reactions of N-methyl-2-phenylindole with malondialdehyde and 4-hydroxyalkenals. Mechanistic aspects of the colorimetric assay of lipid peroxidation. Chem. Res. Toxicol. 1998, 11, 1176–1183. [Google Scholar] [CrossRef] [PubMed]
  12. Korchazhkina, O.; Exley, C.; Spencer, S.A. Measurement by reversed-phase high-performance liquid chromatography of malondialdehyde in normal human urine following derivatisation with 2,4-dinitrophenylhydrazine. J. Chromatogr. B 2003, 794, 353–362. [Google Scholar] [CrossRef] [PubMed]
  13. Mao, J.; Zhang, H.; Luo, J. New method for HPLC separation and fluorescence detection of malonaldehyde in normal human plasma. J. Chromatogr. B Anal. Technol. Biomed. Life Sci. 2006, 832, 103–108. [Google Scholar] [CrossRef]
  14. Korizis, K.N.; Exarchou, A.; Michalopoulos, E.; Georgakopoulos, C.D.; Kolonitsiou, F.; Mantagos, S.; Gartaganis, S.P.; Karamanos, N.K. Determination of malondialdehyde by capillary electrophoresis, application to human plasma and relation of its levels with prematurity. Biomed. Chromatogr 2001, 15, 287–291. [Google Scholar] [CrossRef]
  15. Zinellu, A.; Sotgia, S.; Deiana, L.; Carru, C. Field-amplified sample injection combined with pressure-assisted capillary electrophoresis UV detection for the simultaneous analysis of allantoin, uric acid, and malondialdehyde in human plasma. Anal. Bioanal. Chem. 2011, 399, 2855–2861. [Google Scholar] [CrossRef]
  16. Zhang, D.; Haputhanthri, R.; Ansar, S.M.; Vangala, K.; DeSilva, H.I.; Sygula, A.; Saebo, S.; Pittman, C.U. Ultrasensitive detection of malondialdehyde with surface-enhanced Raman spectroscopy. Anal. Bioanal. Chem. 2010, 398, 3193–3201. [Google Scholar] [CrossRef] [PubMed]
  17. Yan, R.X.; Wang, Z.; Jie, Z.; Gao, R.; Liao, S.; Yang, H.; Wang, F. Gold Nanoparticle Enriched by Q Sepharose Spheres for Chemical Reaction tandem SERS Detection of Malondialdehyde. Sens. Actuators B Chem. 2019, 281, 123–130. [Google Scholar] [CrossRef]
  18. Lu, H.; Zhu, L.; Zhang, C.; Chen, K.; Cui, Y. Mixing assisted “Hot Spots” Occupying SERS Strategy for Highly Sensitive in-situ Study. Anal. Chem. 2018, 90, 4535–4543. [Google Scholar] [CrossRef]
  19. Lu, H.; Zhu, L.; Zhang, C.; Wang, Z.; Lv, Y.; Chen, K.; Cui, Y. Highly uniform SERS-active microchannel on hydrophobic PDMS: A balance of high reproducibility and sensitivity for detection of proteins. RSC Adv. 2017, 7, 8771–8778. [Google Scholar] [CrossRef]
  20. Chen, K.; Lu, H.; Sun, M.; Zhu, L.; Cui, Y. Mixing enhancement of a novel C-SAR microfluidic mixer. Chem. Eng. Res. Des. 2018, 132, 338–345. [Google Scholar] [CrossRef]
  21. Candon, N.; Tuzmen, N. Very rapid quantification of malondialdehyde (MDA) in rat brain exposed to lead aluminium and phenolic antioxidants by high performance liquid chromatography fluorescence detection. Neurotoxicology 2008, 29, 708–713. [Google Scholar] [CrossRef] [PubMed]
  22. Guillén-Sans, R.; Vicario, I.M.; Guzmán-Chozas, M. Further studies and observations on 2-thiobarbituric acid assay (fat autoxidtion) and 2-thiobarbituric acid-aldehyde reactions. Food/Nahrung 1997, 41, 162–166. [Google Scholar] [CrossRef]
  23. Guillén-Sans, R.; Guzmán-Chozas, M. The Thiobarbituric Acid (TBA) Reaction in Foods: A Review. Crit. Rev. Food Sci. Nutr. 1998, 38, 315–350. [Google Scholar] [CrossRef] [PubMed]
  24. Sans, R.G.; Chozas, M.G. Historical aspects and applications of barbituric acid derivatives. A review. Die Phamazie 1988, 43, 827–829. [Google Scholar]
  25. Lane, L.A.; Qian, X.; Nie, S. SERS Nanoparticles in Medicine: From Label-Free Detection to Spectroscopic Tagging. Chem. Rev. 2015, 115, 10489–10529. [Google Scholar] [CrossRef] [PubMed]
  26. Andreou, C.; Hoonejani, M.R.; Barmi, M.R.; Meysam, R.M.; Martin, M.; Carl, D. Rapid detection of drugs of abuse in saliva using surface enhanced Raman spectroscopy and microfluidics. ACS Nano 2013, 7, 7157–7164. [Google Scholar] [CrossRef]
  27. Yang, L.; Yu, B.; Pan, L.; Zhou, B.; Tang, X.; Li, S. Sodium Chloride Crystal-Induced SERS Platform for Controlled Highly Sensitive Detection of Illicit Drugs. Chem.–A Eur. J. 2018, 24, 4800–4804. [Google Scholar]
  28. Yaffe, N.R.; Blanch, E.W. Effects and anomalies that can occur in SERS spectra of biological molecules when using a wide range of aggregating agents for hydroxylamine-reduced and citrate-reduced silver colloids. Vib. Spectrosc. 2008, 48, 196–201. [Google Scholar] [CrossRef]
  29. Liu, Y.; Lu, Z.W.; Zhu, H.; Hasi, W. Characterization of Chloride-activated Surface Complex and Corresponding Enhancement Mechanism by SERS Saturation Effect. J. Phys. Chem. C 2016, 121, 950–957. [Google Scholar] [CrossRef]
  30. Sun, L.; Zhao, D.; Ding, M.; Xu, Z.; Zhang, Z.; Li, B.; Shen, D. Controllable Synthesis of Silver Nanoparticle Aggregates for Surface-Enhanced Raman Scattering Studies. J. Phys. Chem. C 2011, 115, 16295–16304. [Google Scholar] [CrossRef]
  31. Burns, C.; Spendel, W.U.; Puckett, S.; Pacey, G.E. Solution ionic strength effect on gold nanoparticle solution color transition. Talanta 2006, 69, 873–876. [Google Scholar] [CrossRef] [PubMed]
  32. Nunes, F.; Bonifãcio, L.; Araki, K.; Toma, H. Interaction of 2- and 4-mercaptopyridine with pentacyanoferrates and gold nanoparticles. Inorg. Chem. 2005, 45, 94–101. [Google Scholar] [CrossRef] [PubMed]
  33. Grotto, D.; Maria, L.; Boeira, S.; Valentini, J.; Charao, M.E.; Moro, A.M.; Nascimento, P.C.; Pomblum, V.J.; Garcia, S.C. Rapid quantification of malondialdehyde in plasma by high performance liquid chromatography-visible detection. J. Pharm. Biomed. Anal. 2007, 43, 619–624. [Google Scholar] [CrossRef] [PubMed]
  34. Shin, H.S.; Jung, D.G. Sensitive Analysis of Malondialdehyde in Human Urine by Derivatization with Pentafluorophenylhydrazine then Headspace GC–MS. Chromatographia 2009, 70, 899–903. [Google Scholar] [CrossRef]
  35. Yuan, L.; Lan, Y.; Han, M.; Bao, J.; Tu, W.; Dai, Z. Label-free and facile electrochemical biosensing using carbon nanotubes for malondialdehyde detection. Analyst 2013, 138, 3131–3134. [Google Scholar] [CrossRef]
  36. Wang, X.; Liu, X.; Cheng, T.; Li, H.; Yang, X. Development of 4-hydrazinyl-7-nitrobenzofurazan as a fluorogenic probe for detecting malondialdehyde in biological samples. Sens. Actuators B Chem. 2018, 254, 248–254. [Google Scholar] [CrossRef]
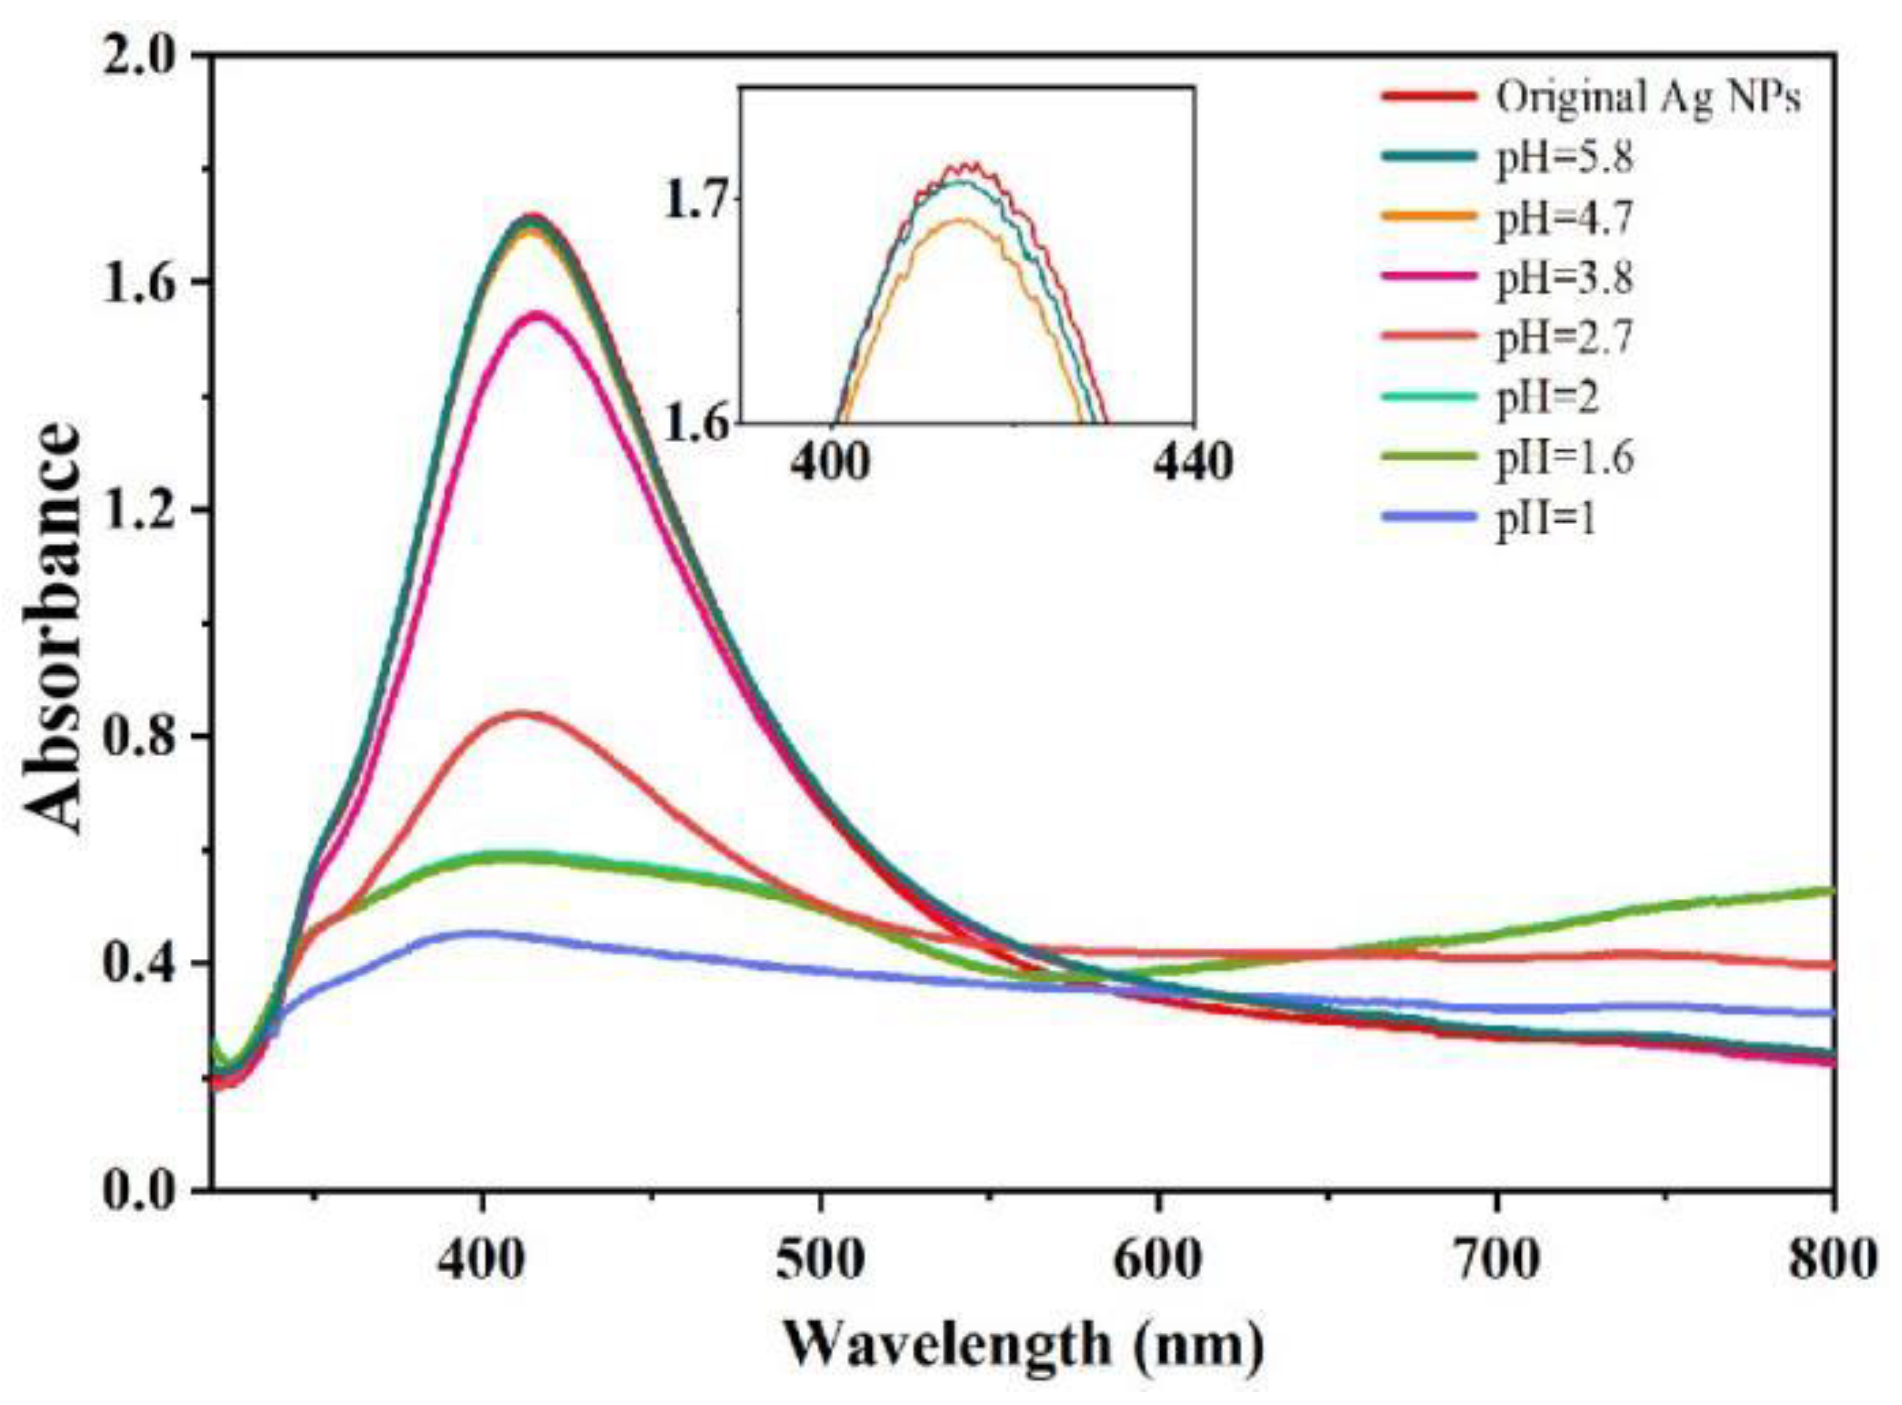
Figure 1. Extinction spectra of Ag NPs with different concentrations of phosphoric acid as the aggregator.
Chemosensors 10 00524 g001
Figure 2. SEM images of substrates with different concentrations of phosphoric acid as the aggregator: (a) 0 mM; (b) 0.02 mM; (c) 0.2 mM; (d) 2 mM.
Chemosensors 10 00524 g002
Figure 3. SERS spectra of 20 mM of MDA, 7 mM of TBA and 0.1 μM of TBA-MDA in the reaction mixture.
Chemosensors 10 00524 g003
Figure 4. Schematic illustration of the process for highly sensitive detection of MDA.
Chemosensors 10 00524 g004
Figure 5. (a) SERS spectra of 3.3 × 10⁻⁷ M TBA-MDA adduct with different concentrations of phosphoric acid as the aggregator (b) SERS intensity of 3.3 × 10⁻⁷ M TBA-MDA adduct at 1272 cm−1 as a function of pH value of solution in the chip.
Chemosensors 10 00524 g005
Figure 6. (a) SERS spectra of adducts of TBA reacted with different aldehydes, black line: MDA, red line: the mixture of MDA, glutaraldehyde, formaldehyde and benzaldehyde; green line: glutaraldehyde; blue line: formaldehyde; cyan line: benzaldehyde (b) SERS intensities at 1272 cm−1 recorded from adducts of MDA, glutaraldehyde, formaldehyde, benzaldehyde and the product of mixture of MDA, glutaraldehyde, formaldehyde and benzaldehyde reacted with TBA.
Chemosensors 10 00524 g006
Figure 7. (a) SERS spectra of TBA-MDA with different concentrations (b) SERS intensity of TBA-MDA at 1272 cm−1 as a function of the MDA concentration. The inset shows the SERS spectrum of TBA-MDA adduct at 3.3 × 10⁻¹¹ M. The concentrations shown here were sample concentrations before injection into the chip.
Chemosensors 10 00524 g007
Figure 8. (a) SERS spectra of 10−7 M TBA-MDA at 80 random points on the SERS chip (b) SERS intensities at 1272 cm−1 acquired from 10 independently fabricated SERS chips.
Chemosensors 10 00524 g008
Figure 9. SERS spectra of TBA-MDA in sunflower seed oil (green line), lard (blue line), rapeseed oil (red line) and deionized water (black line). Real oil samples were prepared following processes in Section 2.5. TBA-MDA concentration was 10−7 M.
Chemosensors 10 00524 g009
Table 1. Five MDA detection methods reported in recent years.
YearDetection StrategyLinear Detection Range
2007 [33]UV-Vis0.28 μM–6.6 μM
2009 [34]GC-MS0.2 μg/L–20 μg/L
2013 [35]Electrochemistry0.1 μM–90 μM
2018 [36]Fluorescence0.1 μM–20 μM
2019 [17]SERS0.33 μM–3.3 mM
this workSERS0.167 nM–0.33 μM
Table 2. Recovery test of MDA in oil samples by spiking different concentrations of MDA.
Oil SampleOriginal Concentration (μM)Added Concentration (μM)Measured Concentration (μM)Recovery (%)RSD (%)
Sunflower seed oil0.10.10.19594.97.7
0.40.517104.38.5
0.70.868109.74.2
Lard0.30.10.407106.94.6
0.40.739109.83.0
0.70.93390.43.2
Rapeseed oil0.20.10.306106.24.3
0.40.56490.95.1
0.70.88097.56.0
Publisher’s Note: MDPI stays neutral with regard to jurisdictional claims in published maps and institutional affiliations.