Abstract
Nowadays, the utilization of a taste sensor with lipid/polymer membranes is one of the most accurate and objective ways to evaluate the tastes of solutions. However, it has been difficult to evaluate uncharged sweet substances, such as sucrose, because the conventional taste sensor uses the potentiometric measurement, which is mainly based on changes in the surface electric charge density of the membrane. Previous studies have reported that a sweetness sensor called GL1 can evaluate the sweetness of sugars and sugar alcohols, and is commercially available for food, beverage, and pharmaceutical industries. However, the response mechanism of GL1 has not been fully elucidated. In this study, we focus on clarifying the effect of concentrations and types of metal ions in the conditioning solution on the response mechanism of the sweetness sensor GL1. Moreover, according to the different concentrations and types of metal ions in conditioning solutions, the complex formation and the hydrated radius were considered to influence the membrane potential measured in a reference solution and the sensor responses. The purpose of this study is to elucidate the response mechanism and improve the selectivity and sensitivity of the sweetness sensor.
1. Introduction
The most common taste felt by humans consists of five basic tastes: saltiness, sourness, umami, bitterness, and sweetness [1,2,3]. The five basic tastes have the following indications on the human body: saltiness indicates the presence or absence of electrolytes; sourness and bitterness are signals of putrefaction and toxicity, respectively; umami indicates the presence of protein; and sweetness indicates the presence of sugars, which provide energy for the body. In the human taste sense, there are sensory organs on the tongue, which work as sensors to perceive the five basic tastes and are called taste buds. Taste buds are composed of approximately 50–150 taste receptor cells [4,5]. In previous studies, the taste mechanisms of taste receptor cells have been partially elucidated [2,3,4,5]. Sweeteners are compounds with different chemical structures and sizes, for example, sugars (such as sucrose), sugar alcohols (such as xylitol), sulfonyl amides (such as saccharin), peptides (such as aspartame), D-amino acids (such as D-tryptophan) and proteins (such as thaumatin). Sweet taste receptors are heterodimeric proteins consisting of two G-protein-coupled receptors (T1R2 and T1R3). The T1R2 and T1R3 heterodimeric receptors are activated by all sweeteners [6,7,8,9]. Sweet-tasting components activate the GPCRs on the top of taste cells and trigger taste transduction. The activation of GPCRs depolarizes taste cells, raises cAMP and Ca2+ concentrations, and, finally, closes basolateral K+ channels to act on the gustatory nerves that are afferent to the brain [10].
Objective evaluations of the quality of liquid samples, such as foods, have been performed worldwide, using electronic tongues (e-tongues) [11,12,13,14,15]. E-tongues with metal- or ion-selective electrodes generally use principal component analysis (PCA) and partial least squares (PLS) analysis to analyze the taste information obtained from the output of the sensors [16,17,18]. E-tongues are also suitable to compare and differentiate liquid samples, i.e., for quality control [19,20,21,22,23]. In general, examinations of sweetness in foods have been developed, such as the near-infrared (NIR) spectroscopy techniques [24,25] and Brix meter (refractometer) [26]. The method of the Brix meter and NIR mainly estimate the amount of sugars, but not the intensity of their sweetness.
At present, a taste sensor is an electronic tongue [14,27,28] that uses lipid/polymer membranes, which can be used to evaluate basic tastes objectively [28]. The lipid/polymer membranes of the taste sensor consist of lipid, polyvinyl chloride (PVC), and a plasticizer as sensing parts. The taste sensors that use several sensor electrodes with lipid/polymer membranes can quantify the intensity of each basic taste with specific physicochemical properties, but differentiate between each substance, which is called “global selectivity” [27,28]. It plays an important role for taste sensors to respond similarly to the human tongue. In the measurement system, a sensor electrode and a reference electrode are used. The outputs of the sensor use the change in membrane potential between the two electrodes, which is caused by the electrical and hydrophobic interactions between the lipid/polymer membranes and taste substances.
It is difficult to develop a sweetness sensor that can detect all sweeteners similarly to sweetness receptors, due to the diverse chemical structures and charged states. Therefore, we divided the sweet substances into three types of sweet substances: uncharged electrolytes (such as sugars), positively charged electrolytes (such as peptides), and negatively charged electrolytes (such as sulfonyl amides), under acidic conditions (most food environments) [29].
As we know, potentiometric sensors are usually used to detect small ions, such as hydrogen (H+), potassium (K+), and chloride (Cl−) ions, but not usually for uncharged species [30]. By now, we have developed sweetness sensors that can detect positively charged, negatively charged, and uncharged sweeteners selectively. Moreover, the sweetness sensor for uncharged sweeteners, such as sugars and sugar alcohols, called GL1, has been commercialized by Intelligent Sensor Technology, Inc., and has been applied to the evaluation of beverages, such as tomato juice [31], citrus juice [32], amazake (a traditional sweet Japanese beverage) [33], and so on. Organic acid was added to the traditional lipid/polymer membrane, resulting in a potential response to uncharged sweet substances. In our previous study, 31 kinds of organic acids were tried as the sweet-responsive substances (SRSs) in the lipid/polymer membrane. The membrane with trimellitic acid added showed the highest sensor response [34]. Moreover, the evaluation of the sensor response, by using the sweetness sensor (GL1), indicated that the sensor needs gallic acid analogs, including carboxyl or phosphate groups, whereas a hydroxyl group or benzene ring structure is not essential [29,34,35]. In addition, the pH of the sample solutions is reported to affect the sensor response. The sensor response of the sweetness sensor decreased at pH 4 or lower and increased at pH 10 or higher [29,34,35]. In addition, it was suggested that in the measurement process, it is necessary for the sensor conditioning solution to include metal ions, or it will not obtain a sensor response [29]. However, improvement in the sensor response is still required compared to the other sensor electrodes, and the response mechanism of uncharged sweeteners has not been fully elucidated yet.
This research is an effort to further clarify the response mechanism of the sweetness sensor (GL1) with lipid/polymer membranes used for uncharged sweeteners, such as sucrose and sucralose, and, finally, to improve the sensor response. We focused on the effect of the conditioning solutions on the sensor responses. Therefore, we used different types and concentrations of metal ions (K+, Na+, Li+, and Ca+), which are used as membrane materials for surface modification in the sensor conditioning solutions during the measurement procedure.
2. Experimental Section
2.1. Reagents
Polyvinyl chloride (PVC), dioctyl phenyl-phosphonate (DOPP), sucrose, potassium hydroxide (KOH), sodium hydroxide (NaOH), lithium hydroxide (LiOH), calcium hydroxide (Ca(OH)2), lithium chloride (LiCl), calcium chloride (CaCl2), and hydrochloric acid (HCl) were purchased from FUJIFILM Wako Pure Chemical Corporation (Osaka, Japan). Tetradodecylammonium bromide (TDAB) was purchased from Sigma-Aldrich Japan K.K. (Tokyo, Japan). Sucralose and trimellitic acid were purchased from Tokyo Chemical Industry Co., Ltd. (Tokyo, Japan). Potassium chloride (KCl), sodium chloride (NaCl), and tartaric acid were purchased from Kanto Chemical Co., Inc. (Tokyo, Japan). The chemical structures of the membrane components are shown in Figure 1.
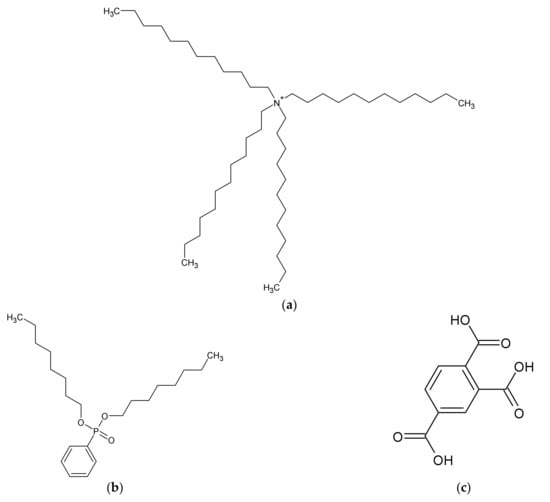
Figure 1.
Structure of membrane components: (a) TDAB; (b) DOPP; (c) trimellitic acid.
2.2. Lipid/Polymer Membrane
The lipid/polymer membranes of the sweetness sensor electrodes are usually composed of a lipid, a plasticizer, an SRS (sweetness-responsive substance), and a polymer supporting reagent. Among 31 kinds of SRSs, trimellitic acid is chosen as the SRS for the sweetness sensor (GL1), which improved the sensor response [34]. In this study, the lipid/polymer membrane of the sweetness sensor was made of tetradodecylammonium bromide (TDAB) as a lipid, dioctyl phnylphosphonate (DOPP) as a plasticizer, PVC as a polymer supporting reagent, and trimellitic acid as an SRS. The mass ratio of trimellitic acid and TDAB is 4.16% and 0.042%, respectively. The membrane is approximately 300–400 µm in thickness. Firstly, the TDAB, DOPP, PVC, and trimellitic acid were mixed in tetrahydrofuran (THF) to make the mixture solution of the lipid/polymer membrane. Secondly, we poured the mixture solution into the 90 mm φ Petri dish. Finally, the lipid/polymer membrane formed about 3 days after the THF volatilized. Before the measurements were taken, we carried out a preconditioning process on the sensors with lipid/polymer membranes, by immersing the sensor membrane in a reference solution (30 mM KCl and 0.3 mM tartaric acid) for 24 h [29,34,35].
2.3. Measurement Procedure of Taste Sensor
The identification of sweetness is determined by the difference in electric potential between a reference electrode and sensor electrodes. To ensure the reproducibility of the experiment, the taste sensor consists of two reference electrodes and eight sensor electrodes with the same lipid/polymer membrane. At the sensor electrodes, a lipid/polymer was cut to a size of approximately 5 mm × 8 mm, and was attached to the hollow part of the probe, which is the reception part of the sensor electrode (Figure 2). Ag/AgCl and saturated potassium chloride (KCl) were injected into the sensor electrode and the reference electrode. The potential difference between the sensor electrode and reference electrode is defined as the membrane potential.
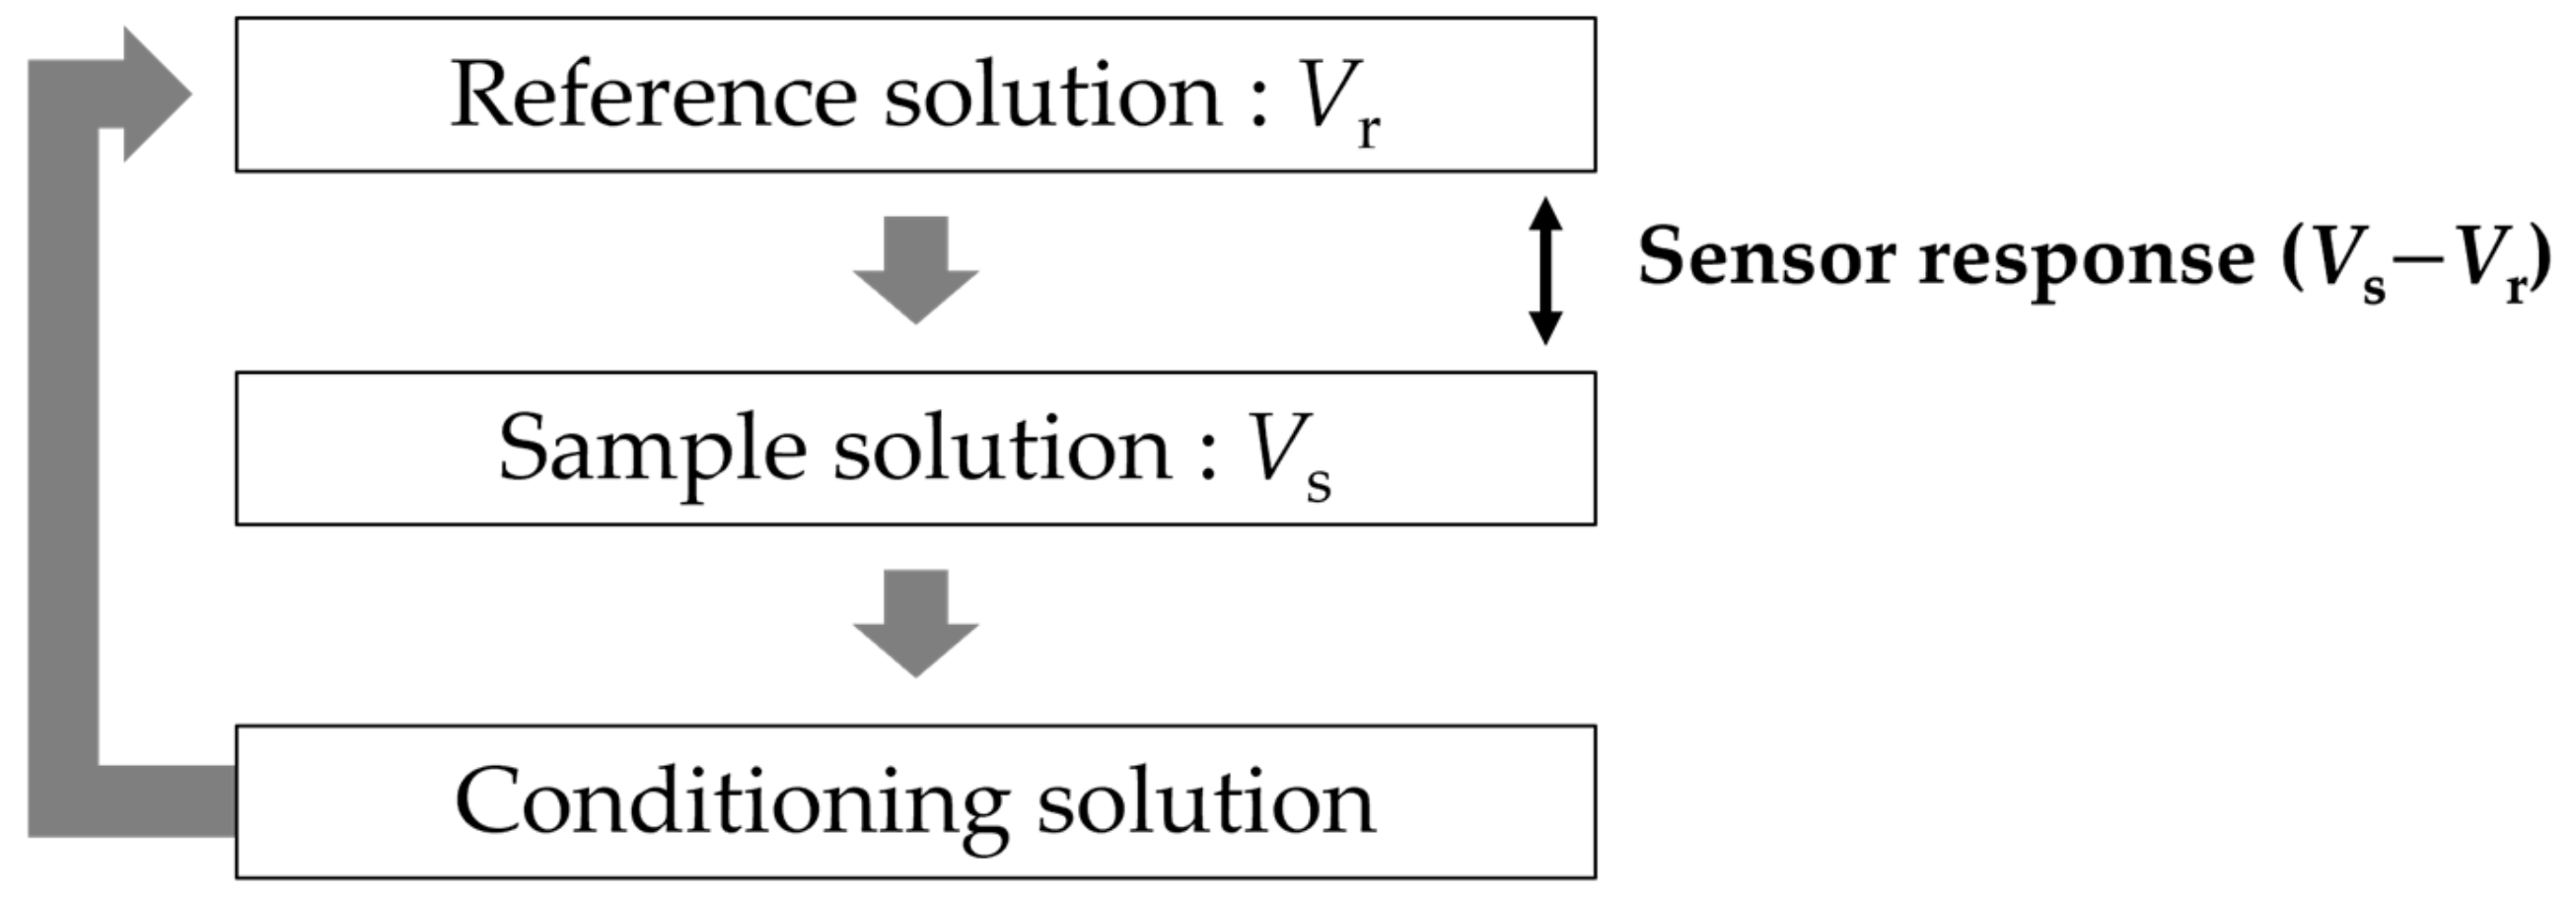
At the same time, the reference electrode was immersed in a saturated potassium chloride solution for 24 h. Figure 3 shows the measurement procedure of the taste sensor. Firstly, we immersed the sensor electrode and reference electrode in a reference solution for 30 s to obtain the membrane potential (Vr). Secondly, the two electrodes were immersed in the sample solution for 30 s to obtain the membrane potential (Vs) of the sample solutions. Finally, the membrane was washed using conditioning solution (10 mM KOH, 100 mM KCl, and 30 vol% EtOH) to refresh the surface of the membrane. The difference in membrane potential between Vr and Vs, which was used as the sensor response, means the changed response caused by the samples (sweet-tasting components). The above measurement procedure is defined as one cycle. Five cycles were conducted for each sample during the actual measurement. We used the average values of the last three cycles of measurement, because the first two cycles of sensor outputs tend to be unstable during the measurement [29,34,35].
In the cases of the other taste sensors, the conditioning solution only has the function of cleaning the membrane, which is also called membrane-washing solution. In the case of the sweetness sensor GL1, the conditioning solution also has the effect of improving the membrane to obtain a higher response to sugars. In this paper, the conditioning solution has the function of washing and modifying the sensor membrane.
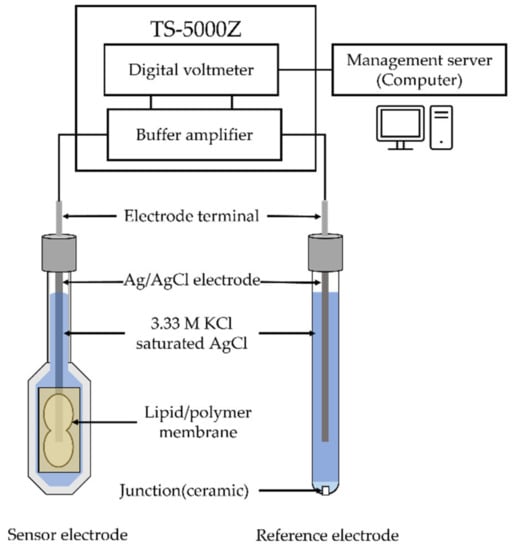
Figure 2.
The diagram of taste sensing system.
Figure 2.
The diagram of taste sensing system.
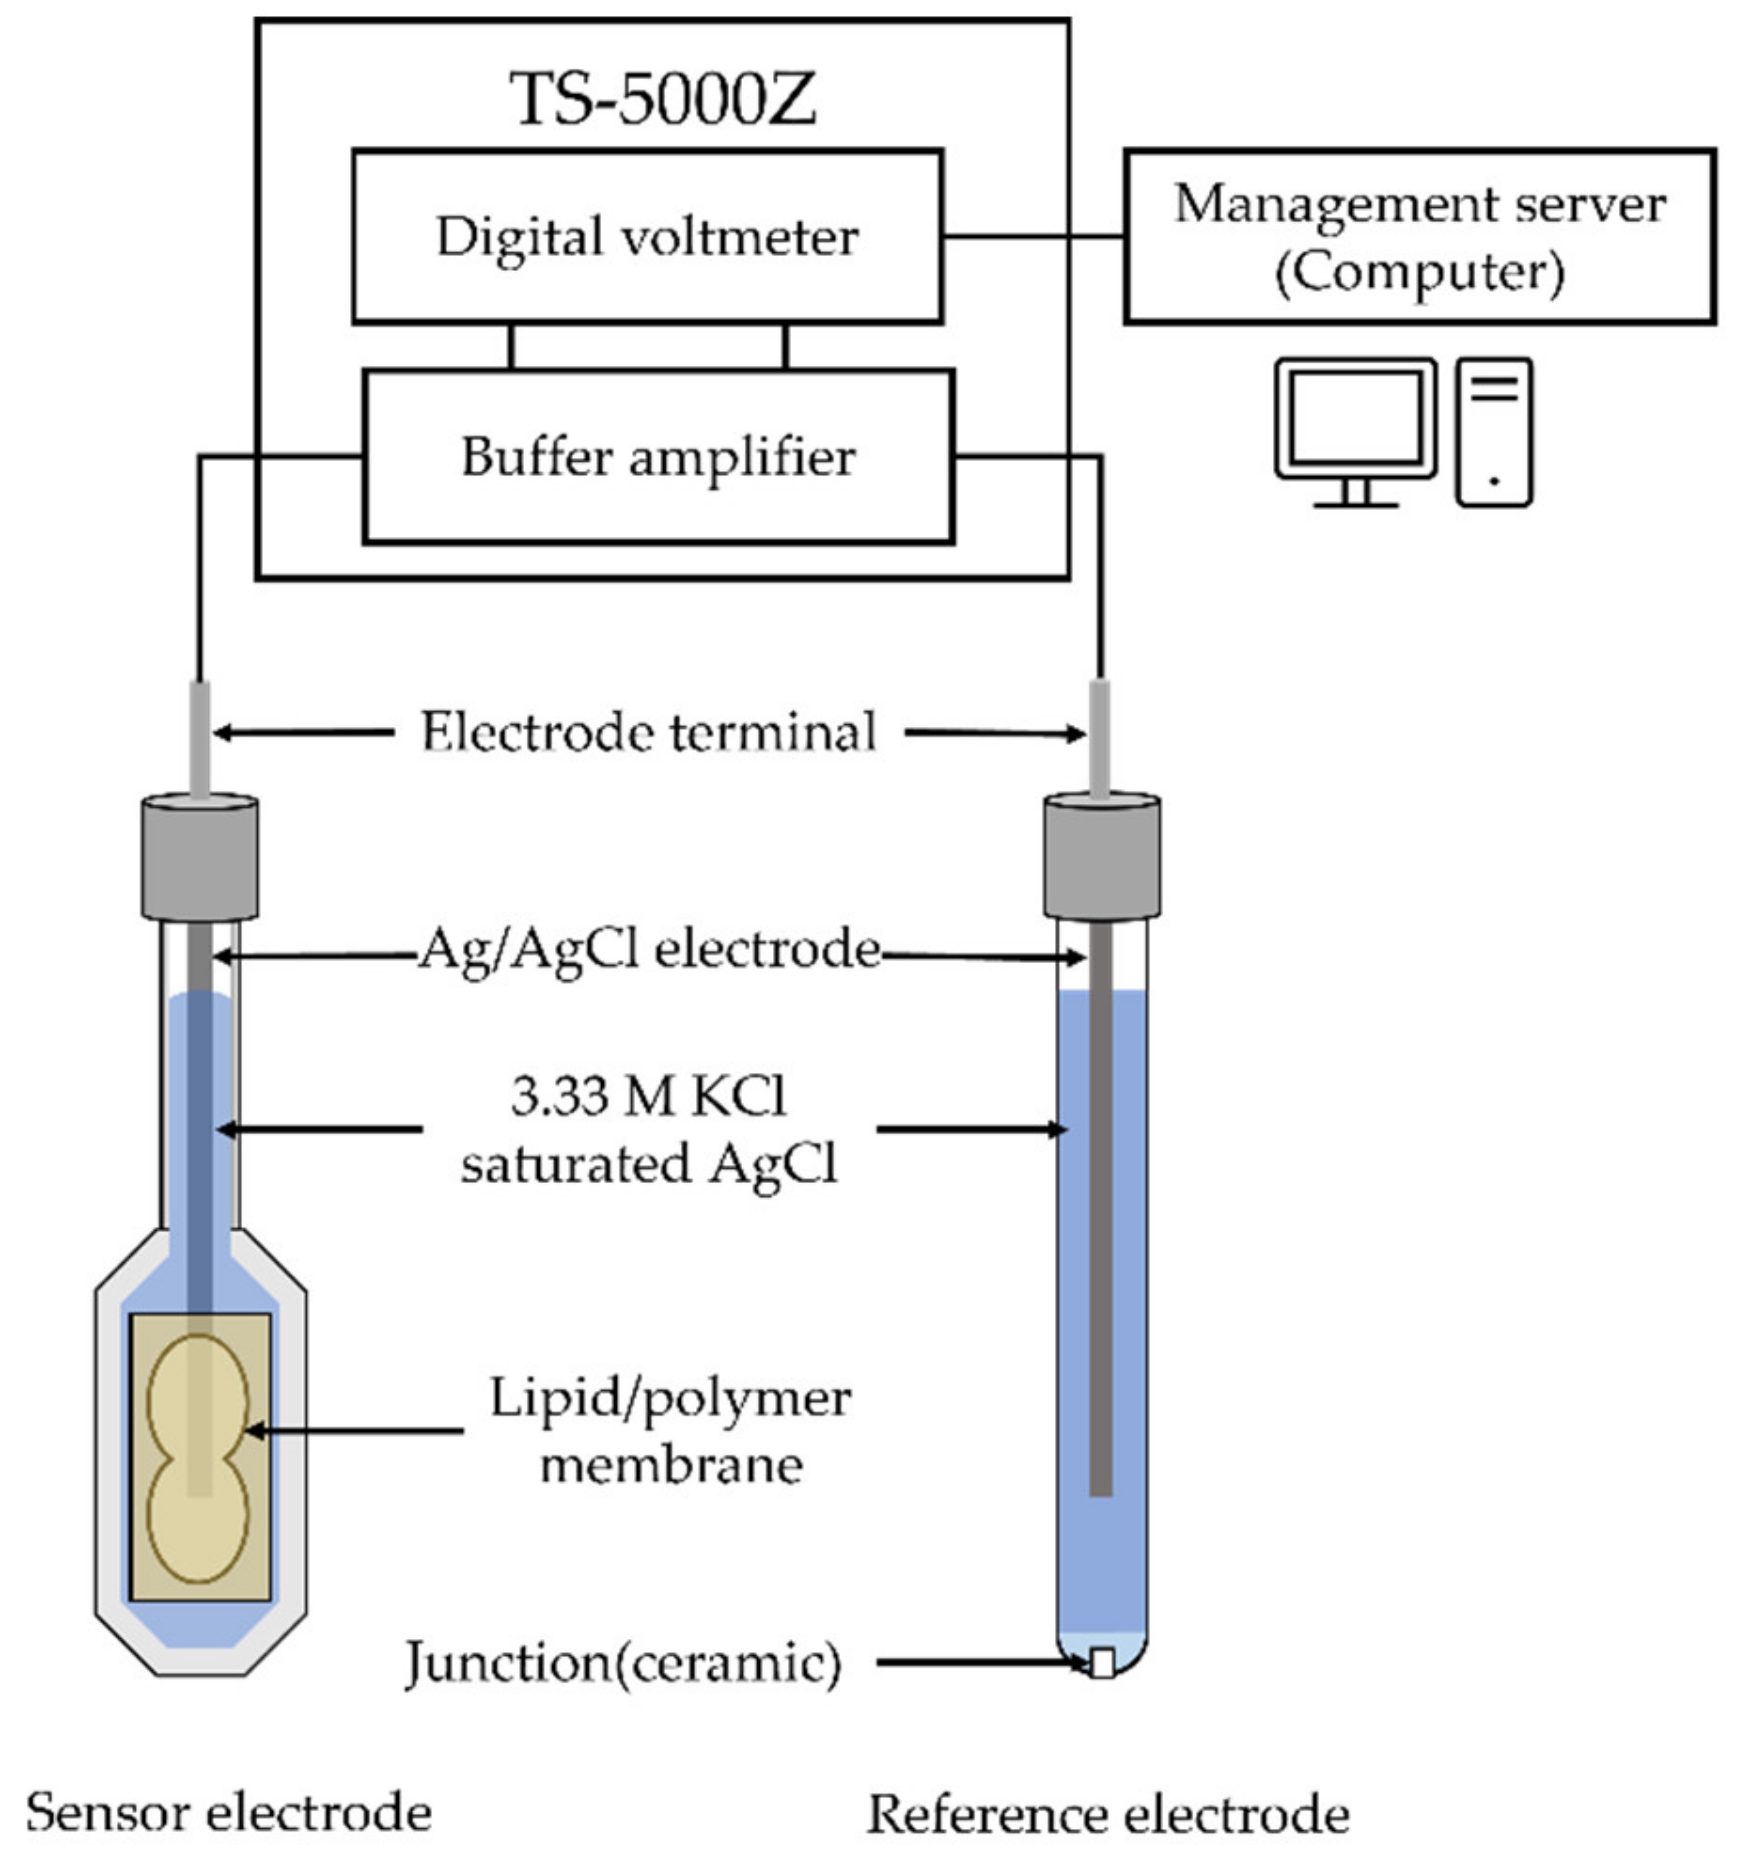

Figure 3.
Measurement procedure of taste sensor.
Figure 3.
Measurement procedure of taste sensor.
2.4. Measurement Samples
The sample solutions of uncharged sweetness substances were prepared by adding them to the reference solution (30 mM KCl and 0.3 mM tartaric acid, pH 3.5). Deionized water was used as the solvent. Sucrose and sucralose are common sweeteners used in commercial beverages. Sucralose is one of the high-intensity sweeteners that is about 600 times sweeter than sugar. According to their different thresholds and degrees of sweetness, we set six concentrations of samples, as shown in Table 1.

Table 1.
Concentration of sucrose and sucralose.
2.5. Effect of Concentrations of Metal Ions in Conditioning Solutions on Sensor Responses
In the previous research, it was reported that it is necessary for the conditioning solution to include metal ions to obtain the sensor response. Therefore, in this study, the conditioning solution is important not only for refreshing the membrane, but also for optimizing the membrane to obtain a higher response. The concentrations of potassium chloride (KCl) in the conditioning solution were set to 0, 50, 100, and 1000 mM to investigate the effect of K+ on the sensor responses and Vr. The conditioning solutions were made by different concentrations of KCl, 30% ethanol and 10 mM KOH (deionized water was used as the solvent).
2.6. Effect of Types of Metal Ions in Conditioning Solutions on Sensor Responses
The purpose of this experiment is to clarify the effect of the type of metal ions included in conditioning solutions on the sensor responses to uncharged sugars. We measured the reference solution and sweet samples (shown in Table 1) and chose four metal ions, Li+, K+, Na+, and Ca2+, as the candidate metal ions. HCl was added in the conditioning solutions containing four kinds of metal ions to maintain the same pH (pH = 12.3). The conditioning solutions, including different types and concentrations of metal ions, are shown in Table 2, e.g., 30 vol% ethanol, 10 mM KOH, and 100 mM KCl.
Table 2.
The composition of different types of metal ions in the conditioning solutions.
3. Results and Discussion
3.1. Influence of Conditioning Solutions on Vr
Figure 4 shows the variations in membrane potential in a reference solution (Vr) during the five cycles using the conventional conditioning solution (10 mM KOH, 100 mM KCl, and 30 vol% EtOH) during the measurement. Vr does not mean the potential of the reference electrode, but the potential difference between the sensor electrode and reference electrode in a reference solution. Firstly, each point represents the Vr after measuring each sample shown in Table 1. According to Table 1, we measured a reference solution and six samples, so there are seven points in one cycle. Figure 4 shows that the Vr increases rapidly during the first two cycles of measurements and becomes stable during the last three cycles. Therefore, the first two cycles are considered dynamic preconditioning, and the sensor responses after the third cycle are considered valid.
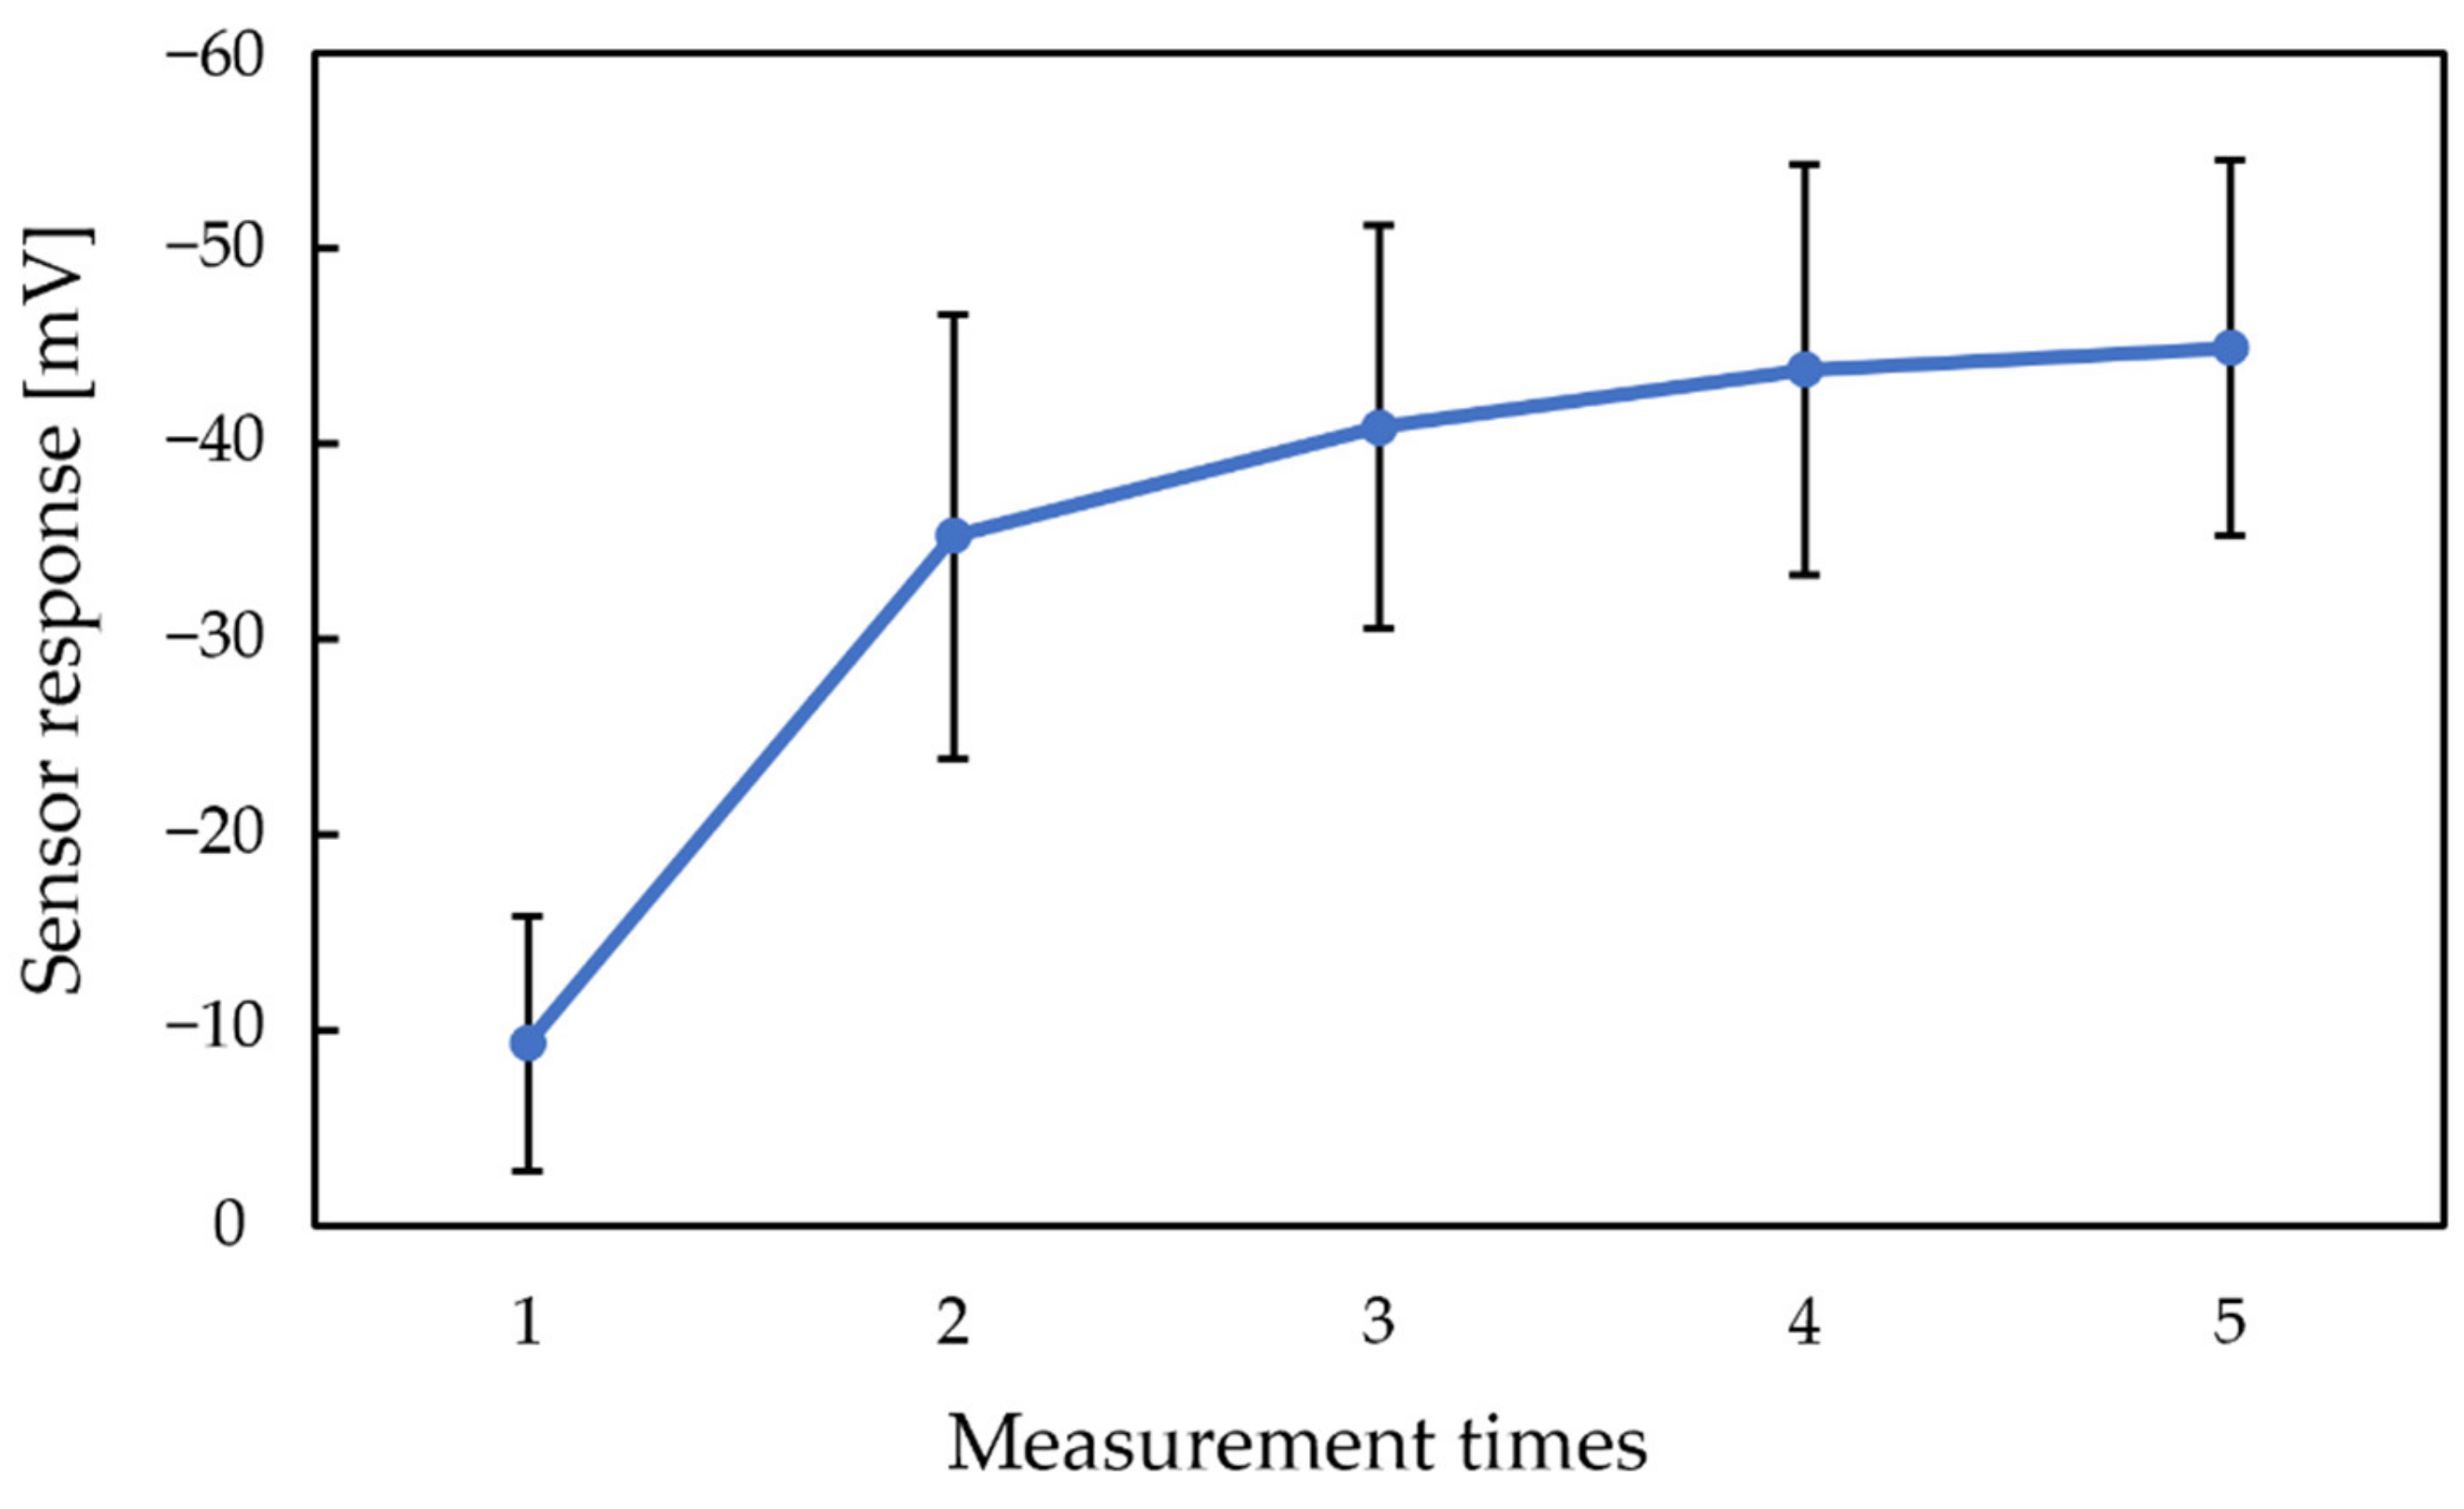
Figure 5 shows the sensor responses of 300 mM sucrose by using the conventional conditioning solution during five cycles. Figure 5 shows that the sensor responses increase with the increasing measurement times, using the conventional conditioning solution.
Figure 4 and Figure 5 show that both the Vr and sensor responses increase with the measurement times. The phenomenon indicated that the rise in Vr was probably caused by metal ions in the conditioning solution, which can be regarded as a modification to the membrane. Consequently, a higher Vr is needed to obtain a higher response of the sweetness sensor. Since the modification by metal ions raised both the Vr and sensor responses, we changed the concentration of K+ in the conventional conditioning solution to investigate its effect on Vr in the next experiment.
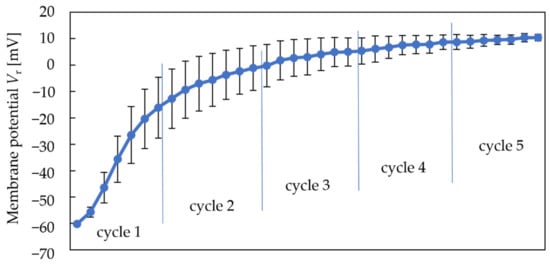
Figure 4.
Change in Vr during five cycles.
Figure 4.
Change in Vr during five cycles.
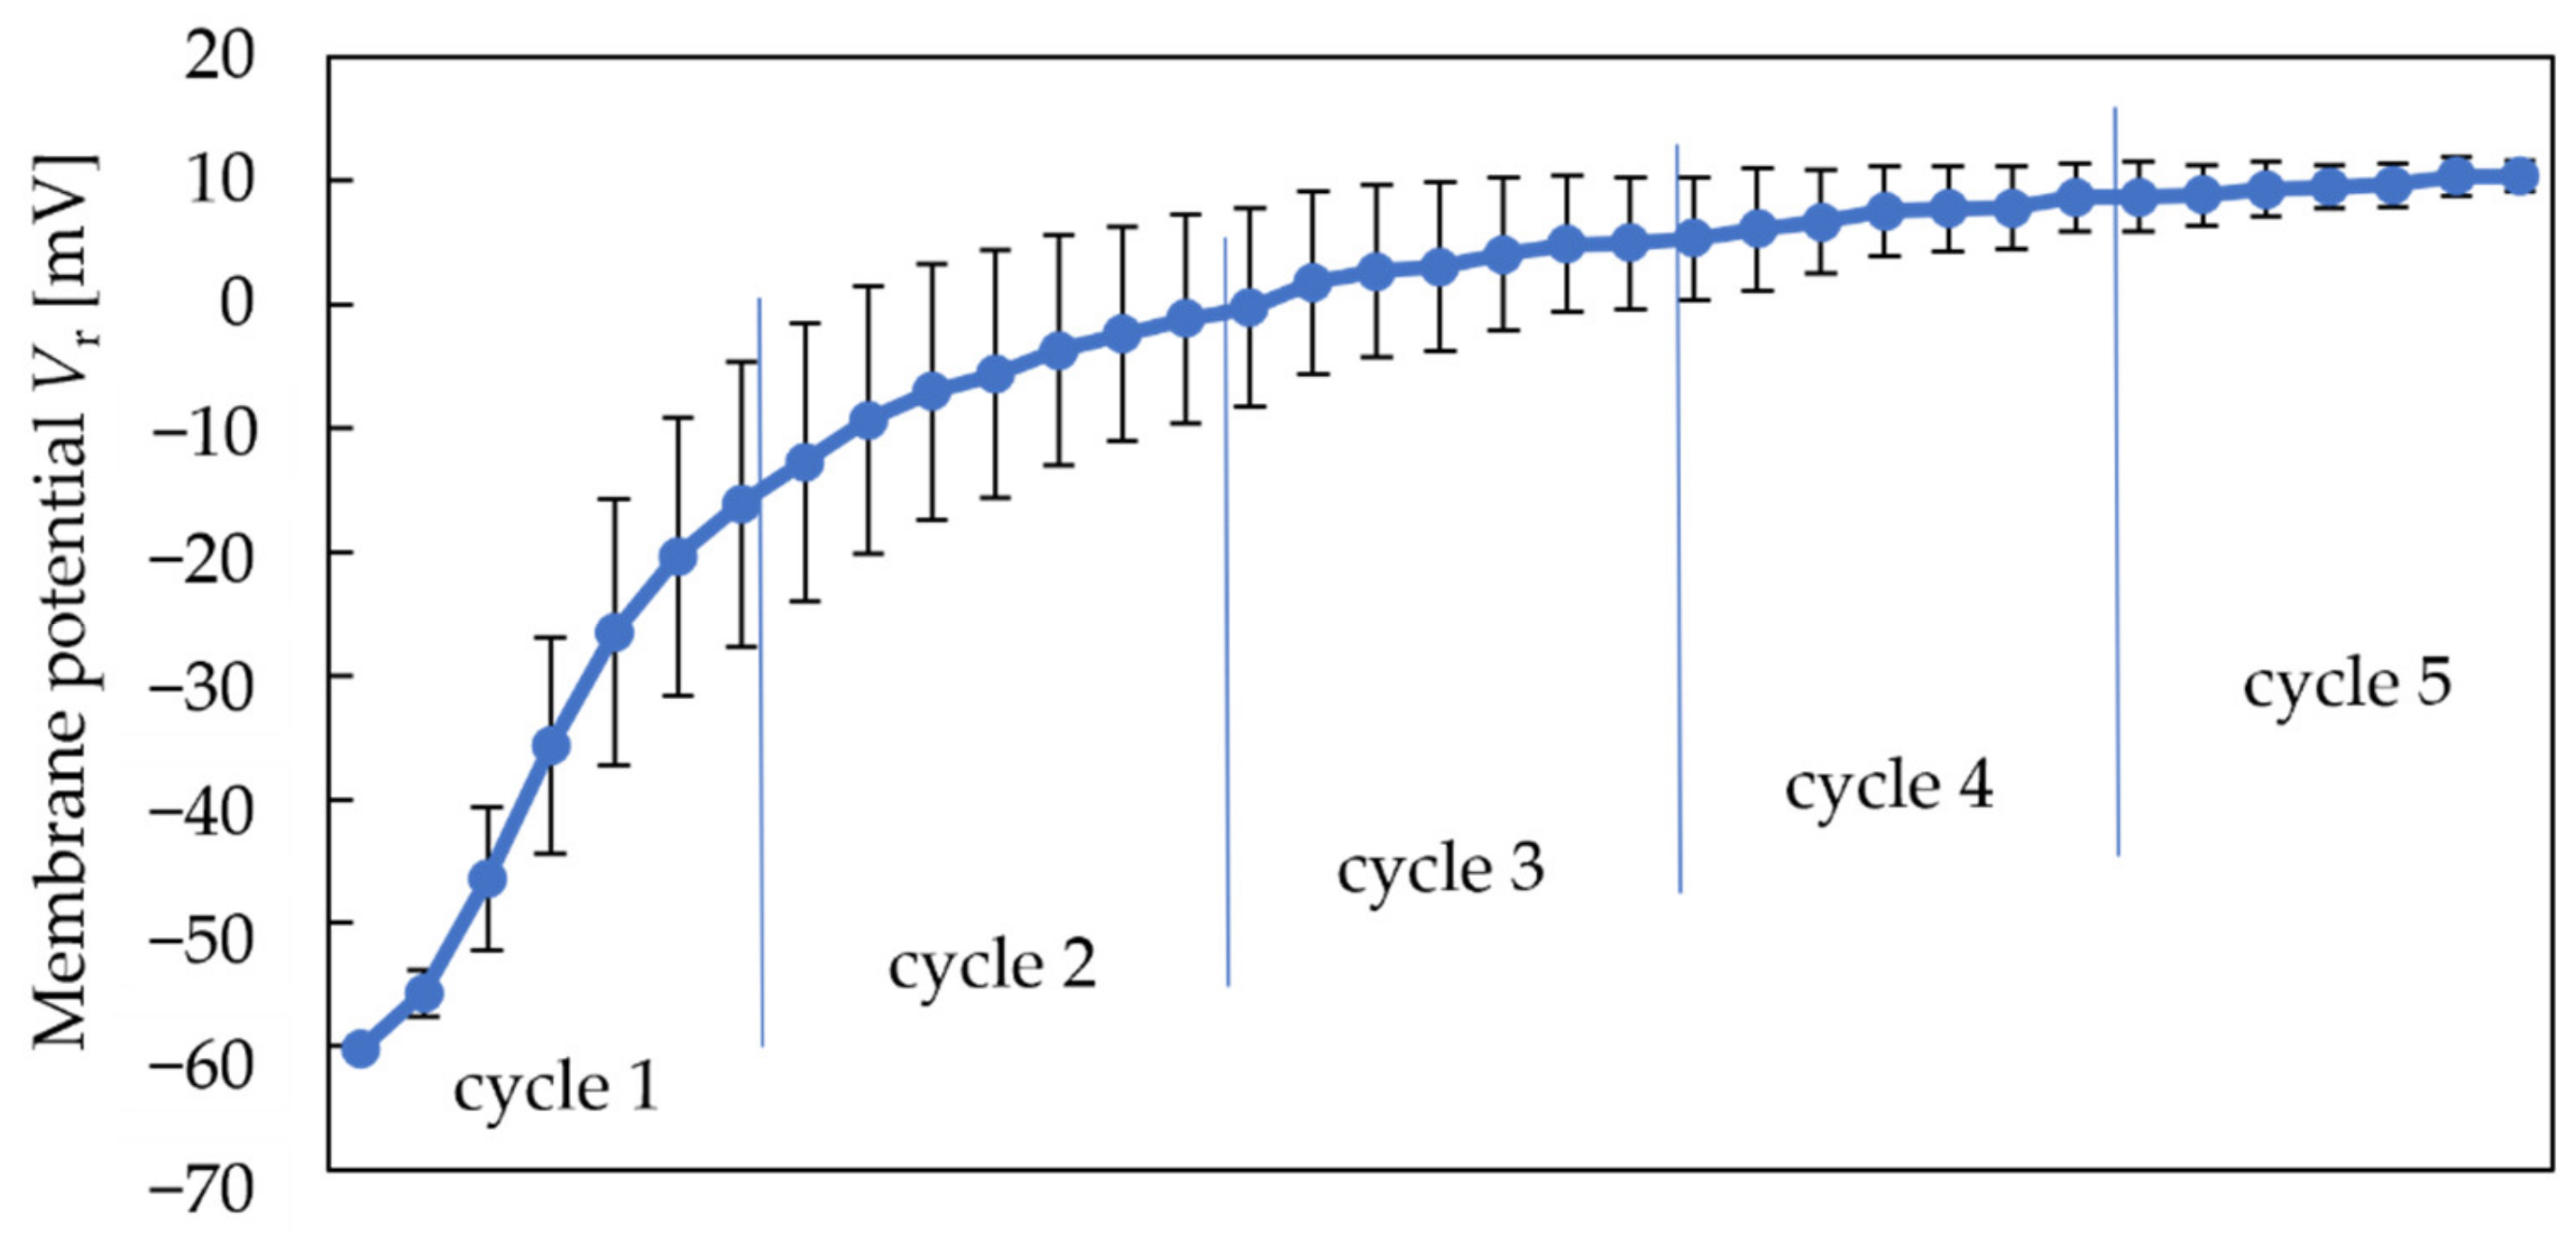

Figure 5.
The sensor response to 300 mM sucrose by using conventional conditioning solution.
Figure 5.
The sensor response to 300 mM sucrose by using conventional conditioning solution.
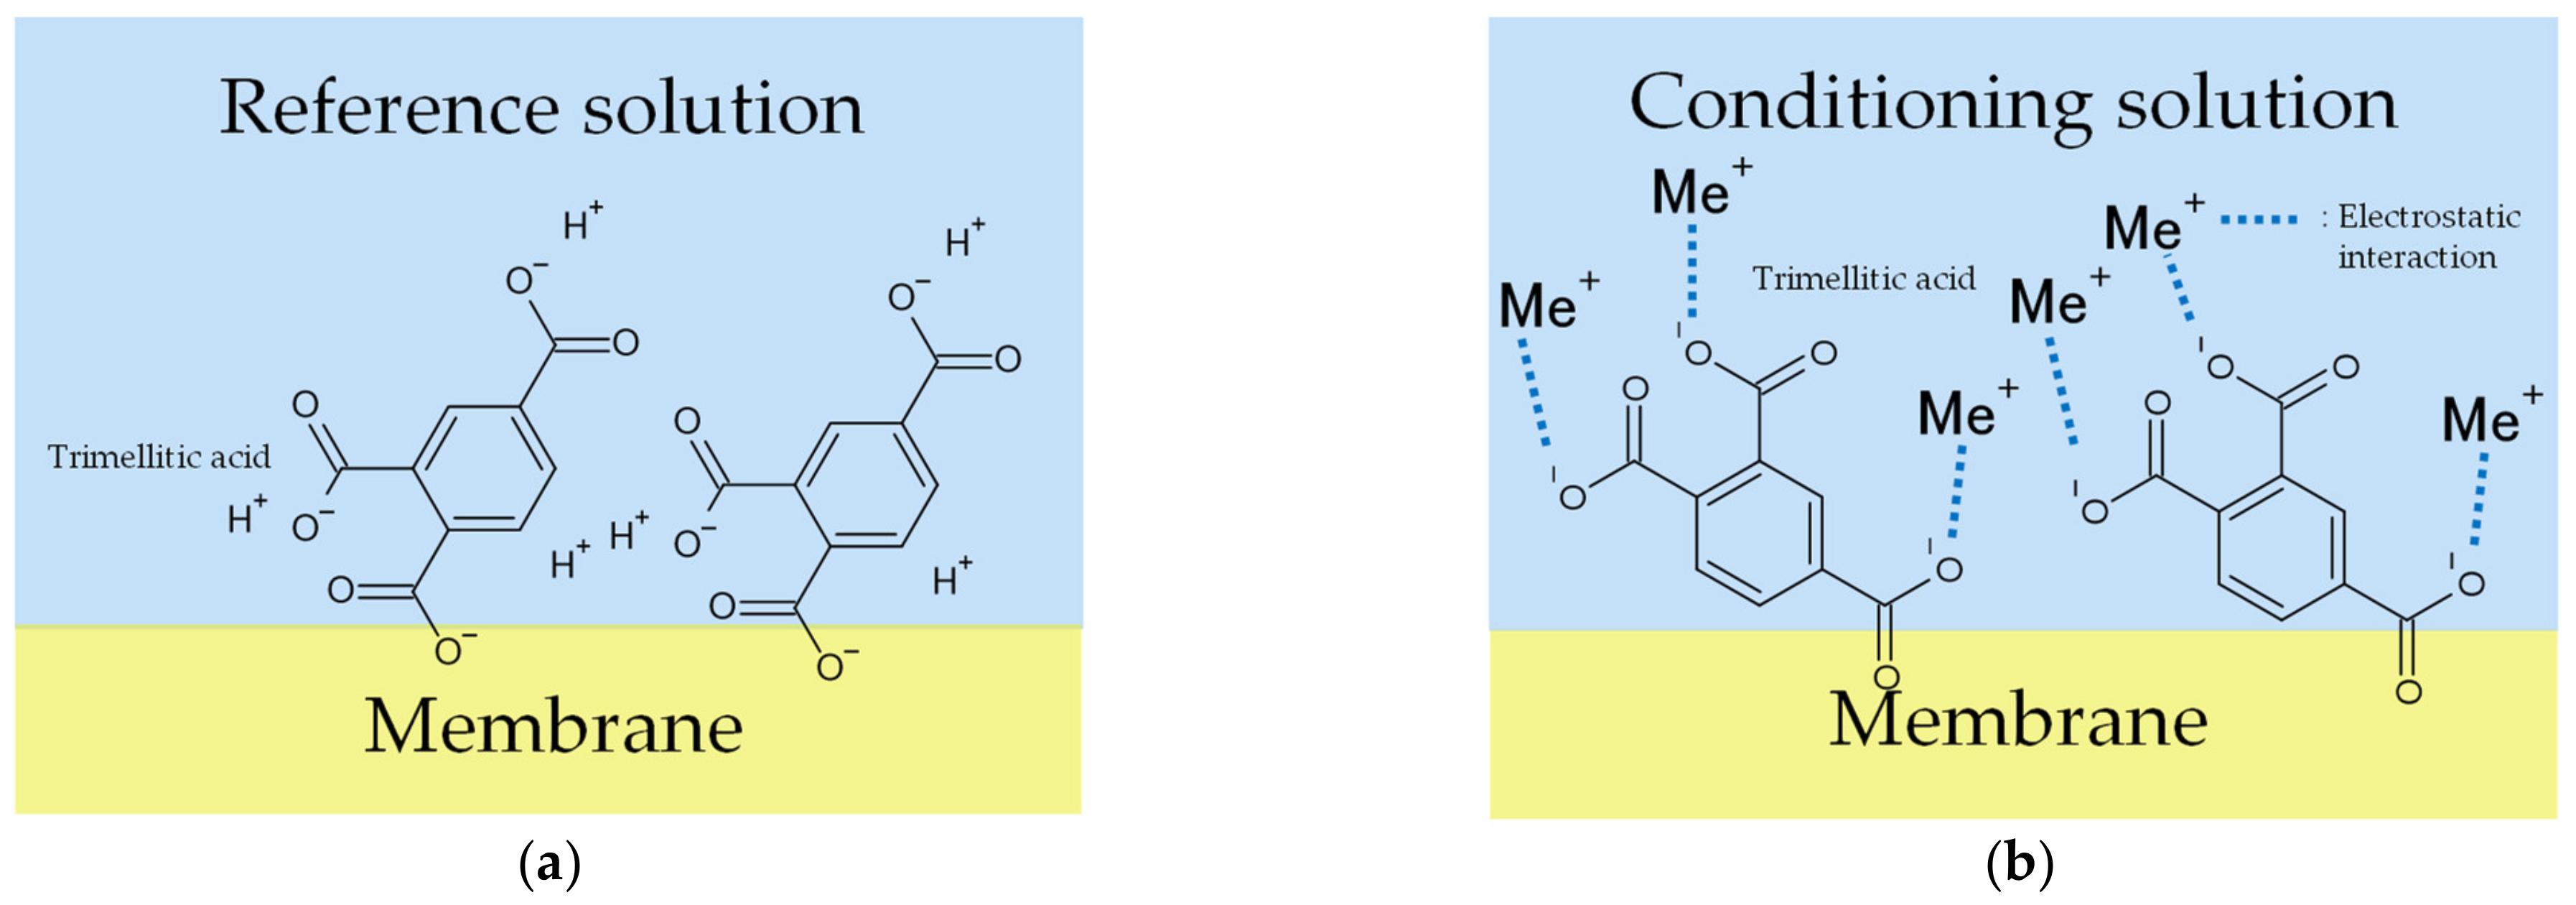
The X-axis in Figure 6 and Figure 7 represents the amount of KCl added to the condition solutions. Figure 6 shows that the more KCl in the conditioning solutions, the higher the Vr will be. The range of the Y-axis is from −19 mV to 15 mV, with the increase in the metal ion concentration in the conditioning solution. Figure 7 shows that the more KCl in the conditioning solutions, the higher the sensor response will be. In general, the results implied that the Vr was relevant to the K+ concentration in the conditioning solutions. For this reason, Figure 6 and Figure 7 raised the possibility that metal ions continue to adhere to the membrane surface, which causes the Vr to increase. TDAB is positively charged and neither DOPP nor PVC are charged. Therefore, it is reasonable to speculate that the trimellitic acid dissociates H+ and becomes the only negatively charged component in the membrane, so that Vr initially shows a negative value (Figure 8a). The phenomenon shows that after the lipid/polymer membrane is washed by a conditioning solution, metal ions, which are the only cations in conditioning solutions, are bonded with the trimellitic acid by electrostatic interactions in the sensor membrane, raising the Vr to a positive value. This can be regarded as a modification to the membrane (Figure 8b). Me+ means the metal ions in the conditioning solution. This phenomenon is not present in other taste sensors, and is considered to be a new kind of response mechanism.
The reference solution contains metal ions, so does the conditioning solution. The reference solution and the conditioning solution, which contain metal ions, have an effect on the Vr. However, the concentration of metal ions in the reference solution is about 30 mM, while the concentration of metal ions in the conditioning solution (KOH 10 mM and KCl 100 mM) is about 110 mM. The quantity of metal ions in the conditioning solution is more than that in the reference solution. Therefore, we conclude that the metal ions in the conditioning solution have a significant effect on the Vr and sensor response of the membrane.
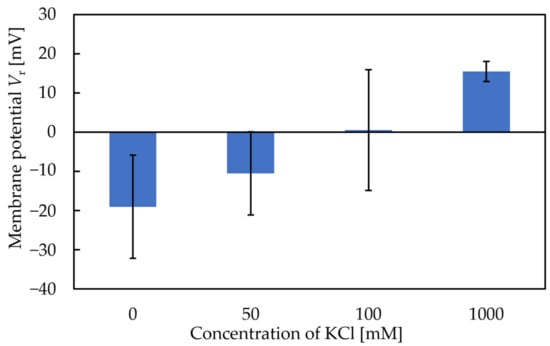
Figure 6.
Vr of conditioning solutions with different KCl concentrations.
Figure 6.
Vr of conditioning solutions with different KCl concentrations.

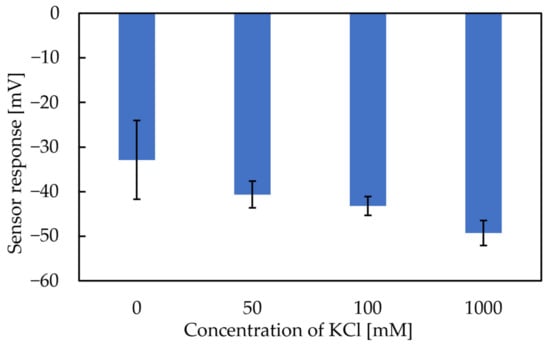
Figure 7.
The sensor response to 300 mM sucrose using conditioning solutions with different concentrations of KCl.
Figure 7.
The sensor response to 300 mM sucrose using conditioning solutions with different concentrations of KCl.
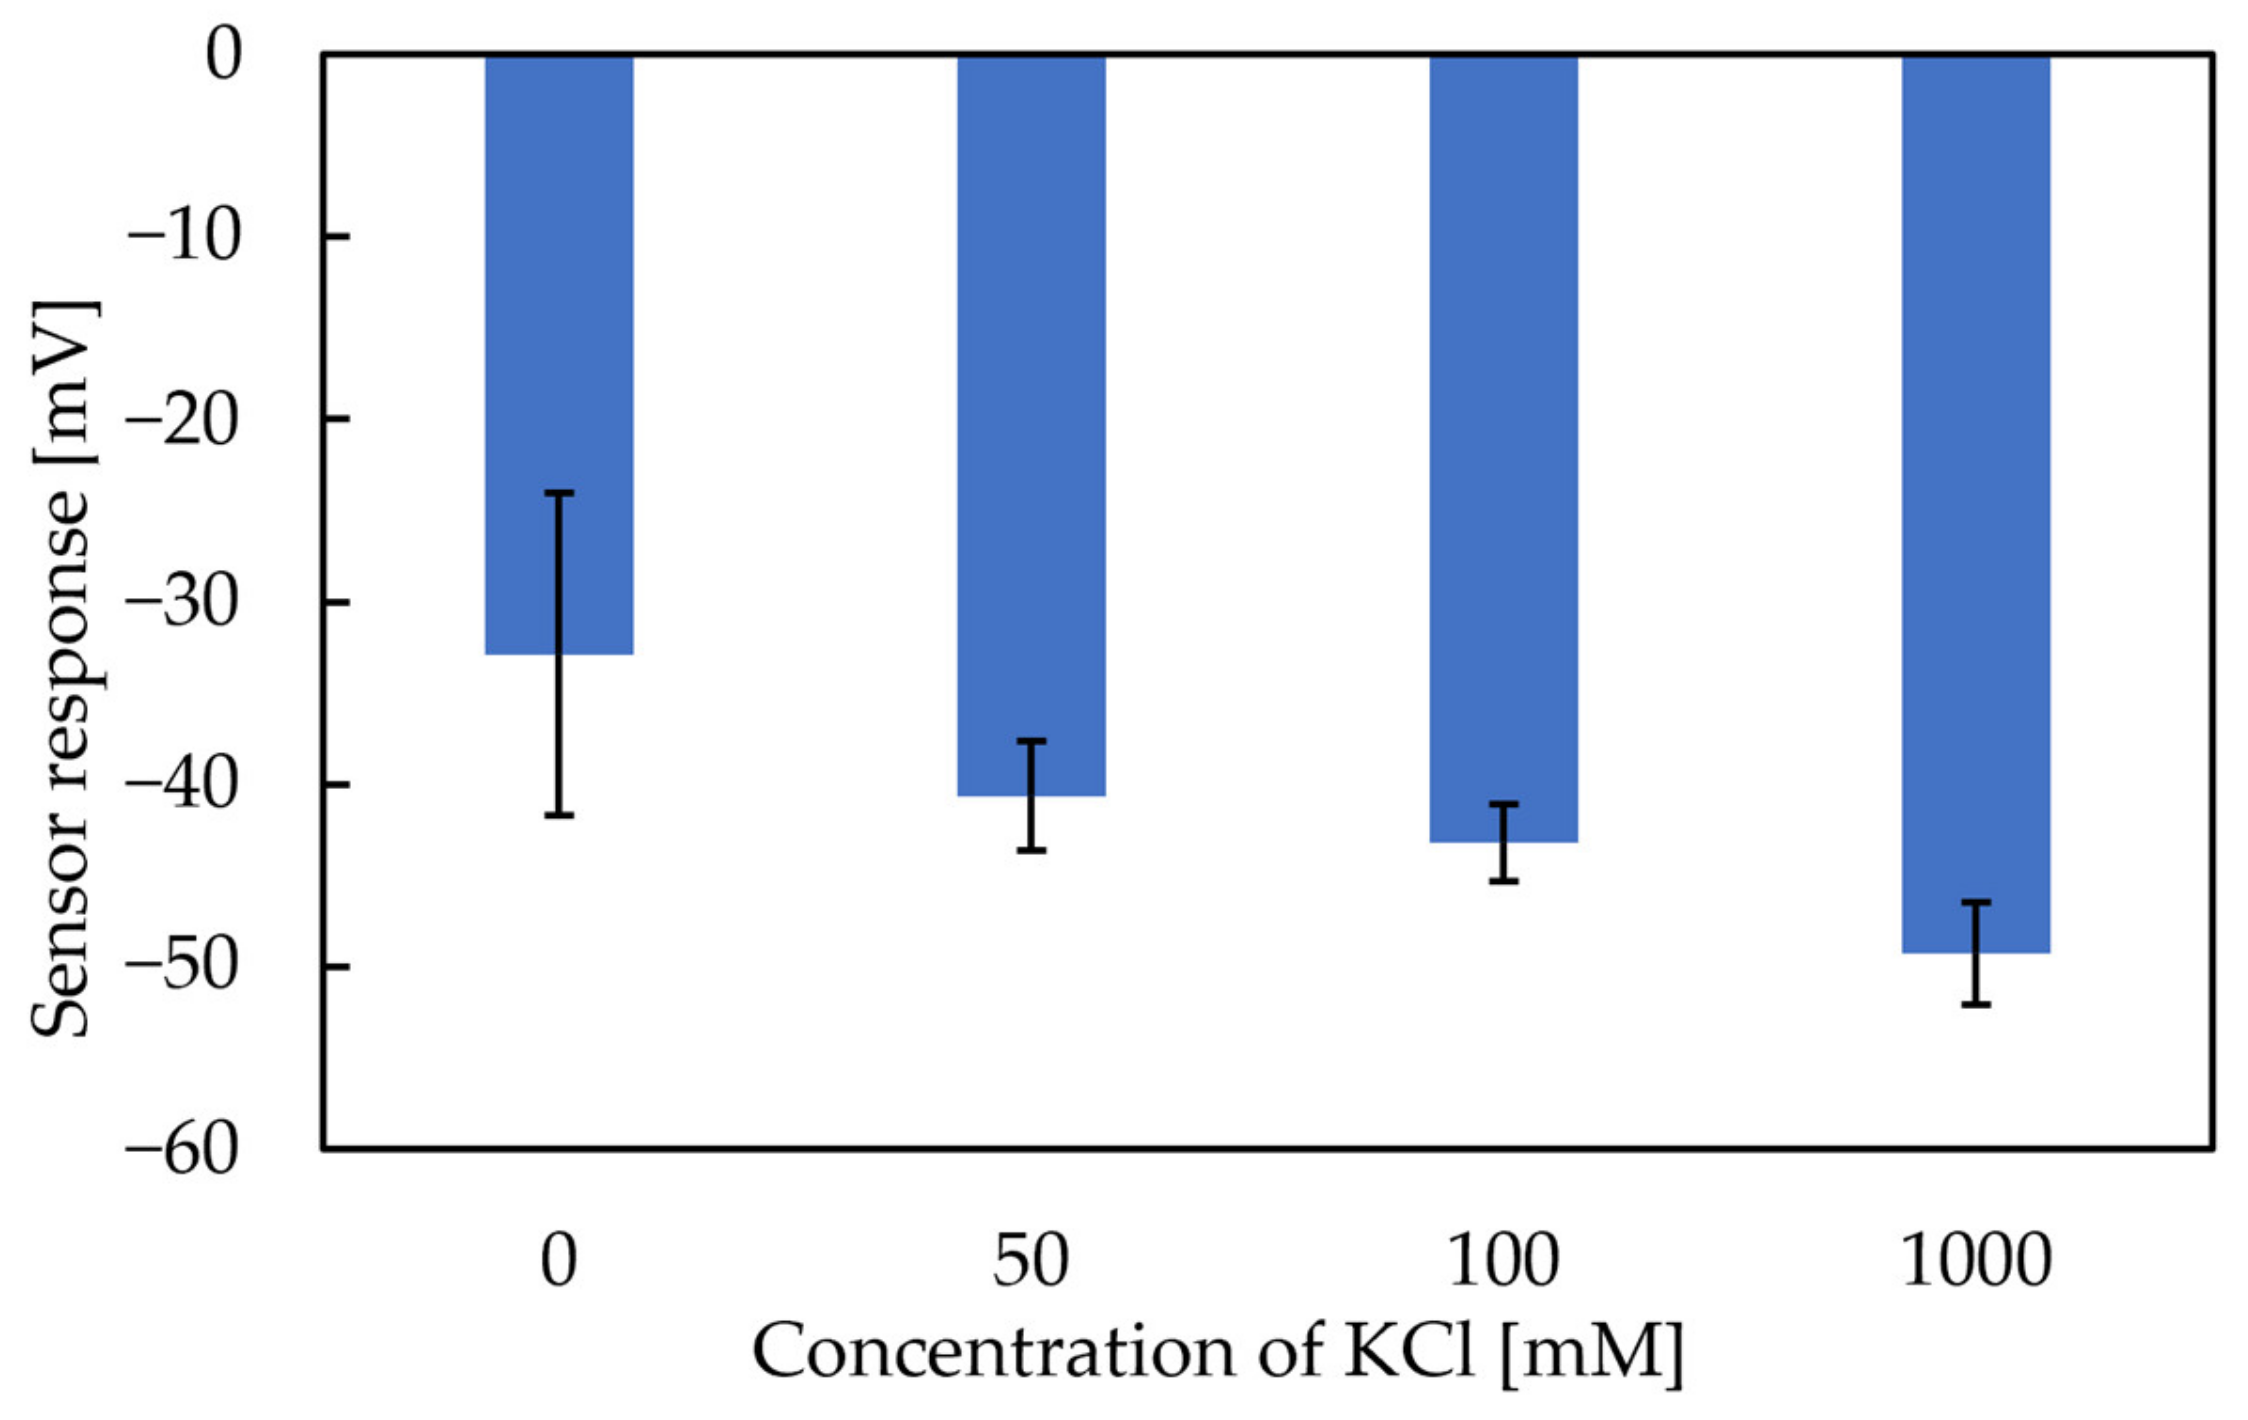
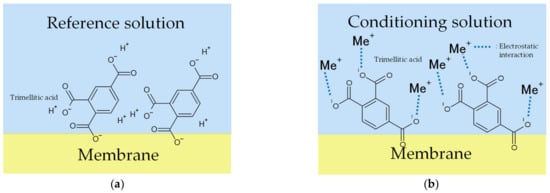
Figure 8.
Models of response mechanism of the sweetness sensor with lipid/polymer membranes: (a) membrane in reference solution; (b) membrane in conditioning solution including univalent metal ions, such as K+.
Figure 8.
Models of response mechanism of the sweetness sensor with lipid/polymer membranes: (a) membrane in reference solution; (b) membrane in conditioning solution including univalent metal ions, such as K+.
3.2. Influences of Conditioning Solutions including Different Types of Metal Ions on Sensor Responses
Figure 9 shows the responses to three concentrations of sucrose and sucralose by using different metal ions in the same pH (pH = 12.3) conditioning solutions. When using the same conditioning solution, the sensor responses to sucrose and sucralose both increase with the increasing concentration of sweeteners. Because sucralose is hundreds of times sweeter than sucrose, the concentrations of sucralose were set lower than sucrose.
As shown in Figure 9, the conditioning solutions including Na+ showed the highest response to sucrose and sucralose in all concentrations. Moreover, the conditioning solutions including K+ showed a higher sensor response than Li+ to sucrose (≥300 mM) and sucralose (≥40 mM) in high concentrations. On the other hand, the conditioning solutions including K+ and Li+ showed almost the same sensor response to sucrose (≤100 mM) and sucralose (≤4 mM) in low concentrations. As for the conditioning solutions including Ca2+, the sensor showed the lowest sensor responses, as well as the highest error bars, to sucrose and sucralose in all concentrations.
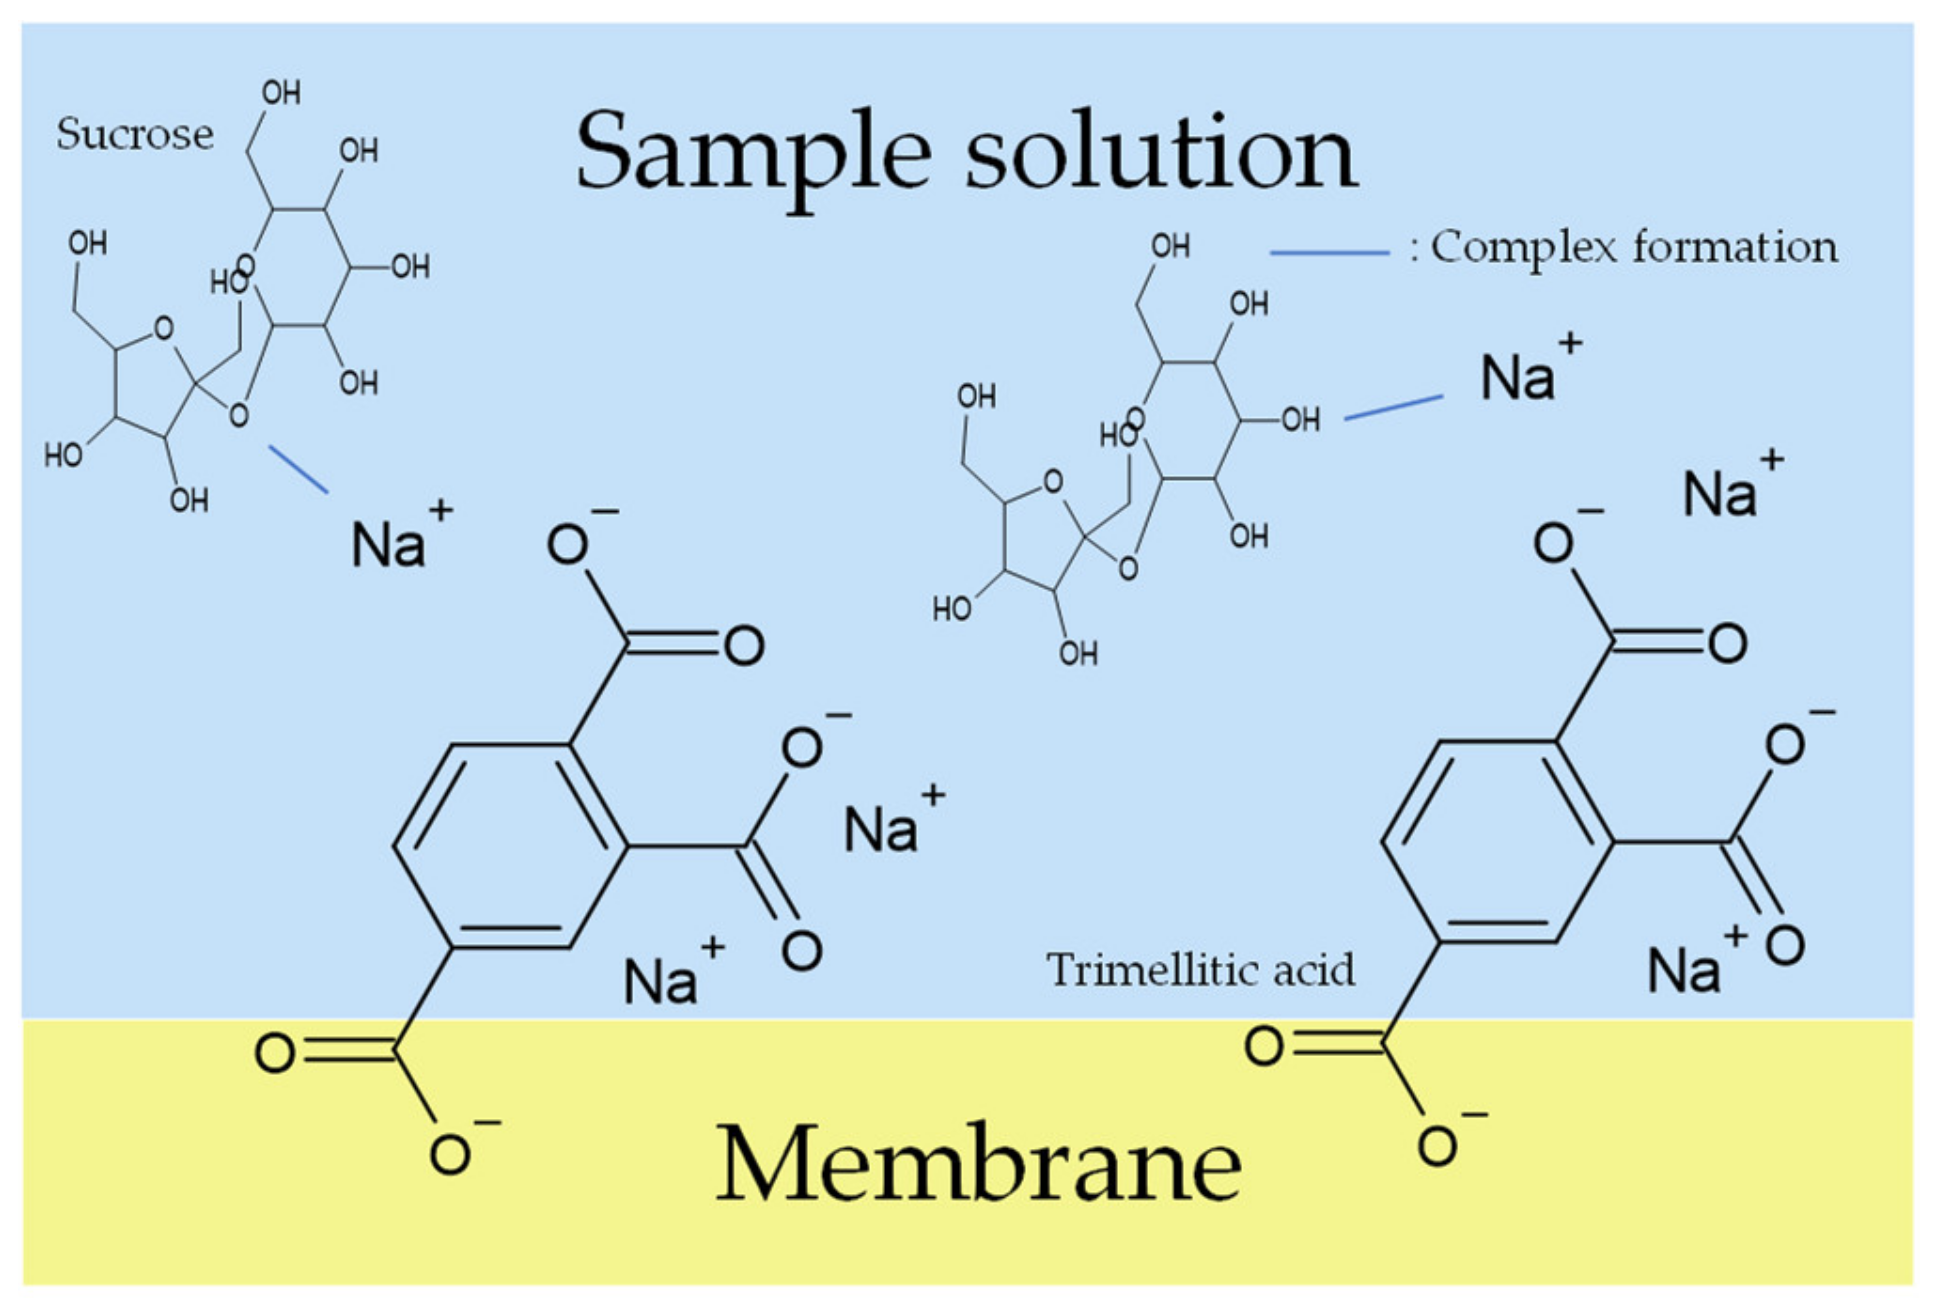
In the case of Na+, we found that complex formation is a possible combination between sugars and metal ions [36]. The ionic radius of the cations is significant for the complex formation. The radius of Na+ is in the best radius range (100–110 pm) for complex formation [36,37]. Therefore, Na+ formed the strongest complex with the hydroxyl groups in sweeteners, which caused the highest sensor response among all the metal ions. The strength of the complex formation among the univalent metal ions is K+, Li+ < Na+ [36,37].
In the case of K+ and Li+, we divided them into two concentration cases, high concentrations (sucrose > 300 mM and sucralose > 40 mM) and low concentrations (sucrose < 300 mM and sucralose < 40 mM). As we all know, the hydrated radius is inversely proportional to the atomic radius. The atomic radius of Li+ is 76 pm and K+ is 138 pm; hence, the hydrated radius of Li+ is bigger than K+. The hydrated radius has the ability to combine with water molecules, so Li+ is easier to bind to water molecules than K+, which made it more difficult for Li+ to bind to the lipid/polymer membrane than K+. From Section 3.1, we know that the experiment data are taken from 3–5 cycles, which are relatively stable. Therefore, before measuring the Vr, sensor electrodes were immersed in the conditioning solution and the metal ions could attach to the surface of the lipid/polymer membrane.
When measuring high concentrations of sweeteners (sucrose > 300 mM and sucralose > 40 mM), according to the complex formation, the sweeteners combine with metal ions on the lipid/polymer membrane surface after the membrane is immersed in the conditioning solutions. When the membrane is immersed in the sample solutions, the uncharged sweeteners pull the metal ions away from the lipid/polymer membrane, which causes a decrease in the Vr, which is regarded as the sensor responses. Figure 10 shows the changes in Vr due to conditioning. As shown in Figure 10, the ability of metal ions to attach to the COO− on the surface of the membrane, which is called the conditioning ability, is Ca2+ < Li+ < K+ < Na+. According to the hydrated radius and changes in Vr (shown in Figure 10), the amount of K+ bonded with more COO− of trimellitic acid than that of Li+; hence, the amount of K+ combined with sweeteners is more than that of Li+. Therefore, the sensor responses using the conditioning solution including K+ were higher than that using Li+ in the case of high-concentration sweeteners. On the other hand, when measuring samples in the case of low-concentration sweeteners (sucrose < 300 mM and sucralose < 40 mM), there are only a few sweeteners that can combine with a few metal ions on the lipid/polymer membrane. Therefore, in the case of measuring sweeteners at low concentrations, the conditioning solutions including K+ and Li+ show almost the same sensor responses.
In the case of Ca2+, as we know, divalent cations form stronger complexes than univalent cations, as usual [36], so the conditioning solution including Ca2+ should obtain the highest sensor responses, but actually obtain the lowest. There are two reasons to explain the results. Firstly, as we know, trimellitic acid has two neighboring carboxyl groups and it dissociates into COO− in solutions. If the membrane is immersed in the conditioning solution including Ca2+, the Ca2+ will ionically bond with the neighboring two COO−; the repulsive force acting between the neighboring Ca2+ could be stronger than the other univalent metal ions (Figure 11). Therefore, only a few Ca2+ can bind to trimellitic acid, which causes a few combinations with Ca2+ and the low Vr (Figure 12). Secondly, the sensor responses to the sample solutions are consistent with the ability of metal ions to form complexes other than Ca2+. In addition, the error bars of the Ca2+ conditioning solution were large because Ca2+ has low solubility and the washing solution was a suspension.
Generally, in the case of metal ions such as Li+, K+ and Na+, they can completely dissolve and keep the same metal ion concentration in the conditioning solutions. The factors that affect the sensor response are the best radius range (100–110 pm) for complex formation and the hydrated radius. The effect of the best radius range (100–110 pm) for complex formation is larger than the hydrated radius.
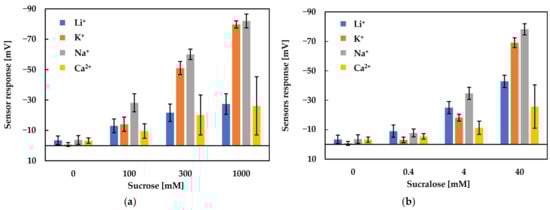
Figure 9.
Sensor response to sweet substances: (a) sucrose; (b) sucralose.
Figure 9.
Sensor response to sweet substances: (a) sucrose; (b) sucralose.
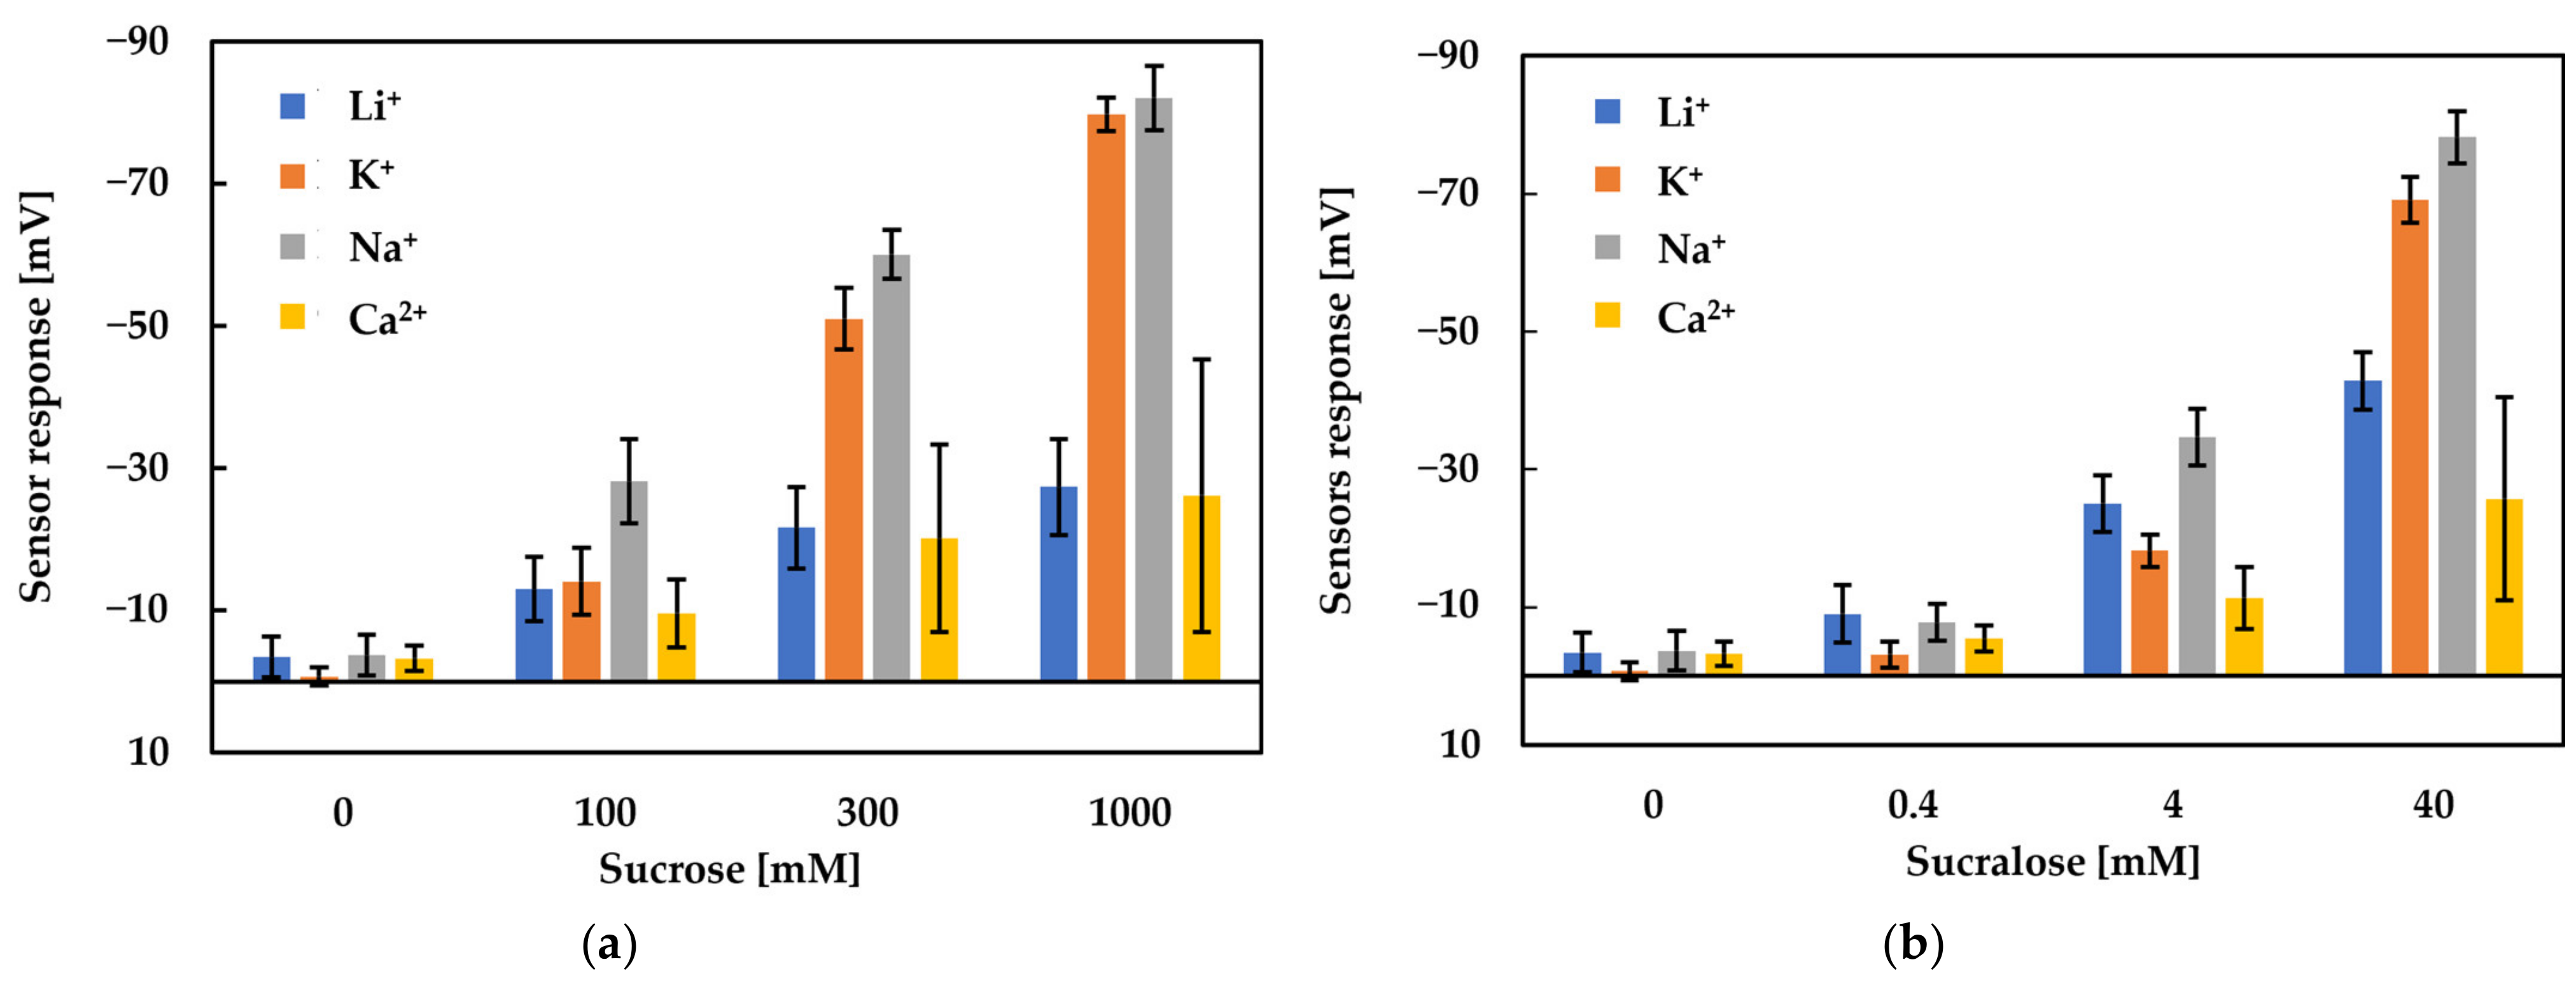
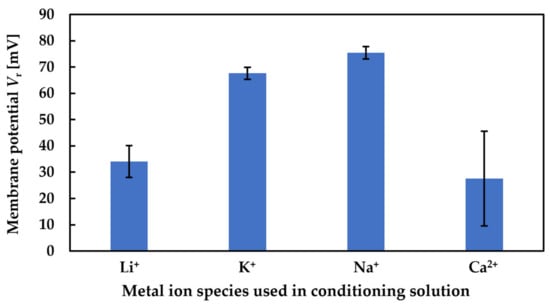
Figure 10.
Change in Vr due to conditioning.
Figure 10.
Change in Vr due to conditioning.

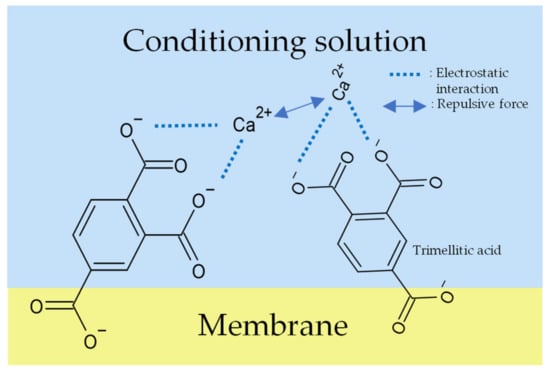
Figure 11.
Models of response mechanism of the sweetness sensor with lipid/polymer membranes: membrane in conditioning solution including Ca2+.
Figure 11.
Models of response mechanism of the sweetness sensor with lipid/polymer membranes: membrane in conditioning solution including Ca2+.
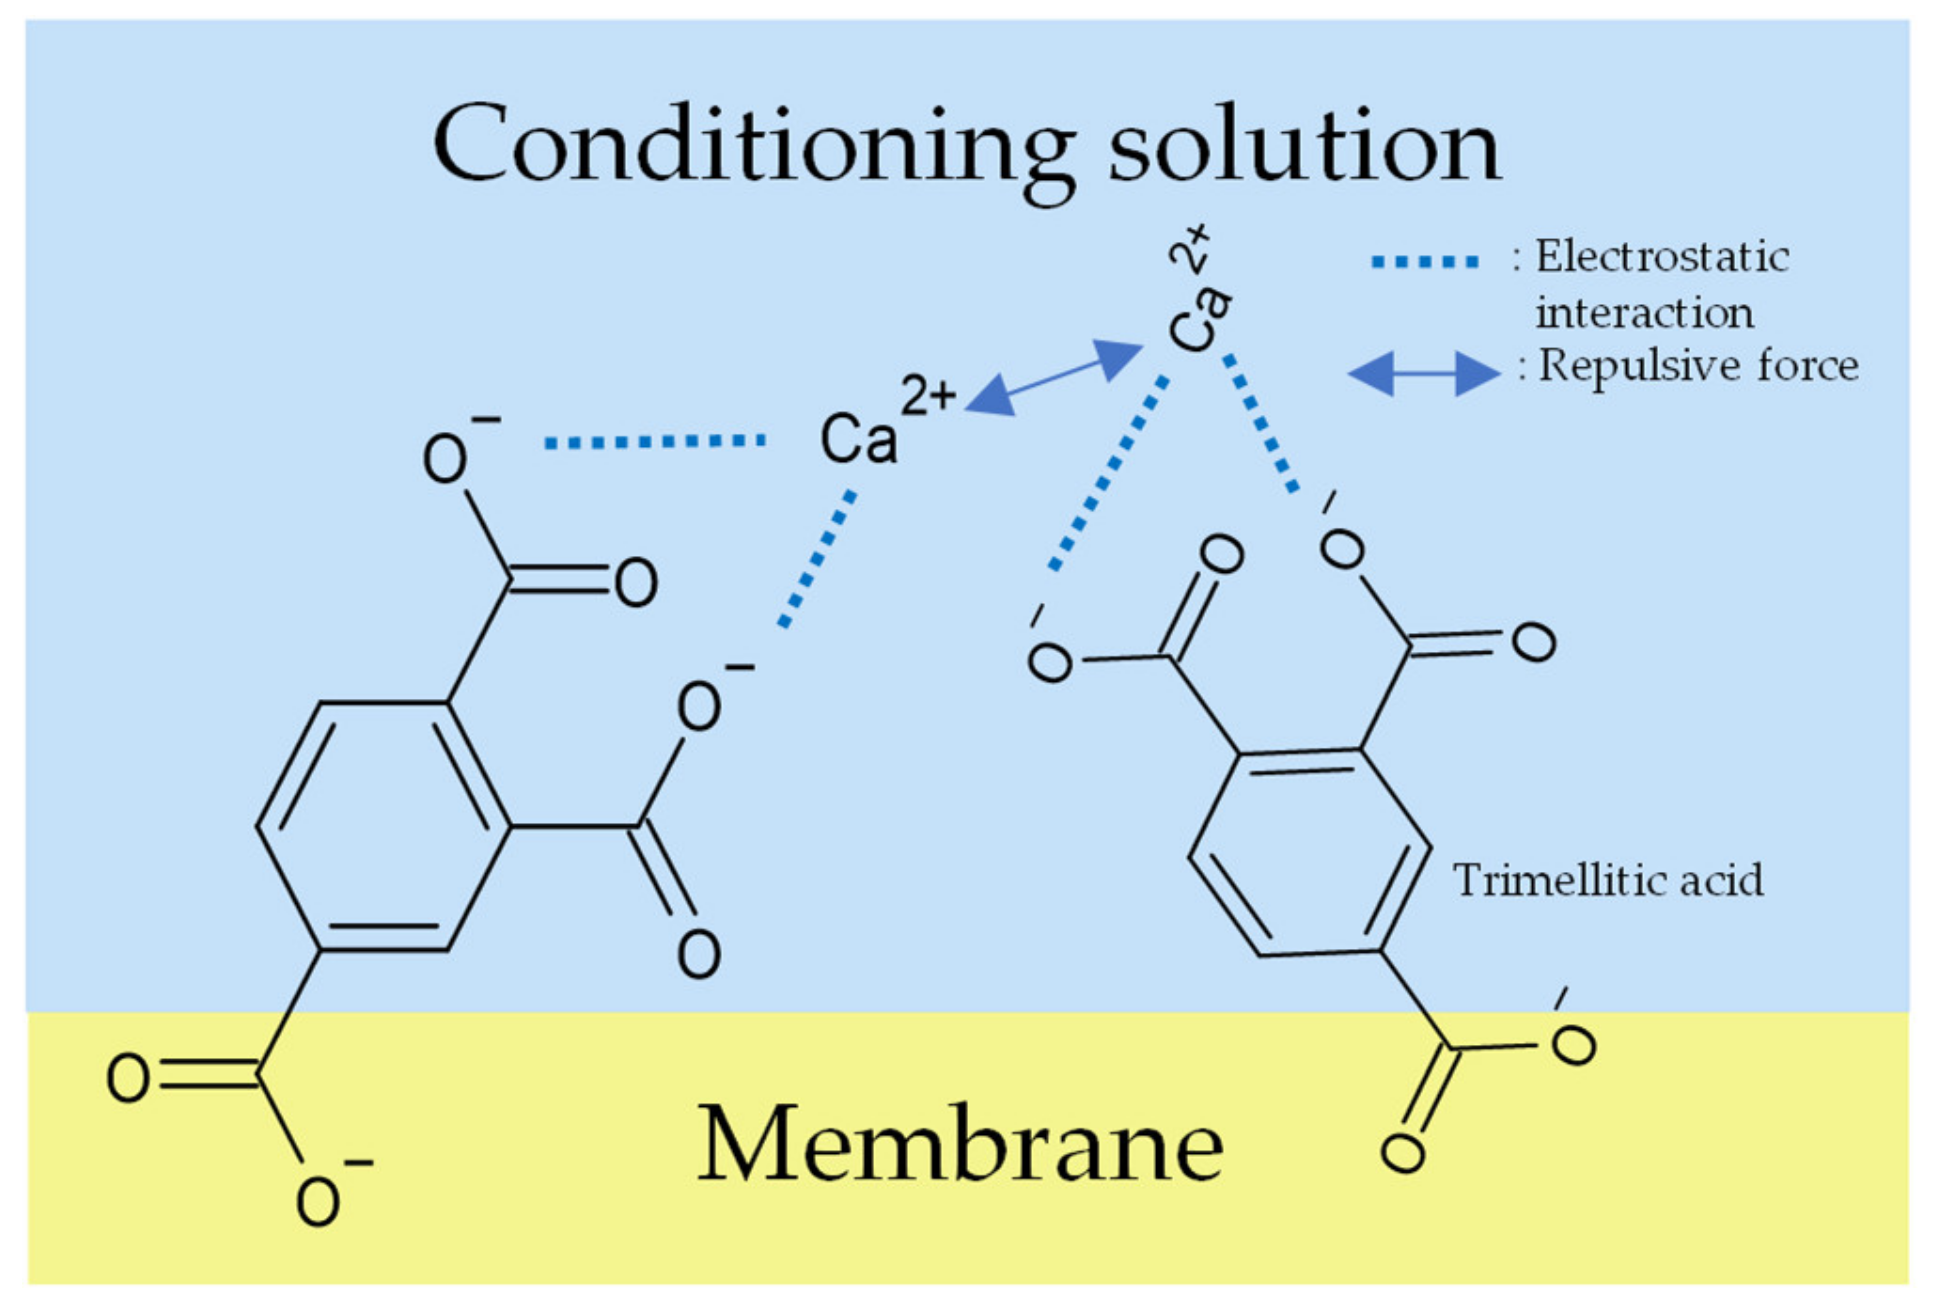

Figure 12.
Models of response mechanism of the sweetness sensor with lipid/polymer membranes: membrane in sample solution.
Figure 12.
Models of response mechanism of the sweetness sensor with lipid/polymer membranes: membrane in sample solution.
4. Conclusions
In the study, a sweetness sensor with a lipid/polymer membrane (GL1) was used to measure uncharged sweeteners. We aimed to find out the response mechanism of GL1. From the results of the changes in membrane potential in a reference solution (Vr), we found that the interactions between uncharged sweeteners and metal ions in the conditioning solutions were due to the metal complex formation. In the process of the measuring procedure, Vr raised from −60 mV to 10 mV, which was a modification to the membrane. The modification to the membrane was caused by the attachment of metal ions to the membrane, which raised the Vr. With the help of the modification, the sensor response of GL1 to sucrose increased by four times compared to that before modification. Moreover, we investigated the modification effects of the conditioning solutions including four kinds of metal ions (Li+, Na+, K+, and Ca2+). As a result, Na+, whose radius is in the best radius range (100–110 pm) for complex formation, formed the strongest complex with the hydroxyl groups in sweeteners. Therefore, the metal ion Na+ caused the highest sensor response among all the metal ions. The bigger hydrated radius of Li+ makes it more difficult to bind to the lipid/polymer membrane than K+. The conditioning solution including Ca2+ obtained the lowest sensor responses because of the low solubility and the repulsive force acting between the neighboring Ca2+. The effect of metal ions in conditioning solutions on the sensor response was revealed for the first time. The study gives a new insight into the role of the conditioning solution. Future research in this field could be an inspiration to design potentiometric taste sensors corresponding to more uncharged taste substances. Finally, we aim to apply more new sensors for the development of new foods and quality control at food manufacturing lines, as measuring equipment, to detect the tastes measurable by human beings and to evaluate the tastes objectively.
Author Contributions
Conceptualization, T.A., X.W., T.O., H.I. and K.T.; experiment implementation, Z.Y.; data analysis, Z.Y., X.W., T.O., H.I. and K.T.; writing—original draft preparation, Z.Y.; writing—review and editing, X.W., T.O. and K.T. All authors have read and agreed to the published version of the manuscript.
Funding
This work was supported by JSPS KAKENHI Grant Number 21H05006.
Institutional Review Board Statement
Not applicable.
Informed Consent Statement
Not applicable.
Conflicts of Interest
Hidekazu Ikezaki is the president of Intelligent Sensor Technology, Inc. Kiyoshi Toko holds stock of this company. This manuscript does not have a conflict of interest with Intelligent Sensor Technology Inc.
References
- Yoshida, R.; Shigemura, N.; Sanematsu, K.; Yasumatsu, K.; Ishizuka, S.; Ninomiya, Y. Taste responsiveness of fungiform taste cells with action potentials. J. Neurophysiol. 2006, 96, 3088–3095. [Google Scholar] [CrossRef] [PubMed] [Green Version]
- Chandrashekar, J.; Hoon, M.A.; Ryba, N.J.P.; Zuker, C.S. The receptors and cells for mammalian taste. Nature 2006, 444, 288–294. [Google Scholar] [CrossRef] [PubMed]
- Kovacic, P.; Somanathan, R. Mechanism of taste; electrochemistry, receptors and signal transduction. J. Electrostat. 2012, 70, 7–14. [Google Scholar] [CrossRef]
- Zhao, G.Q.; Zhang, Y.; Hoon, M.A.; Chandrashekar, J.; Erlenbach, I.; Ryba, N.J.P.; Zuker, C.S. The receptors for mammalian sweet and umami taste. Cell 2003, 115, 255–266. [Google Scholar] [CrossRef] [Green Version]
- Xu, H.; Staszewski, L.; Tang, H.; Adler, E.; Zoller, M.; Li, X. Different functional roles of T1R subunits in the heteromeric taste receptors. Proc. Natl. Acad. Sci. USA 2004, 101, 14258–14263. [Google Scholar] [CrossRef] [Green Version]
- Eggers, S.C.; Acree, T.E.; Shallenberger, R.S. Sweetness chemoreception theory and sweetness transduction. Food Chem. 2000, 68, 45–49. [Google Scholar] [CrossRef]
- Acree, T.E.; Shallenberger, R.S.; Ebeling, S. Thirty years of the AH-B theory. Dev. Food Sci. 1998, 40, 1–13. [Google Scholar]
- Hayes, J.E. Transdisciplinary perspectives on sweetness. Chemosens. Percept. 2008, 1, 48–57. [Google Scholar] [CrossRef]
- Sanematsu, K.; Yoshida, R.; Shigemura, N.; Ninomiya, Y. Structure, function, and signaling of taste G-protein-coupled receptors. Curr. Pharm. Biotechnol. 2014, 15, 951–961. [Google Scholar] [CrossRef]
- Molitor, E.; Riedel, K.; Krohn, M.; Hafner, M.; Rudolf, R.; Cesetti, T. Sweet taste is complex: Signaling cascades and circuits involved in sweet sensation. Front. Hum. Neurosci. 2021, 15, 667709. [Google Scholar] [CrossRef]
- Guedes, M.D.V.; Marques, M.S.; Guedes, P.C.; Contri, R.V.; Kulkamp Guerreiro, I.C. The use of electronic tongue and sensory panel on taste evaluation of pediatric medicines: A systematic review. Pharm. Dev. Technol. 2021, 26, 119–137. [Google Scholar] [CrossRef] [PubMed]
- Latha, R.S.; Lakshmi, P.K. Electronic tongue: An analytical gustatory tool. J. Adv. Pharm. Technol. Res. 2012, 3, 3–8. [Google Scholar]
- Daikuzono, C.M.; Dantas, C.A.R.; Volpati, D.; Constantino, C.J.L.; Piazzetta, M.H.O.; Gobbi, A.L.; Taylor, D.M.; Oliveira, O.N.; Riul, A. Microfluidic electronic tongue. Sens. Actuators B Chem. 2015, 207, 1129–1135. [Google Scholar] [CrossRef]
- Sharma, G.; Kumar, S.; Kumar, A.; Sharma, A.; Kumar, R.; Kaur, R.; Bhondekar, A.P. Development of lipid membrane based taste sensors for electronic tongue. Procedia Comput. Sci. 2015, 70, 146–152. [Google Scholar] [CrossRef] [Green Version]
- Vlasov, Y.; Legin, A.; Rudnitskaya, A.; Di Natale, C.; D’Amico, A. Nonspecific sensor arrays (“electronic tongue”) for chemical analysis of liquids: (IUPAC Technical Report). Pure Appl. Chem. 2005, 77, 1965–1983. [Google Scholar] [CrossRef]
- Riul, A.; Correa, D.S. A first taste to electronic tongues. In Electronic Tongues; Shimizu, M.F., Braunger, M.L., Riul, A., Jr., Eds.; IOP Publishing: Bristol, UK, 2021; pp. 1–4. [Google Scholar]
- Woertz, K.; Tissen, C.; Kleinebudde, P.; Breitkreutz, J. A comparative study on two electronic tongues for pharmaceutical formulation development. J. Pharm. Biomed. Anal. 2011, 55, 272–281. [Google Scholar] [CrossRef] [PubMed]
- Escuder-Gilabert, L.; Peris, M. Review: Highlights in recent applications of electronic tongues in food analysis. Anal. Chim. Acta 2010, 665, 15–25. [Google Scholar] [CrossRef]
- Winquist, F. Voltammetric electronic tongues—basic principles and applications. Microchim. Acta 2008, 163, 3–10. [Google Scholar] [CrossRef] [Green Version]
- Ciosek, P.; Wróblewski, W. Sensor arrays for liquid sensing—electronic tongue systems. Analyst 2007, 132, 963–978. [Google Scholar] [CrossRef]
- Marx, Í.; Rodrigues, N.; Dias, L.G.; Veloso, A.C.A.; Pereira, J.A.; Drunkler, D.A.; Peres, A.M. Sensory classification of table olives using an electronic tongue: Analysis of aqueous pastes and brines. Talanta 2017, 162, 98–106. [Google Scholar] [CrossRef] [Green Version]
- Nuñez, L.; Cetó, X.; Pividori, M.I.; Zanoni, M.V.B.; del Valle, M. Development and application of an electronic tongue for detection and monitoring of nitrate, nitrite and ammonium levels in waters. Microchem. J. 2013, 110, 273–279. [Google Scholar] [CrossRef]
- Citterio, D.; Suzuki, K. Smart taste sensors. Anal. Chem. 2008, 80, 3965–3972. [Google Scholar] [PubMed]
- Sahachairungrueng, W.; Teerachaichayut, S. Qualitative analysis for sweetness classification of longan by near infrared hyperspectral imaging. IOP Conf. Ser. Mater. Sci. Eng. 2019, 639, 012038. [Google Scholar] [CrossRef]
- Amirul, M.S.; Endut, R.; Rashidi, C.B.M.; Aljunid, S.A.; Ali, N.; Laili, M.H.; Laili, A.R.; Ismail, M.N.M. Estimation of harumanis (Mangifera Indica L.) sweetness using near-infrared (NIR) spectroscopy. IOP Conf. Ser. Mater. Sci. Eng. 2020, 767, 012070. [Google Scholar] [CrossRef]
- Serpen, J.Y. Comparison of sugar content in bottled 100% fruit juice versus extracted juice of fresh fruit. Food Nutr. Sci. 2012, 03, 1509–1513. [Google Scholar] [CrossRef] [Green Version]
- Wu, X.; Tahara, Y.; Yatabe, R.; Toko, K. Taste sensor: Electronic tongue with lipid membranes. Anal. Sci. 2020, 36, 147–159. [Google Scholar] [CrossRef] [Green Version]
- Kobayashi, Y.; Habara, M.; Ikezazki, H.; Chen, R.; Naito, Y.; Toko, K. Advanced taste sensors based on artificial lipids with global selectivity to basic taste qualities and high correlation to sensory scores. Sensors 2010, 10, 3411–3443. [Google Scholar] [CrossRef] [Green Version]
- Yasuura, M.; Shen, Q.; Tahara, Y.; Yatabe, R.; Toko, K. Development and investigation of a sweetness sensor for sugars—Effect of lipids -. Sens. Mater. 2015, 27, 351–358. [Google Scholar]
- Bobacka, J.; Ivaska, A.; Lewenstam, A. Potentiometric Ion Sensors. Chem. Rev. 2008, 108, 329–351. [Google Scholar] [CrossRef]
- Hayashi, N.; Ujihara, T.; Hayakawa, F.; Nakano, Y.; Kawakami, T.; Ikezaki, H. Standardization of tomato juice tastes using a taste sensor approach. Biosci. Biotechnol. Biochem. 2020, 84, 2569–2575. [Google Scholar] [CrossRef]
- Pardo, H.; Owoyemi, A.; Benjamin, O.; Goldenberg, L.; Yaniv, Y.; Doron-Faigenboim, A.; Carmi, N.; Porat, R. Sensory analysis of a new citrus juice made from ‘Aliza’ fruit: A new pomelo x mandarin hybrid. J. Food Sci. Nutr. Res. 2021, 4, 320–330. [Google Scholar] [CrossRef]
- Oguro, Y.; Nishiwaki, T.; Shinada, R.; Kobayashi, K.; Kurahashi, A. Metabolite profile of koji amazake and its lactic acid fermentation product by Lactobacillus sakei UONUMA. J. Biosci. Bioeng. 2017, 124, 178–183. [Google Scholar] [CrossRef] [PubMed]
- Toyota, K.; Cui, H.; Abe, K.; Habara, M.; Toko, K.; Ikezaki, H. Sweetness sensor with lipid/polymer membranes: Sweet-responsive substances. Sens. Mater. 2011, 23, 465–474. [Google Scholar]
- Toyota, K.; Cui, H.; Abe, K.; Habara, M.; Toko, K.; Ikezaki, H. Sweetness sensor with lipid/polymer membranes: Response to various sugars. Sens. Mater. 2011, 23, 475–482. [Google Scholar]
- Angyal, S.J. Complex formation between sugars and metal ions. Pure Appl. Chem. 1973, 35, 131–146. [Google Scholar] [CrossRef]
- Oku, K.; Kurose, M.; Kubota, M.; Fukuda, S.; Kurimoto, M.; Tujisaka, Y.; Sakurai, M. Interaction between trehalose and alkaline-earth metal ions. Biosci. Biotechnol. Biochem. 2005, 69, 7–12. [Google Scholar] [CrossRef] [Green Version]

Publisher’s Note: MDPI stays neutral with regard to jurisdictional claims in published maps and institutional affiliations. |
© 2022 by the authors. Licensee MDPI, Basel, Switzerland. This article is an open access article distributed under the terms and conditions of the Creative Commons Attribution (CC BY) license (https://creativecommons.org/licenses/by/4.0/).