1. Introduction
Gas sensing is a constantly expanding field in relation to the application of graphene and graphene-based materials [
1,
2,
3,
4,
5]. Sensing structures made of such materials have a large specific surface area, and when exposed to the adsorption of gas particles, a pronounced change in their electrical and mechanical parameters can occur, resulting in a measurable sensor response even for extremely low adsorbed quantities [
1,
6]. Application of different chemical functionalizing elements, and the presence of structural defects in graphene, can significantly improve the sensing capabilities toward certain gas species [
3,
4,
7,
8]. The good gas sensing properties of liquid-phase exfoliated (LPE) graphene stem from its defect-rich structure, in the form of flakes with edges that have an abundance of highly reactive adsorption sites [
9,
10,
11]. However, the existence of another type of adsorption site on the basal planes of the flakes makes the LPE graphene surface heterogeneous, requiring special attention in the analysis of measurement results. Knowing the values of the adsorption–desorption (AD) process parameters for different types of adsorption sites is essential in that sense. However, reliable data that can be applicable for gas sensing based on the use of LPE graphene, either theoretically or experimentally obtained, are still missing for many gases (including CO
2). In the existing literature, data can be found related to the adsorption energies for AD processes of various gases on pristine, functionalized, and defective graphene, determined by the use of the density functional theory and other calculation methods [
4]. However, their values for the same gas, and even for the same sensing surface are often different because they depend on the used calculation method, and on different effects and corrections that have been taken into account, and which more or less adequately correspond to a given situation and sensing surface [
4,
12]. Their applicability in the case of LPE graphene may be debatable given its specific structure, which consists of randomly arranged and irregularly shaped flakes with diverse edges.
Apart from LPE graphene, other gas sensing layers can be regarded as heterogeneous in the sense of having surface sites of different affinities for gas particles binding [
13,
14]. The causes of heterogeneity can be a non-uniform surface morphology, structure, or chemical composition, including the presence of various defects, irregularities, cavities, pores, impurities, different functional groups on the surface, or some other features that constitute surface inhomogeneity. An understanding of sensor heterogeneity is important for sensor characterization [
15] but it can also be utilized for the optimization of sensor responses to different gas species [
16]. Regardless of the nature of the heterogeneity, the adsorption properties of the sensing surface have to be characterized because they inherently influence the performance of the gas sensor. Apart from knowing the adsorption/desorption energies, it is also important to know the relative abundances of various adsorption site types on the surface, as they determine the dominant adsorption mechanism on which the sensor response rate and magnitude, sensitivity, selectivity, and sensing surface recovery depend. Such data therefore enable the optimization of the sensing performance during the design and fabrication of graphene-based surfaces and other sensing surfaces.
Apart from the usual gas detection methods, in which the temporal sensor response is measured and analyzed both in the transient regime and the steady state, new approaches have emerged which have improved the sensing performance. Spectrum analysis of the sensor noise, i.e., of the stochastic fluctuations of the sensor signal caused by the inherently random nature of the adsorption–desorption process of gas particles, has proven to be a promising (even superior) method for the detection and identification of gases in various types of adsorption-based sensors [
17,
18], including graphene gas sensors [
19,
20,
21]. The main advantages of spectrum analysis are a higher sensitivity compared to conventional methods and an inherent selectivity and insensitivity to baseline drift [
17,
19,
20].
In this work, as opposed to previous work on the use of the sensor noise spectrum for the detection and identification of gases, we present a new application of the analysis of the noise spectrum of a gas sensor with the sensing layer made of a heterogeneous material such as LPE graphene for characterizing the adsorption properties of the sensing surface. The main novelty of our work is a method to determine the relative abundance of different types of adsorption sites on the surface of an adsorbing material, the sites’ surface densities, and the effective surface areas occupied by them and their numbers based on an analysis of measured noise. These data are lacking in the literature and are important for the development of adsorption sensors with an improved performance, and also for fundamental material research and the investigation of adsorption processes and mechanisms of interaction between different gases and surfaces. We used a mathematical model of noise developed for heterogeneous adsorption surfaces [
22], and adapted its form to enable the extraction of the parameters that characterize the AD process on a surface with different types of adsorption sites. By using a CO
2 sensor as an example, we show that characteristic frequencies of the noise spectrum uniquely indicate the relative abundance of edge and basal plane adsorption sites on an LPE graphene surface, as well as the surface densities and numbers of the sites. CO
2 was chosen because there is a need to measure the concentration of that gas in a diverse field of applications. For example, CO
2 is an air pollutant and a greenhouse gas with a constantly increasing emission trend [
23], which is causing global warming and the disruption of ecosystems. CO
2 is considered a non-toxic gas but it is harmful to health if an individual is exposed to it for a long time. There is a need in many industrial processes and in scientific research to measure CO
2 concentrations, with low concentrations also of interest [
24]. In medicine, sensitive CO
2 sensors are desired in capnography to detect disease at the early stages or to monitor the patient’s physiological functions during anesthesia and some medical treatments [
24]. Therefore, there is a need for a variety of CO
2 sensors, including highly sensitive sensors for trace amounts of CO
2, low cost and low energy consumption miniaturized gas sensors deployed in a dense network, sensors capable of real-time in situ measurements operating at room or ambient temperature, and those realized as flexible or wearable devices. Graphene gas sensors have great potential to meet the above requirements. Consequently, much research effort is being invested to use this material for CO
2 sensing, as evidenced by the volume of scientific literature dealing with this topic. Although very small detectable CO
2 concentrations have been reported using graphene sensors (e.g., [
25,
26,
27]), in order to make the most of graphene as a sensing material, it is necessary to optimize the sensing layer with respect to both capturing gas molecules and the charge transfer between the gas particles and graphene (e.g., by using defect-rich graphene and surface functionalization). It is the investigation of the adsorbing properties of sensing materials that enables the characterization and optimization of the sensing performance during the design and fabrication of sensors for the detection of a particular gas. Thus, one of the objectives of the paper is to present a new way to characterize realistic heterogeneous adsorbing materials. CO
2 is taken as an exemplary gas, but the presented method is also applicable for other gases (including toxic gases such as SO
2 and NOx) and sensing surfaces (other types of graphene and graphene-based materials, other 2D materials, semiconductor oxides, etc.), and in cases when there is a greater number of adsorption site types.
2. Mathematical Model of Noise in Sensors with a Heterogeneous Sensing Surface
The heterogeneous active surface of adsorption-based gas sensors is defined by a spatial distribution of adsorption sites of different affinities towards a certain gas species. The general case assumes
n (
n ≥ 2) types of adsorption sites on the surface, in which the adsorbing surface can be considered as consisting of a collection of locally homogeneous surface parts. The simplest heterogeneous surface has two distinct types of adsorption sites, and here it will be analyzed in detail. The case of a surface with three types of sites will also be considered. By assuming that only one gas particle can be bound to a single site of any kind, and that adsorbate particles do not interact among themselves, a multisite Langmuir model [
28] for AD processes occurring on the surface can be applied, which has the form:
Here the index “
i” refers to the adsorption sites of the type
I,
Ni denotes the number of adsorbed gas particles,
αi is the sticking coefficient,
Nmi is the number of the adsorption sites,
nmi is the sites surface density,
p is the gas pressure,
M is the mass of a single gas particle,
T is the temperature, and
kB is the Boltzmann constant. The mean time a gas particle spends adsorbed on a site of the type
i
depends on the desorption energy
Edi, temperature, and the period of thermal vibrations of the adsorbed particle,
τ0i (
Rg is the gas constant).
Equation (1) for each type of adsorption site yields the expressions for the time evolution of the number of adsorbed gas particles (
Ni(
t)), the number of adsorbed particles in the steady state of the AD process (
Nie), and the time constant with which the AD process approaches the steady state (
τi):
where the parameter
bi equals
The sensor time response can now be expressed as a sum of the components generated by the AD processes on different types of adsorption sites (
ri is the conversion factor of the number of adsorbed gas particles on the type
i sites to the response):
According to the previous expressions, the intrinsic sensor response (its kinetics, magnitude, rise time) in the presence of a certain gas in the sensor surroundings at a given temperature depends on the adsorption properties of the sensing surface for the given analyte. It is known that the response of adsorption-based sensors often does not strictly follow the single-exponential law due to different effects (e.g., the pronounced influence of mass transfer, the non-homogeneity of the sensing surface or parasitic adsorption due to non-ideal sensor selectivity) [
29]. In experiments with graphene-based gas sensors, a rapid initial increase in the response has been observed, but the response approaches the steady state at a much slower rate, which is commonly attributed to different filling rates of high-affinity and low-affinity surface sites [
30,
31]. The kinetics of such a response is described by using two time constants, as predicted by Equation (6) for
n = 2.
Due to the inherently stochastic nature of AD processes, the number of particles adsorbed on each type of adsorption site randomly fluctuates. These fluctuations, denoted by Δ
Ni(
t), result in fluctuations of the sensor’s time response, Δ
R(
t):
which constitute the inevitable adsorption–desorption noise.
In order to obtain an analytical expression for the power spectral density (PSD) of the sensor AD noise, an analysis of the fluctuations in the numbers of adsorbed particles around steady-state values should be performed. The actual instantaneous number of adsorbed particles in the steady state fluctuates around
Nie as
Ni(
t) =
Nie + Δ
Ni(
t). Here we briefly present the derivation of the PSD of AD noise for the case of
n types of sites on the sensing surface, based on the Langevin approach (as given in [
22]). The
n independent Langevin equations are obtained starting from the kinetic Equation (1):
(
ξi is a random source function). After solving Equation (8) in the frequency domain, we can obtain the PSD of fluctuations of the number of particles adsorbed on the type
i sites:
Since random processes Δ
Ni(
t) and Δ
Nj(
t) are statistically independent for every pair
i and
j, where
I ≠
j, the PSD of the sensor AD noise is obtained based on Equations (7) and (9) in the form of the sum of
n lorentzians:
In particular, for the sensing surfaces with two types of adsorption sites, the previous expression, after some mathematical transformations, obtains the form:
that reveals three characteristic frequencies in the AD noise spectrum:
and its low frequency noise magnitude:
When there are three types of adsorption sites, the expression (10) for
n = 3 can be transformed into:
where the frequencies
fc1,
fc2, and
fc3 are given by the Equation (12) for
i equal to 1, 2, or 3, the remaining two characteristic frequencies are determined by equations:
and the low frequency noise magnitude is:
Here we notice that Equations (13) and (14) can be expressed in the form:
where all the quantities are already defined.
The mathematical models given by the presented expressions will be used in our further analysis.
3. Results and Discussion
We investigated the applicability of noise spectrum analysis for the characterization of heterogeneous sensing surfaces by considering a carbon dioxide-resistive sensor based on LPE graphene, assuming that there are two types of adsorption sites: those on the edges of graphene flakes (type 1 sites), and those on their basal planes (type 2 sites) [
10]. Type 1 sites account for a relatively small proportion of the total sensing area, while type 2 sites are located on its major part. Adsorption on both types of sites contributes to the sensor response and its fluctuations, while the response time and magnitude, as well as the noise spectrum characteristic features, depend on the reactivity of each type of site for the target gas and the surface densities of the sites and their relative abundance on the sensing surface. We performed the theoretical simulation based on the presented theoretical model, by using the values of the parameters obtained with DFT calculations found in the literature. The results will be compared in specific aspects with experimental and simulation data from the literature.
It is known that the adsorption of carbon dioxide and other gas molecules on a pristine graphene surface is based on a weak physical interaction, yielding a very low sensor signal [
4,
32]. It can be assumed that the same is also valid for adsorption sites located on non-defective basal planes of graphene flakes. The reactivity of edge sites is much higher, so the adsorption on such sites constitutes the main contribution to the sensor response. If a large part of the graphene surface, corresponding to basal planes, could be utilized more effectively, the response magnitude and the sensor sensitivity would be significantly improved. Experiments and numerous theoretical studies have shown that a significant improvement in graphene reactivity toward various gases can be achieved by using different strategies, including the doping or decoration of graphene, where various atoms, molecules, functional groups, or nanoparticles were used [
4,
23,
33,
34]. Therefore, we will assume that the graphene is chemically functionalized in order to maximize the use of its adsorption surface. Together with the presence of a multitude of edge adsorption sites, this significantly improves the response to carbon dioxide. Adsorption of CO
2 on graphene functionalized with different elements has been investigated by using the DFT method, and the results show that a very strong interaction (i.e., strong chemical adsorption) has been achieved in some cases [
33,
35,
36,
37,
38,
39]. However, it is necessary to take into account that in the case of strong adsorption, the reusability of the sensor becomes an issue because the regeneration of the sensing surface for subsequent measurements requires the efficient and complete desorption of gas particles. Thus, the best choice for functionalization are elements that exhibit a sufficiently strong but, at the same time, reversible interaction between the sensing surface and the target molecules. Based on the previous considerations, it is reasonable for the AD noise analysis to assume the energy
Ed2 = 12.5 kcal/mol for CO
2 binding to functionalized basal plane sites, which is obtained by the density functional theory calculations in [
40]. That study describes the adsorption of CO
2 molecules on a Fe-functionalized graphene sheet. It also reports the charge transfer of 0.02 electrons per adsorbed CO
2 molecule. LPE graphene flakes generally have edge structures that are a combination of different geometries. CO
2 adsorption on edge defects was analyzed on graphene nanoribbons, considering different edge types: basic zigzag and armchair, and their variations [
32,
41,
42,
43]. Some DFT calculations resulted in very high binding energy values (typically on zigzag edges, e.g., 89.5 kcal/mol [
32]), indicating strong chemical adsorption, which is irreversible. It is clear that irreversible adsorption on such highly reactive adsorption sites does not contribute to fluctuations of gas particles after the steady state has been established, which makes such sites irrelevant for AD noise analysis. Moderately strong CO
2 binding has been reported for the zigzag (57) and armchair adsorption sites of graphene nanoribbons, with the binding energy of approximately 19 kcal/mol [
43]. The forming of these kinds of edges has proven to be energetically favorable in graphene nanoribbons [
44,
45]. In the analysis of the contribution of LPE graphene edge adsorption to the sensor AD noise, we will therefore use the value
Ed1 = 19 kcal/mol.
The principle of operation of resistive sensors is based on an adsorption-induced change in the graphene electrical conductivity through the charge transfer interactions between the graphene and the adsorbate. Thus, in such sensors, gas adsorption experiments are performed by measurements of the electrical conductance of the sensing layer, and in sensor noise analysis, the power spectral density of the conductance fluctuations is a quantity of interest. The effective change in the conductivity of the sensing layer,
σ, is proportional to the total change in the number of free charge carriers in the adsorbing material,
NCH, which is determined by the number of adsorbed gas molecules at each type of site,
Ni, and the corresponding charge transfer per adsorbed molecule,
wi [
46]. For two types of sites, the proportionality
σ~
NCH becomes
σ~(
N1w1 +
N2w2). A change in the conductivity of the sensing layer
G~
σ can be represented by the expression
G =
kNCH =
k(
N1w1 +
N2w2), where the constant
k depends on the electron charge, the charge carrier mobility, and the geometric parameters of the sensing layer (as introduced in [
14], except that here
w1 ≠
w2). Considering that the time response of the sensor is a change in the conductivity of the sensing layer over time, in accordance with the notation introduced in
Section 2, the sensor response defined by expression (5) is now
R(
t) =
G, which implies
r1 =
kw1 and
r2 =
kw2. Therefore, the PSD of the sensor noise (Equation (10)) is the PSD of the conductance fluctuations:
The conductance fluctuations spectrum can also be expressed as:
where
SΔNCH(
f) is the PSD of fluctuations of the number of charge carriers included in the charge transfer between the adsorbed molecules and the sensing material:
This last quantity is the most suitable to illustrate the method of characterization of the heterogeneous sensing layer, which we present in this paper, where we make use of the characteristic frequencies of the noise spectrum. Namely, the PSD of sensor noise, i.e., the PSD of the fluctuations of the conductance of the sensing layer (which would be determined experimentally),
SΔG(
f), is proportional to
SΔNCH(
f), so the corresponding characteristic frequencies of these PSDs are the same. The difference between these two spectra is only in the noise magnitude (they differ by the constant factor
k2), which is not important for the method we present, because it uses values of characteristic frequencies of the noise spectrum. The spectrum
SΔNCH(
f) that we have analyzed for the given gas pressure and temperature depends only on the adsorption properties of the sensing material for a given gas and does not require knowledge of the geometric parameters of the sensing layer, which do not affect the characteristic frequencies of the noise spectrum, as can be seen from Equations (12) and (13). It is obvious that in Equation (12) there is no dependence on the constant
k. That
k does not exist in Equation (13) becomes clear after replacing
r1 =
kw1 and
r2 =
kw2, because
k in the numerator and denominator of expression (13) is canceled. If the sensor output signal were current or voltage, the sensor noise would be current or voltage fluctuations, and their PSD would also be proportional to
SΔNCH(
f), so an analysis of
SΔNCH(
f) is optimal to demonstrate the method. Proportionality of noise, i.e., the fluctuations of the sensing layer electrical conductivity or resistance, as well as the sensor output current or voltage to the PSD of the fluctuations of the number of particles is also presented and used in [
17,
18,
46]. For these reasons, in this paper we analyze the PSD of the number of carriers included in the charge transfer.
Characterization of the adsorbing surface with the method we present here (as well as other methods based on measurement and analysis of noise spectrum) is performed in the atmosphere of a single gas (in this case CO
2), at a constant gas concentration and constant temperature in a steady state. Sensor signal fluctuations (i.e., noise) are usually analyzed in the frequency domain, in which noise is represented by its power spectral density, which in the literature is usually simply referred to as the noise spectrum.
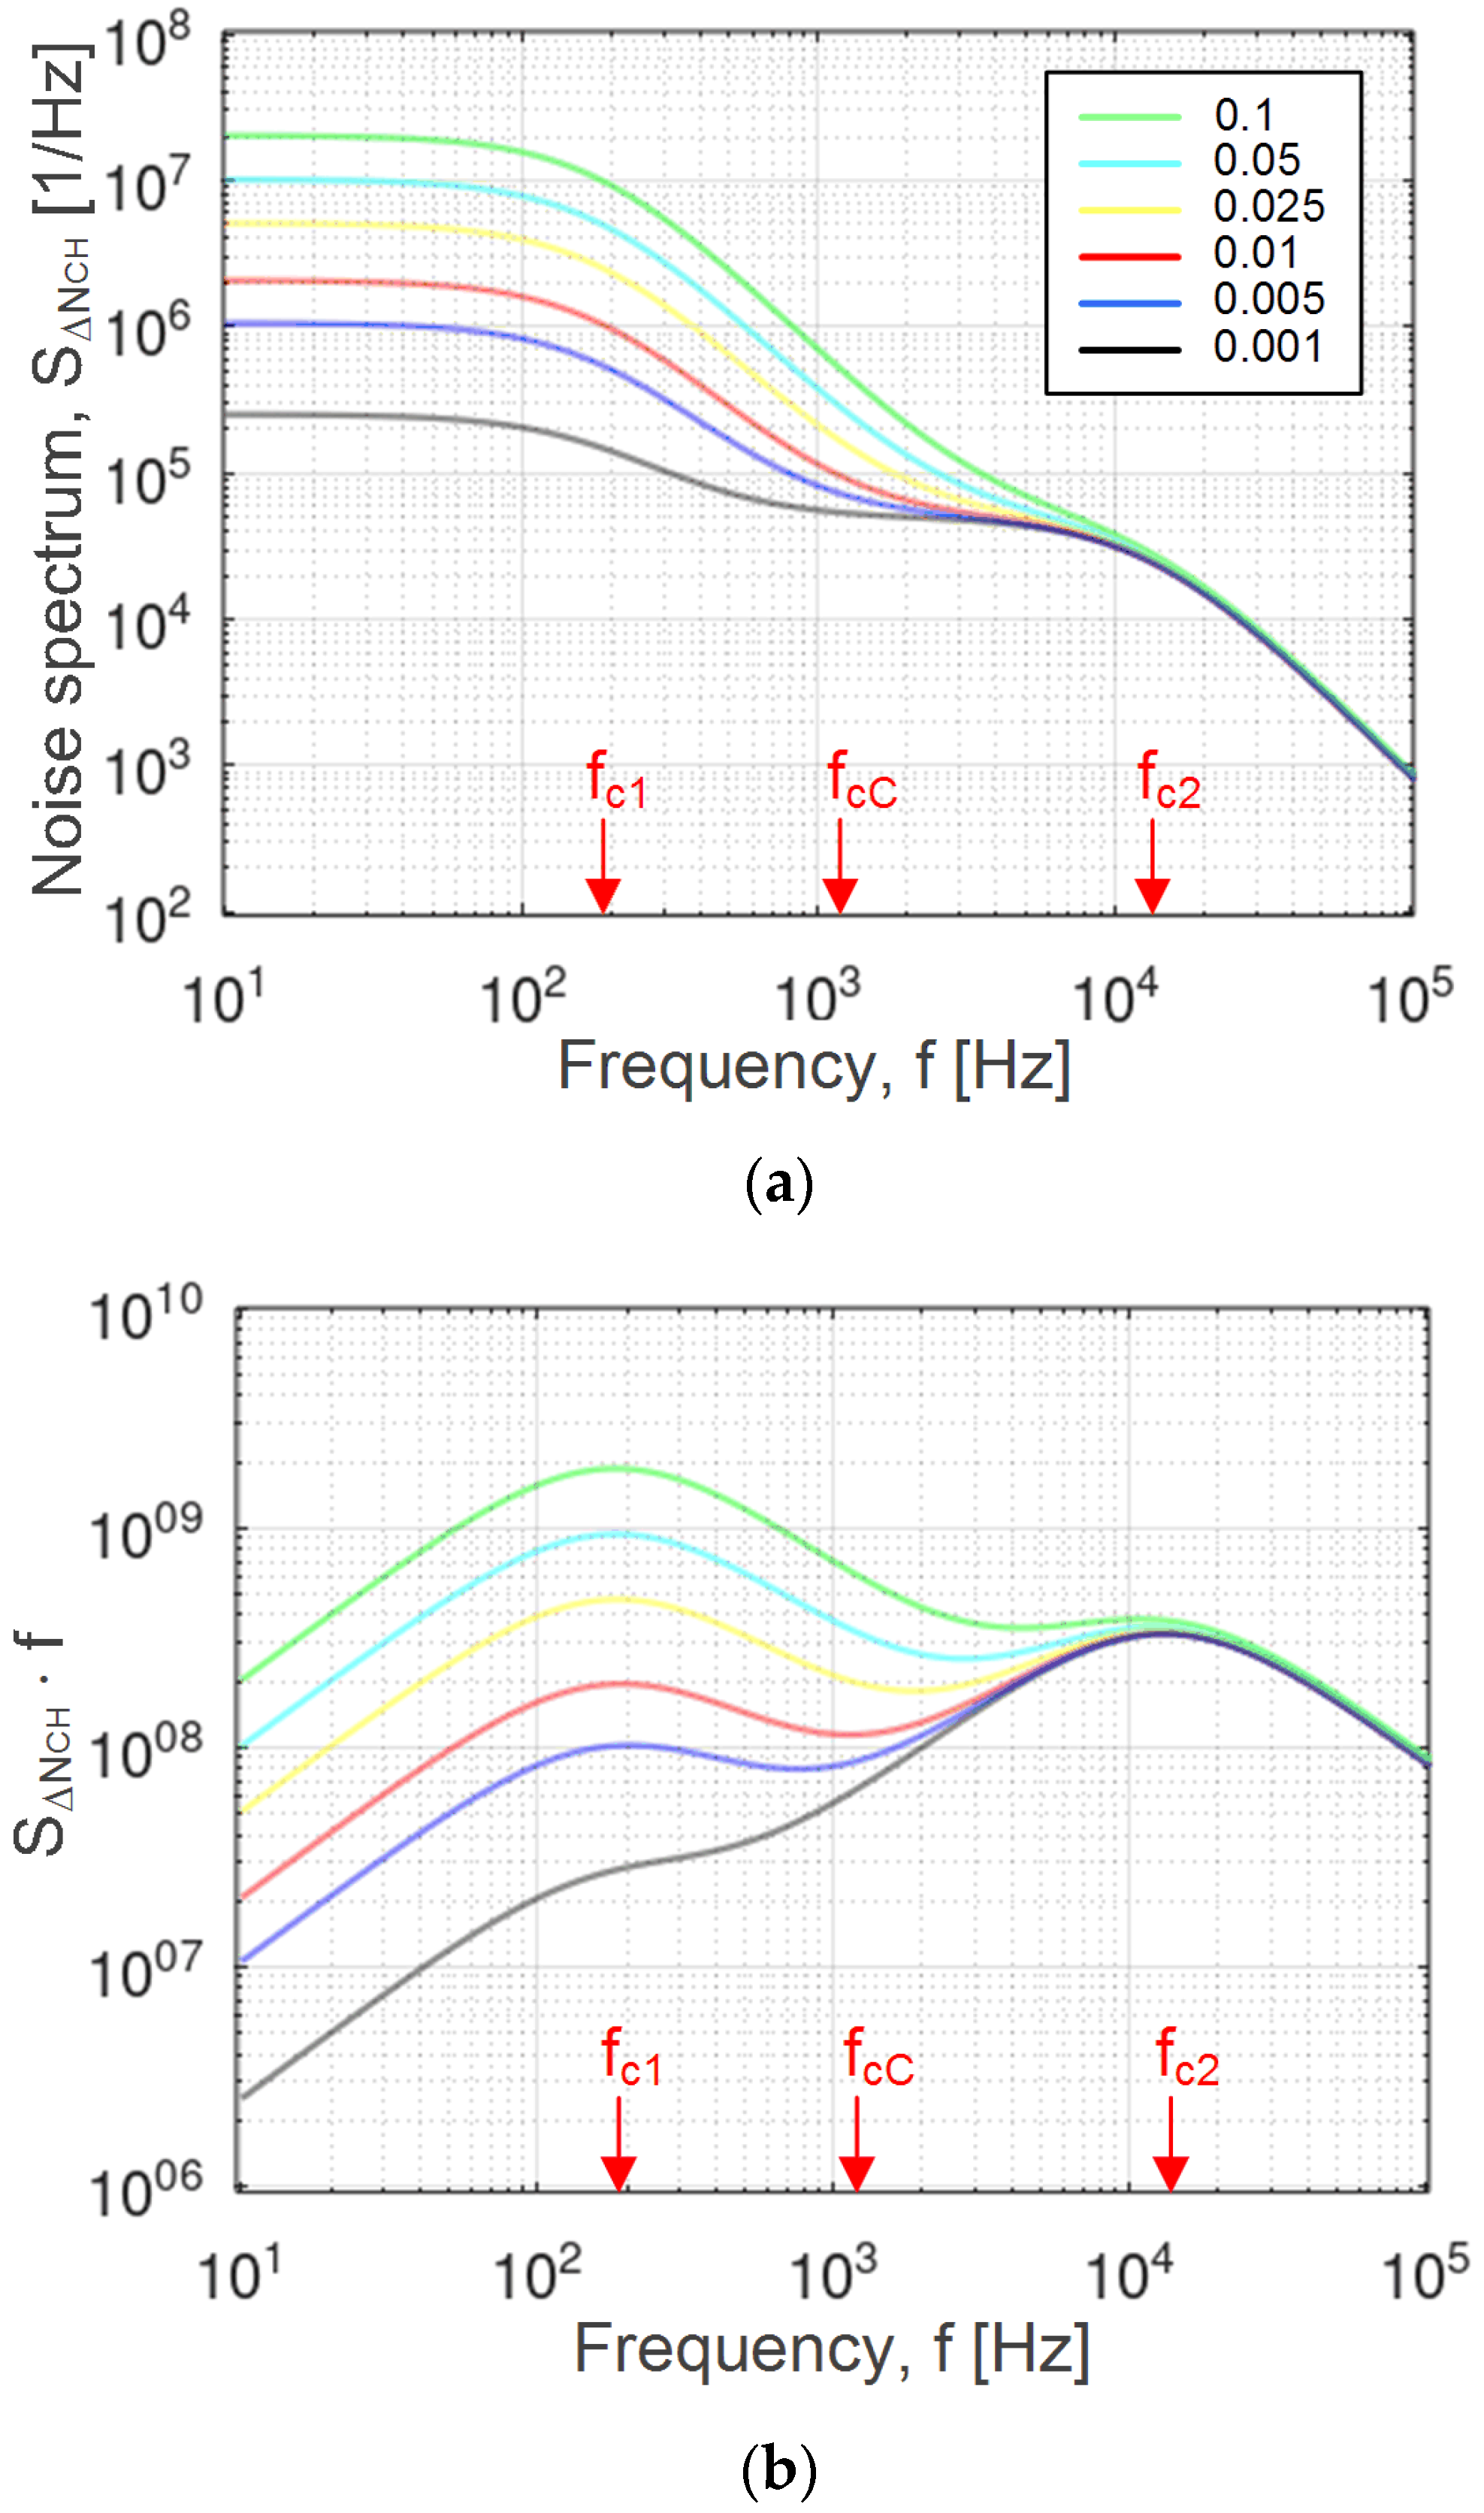
Figure 1a shows the AD noise power spectrum for various ratios of the numbers of adsorption sites of two types,
v =
Nm1/
Nm2,
Nm1 being the number of adsorption sites on the edges, and
Nm2 the number of basal plane sites (the gas concentration is 1 ppm,
T = 300 K, and the total sensing surface area is 10 × 10 mm
2, i.e.,
A = 10
−4 m
2). It is given as the power spectral density of fluctuations in the number of electrons included in the charge transfer between the adsorbed CO
2 molecules and the sensing material. The characteristic features of the spectrum (two knees, one inflection point, and the low-frequency noise magnitude) are visible for all values of
v for the given parameter set. The characteristic features become more distinguishable after the multiplication of the spectrum with the Fourier frequency
f, as shown in
Figure 1b. The resulting quantity (
f⋅
SΔR(
f)) is commonly used for the analysis of experimentally obtained noise spectra of graphene gas sensors [
19,
20]. Measurements in the shown frequency range can routinely be performed with a spectrum analyzer.
Figure 2a shows the dependence of the noise spectrum characteristic frequencies on the ratio of the total number of adsorption sites on the edges and the total number of sites on basal planes of LPE graphene flakes. It can be seen that the value of the central characteristic frequency
fcC unambiguously indicates the relative abundance
v of different types of adsorption sites, while the frequencies
fc1 and
fc2 are unaffected by
v.
The characteristic frequency
fc1, corresponding to the noise spectrum component that originates from the fluctuations in the number of gas particles on edge adsorption sites, as a function of the site’s density
nm1, is shown in
Figure 2b for two different CO
2 concentrations (1 ppm and 10 ppm). The values of
fc1 for different concentrations uniquely determine the density of the edge sites on the same sensing surface, as shown in the diagram (values in red color). The dependence shown in
Figure 2b is dictated by Equation (12). It shows that the frequency
fc1, at any given concentration (i.e., pressure) of gas, unambiguously indicates the density of the adsorption sites. Thus, at other concentrations as well (e.g., 1000 ppm or 1 ppb), the corresponding values of the frequency
fc1 will result in the same value of
nm1, which is the property of the adsorbing surface.
The results presented in Figs. 1a and 1b and the theory given in
Section 2 show that it is possible to determine the characteristic frequencies
fc1,
fc2, and
fcC from the experimentally obtained noise spectrum at known pressure and temperature values. The noise measurements were performed in stable conditions, after the establishment of the steady state. The time of establishing of the steady state is determined by the largest time constant of the AD processes at different adsorption sites (in our analysis approximately 4 ms). By using the diagram
fc1(
nm1), which was obtained theoretically based on Equation (12) for a given gas pressure, temperature, and energy
Ed1,
nm1 was determined that corresponded to the experimentally obtained value
fc1. For an illustration of the procedure, first the value
fc1 = 183 Hz, denoted in
Figure 2b, was obtained from
Figure 1b (red curve), and then the matching value
nm1 = 2⋅10
18 m
−2 was read out from
Figure 2b. Similarly, from the theoretical dependence
fc2(
nm2) defined by Equation (12),
nm2 was obtained based on the experimentally determined value
fc2. The diagram
fcC(
v) was obtained theoretically, based on Equation (13) for the previously obtained parameter values
fc1,
fc2,
nm1, and
nm2 (with the introduced substitution
Nm1 =
vNm2). The dependence
fcC(
v) enabled the determination of the relative abundance
v of the two types of adsorption sites for an experimentally obtained value
fcC. As illustrated in
Figure 2a, for
fcC = 1179 Hz, obtained from the red curve shown in
Figure 1b,
v equaled 0.01. The total number of the basal plane adsorption sites was obtained as
Nm2 =
nm2A2, where
A2 =
Anm1/(
nm1 +
vnm2) is the surface area of the basal planes (the expression is derived from
A =
A1 +
A2 =
Nm1/
nm1 +
Nm2/
nm2). Thus,
Nm2 = 3.992⋅10
13, and the average surface density of the basal plane sites on the entire sensing surface was
nm2t =
Nm2/
A = 3.992⋅10
17 m
−2. Now, by using the already determined
Nm2 and
v values, the total number of edge sites was calculated as
Nm1 =
vNm2, yielding the value 3.992⋅10
11, and the average surface density of the edge sites on the entire sensing surface was
nm1t =
Nm1/
A = 3.992⋅10
15 m
−2. The ratio
Nm1/
nm1 is a measure of the effective surface area occupied by the edge binding sites. For the parameter values used in the presented analysis, this surface area was 0.2% of the total sensing surface area. For comparison, by fitting the bi-Langmuir adsorption model to the experimental results for the adsorption of acetone on graphene, the high-energy sites accounted for 0.24% of the total surface area of graphene, and DFT calculations revealed that such sites are localized on the surface steps formed by the edges of graphene flakes lying on the basal planes of the layer below them [
47].
In [
40], the adsorption of CO
2 on Fe-functionalized graphene in an oxygen environment was studied in detail in order to determine the influence of the strong (irreversible) adsorption of O
2 molecules on the sensing properties of the adsorbing material regarding CO
2. The co-adsorption of the two molecular species was analyzed, i.e., binding of CO
2 and O
2 molecules to the same adsorption site. By using DFT calculations, it was found that the binding energy of a CO
2 molecule after O
2 capture was 8.07 kcal/mol (compared to 12.5 kcal/mol when CO
2 is adsorbed directly to the functionalized surface site), and that it resulted in a net charge transfer of approximately 0.1 e per adsorbed molecule. Thus, the sensor response to CO
2 remained, although CO
2 molecules prefer oxygen-free adsorption sites. In order to correctly interpret the measurement results obtained in the case of carbon dioxide detection in an oxygen environment, the fraction of surface sites occupied by O
2 molecules must be known. For this reason, we expanded the noise model to take into account the adsorption of CO
2 molecules on adsorption sites occupied by O
2 molecules, which can be considered as the third type of adsorption sites. By using the parameter values obtained by DFT in [
40], the diagram shown in
Figure 3 was obtained.
In the diagram (
Figure 3) showing the noise spectrum multiplied by the frequency, five characteristic features (three maxima and two minima) can be identified, which can be used as a source of information about the abundance of different types of adsorption sites. Namely, the experimentally obtained spectrum enabled the determination of five characteristic frequencies, in accordance with the theoretical model (Equation (15)). Then the obtained values
fc1 = 183 Hz,
fc2 = 13.22 kHz, and
fc3 = 2.347 MHz directly enabled the determination of the surface density of edge sites, and of basal plane adsorption sites without and with bound O
2 molecules,
nm1 = 2⋅10
18 m
−2,
nm2 = 4⋅10
17 m
−2 and
nm3 = 4⋅10
17 m
−2, respectively. For this purpose, the theoretical dependences
fc1(
nm1),
fc2(
nm2) and
fc3(
nm3) were used for given gas pressure, temperature, and energies
Ed1,
Ed2, and
Ed3, as explained before (Equation (12)). The two remaining characteristic frequencies, for which the obtained values were
fcCI = 2.31 kHz and
fcCII = 264.27 kHz, revealed the ratio of the numbers of the edge sites and basal plane sites free of oxygen molecules,
v12 = 0.04, and also the ratio of the numbers of basal plane sites occupied and unoccupied by O
2 molecules,
v32 = 3, by using Equations (16)–(18), where we introduced
v12 =
Nm1/
Nm2 and
v32 =
Nm3/
Nm2 after the division of both the numerator and the denominator of Equations (16) and (17) by
Nm2. Since the surface area covered by oxygen-free basal plane sites was
A2 =
Anm1nm3/(
nm1nm3 +
v12nm2nm3 +
v32nm1nm2) (the expression was derived from
A =
A1 +
A2 +
A3 =
Nm1/
nm1 +
Nm2/
nm2 +
Nm3/
nm3), the number of such sites was
Nm2 =
nm2A2 = 9.98⋅10
12, while the number of basal plane adsorption sites occupied by oxygen molecules was
Nm3 =
v32Nm2 = 2.994⋅10
13. The obtained values show that 75% of basal plane adsorption sites were occupied by O
2 molecules. The total number of basal plane sites was
Nmb =
Nm2 +
Nm3 = 3.992⋅10
13, so the ratio of the number of edge sites to the number of basal plane sites is
v =
Nm1/
Nmb = 0.01.
Our results show that noise data can be used for the characterization of a heterogeneous adsorption surface of LPE graphene in terms of the parameters that determine the sensing properties of the material. Namely, material properties affect noise only in the sense that there are several different adsorption sites on a heterogeneous sensor surface, where AD processes occur, randomly by nature, as a result of which the number of adsorbed particles on each type of site fluctuates randomly, producing fluctuations in sensing layer conductivity, i.e., sensor output signal fluctuations (sensor noise). The parameters of the AD process are characteristic to a given material and gas (adsorption/desorption energy, density, and number of adsorption sites of different types) and can be determined by noise spectrum analysis. The characterization of the adsorption surface using the proposed method was performed in the atmosphere of a single gas at a single given concentration, in the steady state. The method is based on a theoretical model that takes into account the adsorption of a single gas on a heterogeneous surface. If applied separately to two gases, the adsorption properties of the surface can be characterized for each gas individually. The characterization of the simultaneous adsorption of multiple gases from a mixture, which would allow the selectivity of the sensor to be assessed, requires an extension of the presented theoretical model, which will be the subject of future research. Apart from the determination of the above-mentioned parameters from the characteristic frequencies, the analysis that includes the low frequency noise magnitude combined with the sensor temporal response also enables the experimental determination of other parameters, e.g., the binding energies for CO2 adsorption on LPE graphene, which are also lacking in the literature. Measurements at several different temperatures can also provide a greater diversity and number of parameters that can be obtained from the noise spectrum. For example, it would be possible to determine how much the adsorption of a single gas particle on each site type contributes to the sensor response. In cases where more than three types of adsorption sites exist, the mathematical transformation of the obtained analytical expressions for noise PSD can be used for the modeling of additional characteristic features that are visible in the noise spectrum, thus yielding more information about adsorption on a given sensing surface. Such approaches will be investigated in our future research.


